
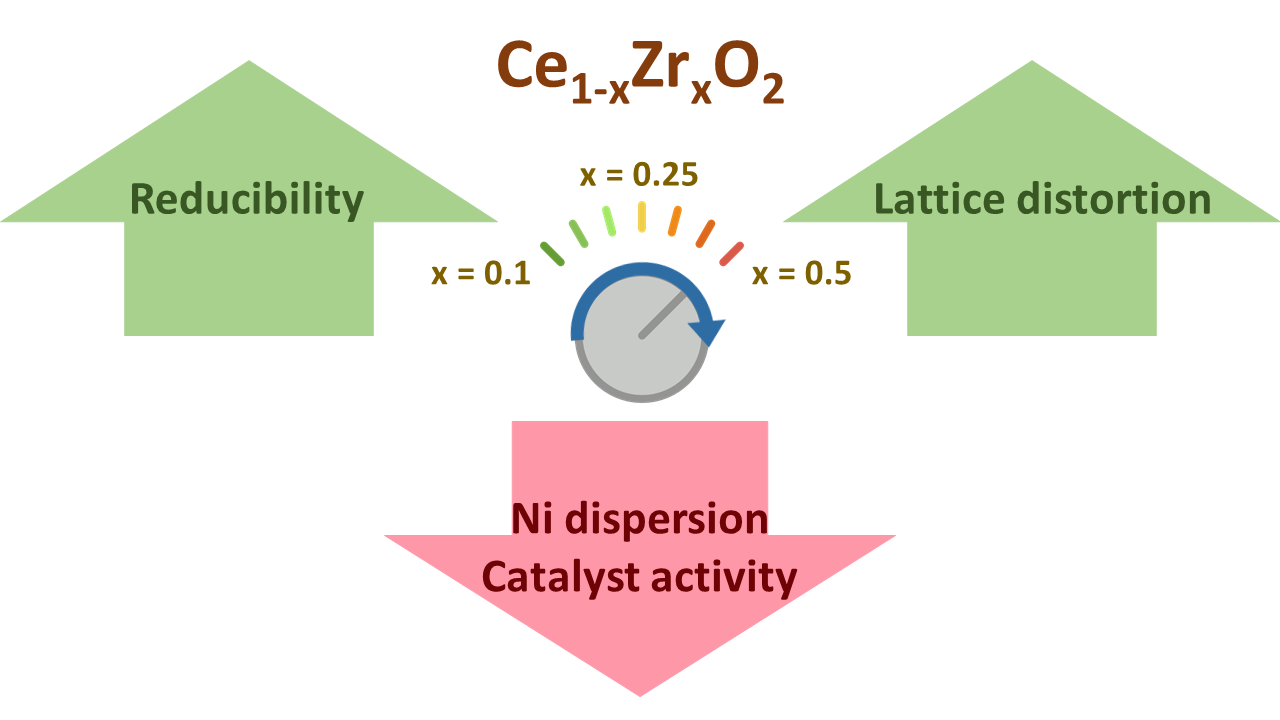
Effect of Ce/Zr Composition on Structure and Properties of Ce1−xZrxO2 Oxides and Related Ni/Ce1−xZrxO2 Catalysts for CO2 Methanation

 ,
,  , , , ,
Abstract
:
1. Introduction
2. Experimental Section
2.1. Computational Methods and Details
2.2. Samples Preparation
2.2.1. Synthesis of Ce1−xZrxO2 Mixed Oxides
2.2.2. Synthesis of Ni/Ce1−xZrxO2 Catalysts
2.3. Samples Characterization
2.3.1. XRF Analysis
2.3.2. BET Surface Area Analysis
2.3.3. XRD Analysis
2.3.4. CO Pulse Chemisorption
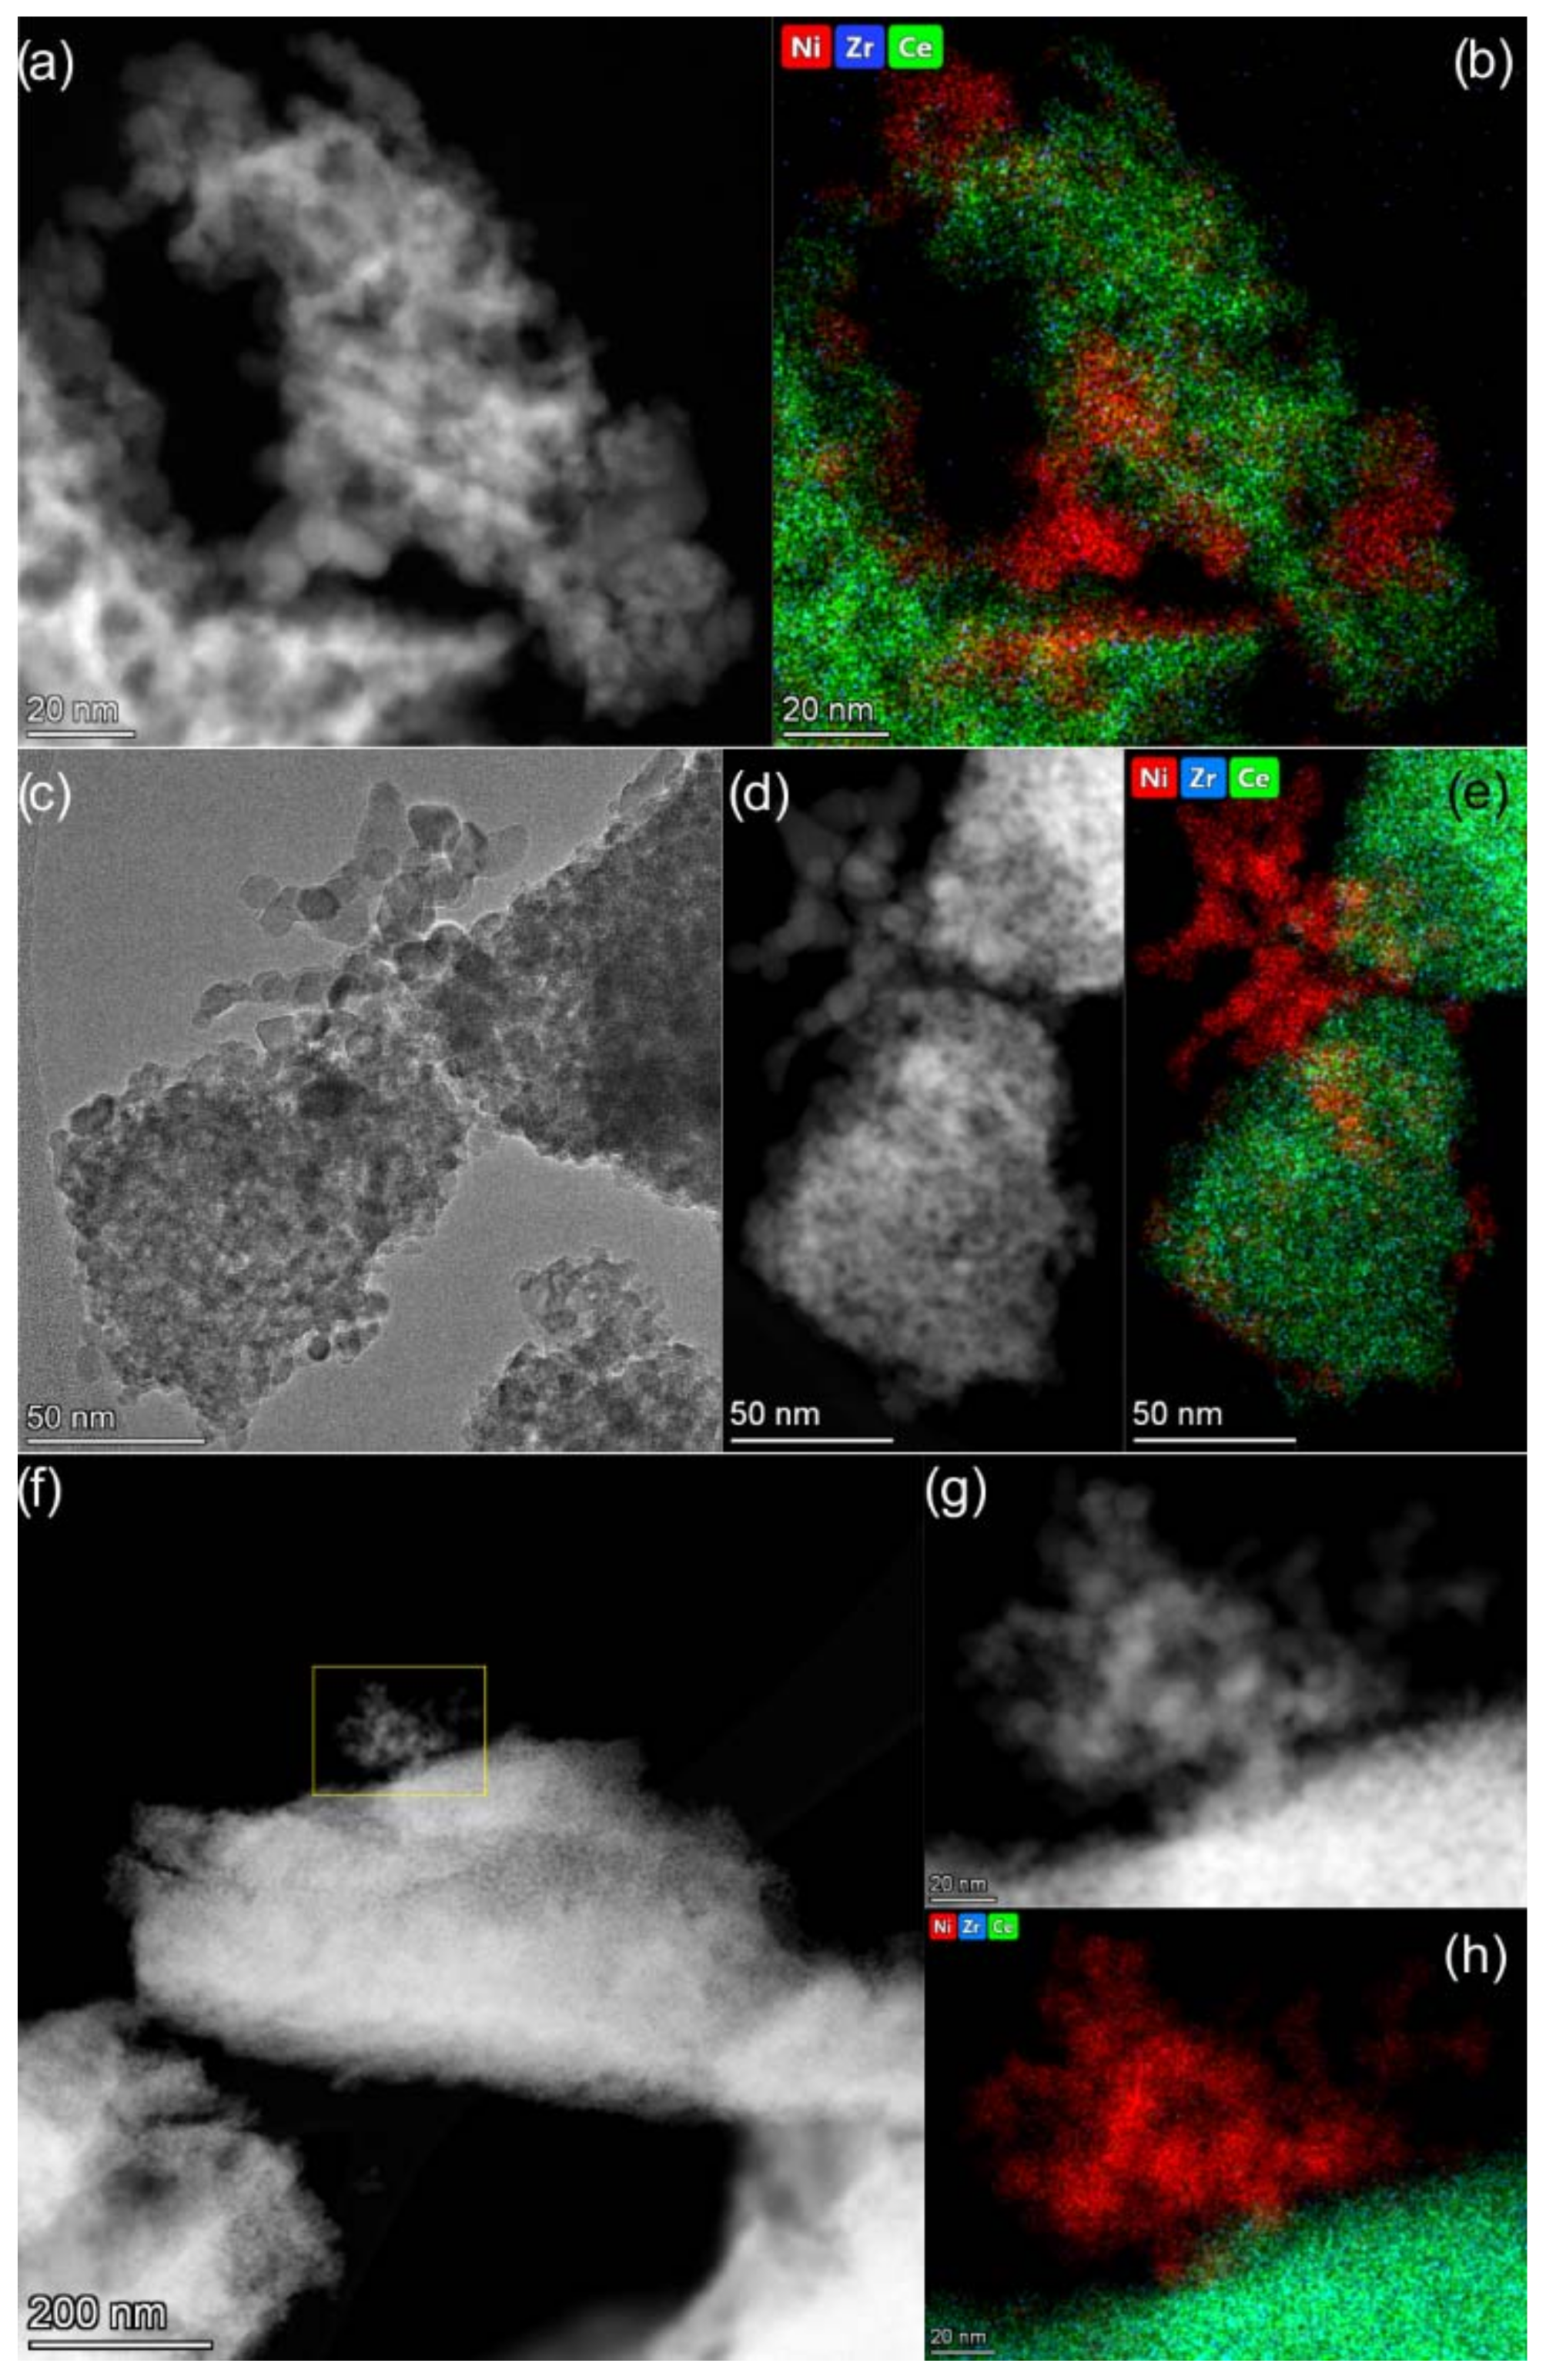
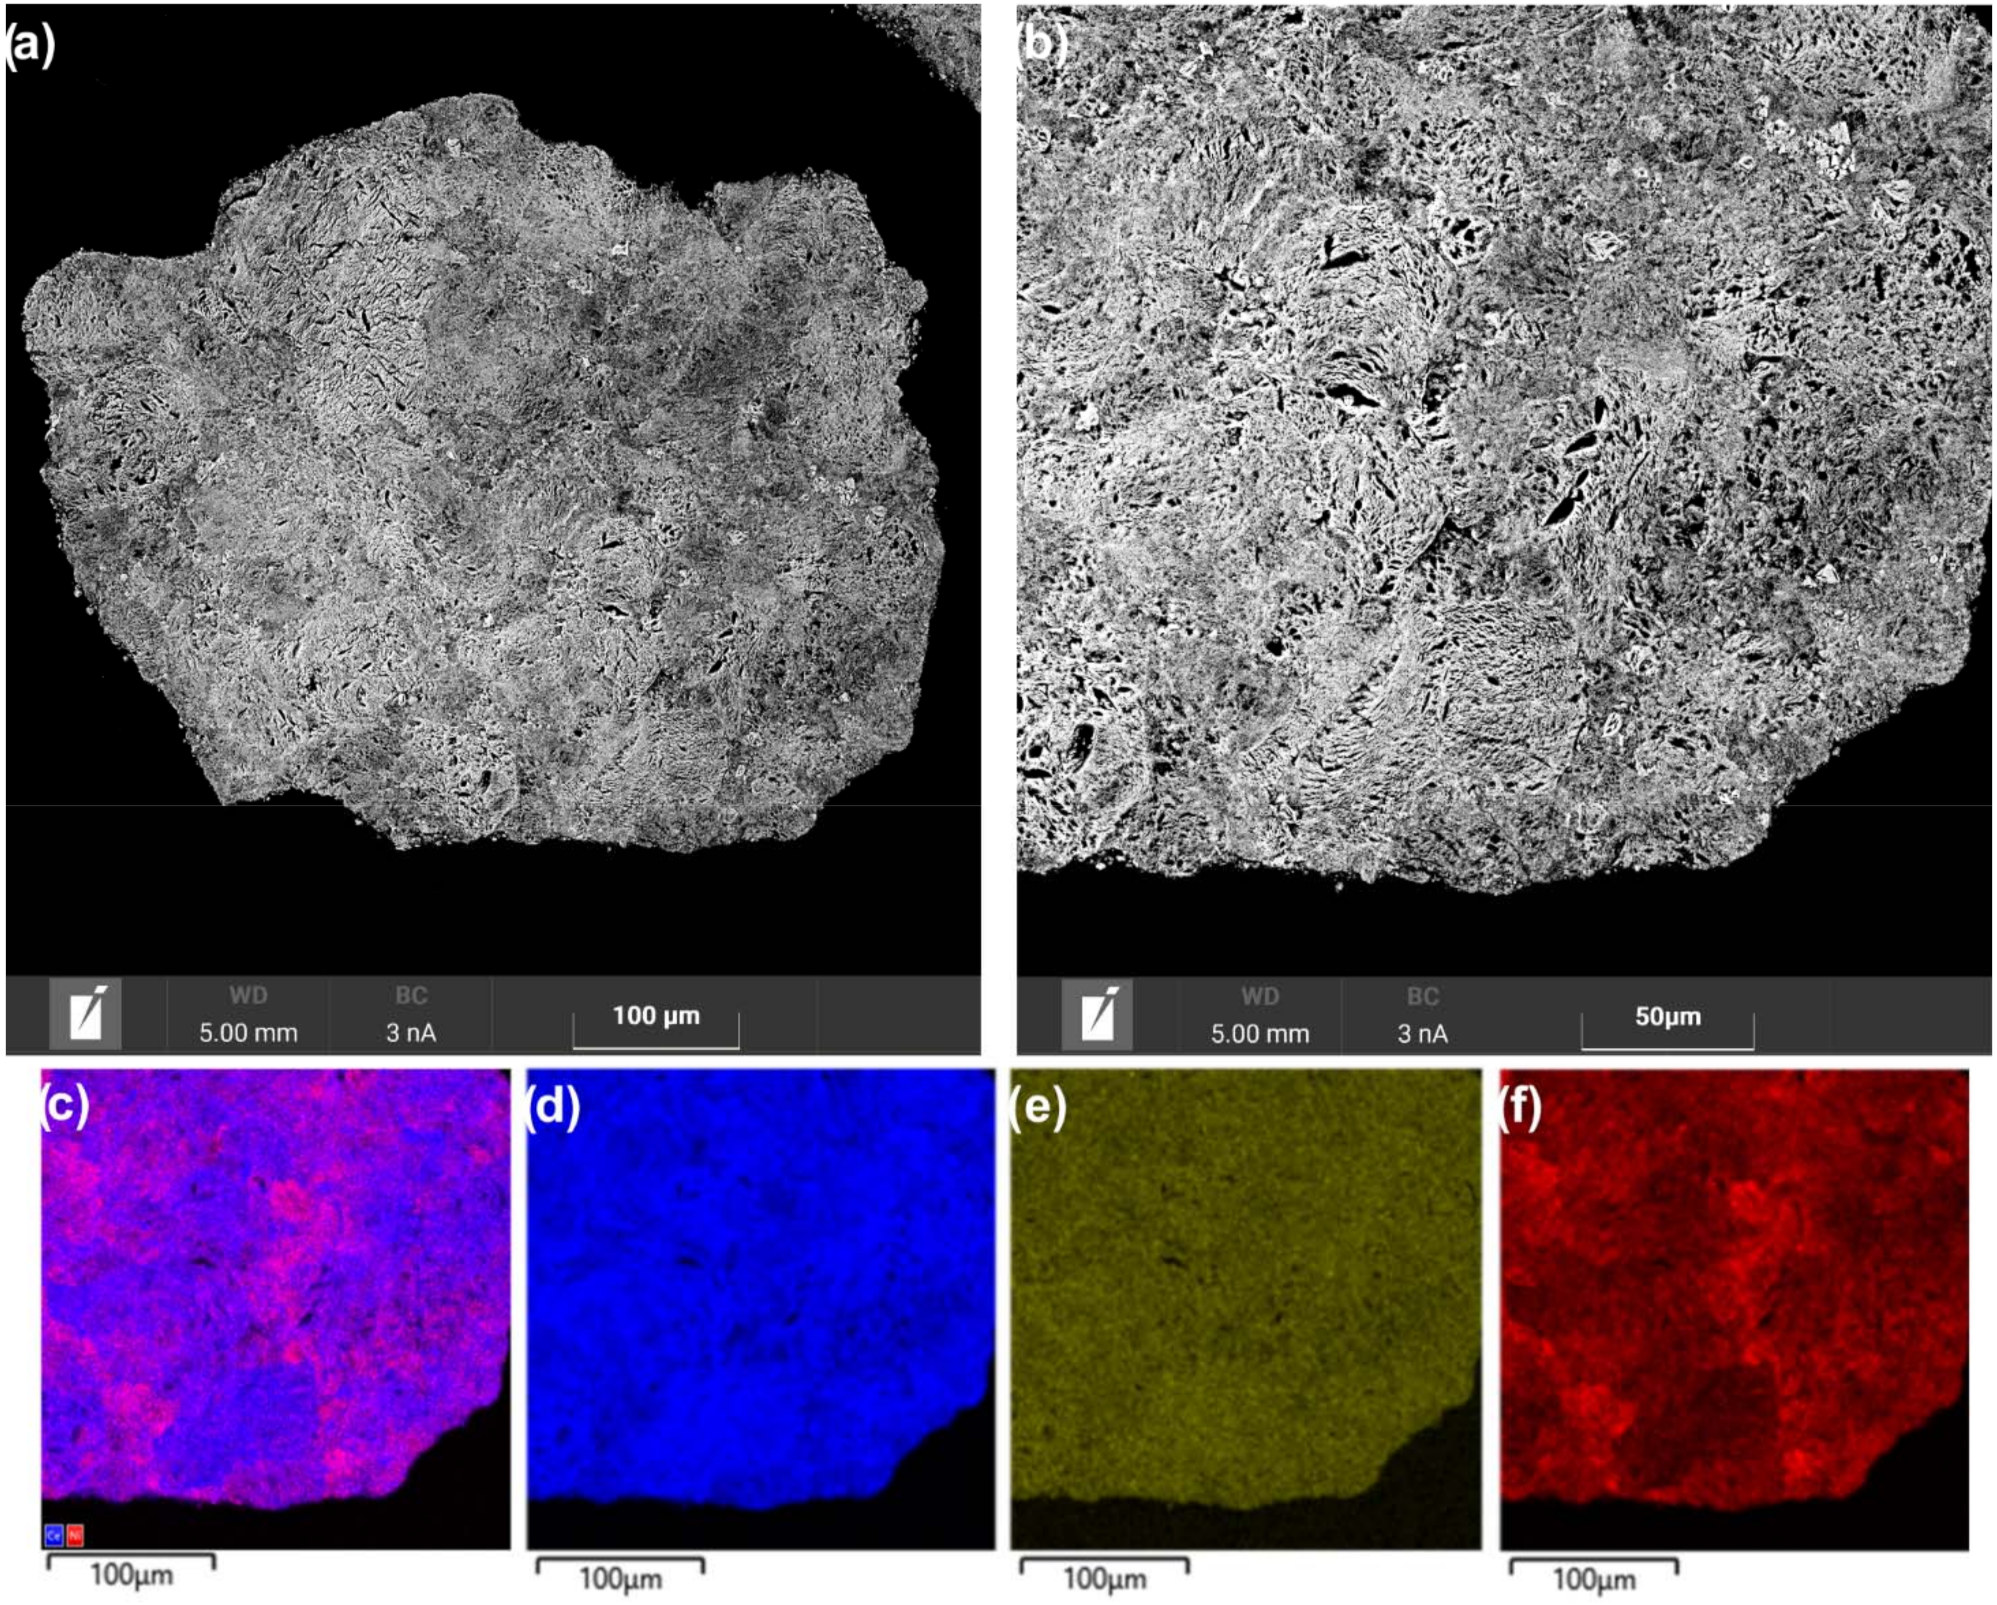
2.3.5. TEM-EDX
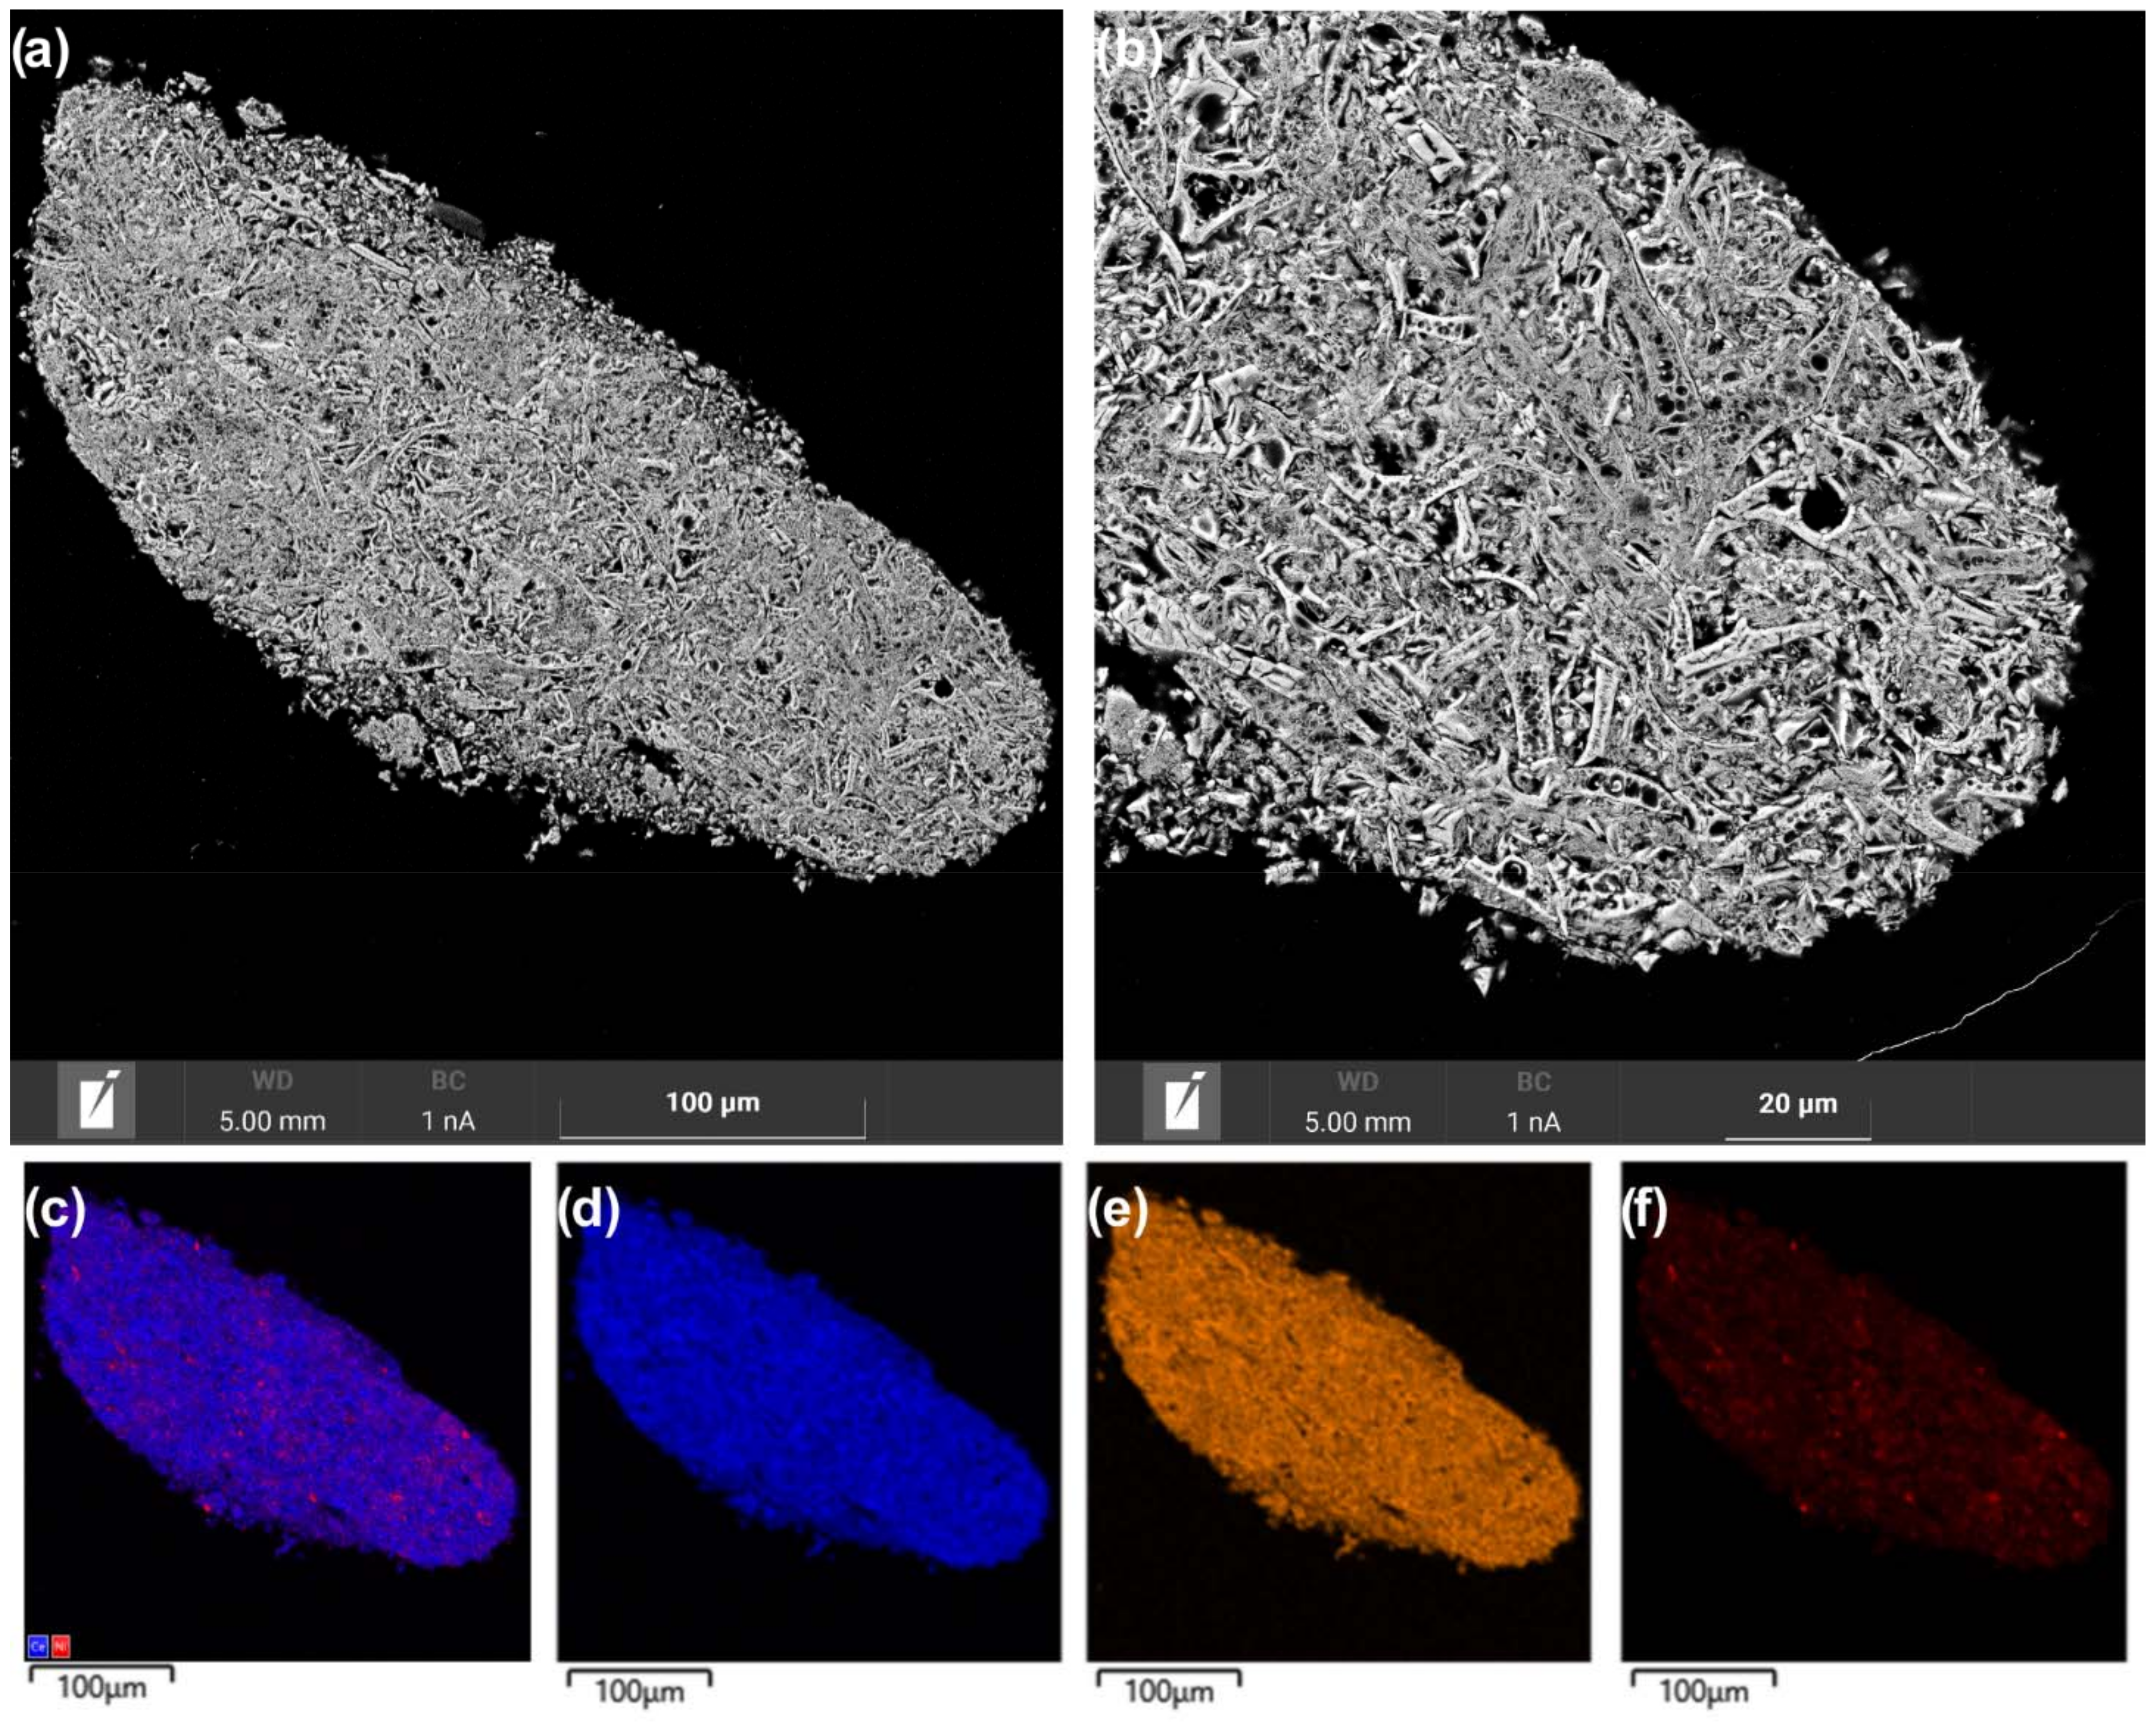
2.3.6. SEM-EDX
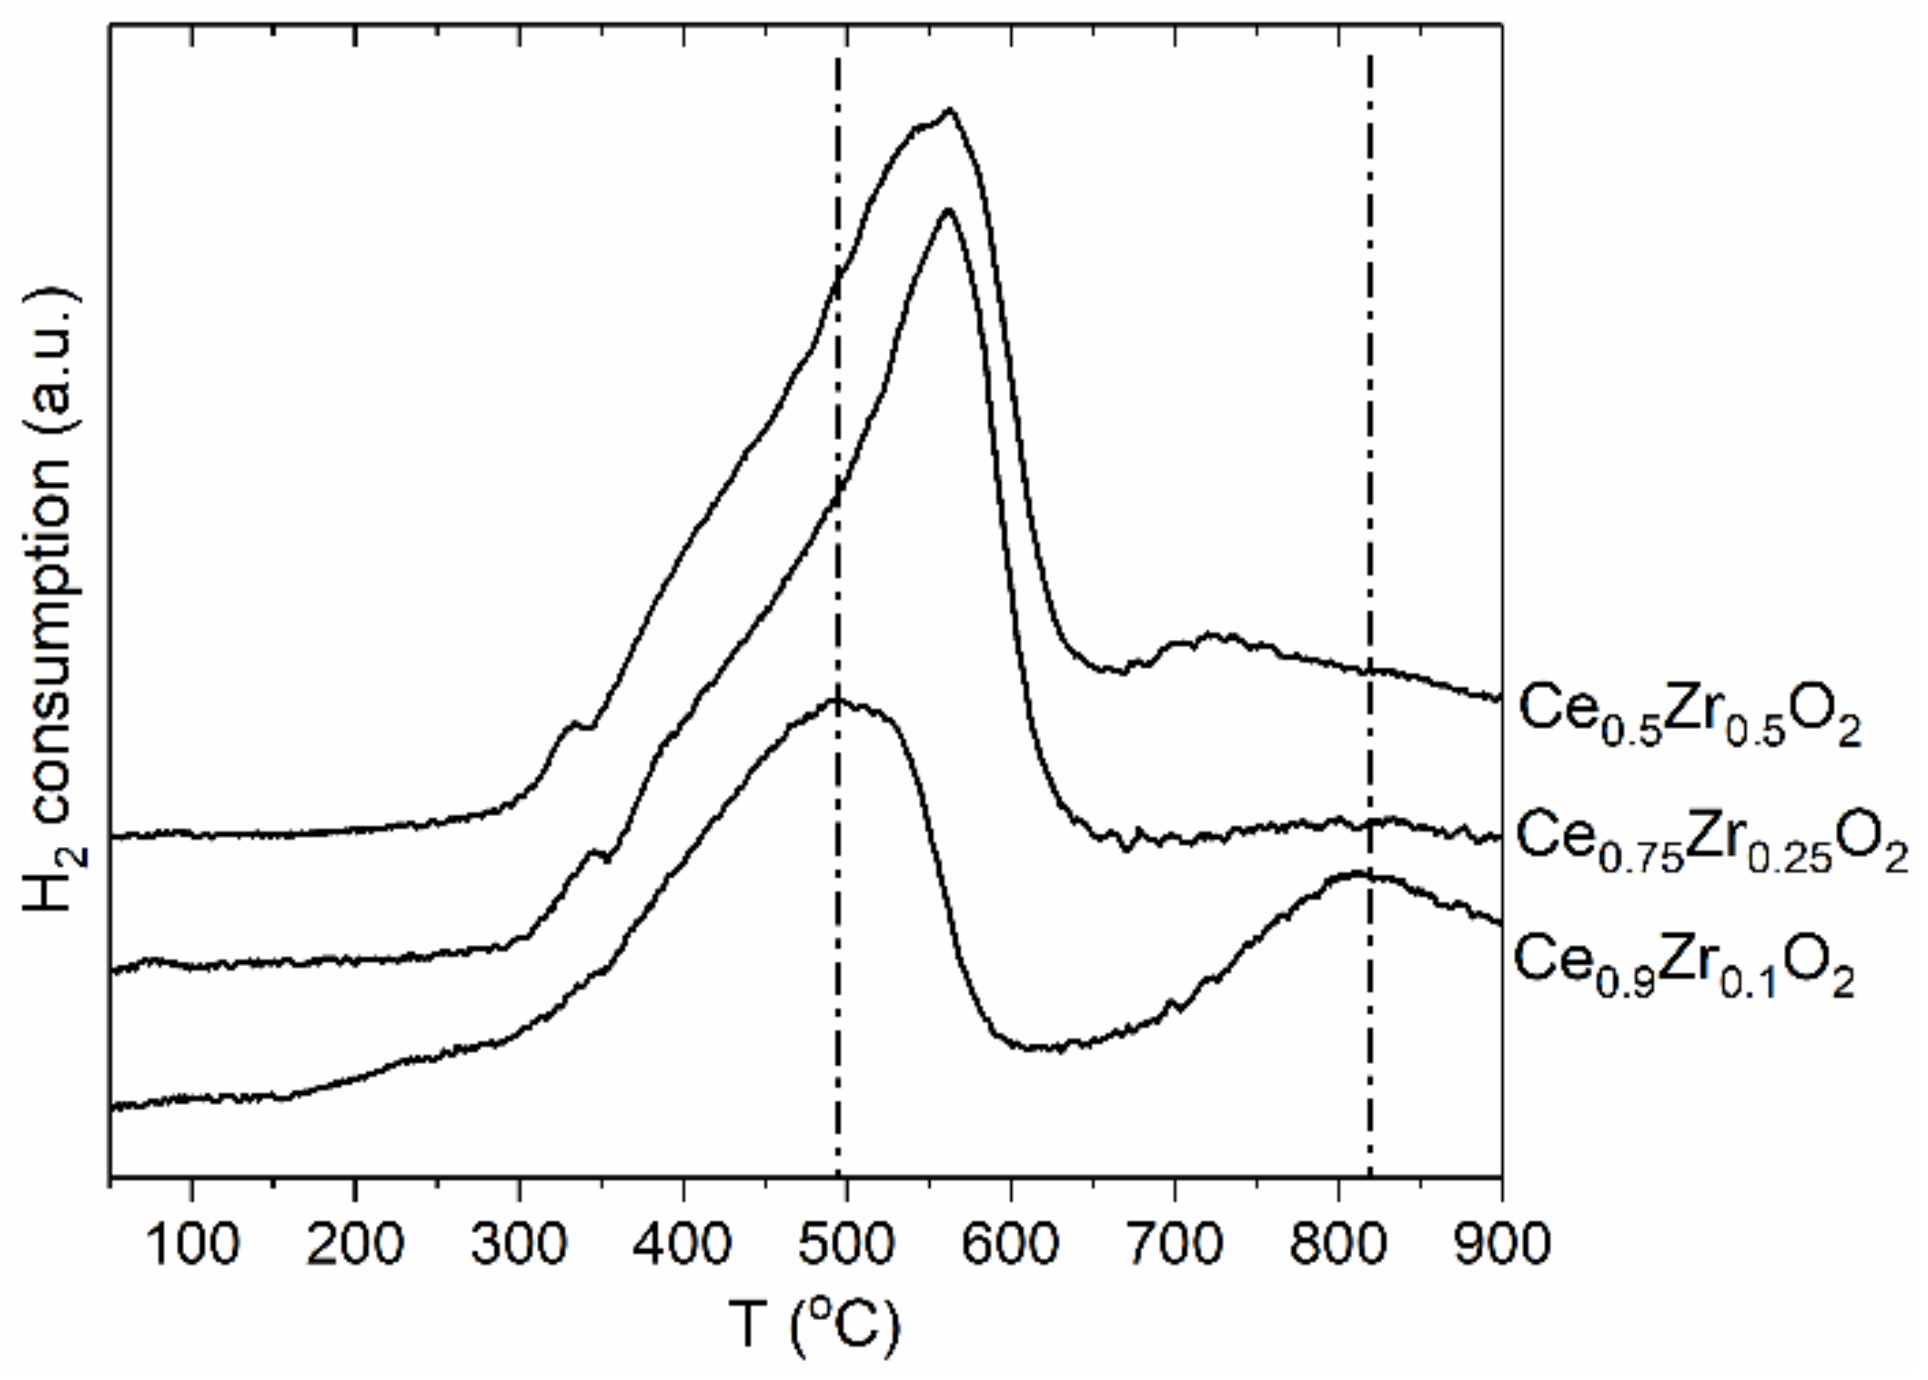
2.3.7. H2-TPR
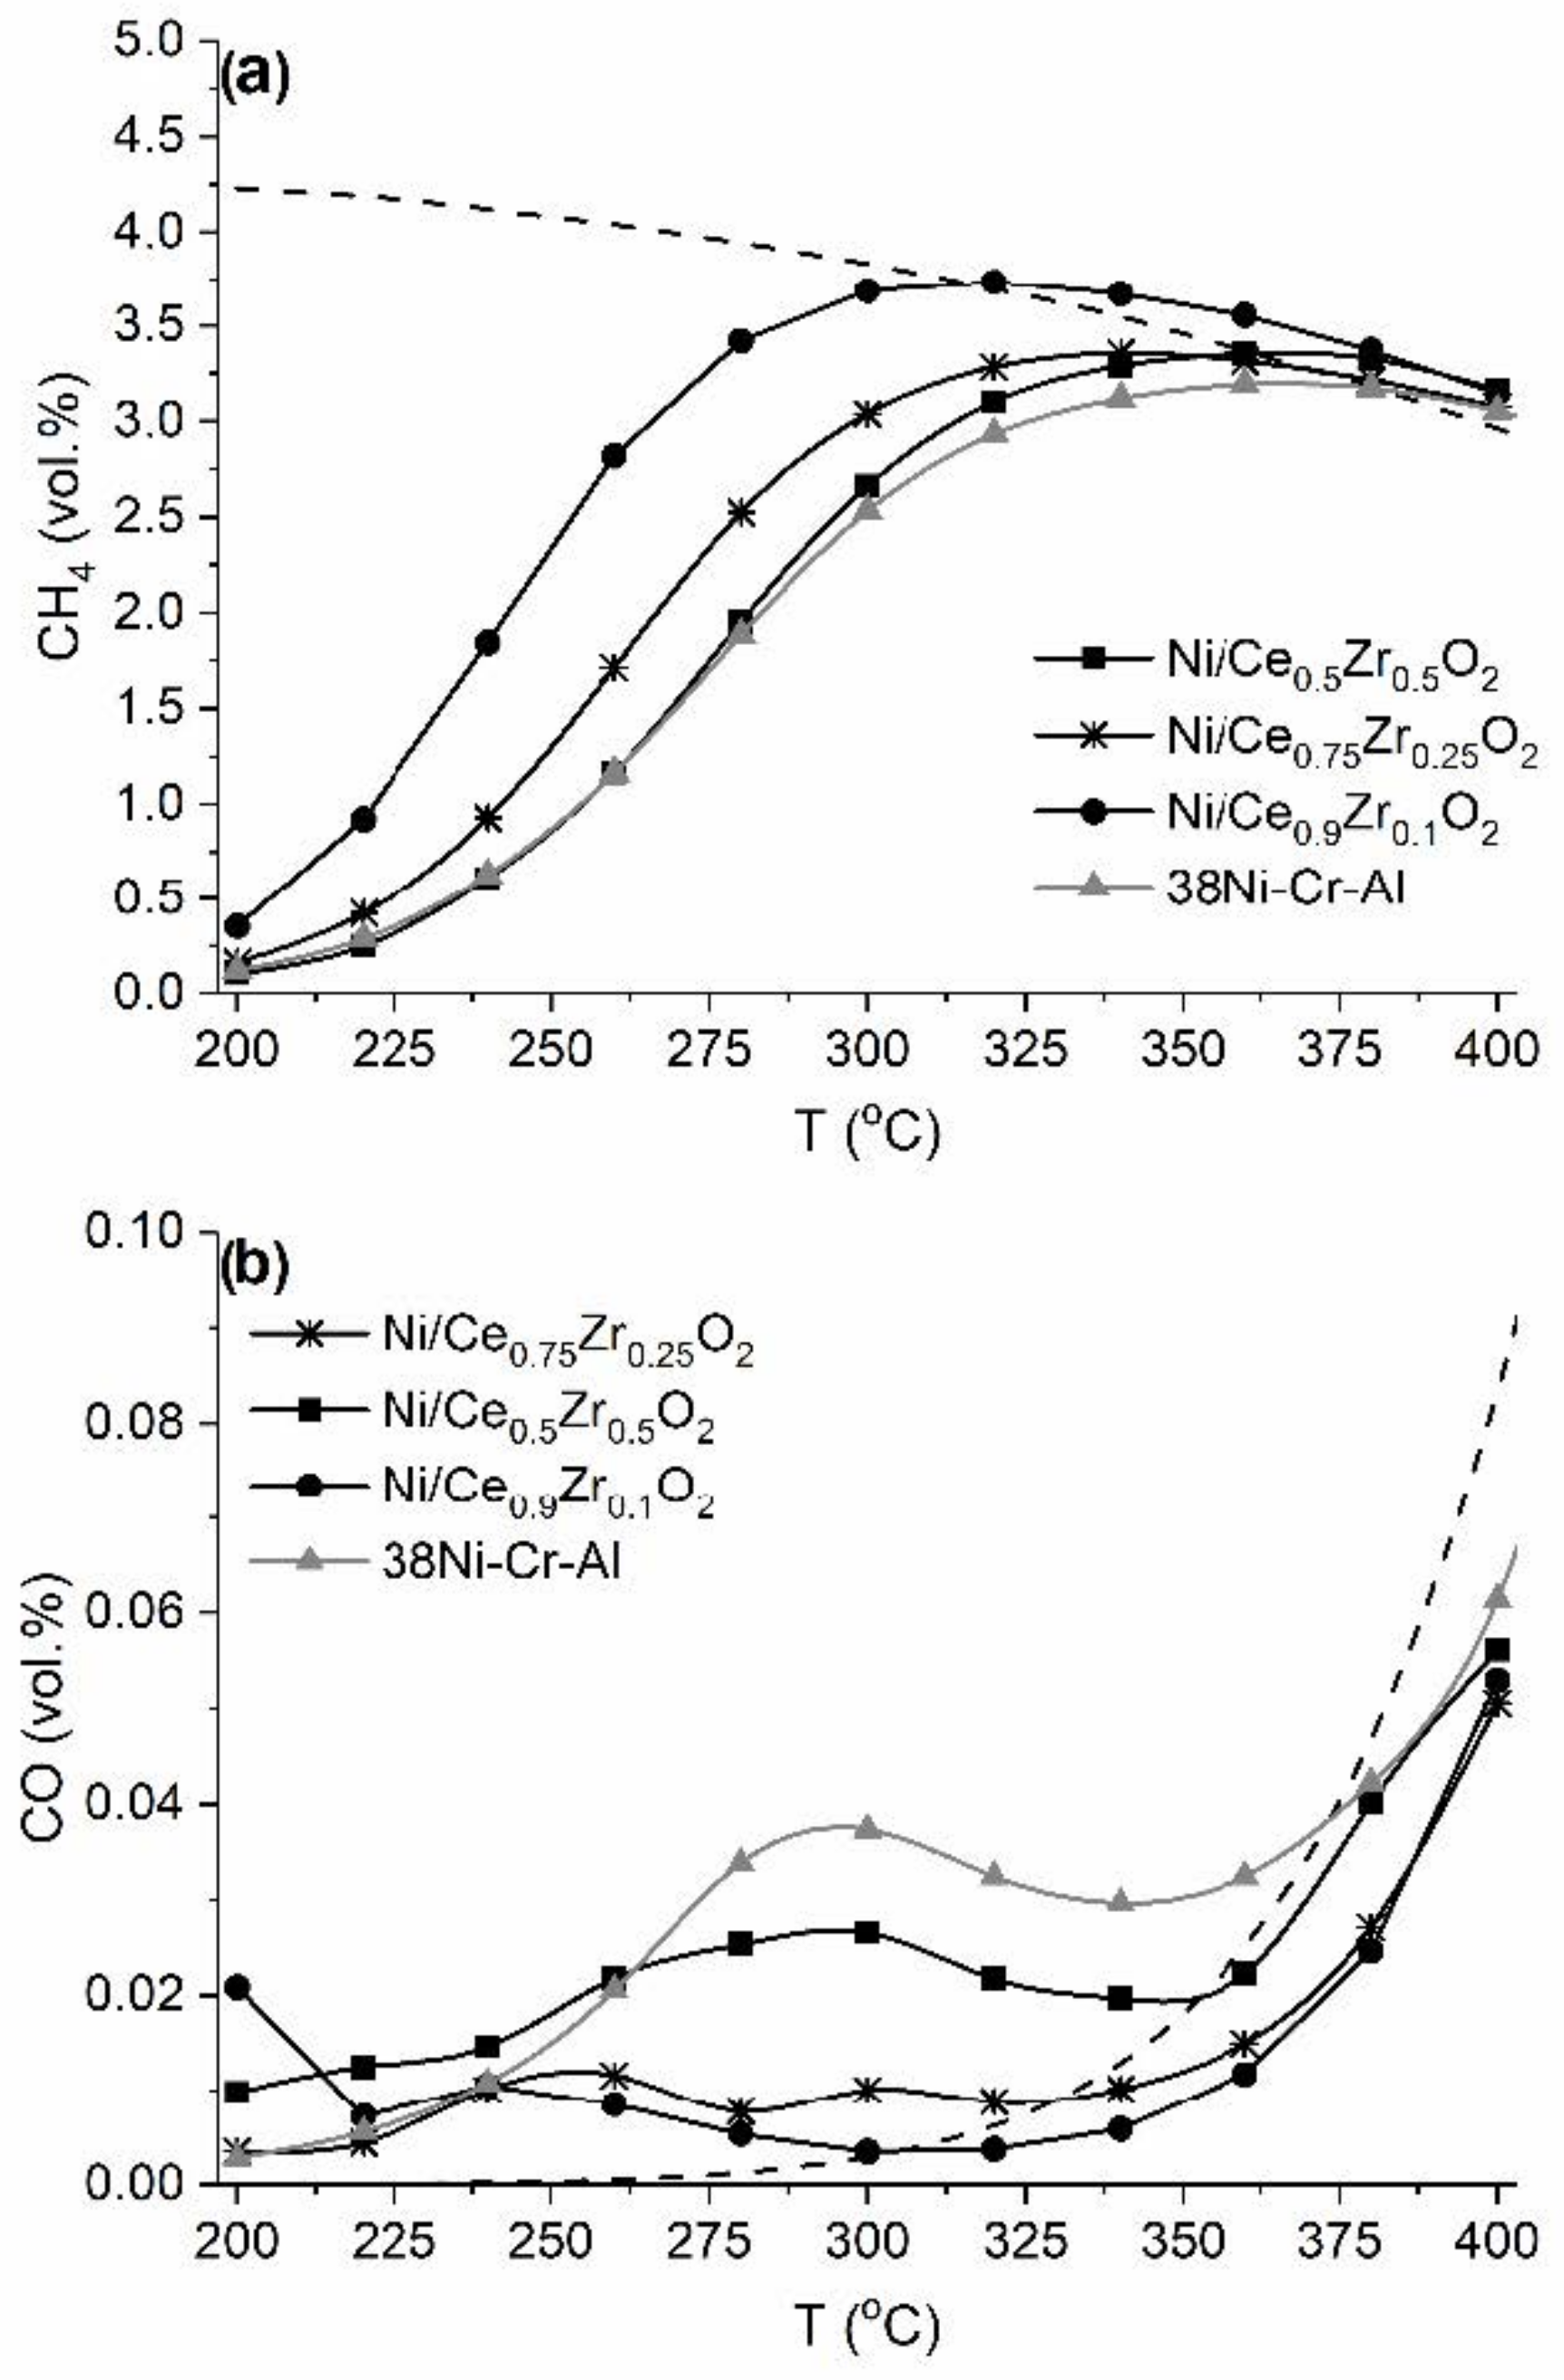
2.4. Tests of CO2 Methanation Activity
3. Results and Discussion
3.1. Calculation Results
3.2. Experimental Results
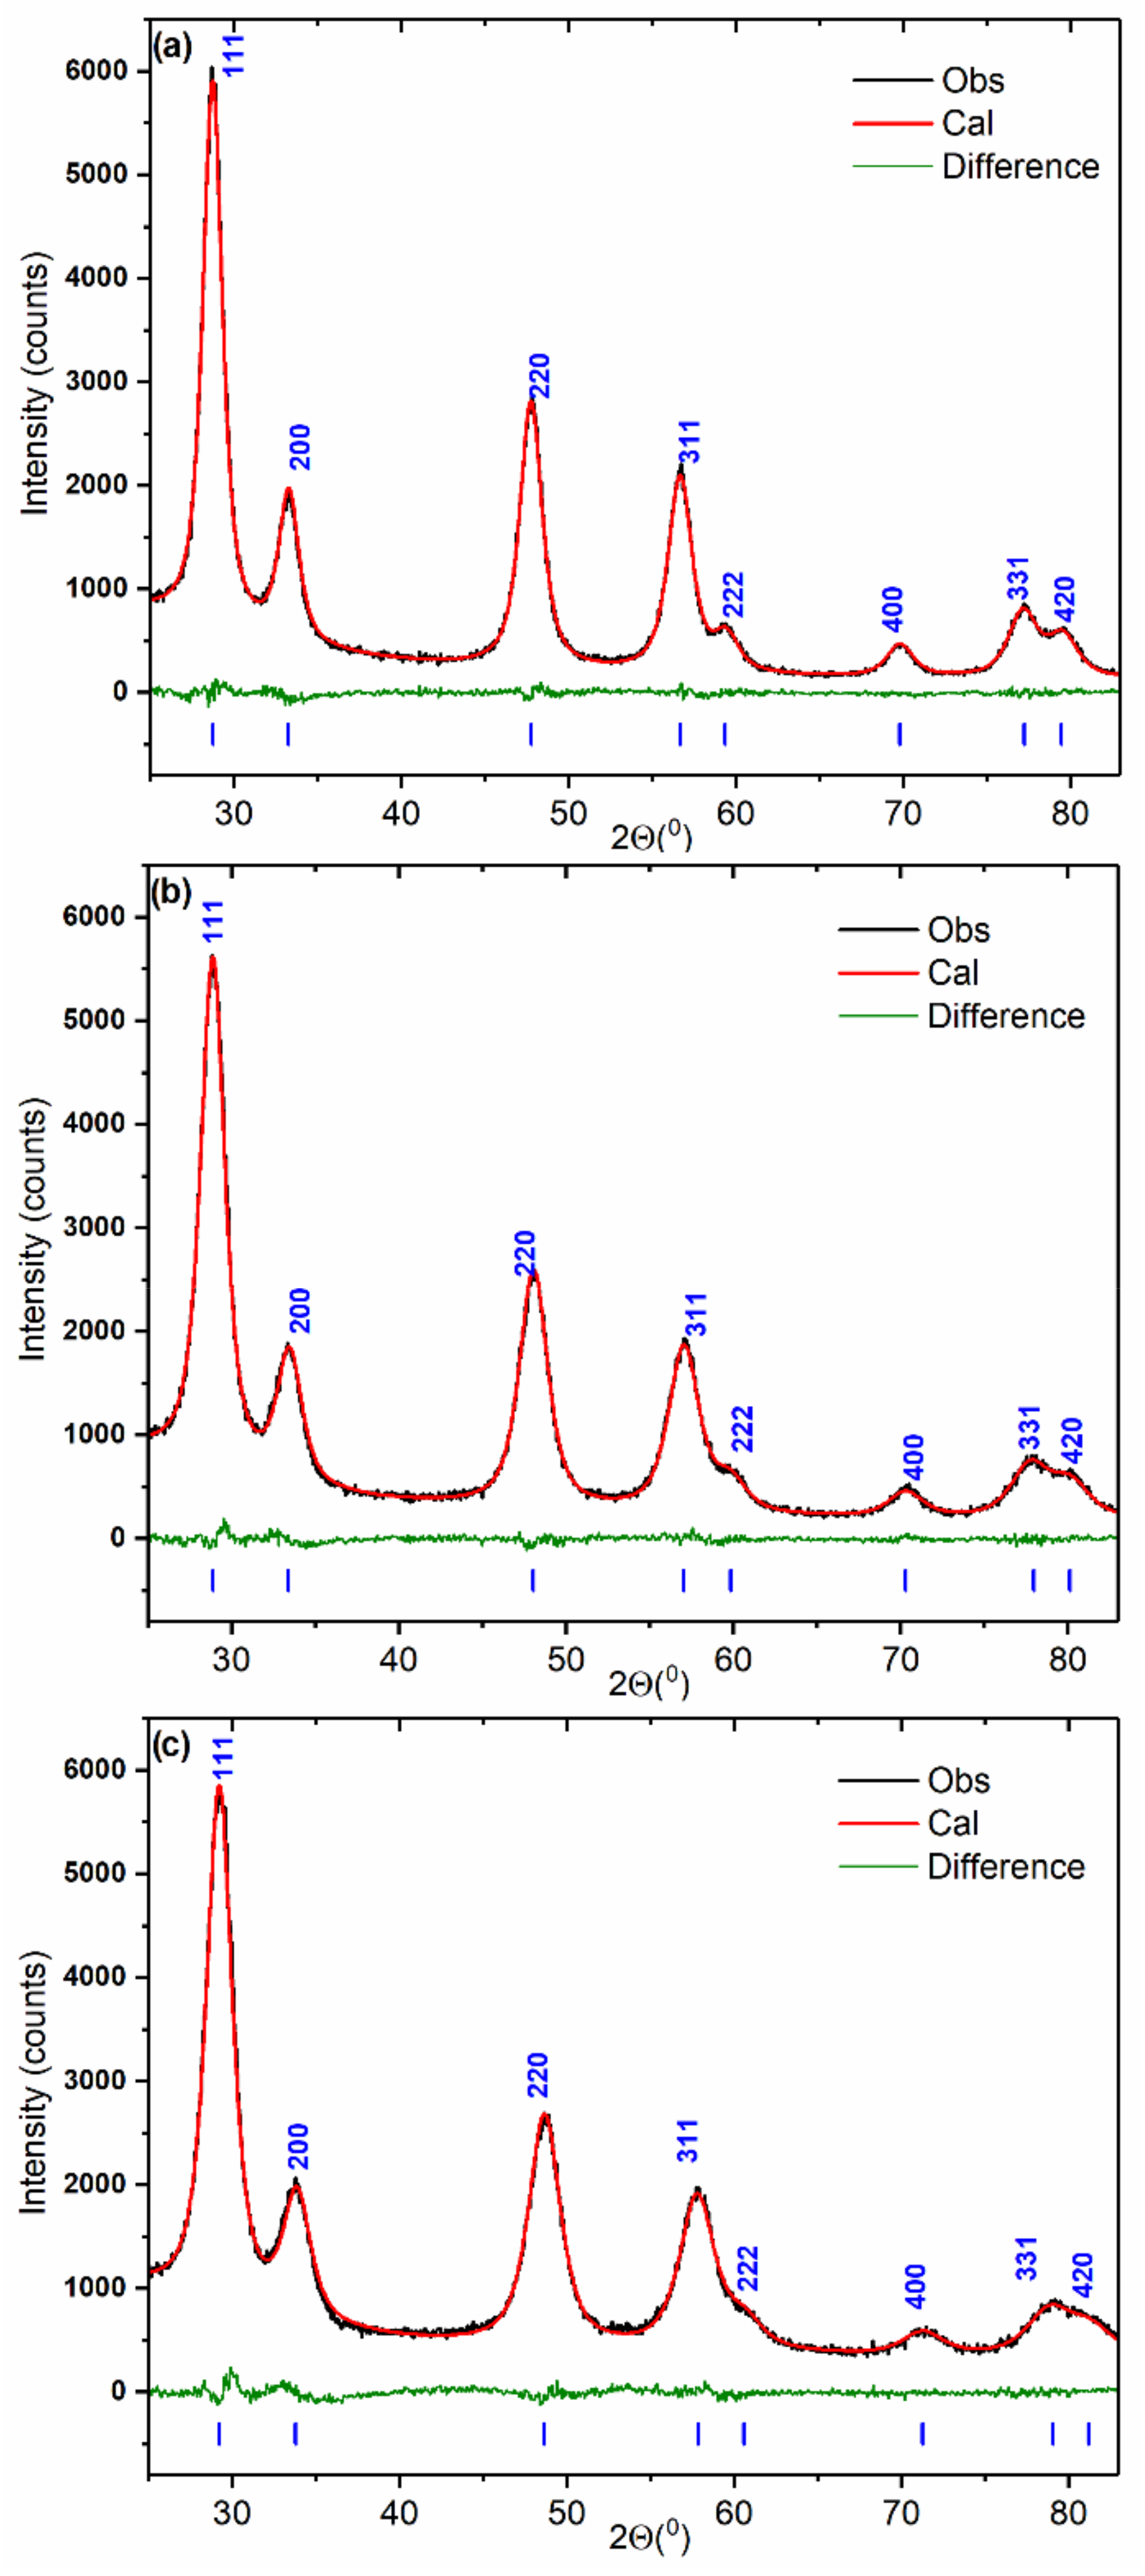
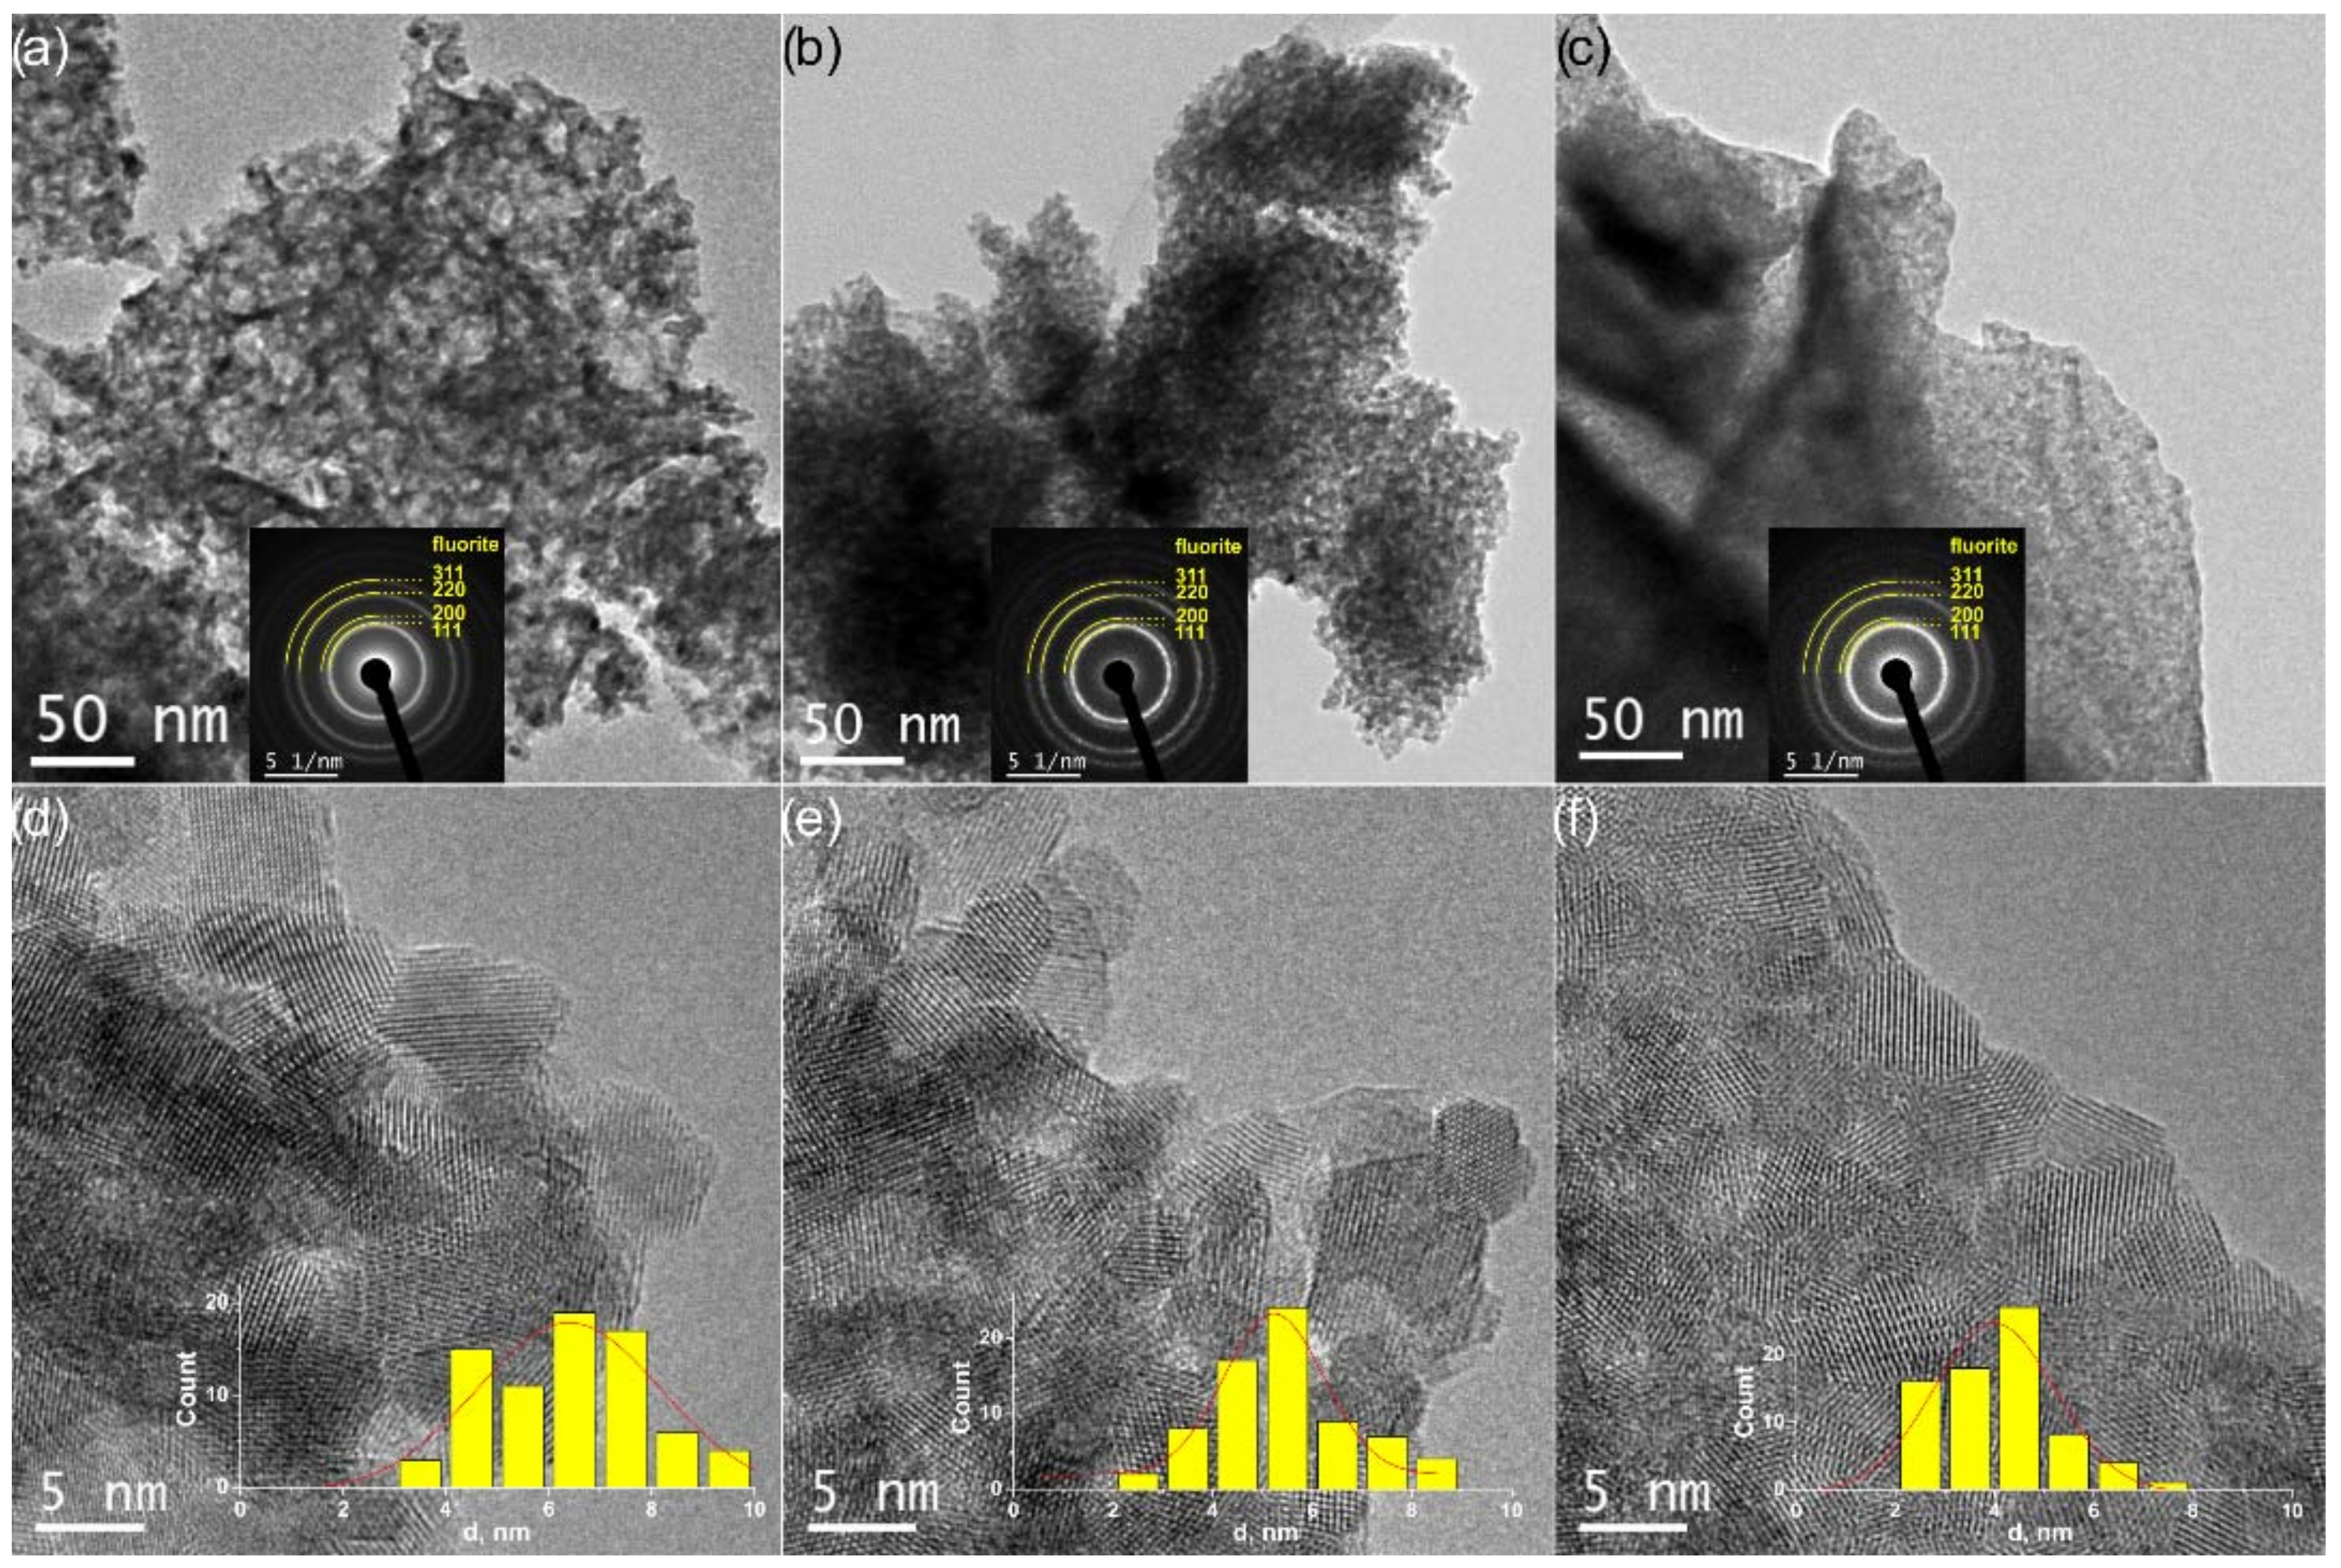
3.2.1. Ce1−xZrxO2 Support Materials
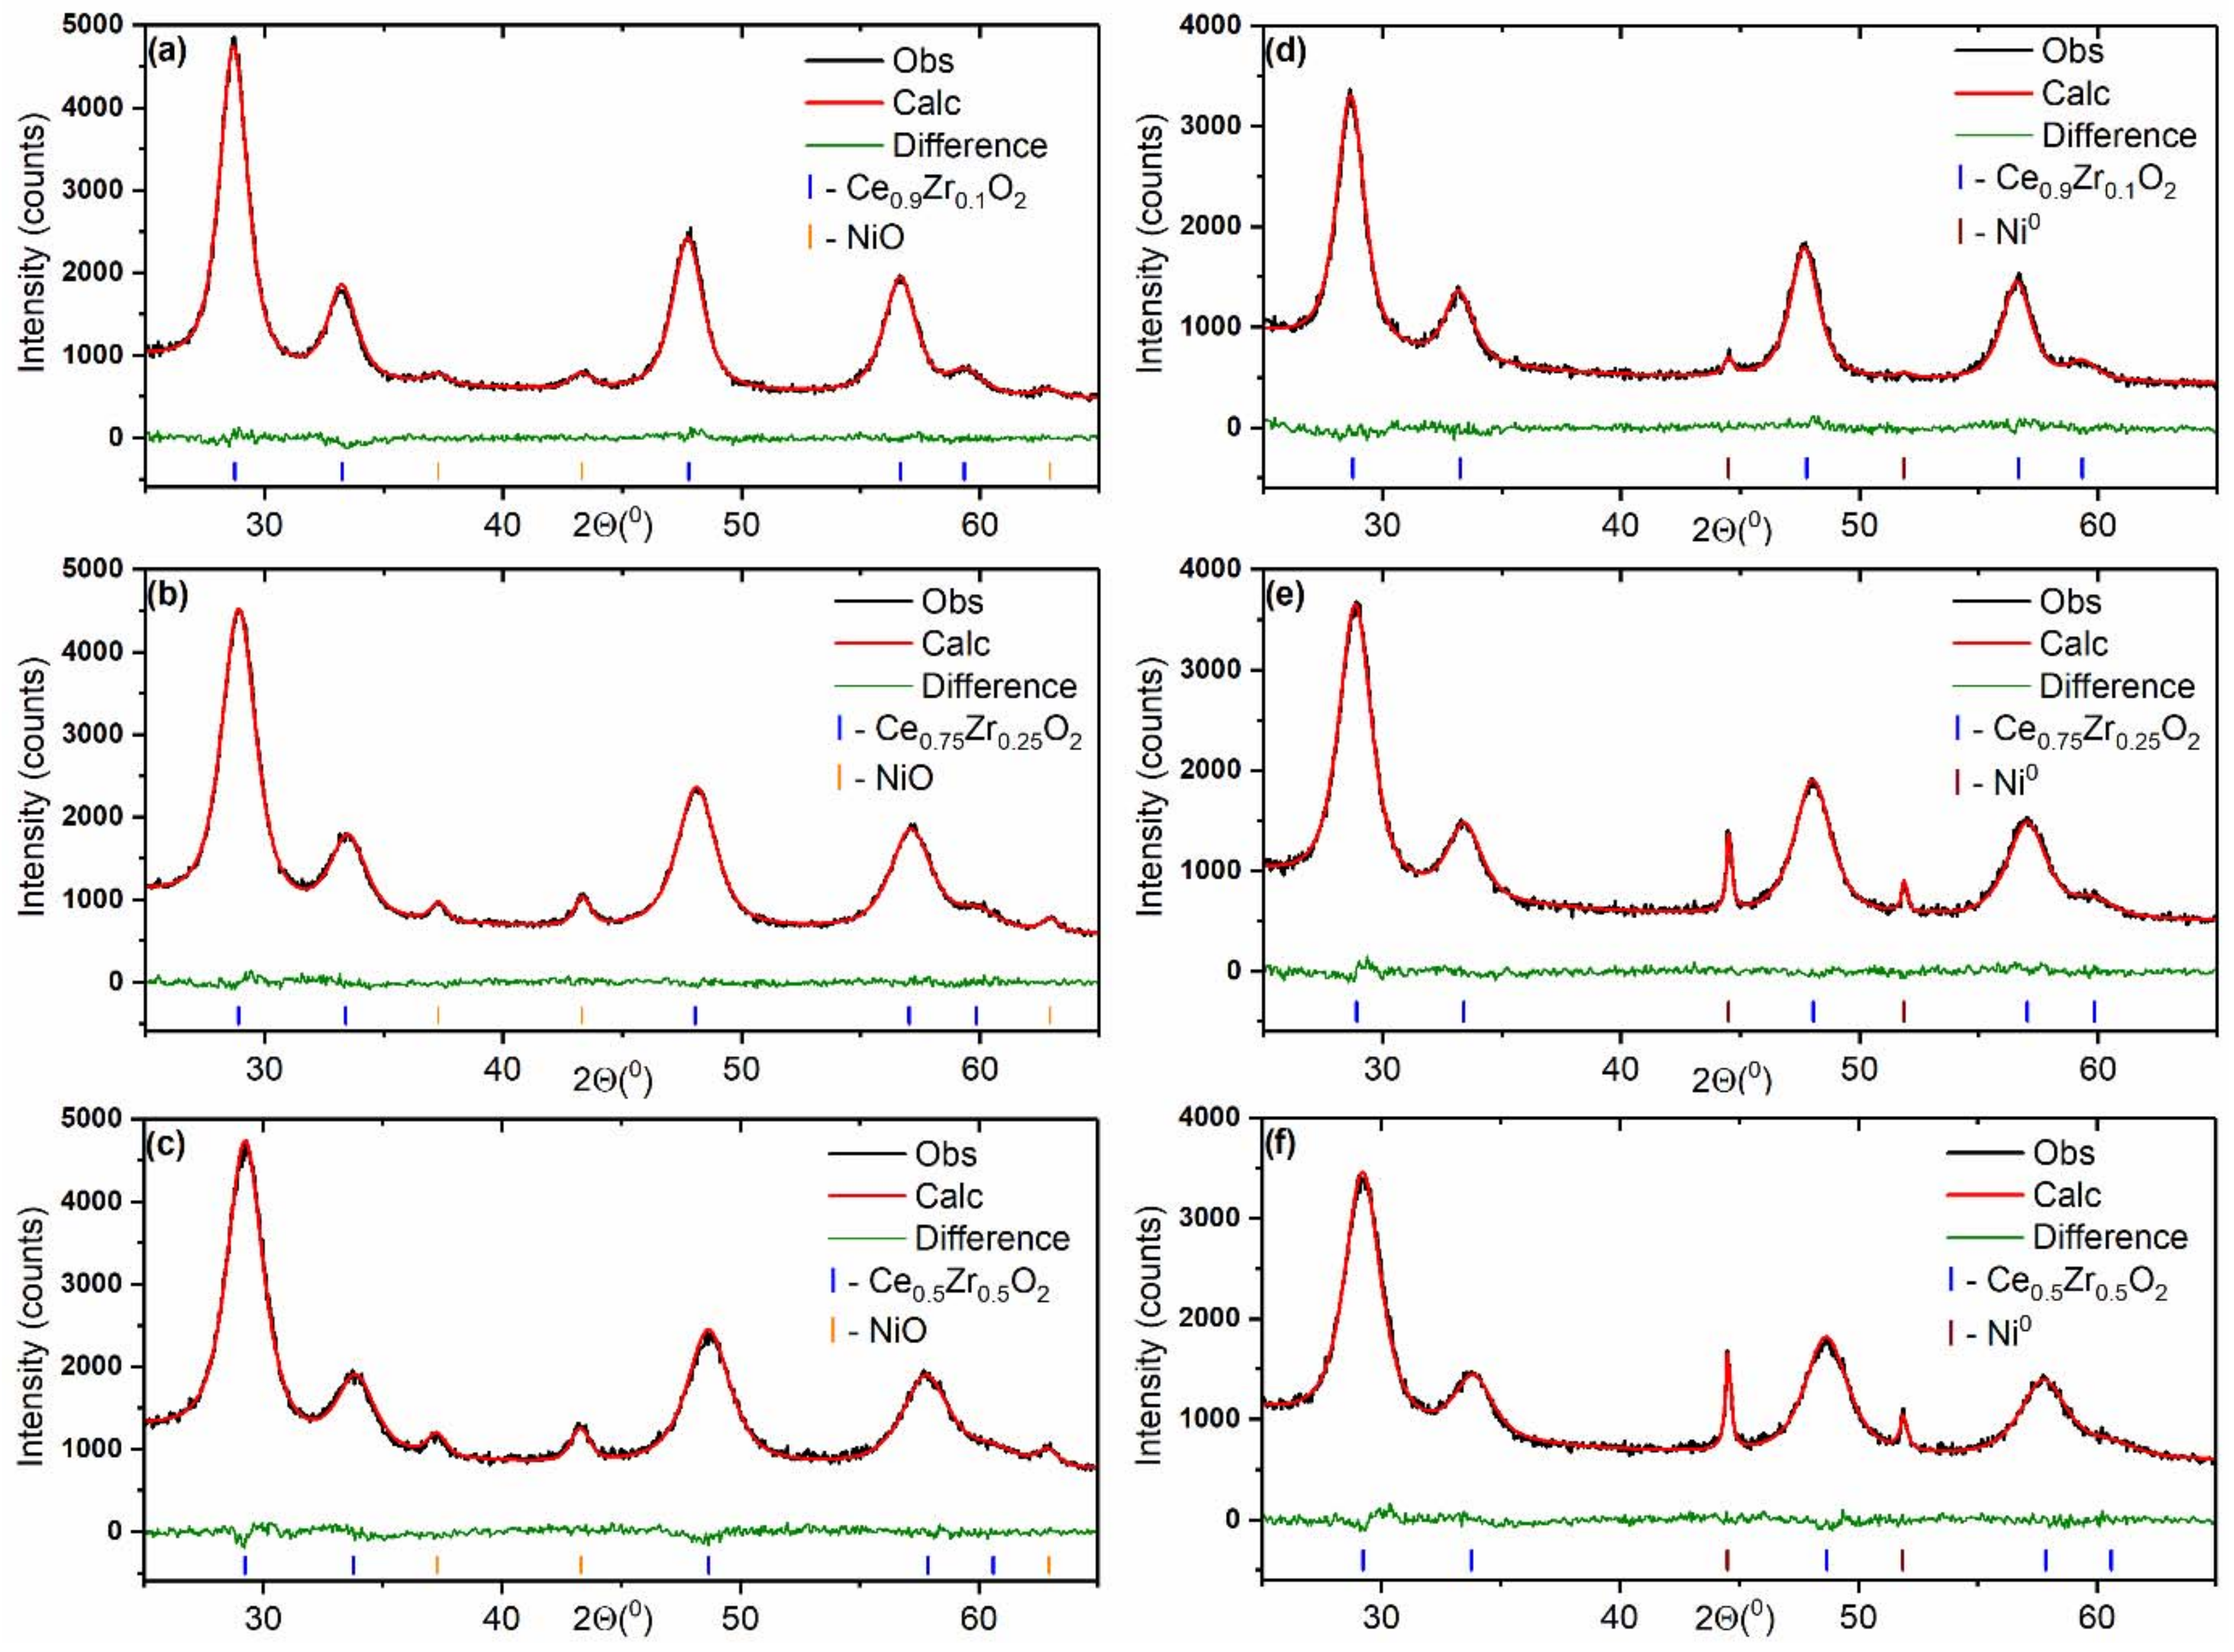
3.2.2. Ni/Ce1−xZrxO2 Catalysts
4. Conclusions
Supplementary Materials
Author Contributions
Funding
Data Availability Statement
Acknowledgments
Conflicts of Interest
References
- Zhao, A.; Ying, W.; Zhang, H.; Hongfang, M.; Fang, D. Ni/Al2O3 catalysts for syngas methanation: Effect of Mn promoter. J. Nat. Gas Chem. 2012, 21, 170–177. [Google Scholar] [CrossRef]
- Rönsch, S.; Schneider, J.; Matthischke, S.; Schlüter, M.; Götz, M.; Lefebvre, J.; Prabhakaran, P.; Bajohr, S. Review on methanation—From fundamentals to current projects. Fuel 2016, 166, 276–296. [Google Scholar] [CrossRef]
- Vannice, M.A. The Catalytic Synthesis of Hydrocarbons from Carbon Monoxide and Hydrogen. Catal. Rev. 1976, 14, 153–191. [Google Scholar] [CrossRef]
- Tsiotsias, A.I.; Charisiou, N.D.; Yentekakis, I.V.; Goula, M.A. Bimetallic Ni-Based Catalysts for CO2 Methanation: A Review. Nanomaterials 2020, 11, 28. [Google Scholar] [CrossRef] [PubMed]
- Mills, G.A.; Steffgen, F.W. Catalytic Methanation. Catal. Rev. 1974, 8, 159–210. [Google Scholar] [CrossRef]
- Tada, S.; Shimizu, T.; Kameyama, H.; Haneda, T.; Kikuchi, R. Ni/CeO2 catalysts with high CO2 methanation activity and high CH4 selectivity at low temperatures. Int. J. Hydrogen Energy 2012, 37, 5527–5531. [Google Scholar] [CrossRef]
- Martin, N.M.; Velin, P.; Skoglundh, M.; Bauer, M.; Carlsson, P.-A. Catalytic hydrogenation of CO2 to methane over supported Pd, Rh and Ni catalysts. Catal. Sci. Technol. 2017, 7, 1086–1094. [Google Scholar] [CrossRef]
- Le, T.A.; Kim, M.S.; Lee, S.H.; Kim, T.W.; Park, E.D. CO and CO2 methanation over supported Ni catalysts. Catal. Today 2017, 293–294, 89–96. [Google Scholar] [CrossRef]
- Nematollahi, B.; Rezaei, M.; Lay, E.N. Preparation of highly active and stable NiO–CeO2 nanocatalysts for CO selective methanation. Int. J. Hydrogen Energy 2015, 40, 8539–8547. [Google Scholar] [CrossRef]
- Zhou, G.; Liu, H.; Cui, K.; Jia, A.; Hu, G.; Jiao, Z.; Liu, Y.; Zhang, X. Role of surface Ni and Ce species of Ni/CeO2 catalyst in CO2 methanation. Appl. Surf. Sci. 2016, 383, 248–252. [Google Scholar] [CrossRef]
- Konishcheva, M.V.; Potemkin, D.I.; Snytnikov, P.V.; Zyryanova, M.M.; Pakharukova, V.P.; Simonov, P.A.; Sobyanin, V.A. Selective CO methanation in H2-rich stream over Ni–, Co– and Fe/CeO2: Effect of metal and precursor nature. Int. J. Hydrogen Energy 2015, 40, 14058–14063. [Google Scholar] [CrossRef]
- Pan, Q.; Peng, J.; Sun, T.; Gao, D.; Wang, S.; Wang, S. CO2 methanation on Ni/Ce0.5Zr0.5O2 catalysts for the production of synthetic natural gas. Fuel Process. Technol. 2014, 123, 166–171. [Google Scholar] [CrossRef]
- Nematollahi, B.; Rezaei, M.; Lay, E.N. Selective methanation of carbon monoxide in hydrogen rich stream over Ni/CeO2 nanocatalysts. J. Rare Earths 2015, 33, 619–628. [Google Scholar] [CrossRef]
- Konishcheva, M.V.; Potemkin, D.I.; Badmaev, S.D.; Snytnikov, P.V.; Paukshtis, E.A.; Sobyanin, V.A.; Parmon, V.N. On the Mechanism of CO and CO2 Methanation Over Ni/CeO2 Catalysts. Top. Catal. 2016, 59, 1424–1430. [Google Scholar] [CrossRef]
- Konishcheva, M.V.; Potemkin, D.I.; Snytnikov, P.V.; Sobyanin, V.A. The influence of CO, CO2 and H2O on selective CO methanation over Ni(Cl)/CeO2 catalyst: On the way to formic acid derived CO-free hydrogen. Int. J. Hydrogen Energy 2019, 44, 9978–9986. [Google Scholar] [CrossRef]
- Bendieb Aberkane, A.; Yeste, M.P.; Djazi, F.; Cauqui, M.Á. CO Methanation over NiO-CeO2 Mixed-Oxide Catalysts Prepared by a Modified Co-Precipitation Method: Effect of the Preparation pH on the Catalytic Performance. Nanomaterials 2022, 12, 2627. [Google Scholar] [CrossRef]
- Trovarelli, A. Catalysis by Ceria and Related Materials; Hutchings, G.J., Ed.; Imperial College Press: London, UK, 2002. [Google Scholar]
- Shanmugam, V.; Neuberg, S.; Zapf, R.; Pennemann, H.; Kolb, G. Effect of Support and Chelating Ligand on the Synthesis of Ni Catalysts with High Activity and Stability for CO2 Methanation. Catalysts 2020, 10, 493. [Google Scholar] [CrossRef]
- Martin, N.M.; Hemmingsson, F.; Schaefer, A.; Ek, M.; Merte, L.R.; Hejral, U.; Gustafson, J.; Skoglundh, M.; Dippel, A.-C.; Gutowski, O.; et al. Structure–function relationship for CO2 methanation over ceria supported Rh and Ni catalysts under atmospheric pressure conditions. Catal. Sci. Technol. 2019, 9, 1644–1653. [Google Scholar] [CrossRef]
- Jin, T.; Okuhara, T.; Mains, G.J.; White, J.M. Temperature-programmed desorption of carbon monoxide and carbon dioxide from platinum/ceria: An important role for lattice oxygen in carbon monoxide oxidation. J. Phys. Chem. 1987, 91, 3310–3315. [Google Scholar] [CrossRef]
- Konishcheva, M.V.; Potemkin, D.I.; Snytnikov, P.V.; Stonkus, O.A.; Belyaev, V.D.; Sobyanin, V.A. The insights into chlorine doping effect on performance of ceria supported nickel catalysts for selective CO methanation. Appl. Catal. B Environ. 2018, 221, 413–421. [Google Scholar] [CrossRef]
- Znak, L.; Stołecki, K.; Zieliński, J. The effect of cerium, lanthanum and zirconium on nickel/alumina catalysts for the hydrogenation of carbon oxides. Catal. Today 2005, 101, 65–71. [Google Scholar] [CrossRef]
- Ocampo, F.; Louis, B.; Kiwi-Minsker, L.; Roger, A.-C. Effect of Ce/Zr composition and noble metal promotion on nickel based CexZr1−xO2 catalysts for carbon dioxide methanation. Appl. Catal. A Gen. 2011, 392, 36–44. [Google Scholar] [CrossRef]
- Iglesias, I.; Quindimil, A.; Mariño, F.; De-La-Torre, U.; González-Velasco, J.R. Zr promotion effect in CO2 methanation over ceria supported nickel catalysts. Int. J. Hydrogen Energy 2019, 44, 1710–1719. [Google Scholar] [CrossRef]
- Ashok, J.; Ang, M.L.; Kawi, S. Enhanced activity of CO2 methanation over Ni/CeO2-ZrO2 catalysts: Influence of preparation methods. Catal. Today 2017, 281, 304–311. [Google Scholar] [CrossRef]
- Pakharukova, V.P.; Potemkin, D.I.; Stonkus, O.A.; Kharchenko, N.A.; Saraev, A.A.; Gorlova, A.M. Investigation of the Structure and Interface Features of Ni/Ce1−xZrxO2 Catalysts for CO and CO2 Methanation. J. Phys. Chem. C 2021, 125, 20538–20550. [Google Scholar] [CrossRef]
- Fornasiero, P.; Dimonte, R.; Rao, G.R.; Kaspar, J.; Meriani, S.; Trovarelli, A.; Graziani, M. Rh-Loaded CeO2-ZrO2 Solid-Solutions as Highly Efficient Oxygen Exchangers: Dependence of the Reduction Behavior and the Oxygen Storage Capacity on the Structural-Properties. J. Catal. 1995, 151, 168–177. [Google Scholar] [CrossRef]
- Hori, C. Thermal stability of oxygen storage properties in a mixed CeO2-ZrO2 system. Appl. Catal. B Environ. 1998, 16, 105–117. [Google Scholar] [CrossRef]
- Murota, T.; Hasegawa, T.; Aozasa, S.; Matsui, H.; Motoyama, M. Production method of cerium oxide with high storage capacity of oxygen and its mechanism. J. Alloys Compd. 1993, 193, 298–299. [Google Scholar] [CrossRef]
- Daturi, M.; Finocchio, E.; Binet, C.; Lavalley, J.-C.; Fally, F.; Perrichon, V.; Vidal, H.; Hickey, N.; Kašpar, J. Reduction of High Surface Area CeO2–ZrO2 Mixed Oxides. J. Phys. Chem. B 2000, 104, 9186–9194. [Google Scholar] [CrossRef]
- Nie, W.; Zou, X.; Chen, C.; Wang, X.; Ding, W.; Lu, X. Methanation of Carbon Dioxide over Ni–Ce–Zr Oxides Prepared by One-Pot Hydrolysis of Metal Nitrates with Ammonium Carbonate. Catalysts 2017, 7, 104. [Google Scholar] [CrossRef]
- Atzori, L.; Rombi, E.; Meloni, D.; Sini, M.F.; Monaci, R.; Cutrufello, M.G. CO and CO2 Co-Methanation on Ni/CeO2-ZrO2 Soft-Templated Catalysts. Catalysts 2019, 9, 415. [Google Scholar] [CrossRef]
- Kresse, G.; Hafner, J. Ab initio molecular dynamics for liquid metals. Phys. Rev. B 1993, 47, 558–561. [Google Scholar] [CrossRef] [PubMed]
- Perdew, J.P.; Burke, K.; Ernzerhof, M. Generalized Gradient Approximation Made Simple. Phys. Rev. Lett. 1996, 77, 3865–3868. [Google Scholar] [CrossRef] [PubMed]
- Blöchl, P.E. Projector augmented-wave method. Phys. Rev. B 1994, 50, 17953–17979. [Google Scholar] [CrossRef]
- Kresse, G.; Joubert, D. From ultrasoft pseudopotentials to the projector augmented-wave method. Phys. Rev. B 1999, 59, 1758–1775. [Google Scholar] [CrossRef]
- Dudarev, S.L.; Botton, G.A.; Savrasov, S.Y.; Humphreys, C.J.; Sutton, A.P. Electron-energy-loss spectra and the structural stability of nickel oxide: An LSDA+U study. Phys. Rev. B 1998, 57, 1505–1509. [Google Scholar] [CrossRef]
- Grimme, S.; Antony, J.; Ehrlich, S.; Krieg, H. A consistent and accurate ab initio parametrization of density functional dispersion correction (DFT-D) for the 94 elements H-Pu. J. Chem. Phys. 2010, 132, 154104. [Google Scholar] [CrossRef]
- Gerward, L.; Staun Olsen, J.; Petit, L.; Vaitheeswaran, G.; Kanchana, V.; Svane, A. Bulk modulus of CeO2 and PrO2—An experimental and theoretical study. J. Alloys Compd. 2005, 400, 56–61. [Google Scholar] [CrossRef]
- French, R.H.; Glass, S.J.; Ohuchi, F.S.; Xu, Y.-N.; Ching, W.Y. Experimental and theoretical determination of the electronic structure and optical properties of three phases of ZrO2. Phys. Rev. B 1994, 49, 5133–5142. [Google Scholar] [CrossRef]
- Pechini, M.P. Method of Preparing Lead and Alkaline Earth Titanates and Niobates and Coating Method Using the Same to form a Capacitor. U.S. Patent 3330697A, 11 July 1967. [Google Scholar]
- Williamson, G.; Hall, W. X-ray line broadening from filed aluminium and wolfram. Acta Metall. 1953, 1, 22–31. [Google Scholar] [CrossRef]
- Scherrer, P. Bestimmung der Grosse und der Inneren Struktur von Kolloidteilchen Mittels Rontgenstrahlen, Nachrichten von der Gesellschaft der Wissenschaften, Gottingen. Math.-Phys. Kl. 1918, 2, 98–100. [Google Scholar]
- Nolan, M.; Grigoleit, S.; Sayle, D.C.; Parker, S.C.; Watson, G.W. Density functional theory studies of the structure and electronic structure of pure and defective low index surfaces of ceria. Surf. Sci. 2005, 576, 217–229. [Google Scholar] [CrossRef]
- Yang, Z.; Woo, T.K.; Baudin, M.; Hermansson, K. Atomic and electronic structure of unreduced and reduced CeO2 surfaces: A first-principles study. J. Chem. Phys. 2004, 120, 7741–7749. [Google Scholar] [CrossRef] [PubMed]
- Balducci, G.; Kašpar, J.; Fornasiero, P.; Graziani, M.; Islam, M.S.; Gale, J.D. Computer Simulation Studies of Bulk Reduction and Oxygen Migration in CeO2–ZrO2 Solid Solutions. J. Phys. Chem. B 1997, 101, 1750–1753. [Google Scholar] [CrossRef]
- Balducci, G.; Kašpar, J.; Fornasiero, P.; Graziani, M.; Islam, M.S. Surface and Reduction Energetics of the CeO2–ZrO2 Catalysts. J. Phys. Chem. B 1998, 102, 557–561. [Google Scholar] [CrossRef]
- Yang, Z.; Wei, Y.; Fu, Z.; Lu, Z.; Hermansson, K. Facilitated vacancy formation at Zr-doped ceria(111) surfaces. Surf. Sci. 2008, 602, 1199–1206. [Google Scholar] [CrossRef]
- Yang, Z.; Fu, Z.; Wei, Y.; Hermansson, K. The electronic and reduction properties of Ce0.75Zr0.25O2(110). Chem. Phys. Lett. 2008, 450, 286–291. [Google Scholar] [CrossRef]
- Giordano, F.; Trovarelli, A.; de Leitenburg, C.; Giona, M. A Model for the Temperature-Programmed Reduction of Low and High Surface Area Ceria. J. Catal. 2000, 193, 273–282. [Google Scholar] [CrossRef]
- Boaro, M.; Vicario, M.; de Leitenburg, C.; Dolcetti, G.; Trovarelli, A. The use of temperature-programmed and dynamic/transient methods in catalysis: Characterization of ceria-based, model three-way catalysts. Catal. Today 2003, 77, 407–417. [Google Scholar] [CrossRef]
- Kamiya, H.; Gotoh, K.; Shimada, M.; Uchikoshi, T.; Otani, Y.; Fuji, M.; Matsusaka, S.; Matsuyama, T.; Tatami, J.; Higashitani, K.; et al. Characteristics and behavior of nanoparticles and its dispersion systems. In Nanoparticle Technology Handbook; Elsevier: Amsterdam, The Netherlands, 2008; pp. 113–176. [Google Scholar]
- Shrestha, S.; Wang, B.; Dutta, P. Nanoparticle processing: Understanding and controlling aggregation. Adv. Colloid Interface Sci. 2020, 279, 102162. [Google Scholar] [CrossRef]
- Ocampo, F.; Louis, B.; Roger, A.-C. Methanation of carbon dioxide over nickel-based Ce0.72Zr0.28O2 mixed oxide catalysts prepared by sol–gel method. Appl. Catal. A Gen. 2009, 369, 90–96. [Google Scholar] [CrossRef]
- Hao, Z.; Shen, J.; Lin, S.; Han, X.; Chang, X.; Liu, J.; Li, M.; Ma, X. Decoupling the effect of Ni particle size and surface oxygen deficiencies in CO2 methanation over ceria supported Ni. Appl. Catal. B Environ. 2021, 286, 119922. [Google Scholar] [CrossRef]
- Dobrosz-Gómez, I.; Kocemba, I.; Rynkowski, J.M. Au/Ce1−xZrxO2 as effective catalysts for low-temperature CO oxidation. Appl. Catal. B Environ. 2008, 83, 240–255. [Google Scholar] [CrossRef]
- Kaspar, J.; Fornasiero, P.; Balducci, G.; Di Monte, R.; Hickey, N.; Sergo, V. Effect of ZrO2 content on textural and structural properties of CeO2–ZrO2 solid solutions made by citrate complexation route. Inorganica Chim. Acta 2003, 349, 217–226. [Google Scholar] [CrossRef]


| Ce1−xZrxO2 Composition | Lattice Parameter (Å) | rCe-O (Å) | rZr-O (Å) | Esurf (J/m2) | Ef (eV) | ||
|---|---|---|---|---|---|---|---|
| (100) | (111) | (100) | (111) | ||||
| CeO2 | 5.46 | 2.375 | - | 1.76 | 0.72 | 2.03 | 2.71 |
| Ce0.75Zr0.25O2 | 5.38 | 2.347 | 2.258 | 1.79 | 0.74 | 1.45 | 2.23 |
| Ce0.5Zr0.5O2 | 5.26 | 2.326 | 2.242 | 1.81 | 0.75 | 1.22 | 1.95 |
| Ce0.25Zr0.75O2 | 5.17 | 2.314 | 2.220 | 1.85 | 0.79 | 1.97 | 2.54 |
| ZrO2 | 5.08 | - | 2.205 | 1.94 | 0.89 | 4.26 | 5.08 |
| Sample Ce1−xZrxO2 | Lattice Parameter (Å) | Estimated Zirconium Content x | BMe (Å−1) * | BO (Å−1) * | Rwp ** | χ2 ** |
|---|---|---|---|---|---|---|
| Ce0.9Zr0.1O2 | 5.388 (1) | 0.10 | 0.06 | 0.17 | 3.62 | 0.97 |
| Ce0.75Zr0.25O2 | 5.353 (1) | 0.25 | 0.13 | 0.29 | 4.07 | 1.22 |
| Ce0.5Zr0.5O2 | 5.290 (1) | 0.51 | 0.45 | 1.20 | 3.92 | 1.58 |
| Sample | Δd/d | DXRD (nm) | SXRD (m2/g) | SBET (m2/g) | Agglomeration Coefficient ξ | dHRTEM (nm) |
|---|---|---|---|---|---|---|
| Ce0.9Zr0.1O2 | (2.6 ± 0.2) × 10−3 | 7.0 | 120 | 71 | 0.41 | 6.4 |
| Ce0.75Zr0.25O2 | (4.5 ± 0.2) × 10−3 | 5.5 | 157 | 83 | 0.47 | 5.5 |
| Ce0.5Zr0.5O2 | (6.9 ± 0.2) × 10−3 | 5.0 | 180 | 53 | 0.70 | 4.1 |
| Sample | As-Prepared Catalysts | Aged Catalysts | ||
|---|---|---|---|---|
| dNiOXRD (nm) | dNiXRD (nm) | dNichem (nm) | SNichem (m2/gcat) | |
| Ni/Ce0.9Zr0.1O2 | 8.5(5) | 20.0(5) | 11.2 | 6 |
| Ni/Ce0.75Zr0.25O2 | 12.0(5) | 54.0(5) | 23.2 | 2.9 |
| Ni/Ce0.5Zr0.5O2 | 11.0(5) | 53.0(5) | 33.7 | 2 |
Publisher’s Note: MDPI stays neutral with regard to jurisdictional claims in published maps and institutional affiliations. |
© 2022 by the authors. Licensee MDPI, Basel, Switzerland. This article is an open access article distributed under the terms and conditions of the Creative Commons Attribution (CC BY) license (https://creativecommons.org/licenses/by/4.0/).
Share and Cite
Pakharukova, V.P.; Potemkin, D.I.; Rogozhnikov, V.N.; Stonkus, O.A.; Gorlova, A.M.; Nikitina, N.A.; Suprun, E.A.; Brayko, A.S.; Rogov, V.A.; Snytnikov, P.V. Effect of Ce/Zr Composition on Structure and Properties of Ce1−xZrxO2 Oxides and Related Ni/Ce1−xZrxO2 Catalysts for CO2 Methanation. Nanomaterials 2022, 12, 3207. https://doi.org/10.3390/nano12183207
Pakharukova VP, Potemkin DI, Rogozhnikov VN, Stonkus OA, Gorlova AM, Nikitina NA, Suprun EA, Brayko AS, Rogov VA, Snytnikov PV. Effect of Ce/Zr Composition on Structure and Properties of Ce1−xZrxO2 Oxides and Related Ni/Ce1−xZrxO2 Catalysts for CO2 Methanation. Nanomaterials. 2022; 12(18):3207. https://doi.org/10.3390/nano12183207
Chicago/Turabian StylePakharukova, Vera P., Dmitriy I. Potemkin, Vladimir N. Rogozhnikov, Olga A. Stonkus, Anna M. Gorlova, Nadezhda A. Nikitina, Evgeniy A. Suprun, Andrey S. Brayko, Vladimir A. Rogov, and Pavel V. Snytnikov. 2022. "Effect of Ce/Zr Composition on Structure and Properties of Ce1−xZrxO2 Oxides and Related Ni/Ce1−xZrxO2 Catalysts for CO2 Methanation" Nanomaterials 12, no. 18: 3207. https://doi.org/10.3390/nano12183207
APA StylePakharukova, V. P., Potemkin, D. I., Rogozhnikov, V. N., Stonkus, O. A., Gorlova, A. M., Nikitina, N. A., Suprun, E. A., Brayko, A. S., Rogov, V. A., & Snytnikov, P. V. (2022). Effect of Ce/Zr Composition on Structure and Properties of Ce1−xZrxO2 Oxides and Related Ni/Ce1−xZrxO2 Catalysts for CO2 Methanation. Nanomaterials, 12(18), 3207. https://doi.org/10.3390/nano12183207