Abstract
An investigation of the structural and luminescent properties of the transparent germanate glass-ceramics co-doped with Ni2+/Er3+ for near-infrared optical fiber applications was presented. Modification of germanate glasses with 10–20 ZnO (mol.%) was focused to propose the additional heat treatment process controlled at 650 °C to obtain transparent glass-ceramics. The formation of 11 nm ZnGa2O4 nanocrystals was confirmed by the X-ray diffraction (XRD) method. It followed the glass network changes analyzed in detail (MIR—Mid Infrared spectroscopy) with an increasing heating time of precursor glass. The broadband 1000–1650 nm luminescence (λexc = 808 nm) was obtained as a result of Ni2+: 3T2(3F) → 3A2(3F) octahedral Ni2+ ions and Er3+: 4I13/2 → 4I15/2 radiative transitions and energy transfer from Ni2+ to Er3+ with the efficiency of 19%. Elaborated glass–nanocrystalline material is a very promising candidate for use as a core of broadband luminescence optical fibers.
1. Introduction
The rapid increase in the capacity of modern information technology (IT) based on the computer network and optical communications demands optical fiber amplifiers with the ultrabroad and efficient gain bandwidth in the telecommunication windows. For this reason, the possible expansion of emission bands in erbium-doped fiber amplifiers (EDFA) in different ways is a hot topic [1]. In particular, the following co-doping system of rare-earth ions (RE) has been proposed, including: Er3+/Tm3+, Pr3+/Er3+, Er3+/Tm3+/Pr3+, Yb3+/Er3+/Tm3+ and others [2,3,4,5]. However, the main general problem in co-doping systems is the narrowing of 4f-4f transitions and unwanted energy transfer mechanism between RE ions which strongly limits the effective emission in the near-infrared spectral range. It is well-known that possible energy transfer channels depend on the phonon energy of the host and the type of electrostatic interionic interactions [6,7,8]. In the case of low-phonon glasses, the upconversion mechanisms (ETU—energy transfer upconversion, ESA—excited state absorption) leads to the depopulation of higher energy levels, and then excitation energy is partially distributed between rare-earth ions [9]. From the other side, in matrices with high-phonon energy, where the upconversion processes are negligible, the cross-relaxation and energy migration mechanisms are more prominent, and finally, the luminescence quenching is observed [10,11] In order to minimize the above limitations, great efforts have been put into the combination of the transition metal (TM) and RE ions in glasses and glass-ceramics. Transitions metals, such as Ni2+ ions, show the broadband emission in the near-infrared spectral range when they are localized in a crystal field environment [12]. However, from a practical point of view, it is impossible to fabricate optical fibers from ceramics. Thus, to realize efficient ultrabroad emission in the NIR region, the development of transparent glass-ceramics with embedded nanocrystals doped with transition metals and rare-earth ions is now the challenge in optical fiber technology.
One of the most promising multiple active ions for potential broad NIR luminescence are Ni2+/Er3+ ions. Recently, Zhou et al. showed that broadband NIR luminescence in the wavelength region of 1200–1600 nm is possible to obtain in silicate glass-ceramics by the manipulation of the energy transfer process between dopants selectively incorporated into the specified nanocrystals of γ-Ga2O3 and hexagonal LaF3 [13]. A similar effect was observed by Zhang in Ni2+/Er+ dual-doped transparent glass-ceramics containing γ-Ga2O3 and β-YF3 nanocrystals [14]. As a result of the subsequent heat-treatment process, the broadband NIR emission (originating from Ni2+: 3T2(F) → 3A2(F) and Er3+: 4I13/2 → 4I15/2) was realized in SiO2–Al2O3–Ga2O3–YF3–LiF glass-ceramics under 980 nm laser excitation. Zheng et al. suggest that the key factor for efficient NIR luminescence is the selective partition of the two species of optically active ions into different nanocrystal phases. In his work, the Ni2+/Er3+ co-doped transparent gallium-silicate glass-ceramics containing ZnGa2O4 nanocrystals show a super-broadband luminescence with the full width at half maximum (FWHM) about 400 nm [15]. Another pointed out the important issue is the selection of the optimal host both with high RE ions solubility and fiberization features. Silicate-based glass-ceramics have relatively high phonon energy (1100 cm−1) and high melting temperature (1600 °C) which significantly decreases the quality of the initial glasses [16,17]. Compared with silica glass, germanate glasses are characterized by excellent glass-forming ability, lower phonon energy (~850 cm−1), higher RE ions solubility, and refractive index above 1.75 [18,19,20]. It should be noted that the higher refractive index of the germanate-based glasses leads to lower scattering losses, resulting in a decreasing difference in refractive index between nanocrystals and glass matrix. Besides, partial substitution of SiO2 by GeO2 in gallium-silicate glasses leads to a lower melting temperature and minimizes the non-radiative transitions [21]. The combination of glass-forming elements of different phonon energy also results in greater separation of optically active centers and enables effective broadening of the spontaneous emission spectrum [22].
Regarding the above considerations, in our study, we developed GeO2-Ga2O3-ZnO-K2O glass and then glass-ceramics co-doped with Ni2+/Er3+ ions as a potential material for optical fiber with broadband NIR luminescence. Optimal glass composition was selected by subsequent substitution of GeO2 by ZnO. The controllable heat-treatment process with rigorous time conditions was designed to obtain ZnGa2O4 nanocrystals in the vicinity of Ni2+ ions. The structural properties of precursor glass and a glassy matrix of fabricating gallo-germanate glass-ceramics were analyzed by Fourier-transform infrared (FTIR) measurements in detail. In particular, luminescence spectra and decay curves were examined for glass and glass-ceramic samples as a function of different concentrations of ZnO and the annealing time. Analysis of the energy transfer mechanism between Ni2+ and Er3+ ions showed that the investigated glass-ceramics are promising candidates for their application in broadband emission sources of radiation or optical amplifiers.
2. Materials and Methods
The germanium based GGK glasses were prepared according to the following general molar formula: (1-x-y)75GeO2-10Ga2O3-xZnO-5K2O-yNiO-0.1Er2O3, (x = 10, 15, 20, y = 0, 0.1%) by standard melting and quenching method. The homogenized set (purity of materials 99.99% Sigma-Aldrich, Saint Louis, MO, USA) was melted in a platinum crucible in an electric furnace (CZYLOK Company, Jastrzębie-Zdrój, Poland) at T = 1500 °C for 30 min. The molten glass was poured out onto a stainless-steel plate and then annealed in an air atmosphere at 560 °C for 12 h. Glass-ceramic materials were obtained by additional heat treatment of the as-melted glasses in Czylok tube furnace at 650 °C for 1–5 h. The glasses and glass-ceramics samples were labeled according to the ZnO amount (10ZnO, 15ZnO) and heating time (3 h and 5 h at 650 °C). The photos of obtained samples were presented in Figure 1a,b.

Figure 1.
Image of the GGK with 10, 15, 20 ZnO glass and glass-ceramics (HT@650 °C for 1–5 h) (a) doped with 0.1 NiO, (b) co-doped with 0.1 NiO/0.1 Er2O3.
FTIR spectra were recorded with a Bruker Company Vertex 70v spectrometer (Rheinstetten, Germany). The MIR spectra were normalized to the highest peak. FTIR spectra have been decomposed using Fityk software (0.9.8 software, open-source (GPL2+)) based on the analysis of second derivatives with different degrees of smoothing. The coefficient of determination was 0.99. The standard deviation of the position of each of the component bands was ±4 cm−1.
The excitation wavelength of 532 nm was used, and power was about 10 mW. Acquisition time was set to 30 seconds. The formed crystallites were examined by the X-ray powder diffraction (XRD) method in the range of 10° to 90° using an X’Pert Pro diffractometer (PANalytical, Eindhoven, The Netherlands). The Cu X-ray tube with Kα radiation was used. DSC measurement was performed with 10 K/min using the SETARAM Labsys thermal analyzer (Setaram Instrumentation, Caluire, France). The glass-ceramics morphology was observed by an FEI Company Nova Nano SEM 200 scanning electron microscope (Hillsboro, OR, USA) and the analyses were performed in the secondary electron mode (SE). The absorbance and emission spectra of glasses in the range of 1 μm were measured using the Stellarnet Green-Wave spectrometer (Setaram Instrumentation, Caluire, France) and a high-power LIMO laser diode (λp = 808 nm, Popt (max) = 0.1–30 W). Spectral measurements in the range of 1000–1700 nm were carried out using Acton 2300 i monochromator (Acton Research Corporation, Acton, MA, USA) equipped with an InGaAs detector.
3. Results and Discussion
3.1. Structural Properties
In Figure 2, MIR spectra of 15 ZnO glass, and glass-ceramics samples doped with Ni2+ and Er3+ in the 400–1300 cm−1 range were presented. Due to the low-resolution technique, the presence of the nanocrystals has not been detected in spectra of glass-ceramics samples (lack of the bands in MIR spectra assigned to the bonds in crystals lattice).

Figure 2.
MIR spectra of the glass and glass-ceramics co-doped with Ni2+ and Er3+.
In the MIR spectra, the two broad bands in the ranges of 400 cm−1–700 cm−1, and 700 cm−1–1300 cm−1 were observed. In order to comprehend the changes in the matrix network of the glass and glass-ceramics co-doped with Ni2+ and Er3+, the MIR spectra have been decomposed on component bands and presented in Figure 3 and Figure 4a,b. The parameters and assignment of the components bands in the MIR spectra have been shown in Table 1 and Table 2, respectively.

Figure 3.
MIR spectrum of the 15ZnO glass co-doped with Ni2+ and Er3+.

Figure 4.
MIR spectrum of the 15ZnO glass-ceramics sample obtained after HT@650C for (a) 3 h, (b) 5 h.

Table 1.
Parameters of component bands in MIR spectra.
Table 2.
Assignment of component bands in MIR spectra [23,24,25,26,27,28,29,30,31,32,33,34].
The decomposed MIR spectra of the glass and glass-ceramics co-doped with Ni2+ and Er3+ showed eight bands, such as at ~450–460 cm−1 (A), 530–560 cm−1 (B), 600–630 cm−1 (C), 700–740 cm−1 (D), 760–800 cm−1 (E), 840–870 cm−1 (F), 930–950 cm−1 (G), and 1010–1040 cm−1 (H) (Figure 3 and Figure 4a,b). The band at 450–460 cm−1 (A) was due to symmetrical stretching bonds of Ge[4], Ga[4]-O,-Ge[4], Ga[4] in germano(gallo)oxygen four-membered rings. The band at 530–560 cm−1 (B) might be associated with the symmetrical stretching bonds of Ge[4], Ga[4]-O-Ge[4], Ga[4] in the three-membered germanano(gallo)oxygen rings. The band at 600–630 cm−1 (C) was attributed to the symmetrical stretching bonds of Ge[4], Ga[4]-O-Ge[4], Ga[4]. The band at 700–740 cm−1 (D) was assigned to symmetrical stretching bonds of Ge[6], Ga[6]-O-Ge[6], Ga[6]. The asymmetrical stretching bonds of Ge[4],Ga[4]-O-Ge[4],Ga[4] connecting [GeO]4/[GaO]4 tetrahedrons in 760–800 cm−1 (E) were detected. The band at ~840–870 cm−1 (F) showed up due to the asymmetrical stretching vibrations of the Ge-O-Ge, and Ga-O-Ga connecting [GeO4], [GaO4] tetrahedra, respectively. The band at around 930–950 cm−1 (G) was assigned to the Ge–O–Ge or Ga–O–Ga stretching vibrations in [GeO4]/[GaO4]. Additionally, the band at 1010–1040 cm−1 might be associated with the stretching vibrations of the (Ge-O−) of GeO4 units [23,24,25,26,27,28,29,30,31,32,33,34].
The decomposed MIR spectra showed that heating of the GGK with 15ZnO glass during 3h caused a growth in the polymerization of the glass network. It might be seen in Figure 2 and Figure 3, and Table 1 that the integral intensity of the A, B, C, E, and F bands raised after the following thermal treatments: from 14–15ZnO glass to 25–15ZnO_650 °C_3 h, from 45–15ZnO glass to 55–15ZnO_650 °C_3 h, from 13–15ZnO glass to 38–15ZnO_650 °C_3 h, from 30–15ZnO glass to 62–15ZnO_650 °C_3 h and 78–15ZnO glass 87–15ZnO_650 °C_3 h, respectively. Moreover, when the glass was heated at 650 °C in 3 h, a reduction in the intensity of band due to symmetrical stretching bonds of Ge[6], Ga[6]-O-Ge[6], Ga[6] (from 14–15ZnO glass to 4–15ZnO_650 °C_3 h) was observed (Figure 3, and Table 1 and Table 2). A different situation was observed for the 15ZnO_650 °C_5h sample. With the increase in the heating time of glass doped with nickel and erbium, the reduction of the order degree system was noticed. This was confirmed by the integral intensity reduction of the following B, C, E, F, G and H bands from 45–15ZnO glass to 30–15ZnO_650 °C_5 h, from 13–15ZnO glass to 10–15ZnO_650 °C_5 h, from 30–15ZnO glass to 25–15ZnO_650 °C_5 h, from 78–15ZnO glass to 44–15ZnO_650 °C_5 h, from 47–15ZnO glass to 29–15ZnO_650 °C_5 h and 44–15ZnO glass 29–15ZnO_650 °C_5 h, respectively. It might be related to the incorporation of the part of the Ni2+ and Er3+ ions into the crystalline phase [24].
As the nanocrystals have not been observed by the MIR spectrum the diffraction patterns of the samples were measured (Figure 5a). The amorphous state of the 15ZnO glass sample has been confirmed by a broad diffraction hump in the range of 2θ from 15° to 40°. In the diffraction patterns of the glass heated at 650 °C in three (15ZnO_6500C_3h) and five (15ZnO_6500C_5 h) hours, the peaks were observed. They were assigned to the zinc gallium oxide (ZnGa2O4) cubic phase (JCPDF: 01-086-0413) [35]. The average size of the nanocrystals was ca. 11 nm (seen also at SEM Figure 5b) which is much smaller than the visible light wavelength. Thus, obtained glass-ceramics are transparent (Figure 1a,b).
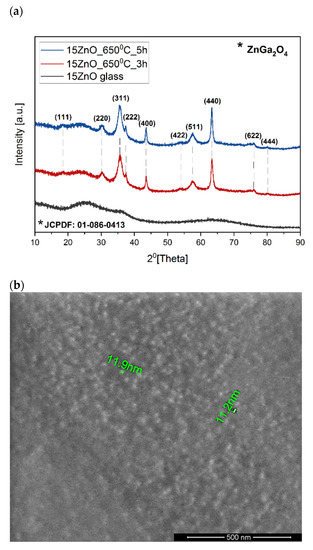
Figure 5.
(a) Diffraction patterns of the samples doped with nickel and erbium ions doped with 0.1NiO, (b) SEM image of the GGK with 15ZnO co-doped with 0.1NiO/0.1Er2O3 glass-ceramics (HT@650 °C for 1–5 h) with indicated ZnGa2O4 nanocrystals.
The size of the ZnGa2O4 nanocrystals presented in Figure 5b was also checked according to the calculation by Scherrer’s Equation (1) [36,37]. The obtained results for 15ZnO_650 °C_3h and 15ZnO_650 °C_5h samples have been presented in Table 3 and Table 4. The crystalline size of crystals has been evaluated for diffraction peaks visible in Figure 5a. According to the calculated data, the crystalline size of nanocrystals is in the 3–18 nm range for both samples. These data are in line with the SEM results and give an overview of the crystal size distribution in the glass-ceramic samples. Moreover, the longer heating time of Ni/Er co-doped glass sample from 3 h to 5 h did not cause an increase in crystal size. The difference in the size of the crystallites for the analyzed samples is within the measurement bar (±2 nm). This suggests that with an increase in heating time of the glass sample, the number of nanocrystallines grew [38].
where:
Table 3.
Crystallography data for co-doped 15ZnO_650 °C_3h sample.
Table 4.
Crystallography data for co-doped 15ZnO_650 °C_5h sample.
- k—shape factor (0.9) [-];
- λ—wavelength of X-ray [0.154056 nm];
- Β—diffraction peak broadening at half the maximum intensity (FWHM) [rad];
- θ—Bragg’s angle [°].
Thermal treatment conditions have been investigated using the DSC analysis of the as-melted precursor GGK glass at a heating rate of 10 °C/min and shown in Figure 6. One exothermic, crystallization peak located around 703 °C was observed. The glass transition temperature Tg and the onset of the crystallization temperature were about 560 °C and 675 °C, respectively. The thermal stability parameter ΔT defined as Tx-Tg was calculated to be 115 °C. It proofs the good thermal stability of glass, which is essential in the case of controllable crystallization of glasses and fabrication of the glass-ceramics material with embedded nanocrystals. Moreover, optical fiber technology ΔT above 100 °C describes glass as a suitable material for the optical fiber drawing [39].
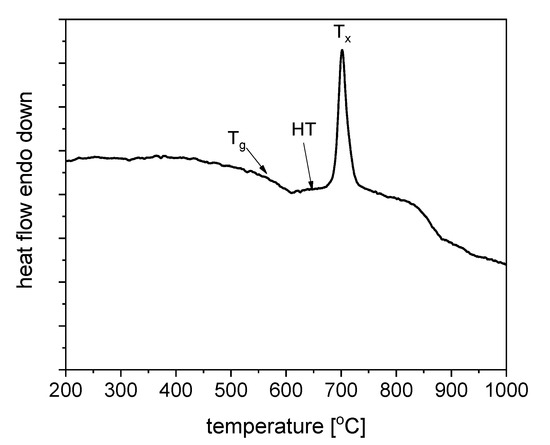
Figure 6.
DSC curve of fabricated GGK with 15ZnO glass with heating rate 10 °C/min.
3.2. Optical Properties
The absorbance spectra of 0.1NiO/Er2O3 co-doped glasses with 10, 15, and 20 mol% ZnO is shown in Figure 7a. The spectra consist of five bands that are assigned to the transition from the ground state of Er3+ to the 4G11/2, 4F7/2, 4H11/2, 4F9/2, 4I9/2 higher levels, and one band at 430 nm which is derived from the transition of 3A2(3F) → 3T1 (3P) in five folded Ni2+ ions. It should be noted that the presence of ZnO does not affect the background absorption. However, the shape of the absorption spectrum has changed after the heat treatment process (Figure 7b). It was also proofed by changing the color of the glass and glass-ceramics (Figure 1a,b). This effect is related to the variation of the Ni2+ ions in sites: from tetrahedral in glasses to octahedral in glass-ceramics [40,41]. Therefore, the Ni2+ ions should be embedded in the ZnGa2O4 nanocrystals after the heat treatment. It was reported in the literature that blue, brown, and yellow-green glass colors are observed in the case of 4Ni2+, 5Ni2+, and 6Ni2+ coordination, respectively [42].
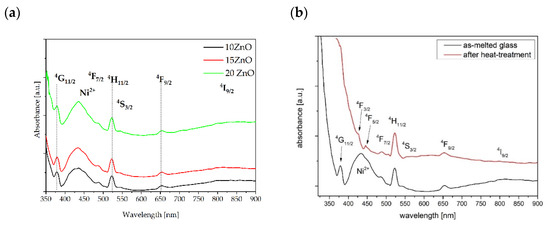
Figure 7.
Absorbance spectra of fabricated GGK glasses co-doped with 0.1NiO/0.1Er2O3 and: (a) different molar concentration of ZnO, (b) 15ZnO before (black line) and after (red line) controllable heat treatment (HT) process at 650 °C for 5 h.
Besides, after heat treatment at 650 °C for 5 h, UV absorption is red shifted and background absorption is slightly higher in comparison to as-melted glass. A similar effect was reported in the literature [15].
In Figure 8, luminescence spectra of the GGK glass and glass-ceramics with 10, 15, and 20 ZnO (mol.%) doped with 0.1NiO (λexc = 808 nm) are presented. The broadband 1050–1650 nm emission centered at 1280 nm can be assigned to the 3T2(3F) → 3A2(3F) transition of octahedral Ni2+ ions in the ZnGa2O4 nanocrystals [43]. It is seen that the emission spectrum is composed of two broad sub-peaks located at 1280 nm and 1460 nm. It is known that ZnGa2O4 is a two-site spinel compound [33]. It was also found that luminescence intensity increases with the ZnO content. It might be the result of the increase of Ni2+ in octahedral sites with the ZnGa2O4 nanocrystals [12]. These results correspond well to the further discussed emission decay curves.
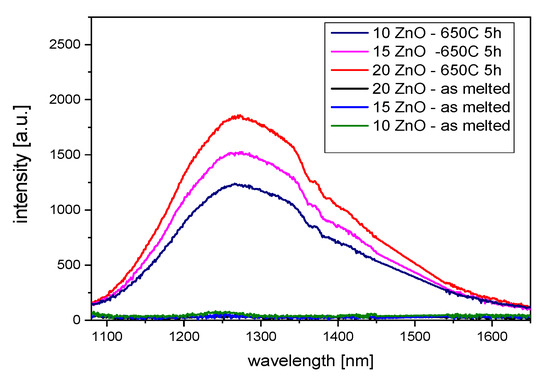
Figure 8.
Infrared luminescence spectra of 0.1NiO doped GGK with glass and transparent glass-ceramics with 10, 15, and 20 ZnO (mol.%), (HT@650 °C for 5 h), λexc = 808 nm.
To investigate ultra-broadband emission in the range of 1050–1650 nm GGK glass was co-doped with 0.1NiO/0.1Er2O3. The effect of the heat treatment of GGK glasses with 10, 15, 20 ZnO on the luminescence spectra under 808 nm laser excitation is presented in Figure 9 and Figure 10. Moreover, the influence of the heat treatment time on the I1550nm/I1300nm intensity ratio has been presented in Figure 11. Emission spectra in all investigated glass-ceramic samples are the result of a superposition of the 1280 nm and 1550 nm luminescence bands. Ni2+: 3T2(3F) level is populated directly by the ground-state absorption of the 808 nm laser pump whereas erbium ions also directly absorb the same excitation wavelength. Next, within the Er3+: 4I9/2 → 4I11/2 → 4I13/2 the nonradiative relaxation occurs. At the same time, part of the energy is transferred from Ni2+: 3T2(3F) to Er3+: 4I13/2 level. It was confirmed by analysis of the luminescence decay curves (Figure 12, Figure 13 and Figure 14). Finally, the 1280 nm luminescence band can be assigned to the 3T2(3F) → 3A2(3F) transition of octahedral Ni2+ ions, and 1550 nm emission is a result of the Er3+: 4I13/2 → 4I15/2 radiative transition. Normalized luminescence spectra enabled analysis of the influence of the heat treatment time on the I1550nm/I1300nm intensity ratio. It is seen that the luminescence intensity of Ni2+ ions increases with the longer heat treatment time. The curve of I1550nm/I1300nm vs. heat treatment time shows the smallest changes (0–2 h) in GGK glass with 20 ZnO (Figure 11). It might be the result of the faster nucleation of the ZnGa2O4 nanocrystals with incorporated Ni2+ ions. However, after 5 h, the I1550nm/I1300nm ratio has stabilized and was estimated to be 14.5 (10ZnO), 15.6 (15ZnO), 17.8 (20ZnO). Moreover, a decrease in FWHM (full width at half maximum) of 1550 nm luminescence band from 77 nm (as-melted glasses) to 44 nm (HT for 5 h glass-ceramics) was observed in all investigated 0.1NiO/0.1Er2O3 -co-doped glasses. It suggests modifications in the site symmetry around erbium through the incorporation part of the Er3+ ions into the crystalline phase [44]. If only Ni2+ ions (not Er3+) are incorporated into ZnGa2O4 nanocrystals the distance between Ni2+ and Er3+ is elongated and energy transfer Ni2+ and Er3+ may be suppressed. This effect was observed in silicate glass ceramics [15]. Our research indicates that Ni2+ to Er3+ energy transfer occurs in the crystalline phase of germanate glass-ceramics.
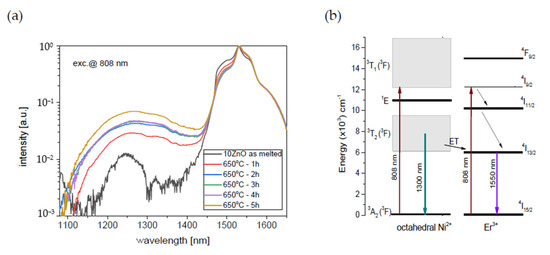
Figure 9.
(a) Infrared luminescence spectra of 0.1NiO/0.1Er2O3 co-doped GGK glass and transparent glass-ceramics with 10 ZnO (mol.%), (HT@650°C for 1–5 h), (b) simplified energy level diagram of the Ni2+ and Er3+ ions in the GGK glass-ceramics host with possible transitions and Ni2+ to Er3+ energy transfer, λexc = 808 nm.
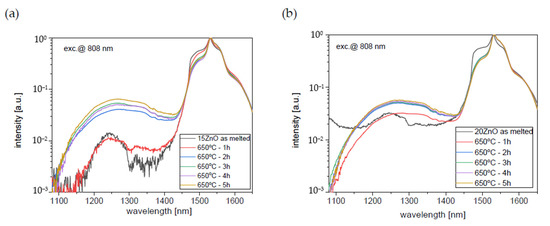
Figure 10.
Infrared luminescence spectra of 0.1NiO/0.1Er2O3 co-doped GGK glass and transparent glass-ceramics with (a) 15 ZnO (mol.%), (b) 20 ZnO (mol.%), (HT@650 °C for 1–5 h), λexc = 808 nm.

Figure 11.
I1550nm/I1300nm intensity ratio of 0.1NiO/0.1Er2O3 co-doped GGK glass and transparent glass-ceramics with 15 ZnO (mol.%), 20 ZnO (mol.%), (HT@650 °C for 1–5 h), λexc = 808 nm.
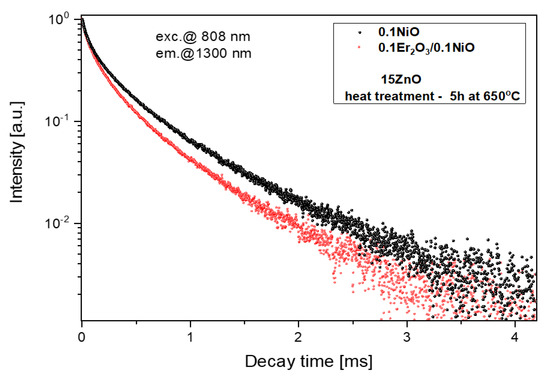
Figure 12.
Luminescence decay curves from Ni2+:3T2(3F) level, λexc = 808 nm.
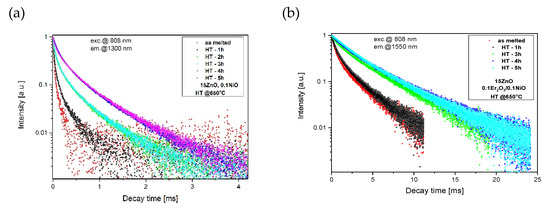
Figure 13.
Luminescence decay curves from (a) Ni2+:3T2(3F), (b) Er3+:4I13/2 levels in GGK with 15 ZnO glass and glass-ceramics (HT@650 °C for 1–5 h), λexc = 808 nm.
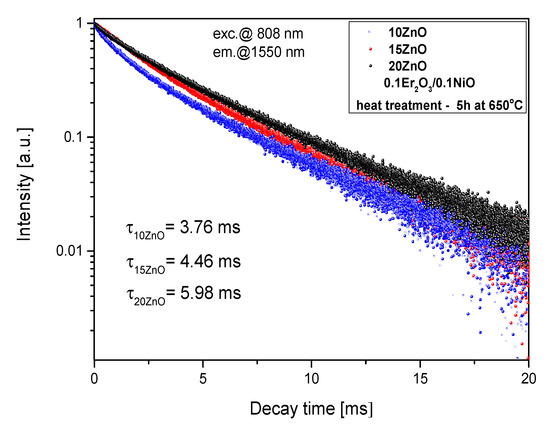
Figure 14.
Luminescence decay curves from Er3+:4I13/2 level in 5, 10, 15 ZnO glass-ceramics (HT@650 °C for 5 h), λexc = 808 nm.
Analysis of luminescence decay curves in glass-ceramics singly doped with Ni2+ and co-doped with Ni2+/Er3+ presented in Figure 12 enables to calculate the efficiency of Ni2+→Er3+ energy transfer according to the equation:
where: is the lifetime of Ni2+: 3T2(3F) in the presence of Er3+, is the lifetime of Ni2+: 3T2(3F) in singly Ni2+ -doped glass-ceramics. The lifetime of Ni2+: 3T2(3F) is characterized by double-exponential behavior. This effect suggests multiple side effects of Ni2+ and non-radiative multipolar interactions among Ni2+ [42]. The luminescence decay curves of the glass-ceramics singly doped with Ni2+ and co-doped with Ni2+/Er3+ were fitted by the sum of two exponential decay components from:
where τ1 and τ2 were short- and long-decay components, respectively. Parameters A1 and A2 were fitting constants. According to Equation (3), the average lifetime <τ> was given by:
According to Equation (4), the average lifetime of Ni2+:3T2(3F) in the fabricated GGK with 15ZnO glass-ceramics (HT@650 °C for 5 h) was calculated to be 433 μs (0.1NiO), and 349 μs (0.1NiO/0.1Er2O3). Thus, the efficiency of Ni2+ → Er3+ energy transfer (ET) was determined to be 19%. In the literature, in CaZrO3 nanocrystals co-doped with 0.2Ni/10Er (mol.%), the efficiency of the nickel to erbium energy transfer was estimated to be 86% [42]. In contrast, in silicate glass-ceramics with ZnGa2O4 nanocrystals (HT@ 850–950 °C) energy transfer between Ni2+ and Er3+ was suppressed [15]. It indicates that in the analyzed germanate glass-ceramics Ni2+ to Er3+ energy transfer occurs in the crystalline phase. Figure 13 presents the effect of the HT time GGK with 15 ZnO glass on the lifetime of Ni2+:3T2(3F) and Er3+: 4I13/2 metastable levels. Due to the incorporation of the nickel ions into ZnGa2O4 nanocrystals, the lifetime of the Ni2+ level increases with increasing the HT time and was calculated to be 62 μs (as-melted glass) and 433 μs (glass ceramics, HT–5 h). In silicate glass-ceramics with ZnGa2O4 and CaZrO3 nanocrystals, this value was 730 μs [12] and 600 μs [45], respectively. On the other hand, in silicate glass-ceramics with LiGa5O8 nanocrystals lifetime of Ni2+:3T2(3F) was 300 μs. In general, the Ni2+ lifetime has a positive correlation with the crystal field strength [12].
Analysis of the Er3+: 4I13/2 luminescence decay (Figure 13b) showed an increase in lifetime with increasing HT time (from 2.18 ms–as melted to 5.98 ms–HT 5h). It suggests that erbium ions are incorporated in the low-phonon energy ZnGaO4 nanocrystal phase. This effect is also consistent with the narrowing of the 1.55 μm luminescence band. Moreover, the Er3+: 4I13/2 lifetime increases with increasing the ZnO content (Figure 14), which could be the cause for more erbium ions in the nanocrystal phase. The Er3+: 4I13/2 lifetime was well fitted by a single-exponential curve which suggests one dominant structural position.
4. Conclusions
In summary, the effects of the ZnO content in transparent glass-ceramics containing ZnGa2O4 nanocrystals doped with Ni2+ and co-doped with Ni2+/Er3+ on structural and NIR luminescence properties were investigated. The controlled crystallization process enabled creation of ca. 11 nm size nanocrystals with incorporated Ni2+ions. According to the decomposed MIR spectra, it was found that the germanate-gallate networks of glass and glass-ceramics with 15 mol.% ZnO have existed as the [GeO4]/[GaO4], [GeO6]/[GaO6] structural units and connected through Ge, Ga–O–Ge, Ga bridges in [GeO4]/[GaO4] units. The structural changes of heat-treated precursor glasses showed local environment changes connected with the incorporation of parts of the Ni2+ and Er3+ ions into the crystalline phase of ZnGa2O4. This was in agreement with optical analysis. In particular, the broadband emission in the range of 1000–1650 nm (λexc—808 nm) as a result of a superposition of the Ni2+: 3T2(3F) → 3A2(3F) octahedral Ni2+ ions and Er3+: 4I13/2 → 4I15/2 radiative transitions and energy transfer from Ni2+ to Er3+ with an efficiency of ca. 19%. Moreover, increasing the Er3+: 4I13/2 lifetime and narrowing the 1.55 μm emission band suggest that Er3+ ions are partially incorporated into ZnGa2O4 nanocrystals. It was also observed that ZnO content has a positive impact on the luminescent properties of GGK Ni2+/Er3+—co-doped glass-ceramics. The highest Ni2+ luminescence intensity and the longest lifetime of Er3+: 4I13/2 level have been obtained in GGK glass-ceramics with 20ZnO (mol.%). It is known that a longer lifetime of the metastable level is beneficial for obtaining high optical gain. It should be also emphasized that analyzed glass is thermally stable. Thus, investigated glass-ceramics are promising candidates for applications in broadband fiber emission sources of radiation or optical fiber amplifiers. Further research should be focused on the flattening of the emission in the whole 1000–1650 nm spectral range.
Author Contributions
Conceptualization, M.L.; investigation, M.L., J.Z., M.K. (Marcin Kochanowicz), P.M., A.B., P.G., M.K. (Marta Kuwik); data curation, M.L.; writing—original draft preparation, M.K. (Marcin Kochanowicz), M.L., J.Z.; writing—review and editing, D.D.; project administration, M.K. (Marcin Kochanowicz); funding acquisition, M.K.(Marcin Kochanowicz); formal analysis, J.P., W.A.P., J.D. All authors have read and agreed to the published version of the manuscript.
Funding
The research activity was granted by the National Science Centre, Poland No. 2019/35/B/ST7/02616.
Data Availability Statement
Not applicable.
Conflicts of Interest
The authors declare no conflict of interest.
References
- Becker, P.M.; Olsson, A.A.; Simpson, J.R. Erbium-Doped Fiber Amplifiers: Fundamentals and Technology; Optics and Photonics; Elsevier Science: Amsterdam, The Netherlands, 1999; ISBN 9780080505848. [Google Scholar]
- Liao, X.; Jiang, X.; Yang, Q.; Wang, L.; Chen, D. Spectral Properties of Er3+/Tm3+ Co-Doped ZBLAN Glasses and Fibers. Materials 2017, 10, 486. [Google Scholar] [CrossRef] [PubMed] [Green Version]
- Pisarski, W.A.; Pisarska, J.; Lisiecki, R.; Ryba-Romanowski, W. Broadband Near-Infrared Luminescence in Lead Germanate Glass Triply Doped with Yb3+/Er3+/Tm3+. Materials 2021, 14, 2901. [Google Scholar] [CrossRef] [PubMed]
- Zhou, B.; Tao, L.; Tsang, Y.H.; Jin, W.; Pun, E.Y.-B. Superbroadband near-infrared emission and energy transfer in Pr3+-Er3+ codoped fluorotellurite glasses. Opt. Express 2012, 20, 12205–12211. [Google Scholar] [CrossRef] [Green Version]
- Zhu, Y.; Shen, X.; Su, X.; Zhou, M.; Zhou, Y. Er3+/Pr3+/Nd3+ tri-doped tellurite glass for ultra-broadband amplification applications. Mater. Lett. 2019, 244, 175–177. [Google Scholar] [CrossRef]
- Choi, Y.G.; Kim, K.H.; Heo, J. Spectroscopic Properties of and Energy Transfer in PbO–Bi2O3–Ga2O3 Glass Doped with Er2O3. J. Am. Ceram. Soc. 1999, 82, 2762–2768. [Google Scholar] [CrossRef]
- Pankratov, V.; Popov, A.I.; Chernov, S.A.; Zharkouskaya, A.; Feldmann, C. Mechanism for energy transfer processes between Ce3+ and Tb3+ in LaPO4:Ce, Tb nanocrystals by time-resolved luminescence spectroscopy. Phys. Status Solidi 2010, 247, 2252–2257. [Google Scholar] [CrossRef]
- Nakazawa, E.; Shionoya, S. Energy Transfer between Trivalent Rare-Earth Ions in Inorganic Solids. J. Chem. Phys. 1967, 47, 3211–3219. [Google Scholar] [CrossRef]
- Richards, B.; Shen, S.; Jha, A.; Tsang, Y.; Binks, D. Infrared emission and energy transfer in Tm3+, Tm3+-Ho3+ and Tm3+-Yb3+-doped tellurite fibre. Opt. Express 2007, 15, 6546–6551. [Google Scholar] [CrossRef] [PubMed]
- Parent, C.; Lurin, C.; Le Flem, G.; Hagenmuller, P. Nd3+ → Yb3+ energy transfer in glasses with composition close to LiLnP4O12 metaphosphate (Ln = La, Nd, Yb). J. Lumin. 1986, 36, 49–55. [Google Scholar] [CrossRef]
- Kuwik, M.; Jayasankar, C.K.; Pisarski, W.A.; Pisarska, J. Theoretical calculations and experimental investigations of lead phosphate glasses singly doped with Pr3+ and Tm3+ ions using luminescence spectroscopy. J. Alloys Compd. 2020, 842, 155801. [Google Scholar] [CrossRef]
- Zheng, J.; Cheng, Y. Ni3+-doped new silicate glass-ceramics for broadband near infrared luminescence. Opt. Mater. 2016, 62, 341–347. [Google Scholar] [CrossRef]
- Zhou, S.; Jiang, N.; Miura, K.; Tanabe, S.; Shimizu, M.; Sakakura, M.; Shimotsuma, Y.; Nishi, M.; Qiu, J.; Hirao, K. Simultaneous Tailoring of Phase Evolution and Dopant Distribution in the Glassy Phase for Controllable Luminescence. J. Am. Chem. Soc. 2010, 132, 17945–17952. [Google Scholar] [CrossRef] [PubMed]
- Zhang, R.; Lin, H.; Chen, D.; Yu, Y.; Wang, Y. Integrated broadband near-infrared luminescence in transparent glass ceramics containing γ-Ga2O3: Ni3+ and β-YF3: Er3+ nanocrystals. J. Alloys Compd. 2013, 552, 398–404. [Google Scholar] [CrossRef]
- Zheng, J.; Cheng, Y.; Deng, Z.; Xiong, Y. Super broadband near-infrared luminescence in Ni3+-Er3+ co-doped transparent glass ceramics. J. Non. Cryst. Solids 2017, 471, 446–451. [Google Scholar] [CrossRef]
- Zhou, S.; Jiang, N.; Dong, H.; Zeng, H.; Hao, J.; Qiu, J. Size-induced crystal field parameter change and tunable infrared luminescence in Ni3+-doped high-gallium nanocrystals embedded glass ceramics. Nanotechnology 2007, 19, 15702. [Google Scholar] [CrossRef]
- Zhou, S.; Dong, H.; Feng, G.; Wu, B.; Zeng, H.; Qiu, J. Broadband optical amplification in silicate glass-ceramic containing β-Ga2O3:Ni3+ nanocrystals. Opt. Express 2007, 15, 5477–5481. [Google Scholar] [CrossRef] [PubMed]
- Kochanowicz, M.; Zmojda, J.; Miluski, P.; Baranowska, A.; Leich, M.; Schwuchow, A.; Jäger, M.; Kuwik, M.; Pisarska, J.; Pisarski, W.A.; et al. Tm3+/Ho3+ co-doped germanate glass and double-clad optical fiber for broadband emission and lasing above 2 µm. Opt. Mater. Express 2019, 9, 1450–1458. [Google Scholar] [CrossRef]
- Tang, G.; Wen, X.; Qian, Q.; Zhu, T.; Liu, W.; Sun, M.; Chen, X.; Yang, Z. Efficient 2.0 μm emission in Er3+/Ho3+ co-doped barium gallo-germanate glasses under different excitations for mid-infrared laser. J. Alloys Compd. 2016, 664, 19–24. [Google Scholar] [CrossRef]
- Yuan, J.; Wang, W.; Ye, Y.; Deng, T.; Huang, Y.; Gu, S.; Chen, Y.; Xiao, P. 2.0 μm Ultra Broadband Emission from Tm3+/Ho3+ Co-Doped Gallium Tellurite Glasses for Broadband Light Sources and Tunable Fiber Lasers. Crystals 2021, 11, 190. [Google Scholar] [CrossRef]
- Grabtchikov, A.S.; Khodasevich, I.A.; Golubev, N.V.; Ignat’eva, E.S.; Mashinsky, V.M.; Kozlova, E.O.; Malashkevich, G.E.; Sigaev, V.N. Optical amplification in Ni3+-doped gallium germanosilicate glass-ceramics. Opt. Commun. 2021, 491, 126955. [Google Scholar] [CrossRef]
- Tanabe, S. Rare-earth-doped glasses for fiber amplifiers in broadband telecommunication. Comptes Rendus Chim. 2002, 5, 815–824. [Google Scholar] [CrossRef]
- Zhang, L.Y.; Li, H.; Hu, L.L. Statistical structure analysis of GeO2 modified Yb3+: Phosphate glasses based on Raman and FTIR study. J. Alloys Compd. 2017, 698, 103–113. [Google Scholar] [CrossRef]
- Koroleva, O.N.; Shtenberg, M.V.; Zainullina, R.T.; Lebedeva, S.M.; Nevolina, L.A. Vibrational spectroscopy and density of K2O–B2O3–GeO2 glasses with variable B/Ge ratio. Phys. Chem. Chem. Phys. 2019, 21, 12676–12684. [Google Scholar] [CrossRef] [PubMed]
- Błaszczak, K.; Jelonek, W.; Adamczyk, A. Infrared studies of glasses in the Li2O–B2O3–GeO2(SiO2) systems. J. Mol. Struct. 1999, 511–512, 163–166. [Google Scholar] [CrossRef]
- Jayasimhadri, M.; Jha, K.; Ratnam, B.V.; Woo, H.-J.; Jang, K.; Rao, A.S.; Haranath, D. Single NUV band pumped PbO-GeO2-TeO2:Tb3+ yellowish green emitting glass material for tricolor white LEDs. J. Alloys Compd. 2017, 711, 395–399. [Google Scholar] [CrossRef]
- Rachkovskaya, G.E.; Zakharevich, G.B. IR spectra of tellurium-germanium glasses and their structure. J. Appl. Spectrosc. 2007, 74, 78–81. [Google Scholar] [CrossRef]
- Pascuta, P.; Culea, E. FTIR spectroscopic study of some bismuth germanate glasses containing gadolinium ions. Mater. Lett. 2008, 62, 4127–4129. [Google Scholar] [CrossRef]
- Stalin, S.; Gaikwad, D.K.; Samee, M.A.; Edukondalu, A.; Ahmmad, S.K.; Joshi, A.A.; Syed, R. Structural, optical features and gamma ray shielding properties of Bi2O3–TeO2–B2O3-GeO2 glass system. Ceram. Int. 2020, 46, 17325–17334. [Google Scholar] [CrossRef]
- Di Martino, D.; Santos, L.F.; Marques, A.C.; Almeida, R.M. Vibrational spectra and structure of alkali germanate glasses. J. Non. Cryst. Solids 2001, 293–295, 394–401. [Google Scholar] [CrossRef]
- Rada, S.; Culea, E.; Rada, M. Towards understanding of the germanate anomaly in europium–lead–germanate glasses. J. Non. Cryst. Solids 2010, 356, 1277–1281. [Google Scholar] [CrossRef]
- Pascuta, P.; Pop, L.; Rada, S.; Bosca, M.; Culea, E. The local structure of bismuth germanate glasses and glass ceramics doped with europium ions evidenced by FT-IR spectroscopy. Vib. Spectrosc. 2008, 48, 281–284. [Google Scholar] [CrossRef]
- Curtis, B.; Hynek, D.; Kaizer, S.; Feller, S.; Martin, S.W. Composition dependence of the short range order structures in 0.2Na2O + 0.8[xBO3/2 + (1-x)GeO2] mixed glass formers. J. Non. Cryst. Solids 2018, 500, 61–69. [Google Scholar] [CrossRef]
- Kochanowicz, M.; Żmojda, J.; Miluski, P.; Ragin, T.; Pisarski, W.A.; Pisarska, J.; Jadach, R.; Sitarz, M.; Dorosz, D. Structural and luminescent properties of germanate glasses and double-clad optical fiber co-doped with Yb3+/Ho3+. J. Alloys Compd. 2017, 727, 1221–1226. [Google Scholar] [CrossRef]
- Lesniak, M.; Zmojda, J.; Kochanowicz, M.; Miluski, P.; Baranowska, A.; Mach, G.; Kuwik, M.; Pisarska, J.; Pisarski, W.A.; Dorosz, D. Spectroscopic Properties of Erbium-Doped Oxyfluoride Phospho-Tellurite Glass and Transparent Glass-Ceramic Containing BaF2 Nanocrystals. Materials 2019, 12, 3429. [Google Scholar] [CrossRef] [PubMed] [Green Version]
- Santos Barbosa, J.; Batista, G.; Danto, S.; Fargin, E.; Cardinal, T.; Poirier, G.; Castro Cassanjes, F. Transparent Glasses and Glass-Ceramics in the Ternary System TeO2-Nb2O5-PbF2. Materials 2021, 14, 317. [Google Scholar] [CrossRef] [PubMed]
- Patterson, A.L. The Scherrer Formula for X-Ray Particle Size Determination. Phys. Rev. 1939, 56, 978–982. [Google Scholar] [CrossRef]
- Zhao, J.; Huang, L.; Zhao, S.; Xu, S. Eu3+ doped transparent germanate glass ceramic scintillators containing LaF3 nanocrystals for X-ray detection. Opt. Mater. Express 2019, 9, 576–584. [Google Scholar] [CrossRef]
- Guérineau, T.; Strutynski, C.; Skopak, T.; Morency, S.; Hanafi, A.; Calzavara, F.; Ledemi, Y.; Danto, S.; Cardinal, T.; Messaddeq, Y.; et al. Extended germano-gallate fiber drawing domain: From germanates to gallates optical fibers. Opt. Mater. Express 2019, 9, 2437–2445. [Google Scholar] [CrossRef] [Green Version]
- Suzuki, T.; Murugan, G.S.; Ohishi, Y. Optical properties of transparent Li2O–Ga2O3–SiO2 glass-ceramics embedding Ni-doped nanocrystals. Appl. Phys. Lett. 2005, 86, 131903. [Google Scholar] [CrossRef]
- Zhou, S.; Jiang, N.; Wu, B.; Hao, J.; Qiu, J. Ligand-Driven Wavelength-Tunable and Ultra-Broadband Infrared Luminescence in Single-Ion-Doped Transparent Hybrid Materials. Adv. Funct. Mater. 2009, 19, 2081–2088. [Google Scholar] [CrossRef]
- Gao, Z.; Liu, Y.; Ren, J.; Fang, Z.; Lu, X.; Lewis, E.; Farrell, G.; Yang, J.; Wang, P. Selective doping of Ni2+ in highly transparent glass-ceramics containing nano-spinels ZnGa2O4 and Zn1+xGa2−2xGexO4 for broadband near-infrared fiber amplifiers. Sci. Rep. 2017, 7, 1783. [Google Scholar] [CrossRef] [PubMed]
- Lin, C.; Liu, C.; Zhao, Z.; Li, L.; Bocker, C.; Rüssel, C. Broadband near-IR emission from cubic perovskite KZnF3:Ni2+ nanocrystals embedded glass-ceramics. Opt. Lett. 2015, 40, 5263–5266. [Google Scholar] [CrossRef] [PubMed]
- Velázquez, J.J.; Gorni, G.; Balda, R.; Fernández, J.; Pascual, L.; Durán, A.; Pascual, M.J. Non-Linear Optical Properties of Er3+–Yb3+-Doped NaGdF4 Nanostructured Glass–Ceramics. Nanomaterials 2020, 10, 1425. [Google Scholar] [CrossRef] [PubMed]
- Luitel, H.N.; Mizuno, S.; Tani, T.; Takeda, Y. Broadband-sensitive Ni2+–Er3+ based upconverters for crystalline silicon solar cells. RSC Adv. 2016, 6, 55499–55506. [Google Scholar] [CrossRef] [Green Version]
Publisher’s Note: MDPI stays neutral with regard to jurisdictional claims in published maps and institutional affiliations. |
© 2021 by the authors. Licensee MDPI, Basel, Switzerland. This article is an open access article distributed under the terms and conditions of the Creative Commons Attribution (CC BY) license (https://creativecommons.org/licenses/by/4.0/).