
Hydrogen Nanometrology in Advanced Carbon Nanomaterial Electrodes


Abstract
1. Introduction
2. Materials and Methods
- (i)
- (C–H)ads → H(lat)
- (ii)
- H(lat) → H(s)
- (iii)
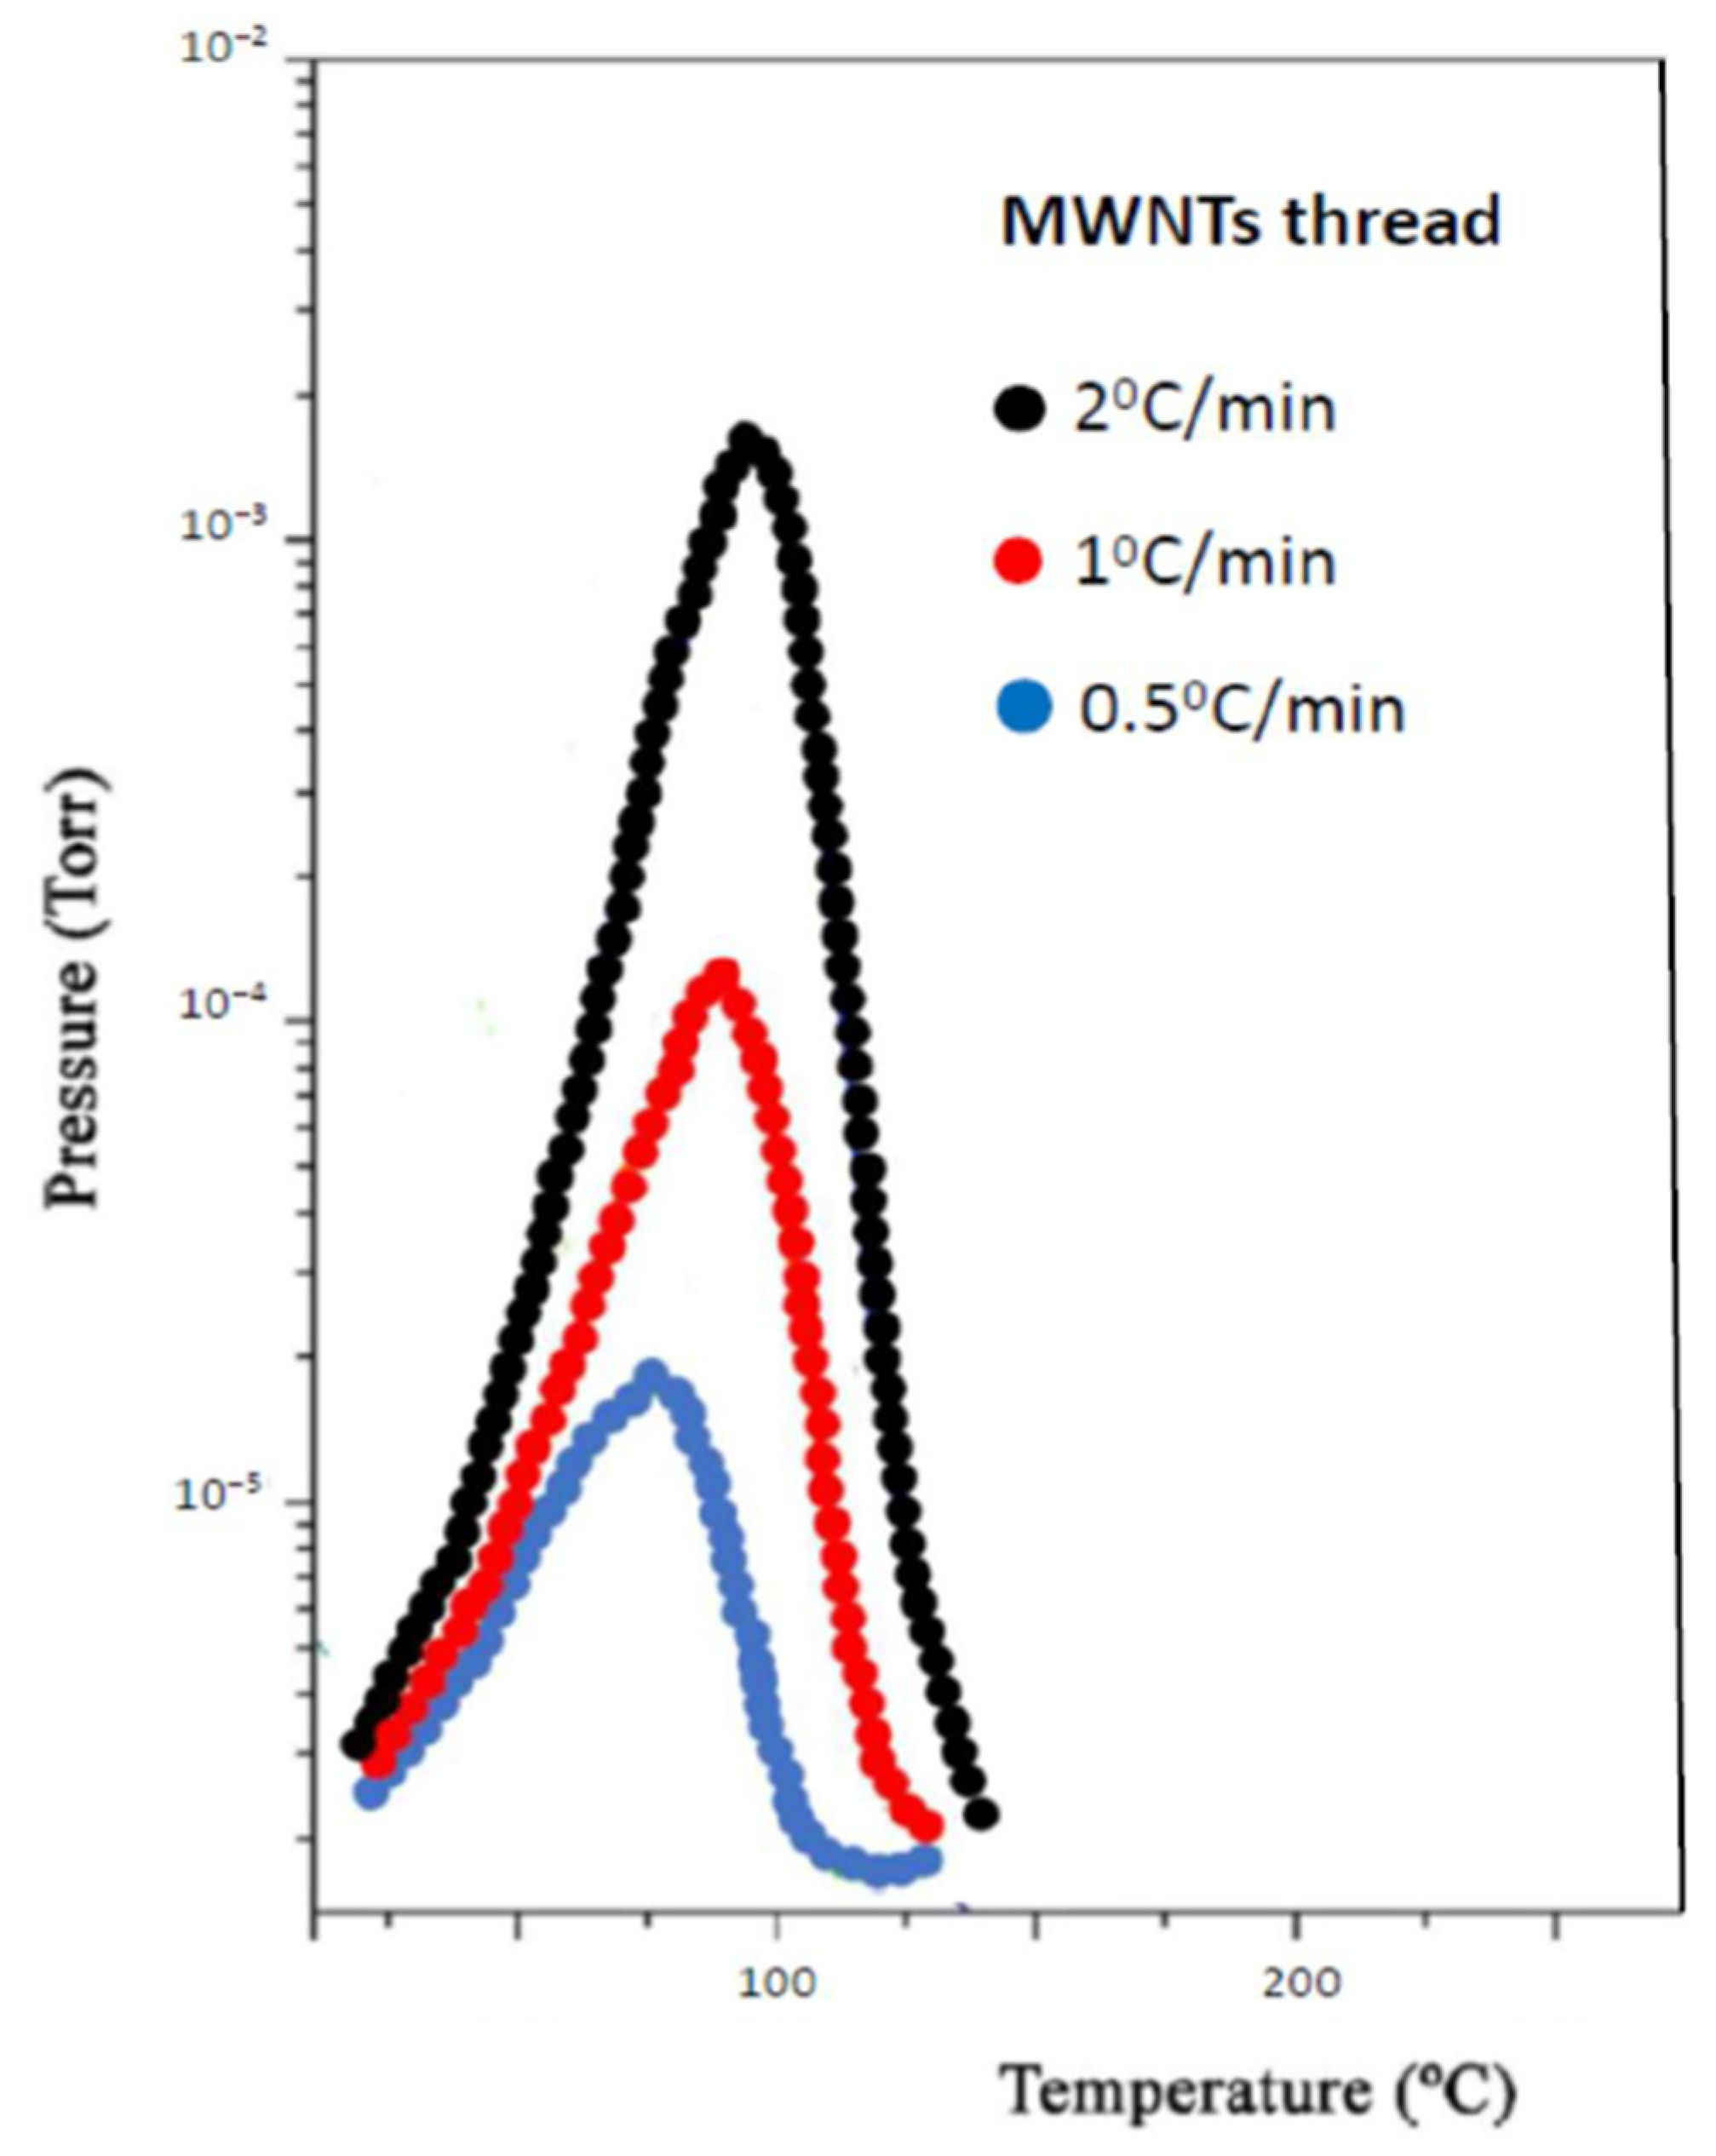
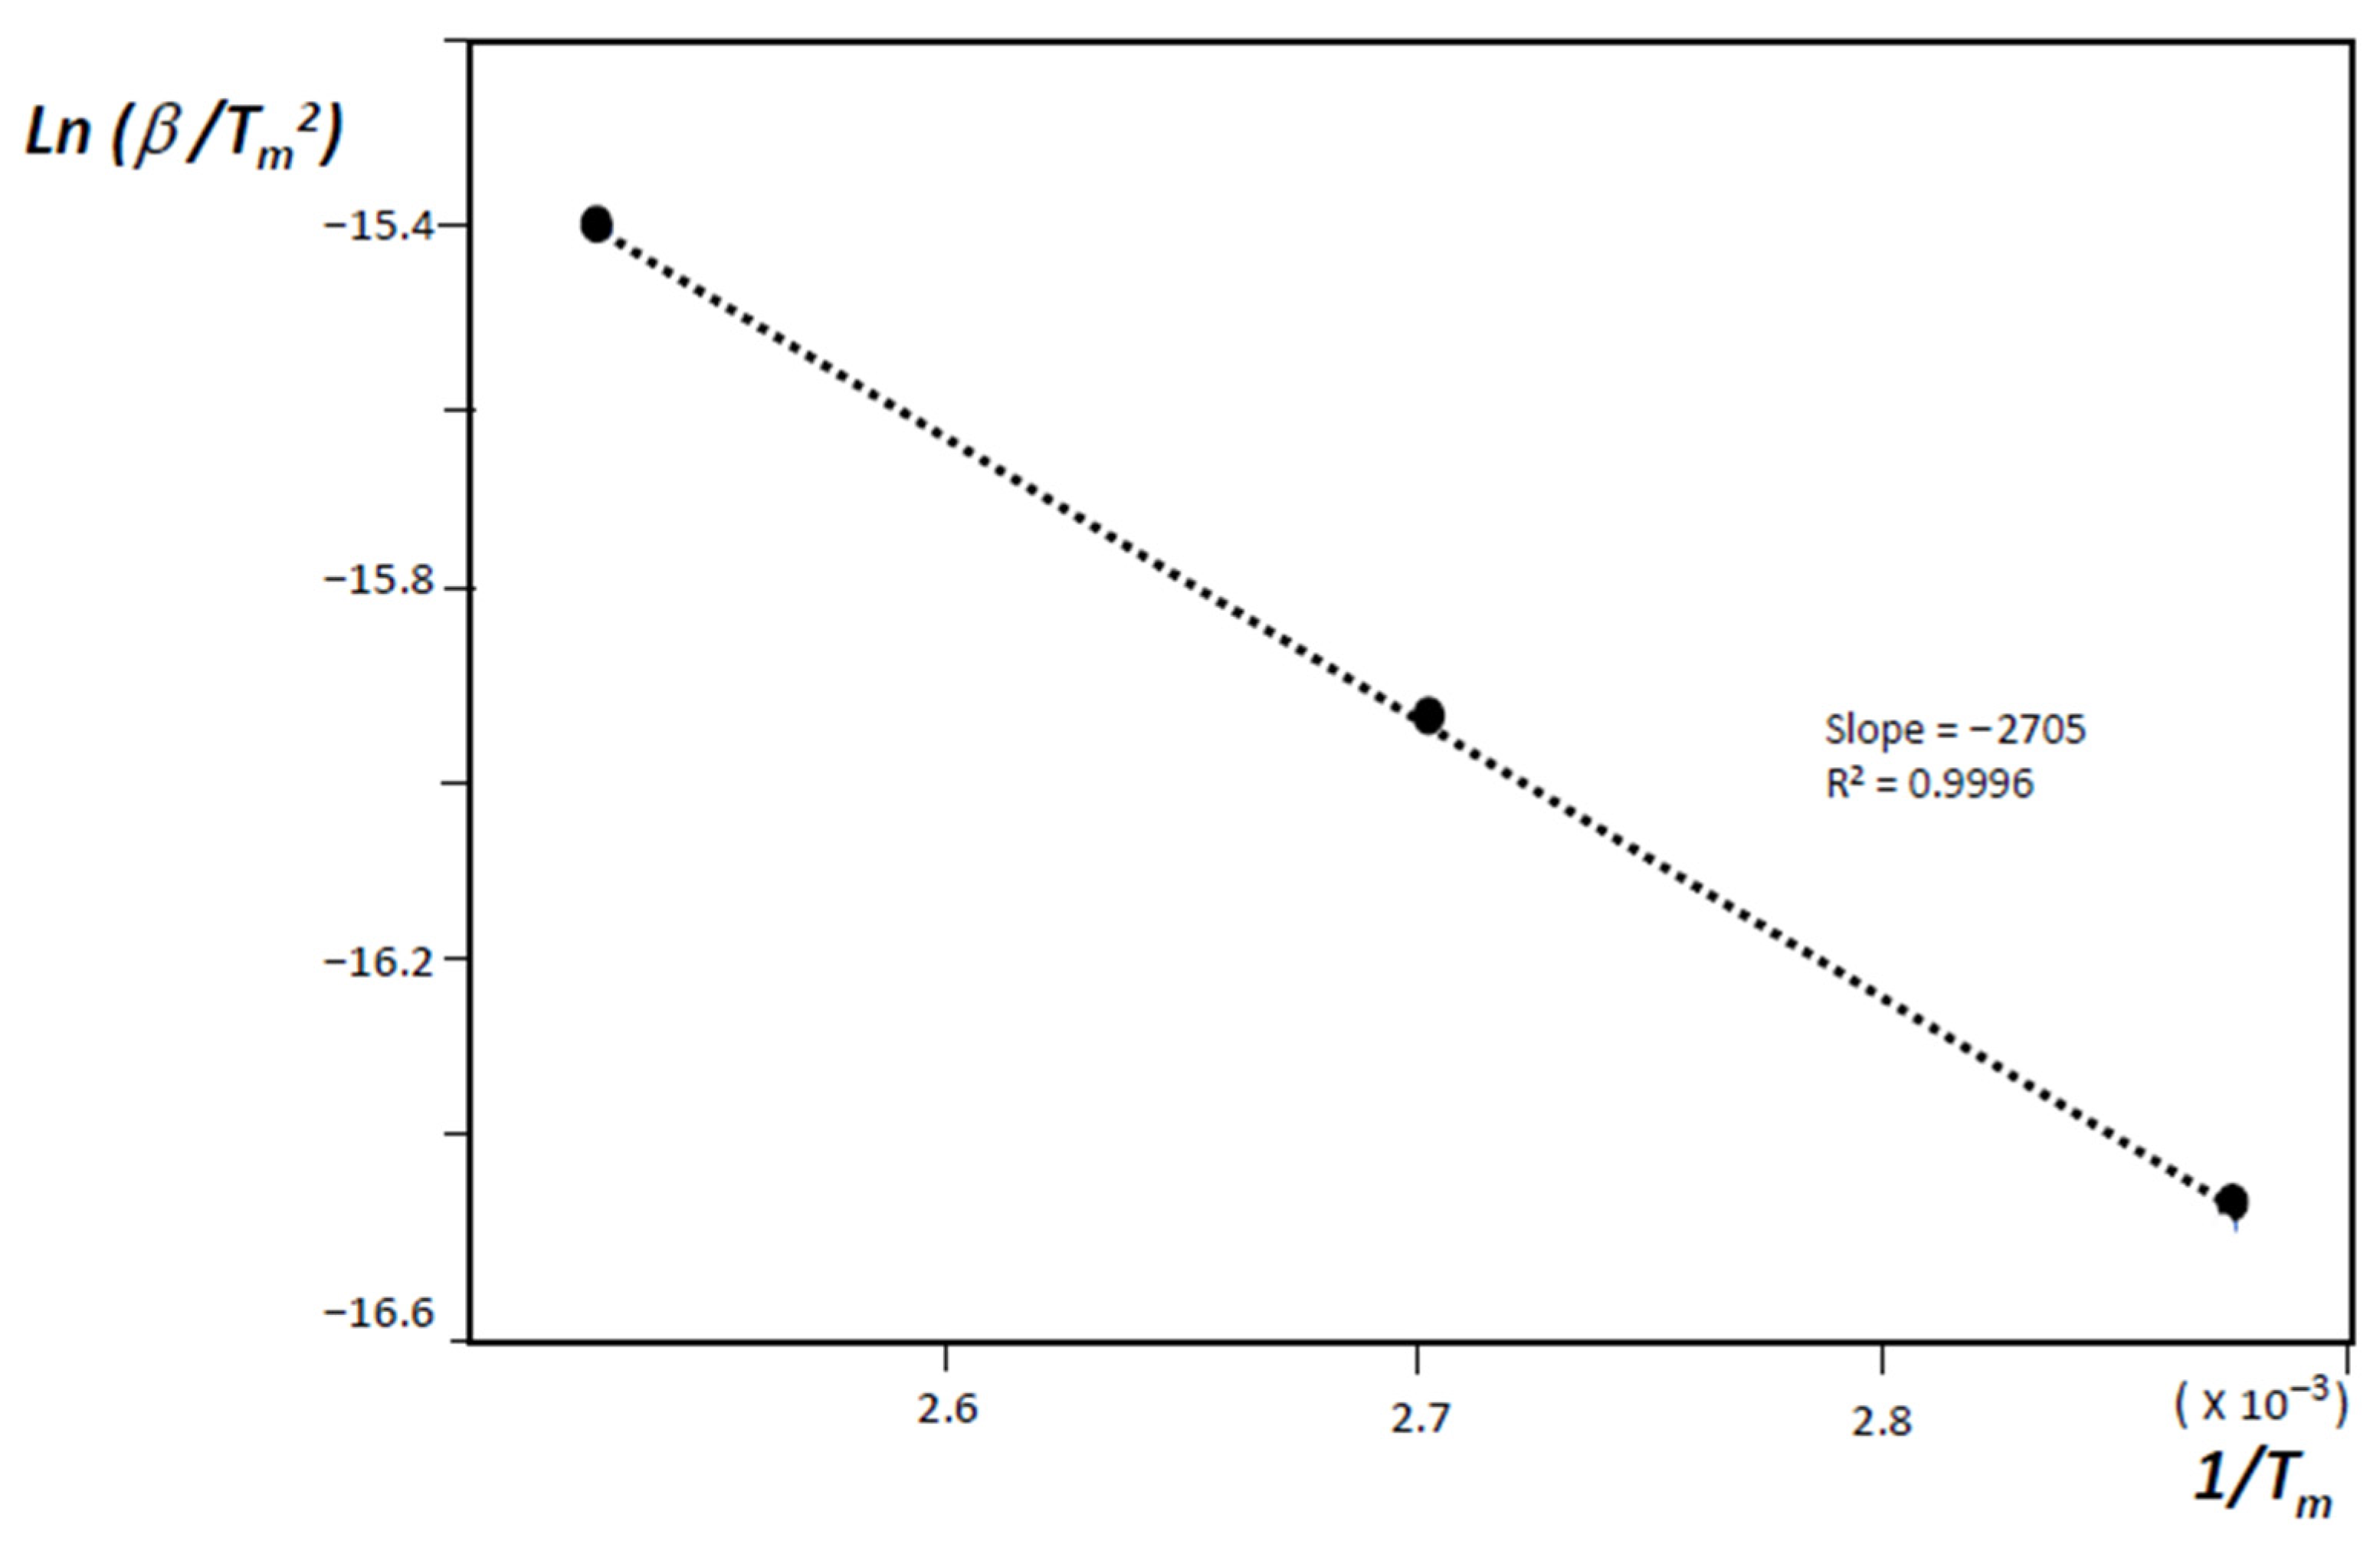
- H(s) + H(s) → H2(g)where H(s) are hydrogen atoms on the surface of the material grains or nano-regions of the material, H(lat) are hydrogen atoms inside the material lattice but outside the chemisorption centers, and (C–H)ads are the physisorbed hydrogen atoms on active sites. The second stage is diffusion-limited, and from the condition of maximum desorption at T = Tm, one gets:where Eadif is the diffusion activation energy, kB the Boltzmann constant, and β the heating rate.
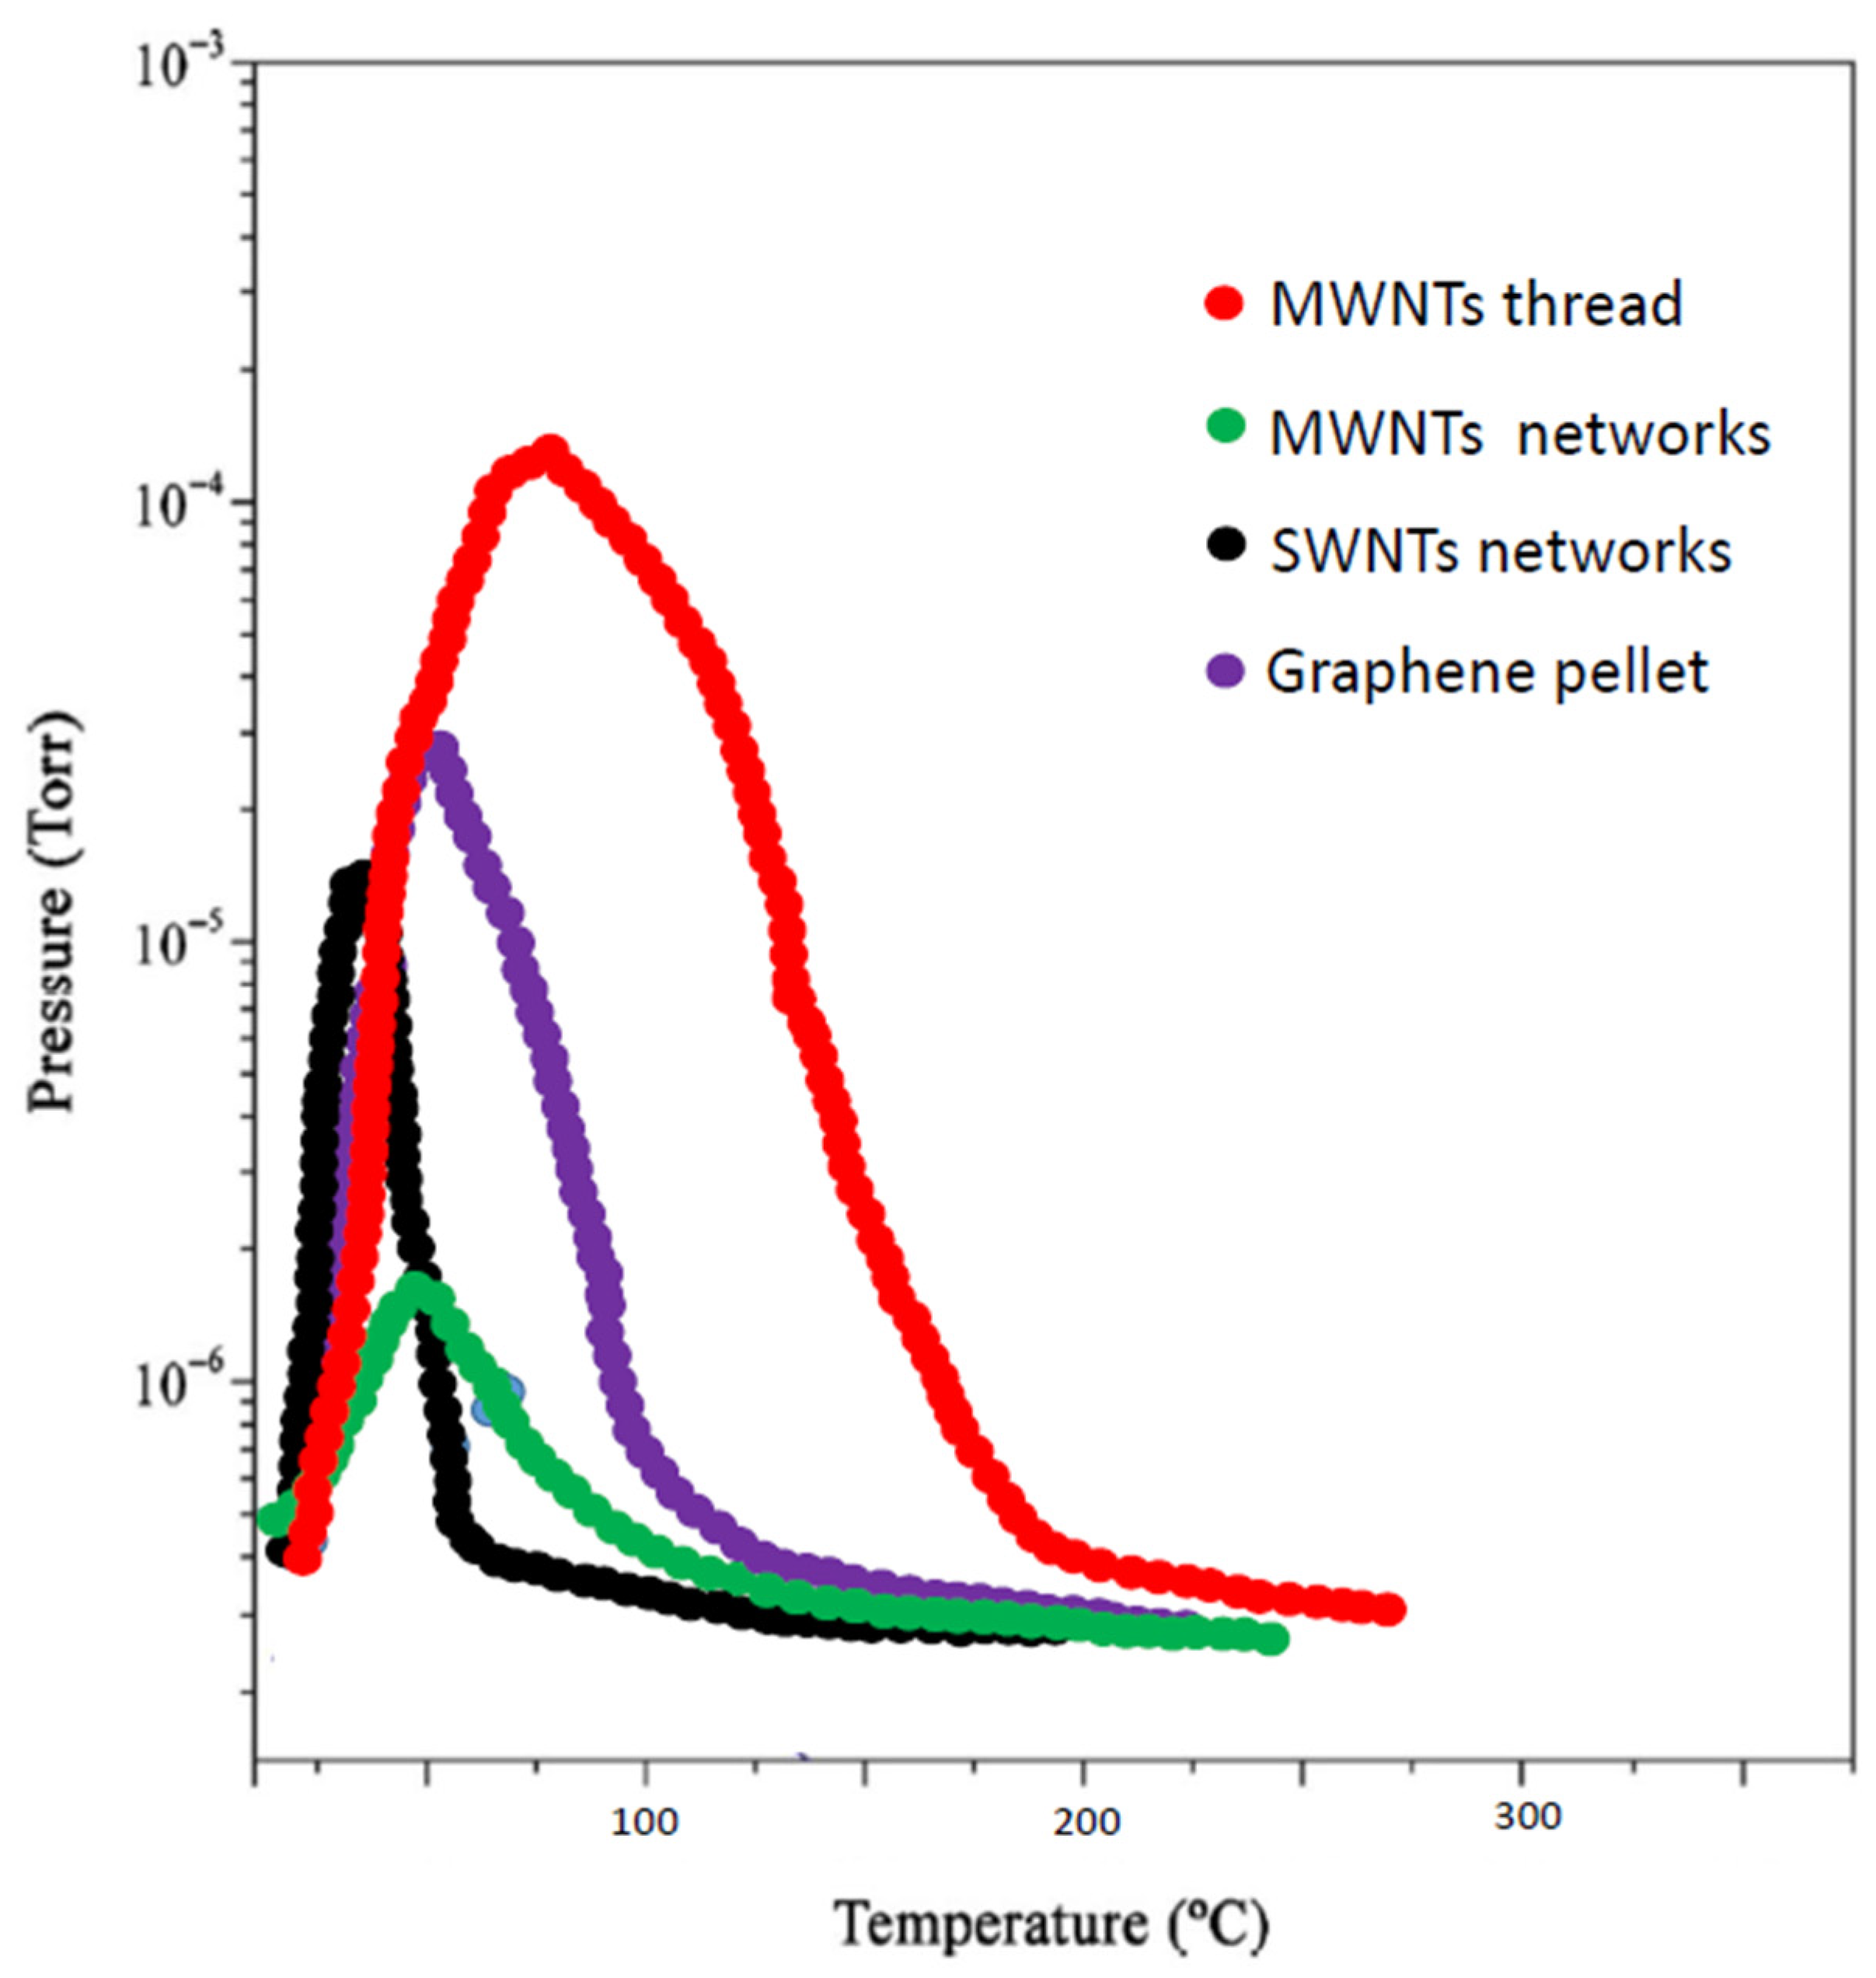
- (i)
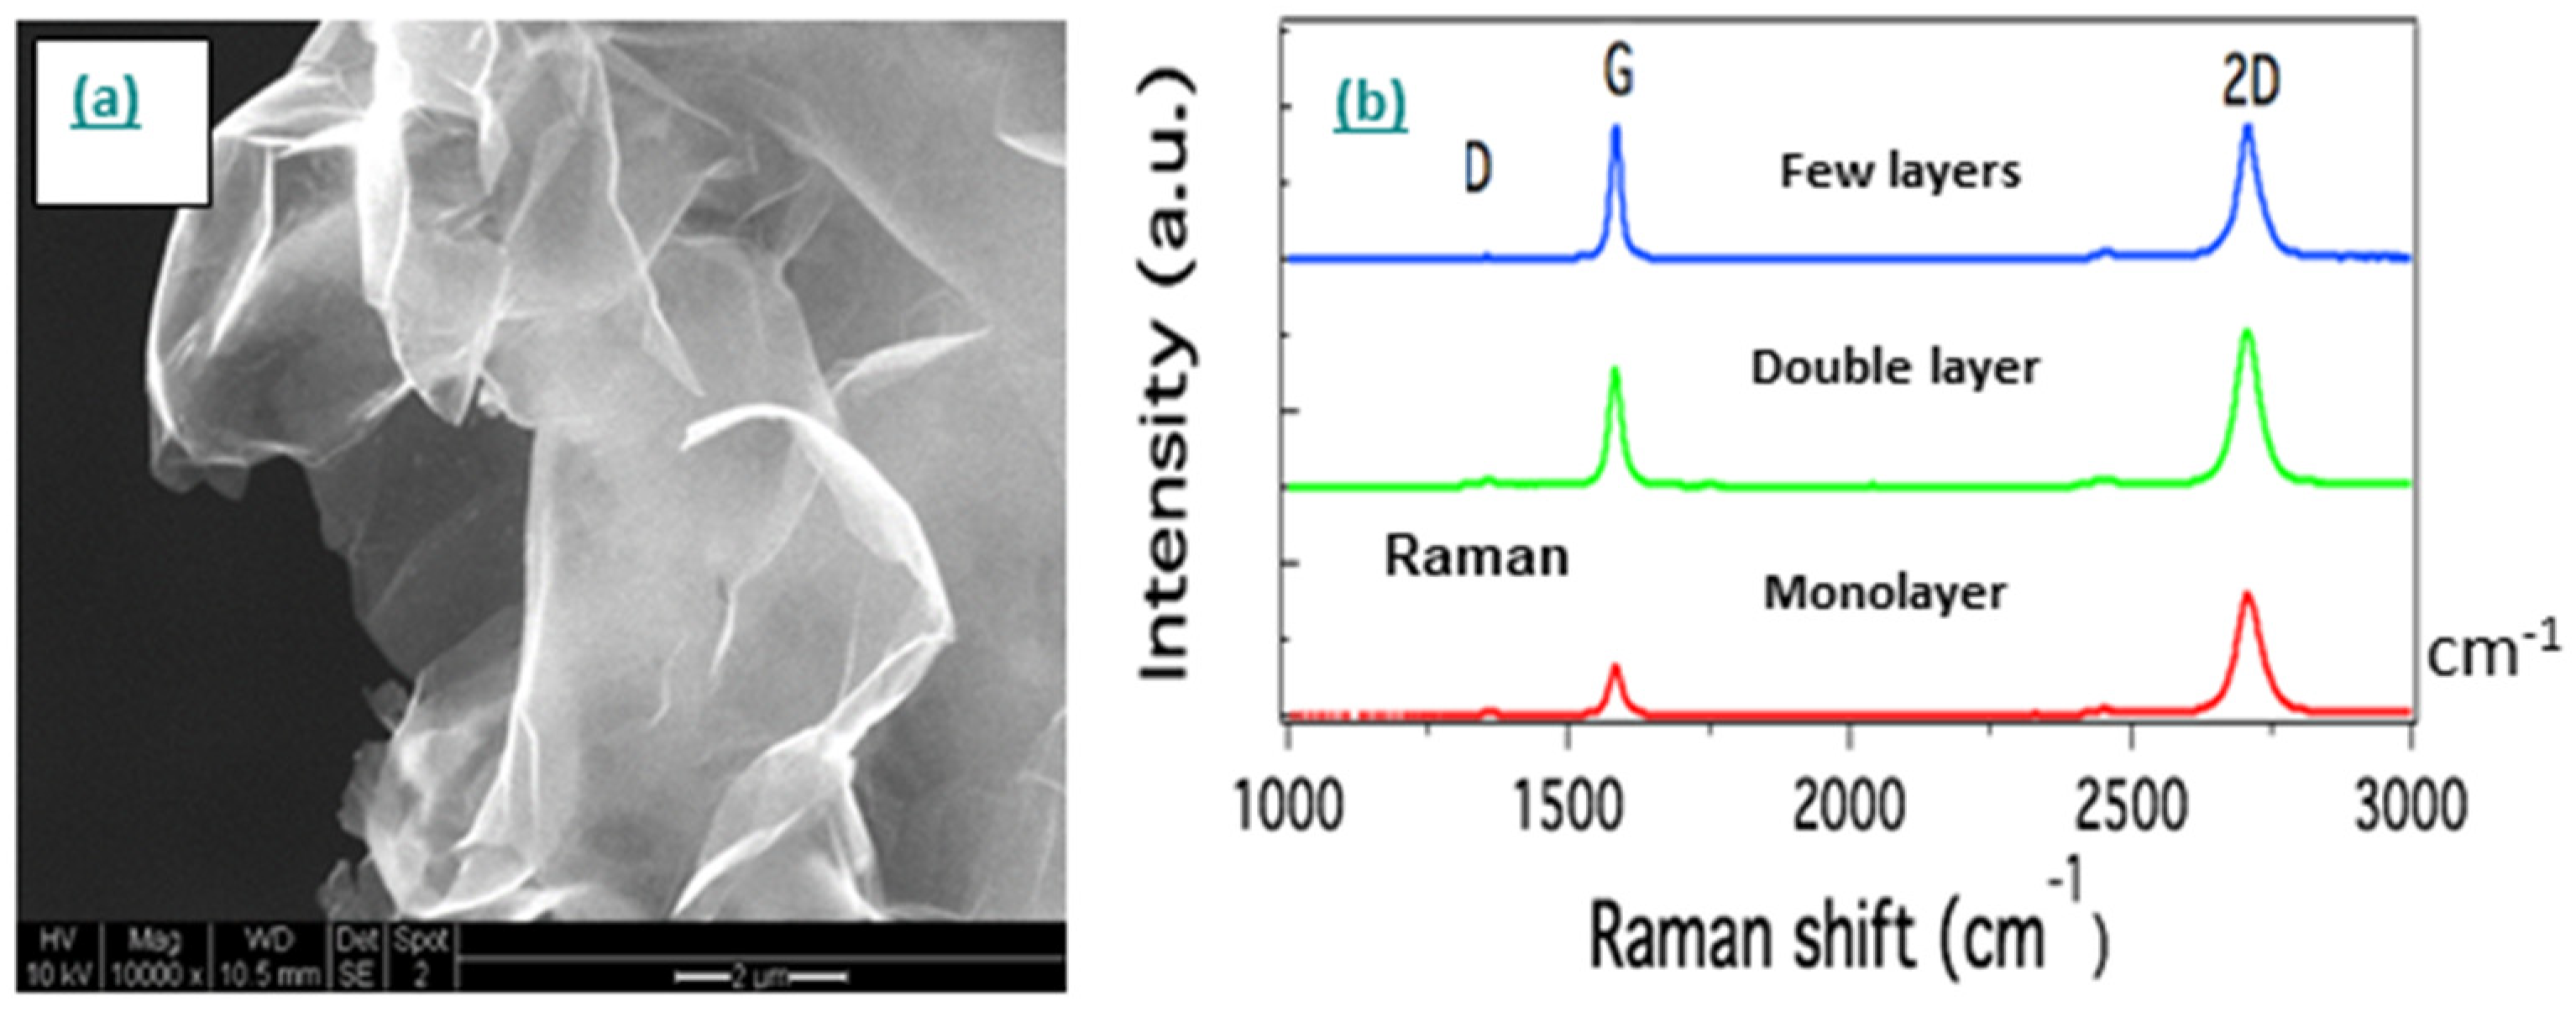
- Graphene
- (ii)
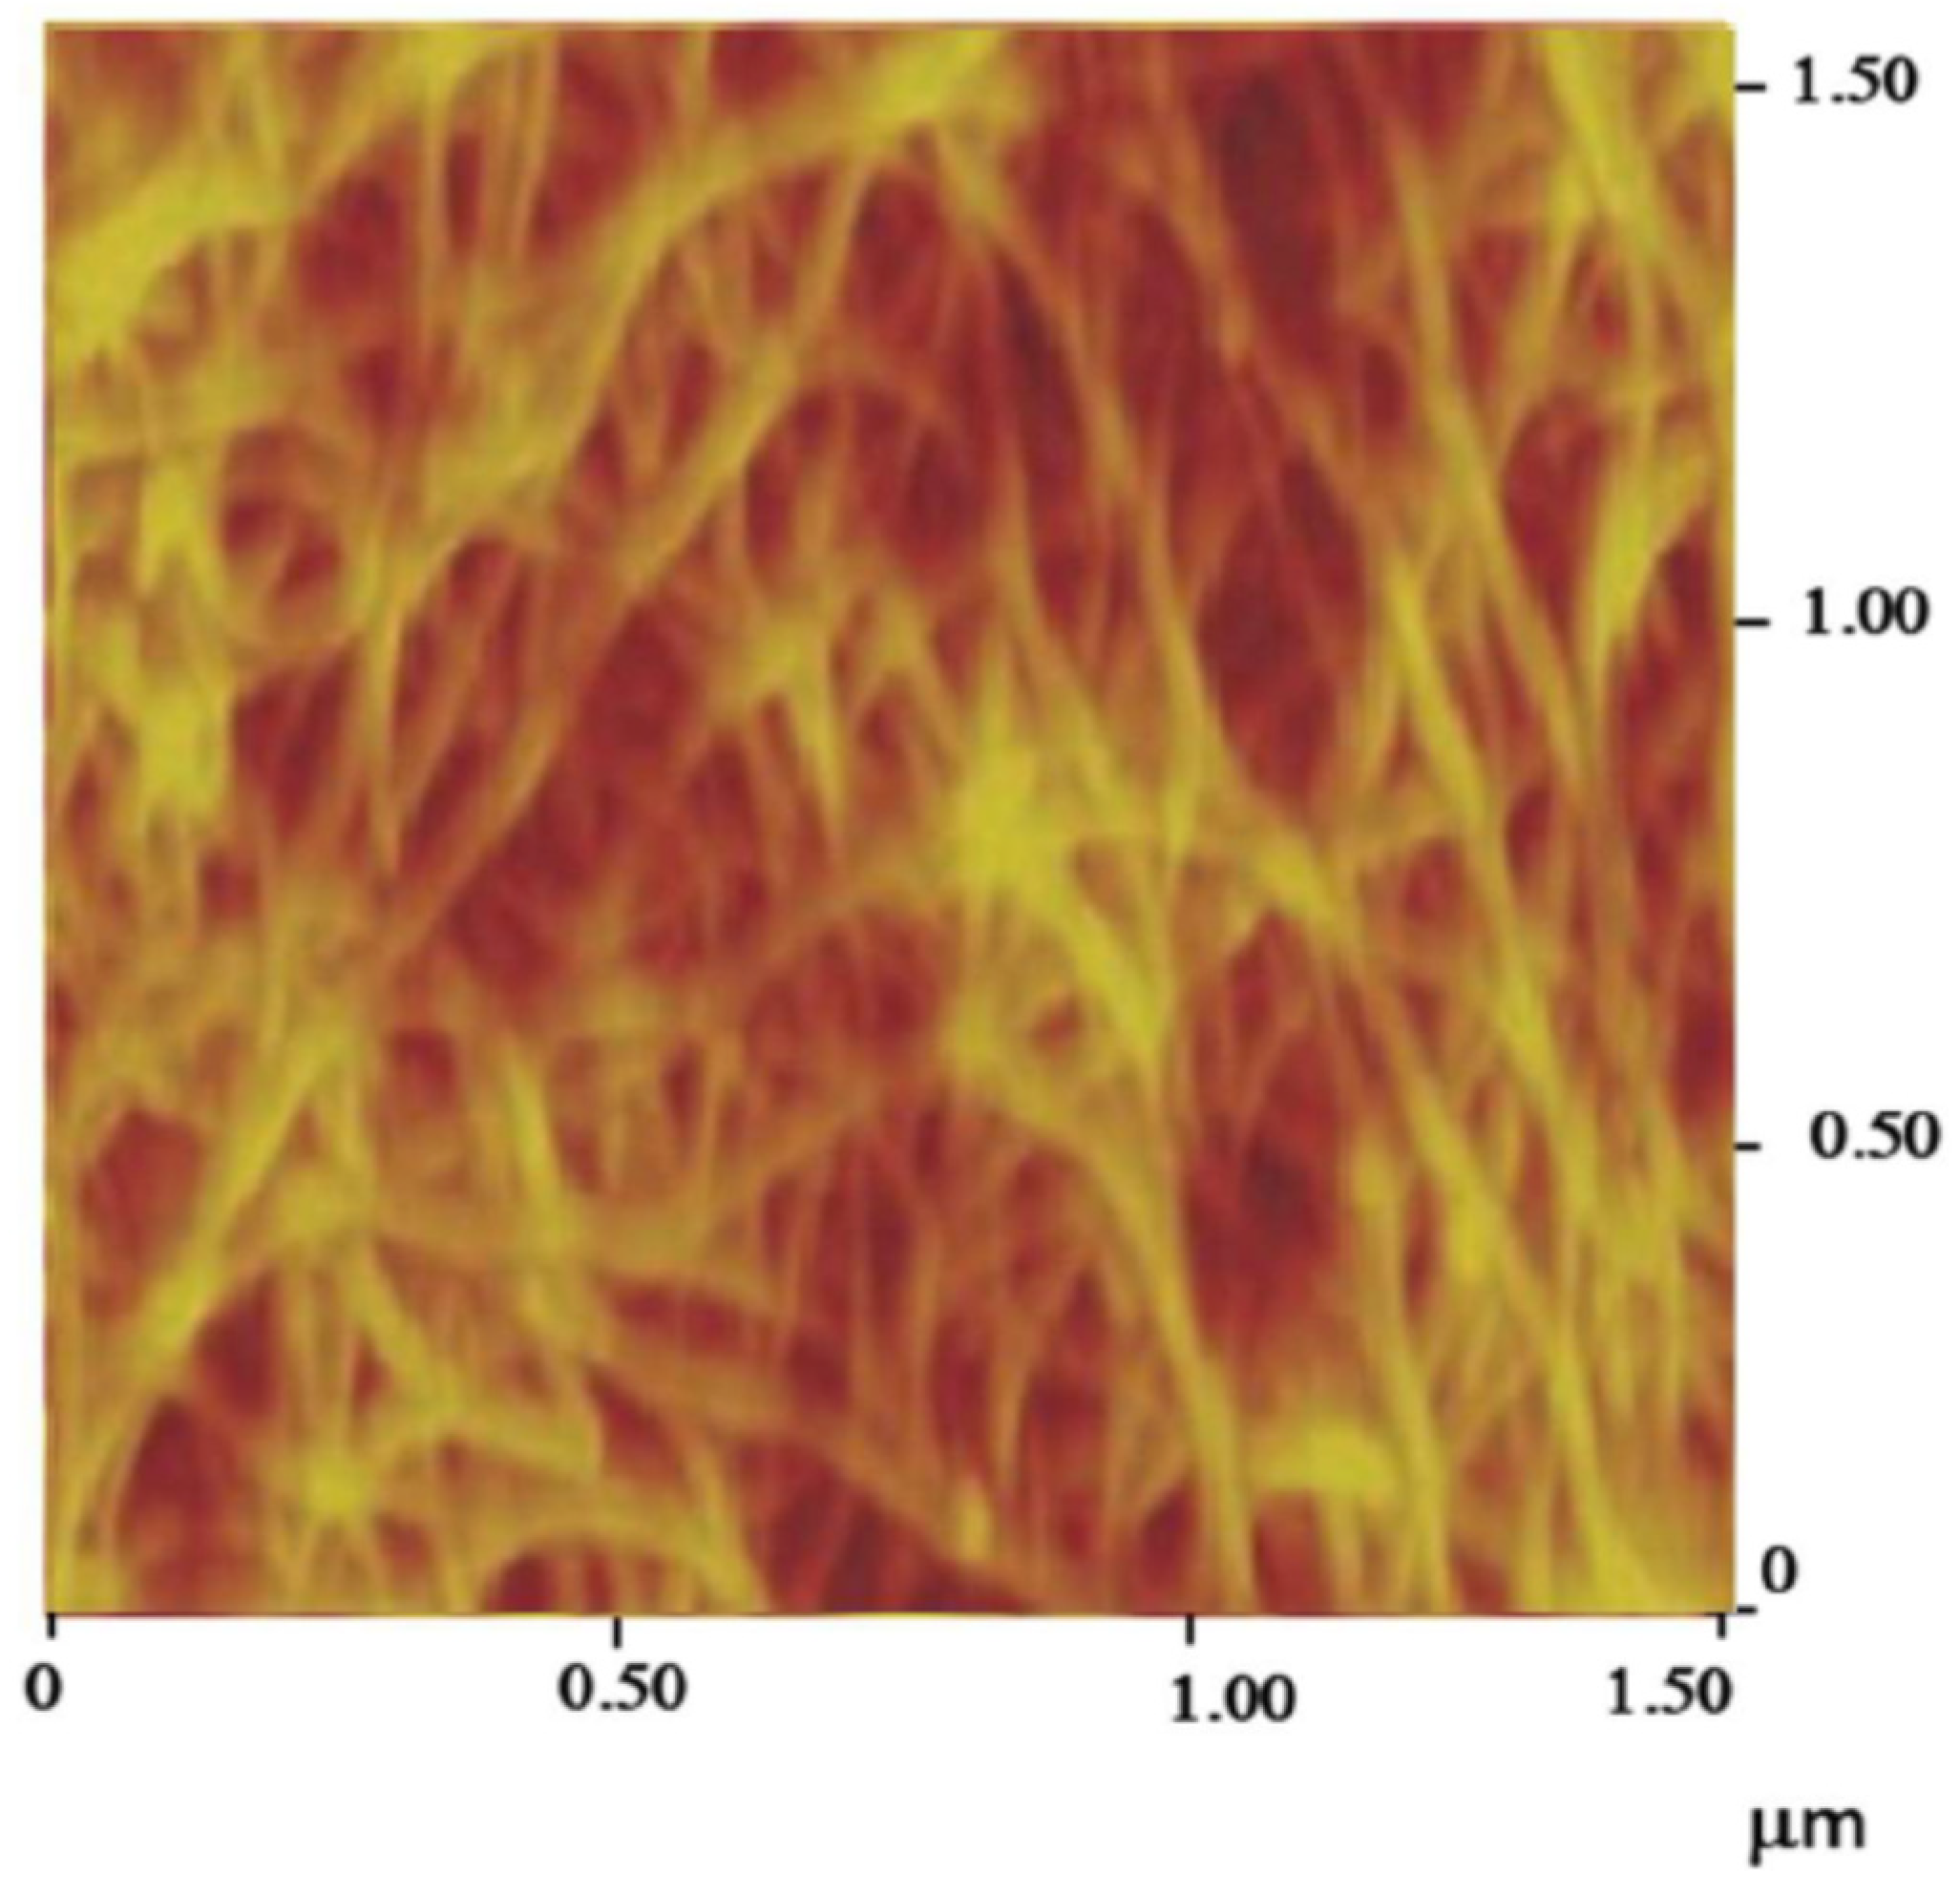
- Single-walled carbon nanotube networks
- (iii)
- Multi-walled carbon nanotube networks
- (iv)
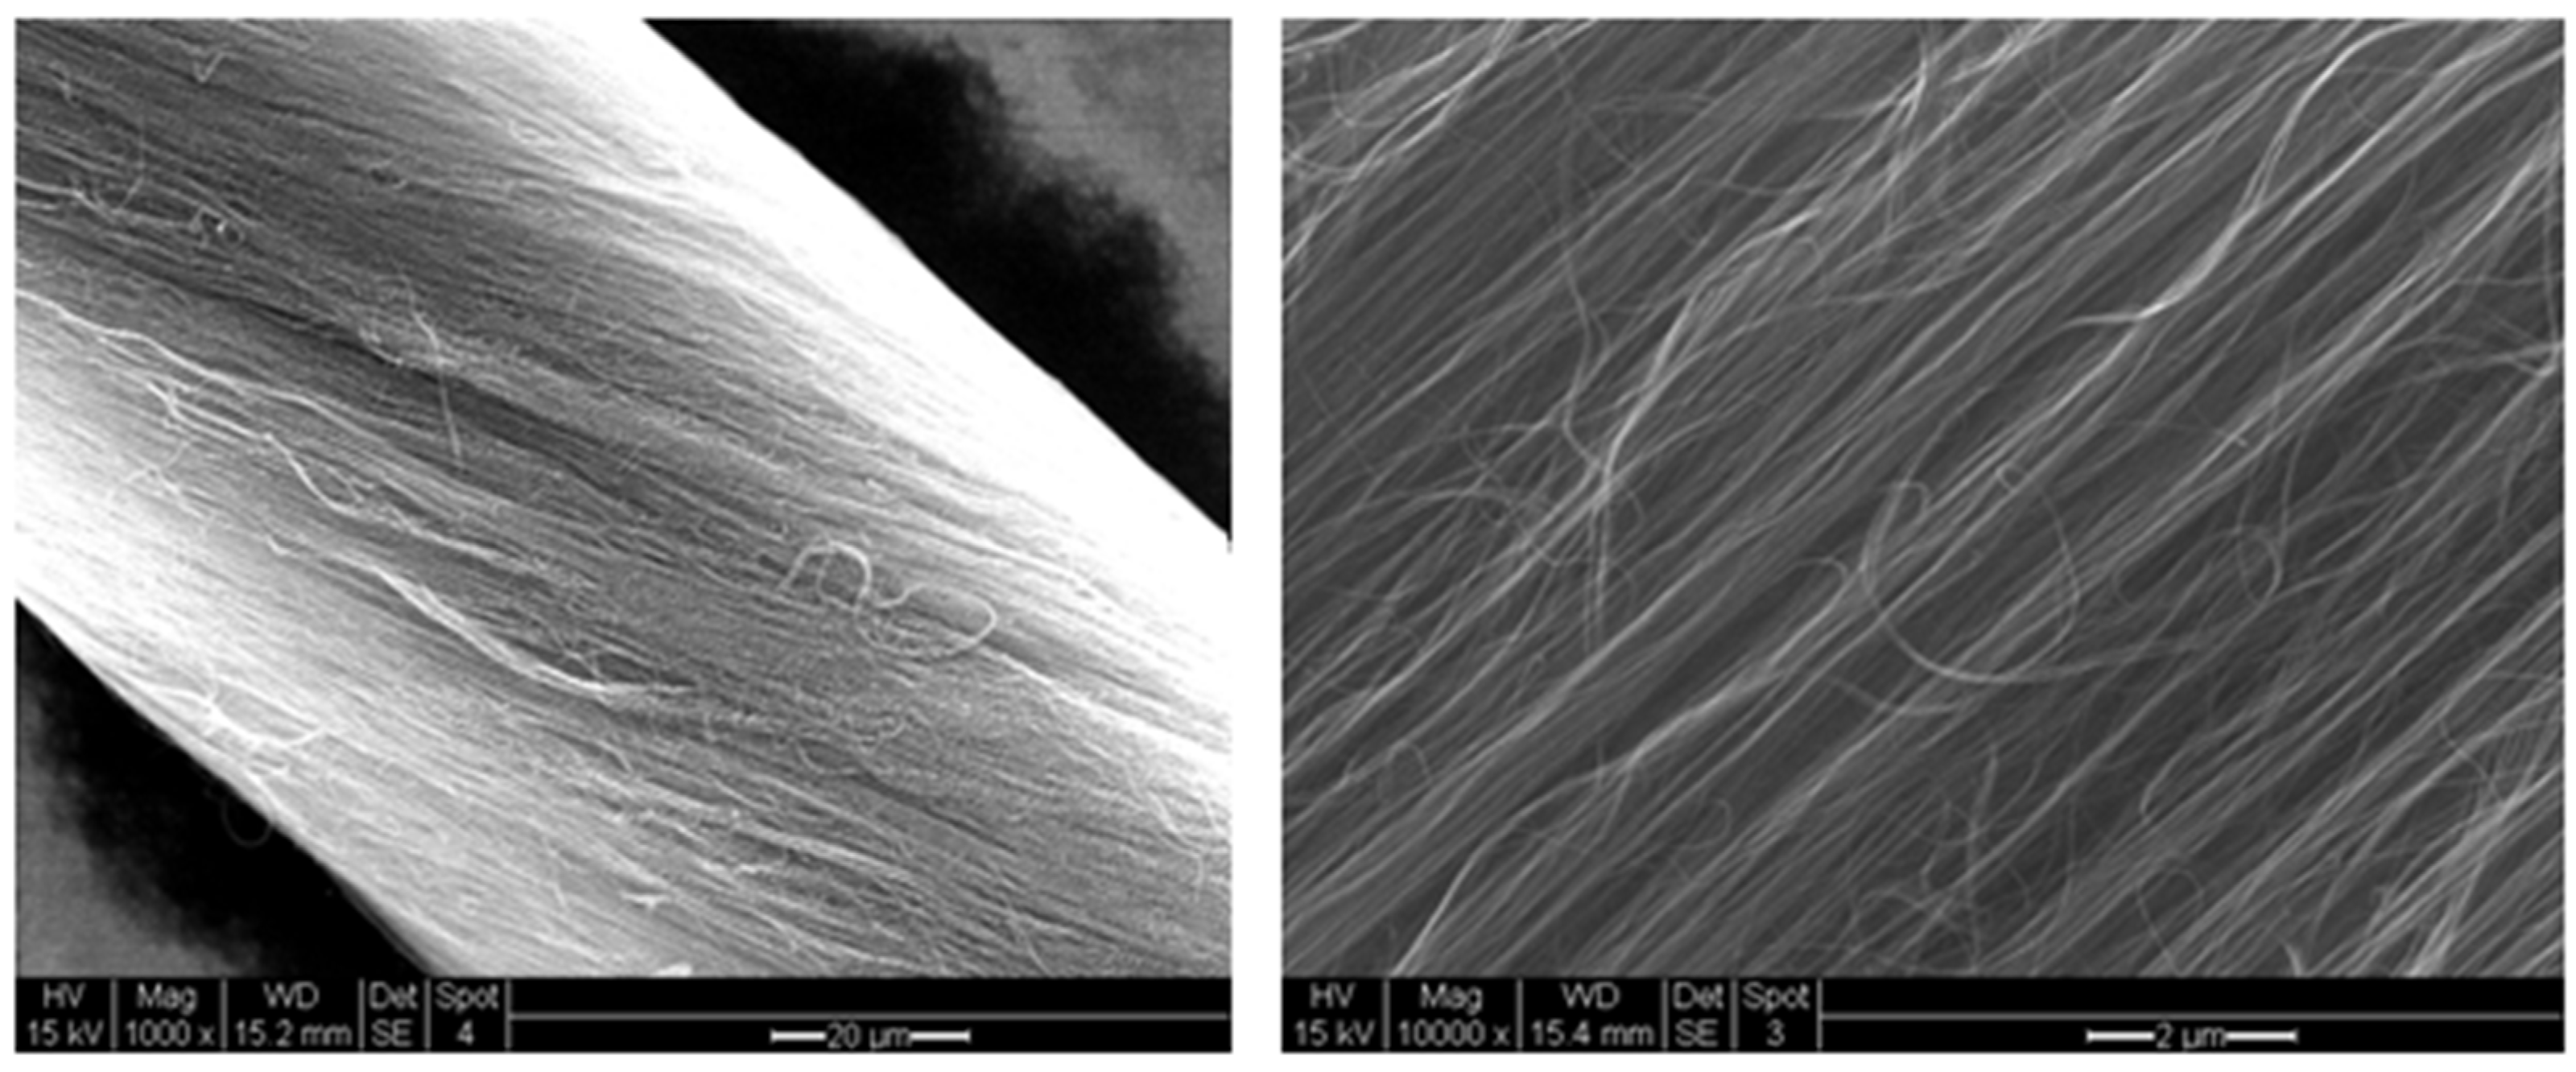
- Carbon nanotube thread
3. Results and Discussion
4. Conclusions
Supplementary Materials
Author Contributions
Funding
Acknowledgments
Conflicts of Interest
References
- Wang, Z.; Mi, B. Environmental Applications of 2D Molybdenum Disulfide (MoS2) Nanosheets. Environ. Sci. Technol. 2017, 51, 8229–8244. [Google Scholar] [CrossRef] [PubMed]
- Gu, M.; Choi, J.; Lee, T.; Park, M.; Shin, I.-S.; Hong, J.; Lee, H.-W.; Kim, B.-S. Diffusion controlled multilayer electrocatalysts via graphene oxide nanosheets of varying sizes. Nanoscale 2018, 10, 16159–16168. [Google Scholar] [CrossRef]
- Lin, L.; Zhou, W.; Gao, R.; Yao, S.; Zhang, X.; Xu, W.; Zheng, S.; Jiang, Z.; Yu, Q.; Li, Y.-W.; et al. Low-temperature hydrogen production from water and methanol using Pt/α-MoC catalysts. Nat. Cell Biol. 2017, 544, 80–83. [Google Scholar] [CrossRef]
- Wang, J.; Cui, W.; Liu, Q.; Xing, Z.; Asiri, A.M.; Sun, X. Recent Progress in Cobalt-Based Heterogeneous Catalysts for Electrochemical Water Splitting. Adv. Mater. 2016, 28, 215–230. [Google Scholar] [CrossRef]
- Eftekhari, A. Electrocatalysts for hydrogen evolution reaction. Int. J. Hydrogen Energy 2017, 42, 11053–11077. [Google Scholar] [CrossRef]
- Thornburg, N.A.; Abdelrehim, I.M.; Land, N.P. Kinetics of Propene Desorption from Pd(111) Studied by Thermal Desorption Spectroscopy and Laser-Induced Thermal Desorption with Fourier Transform Mass Spectrometry. J. Phys. Chem. B 1999, 103, 8894–8898. [Google Scholar] [CrossRef]
- Zaluska, A.; Zaluski, L.; Ström–Olsen, J. Nanocrystalline magnesium for hydrogen storage. J. Alloys Compd. 1999, 288, 217–225. [Google Scholar] [CrossRef]
- Castro, F.; Meyer, G.; Zampieri, G. Effects of sulfur poisoning on hydrogen desorption from palladium. J. Alloys Compd. 2002, 330–332, 612–616. [Google Scholar] [CrossRef]
- Redhead, P. Thermal desorption of gases. Vacuum 1962, 12, 203–211. [Google Scholar] [CrossRef]
- Huot, J.; Liang, G.; Schulz, R. Mechanically alloyed metal hydride systems. Appl. Phys. A 2001, 72, 187–195. [Google Scholar] [CrossRef]
- Ballenweg, S.; Gleiter, R.; Krätschmer, W. Hydrogenation of buckminsterfullerene C60 via Hydrozirconation: A new way to organofullerenes. Tetrahedron Lett. 1993, 34, 3737–3740. [Google Scholar] [CrossRef]
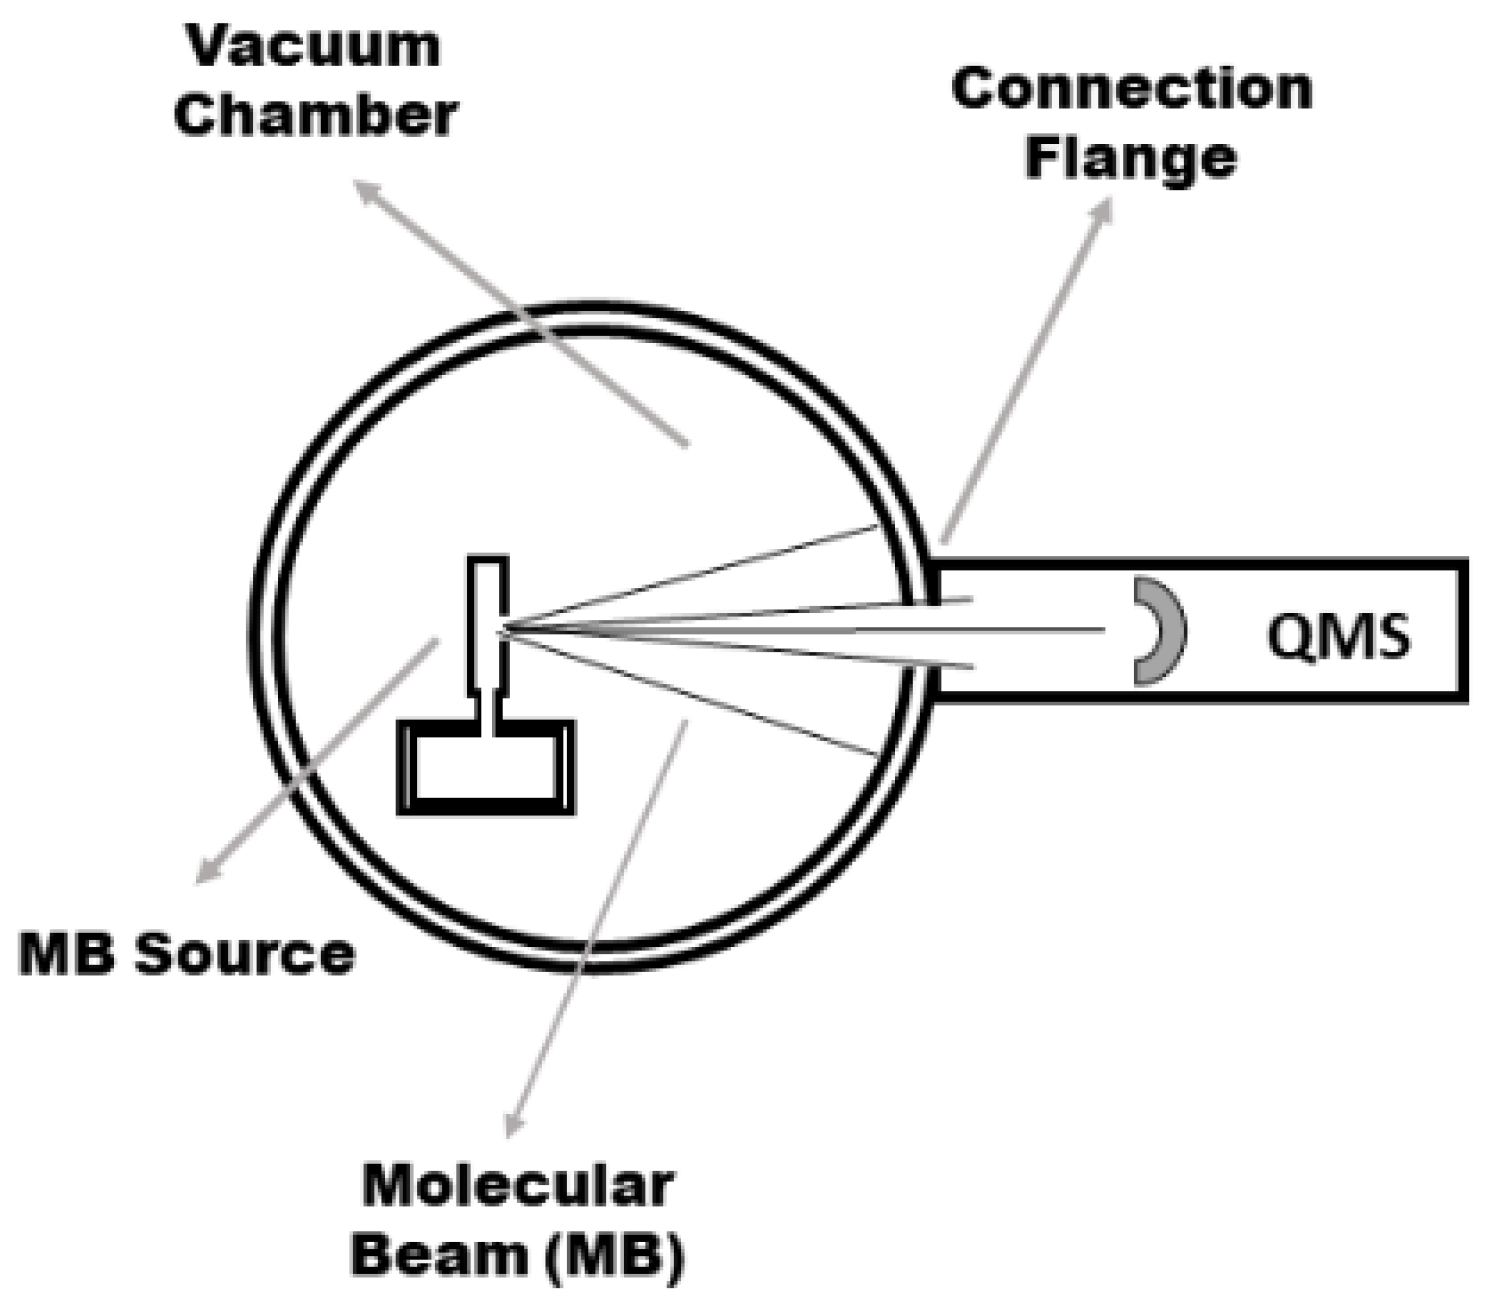
- Lobo, R.F.M.; Berardo, F.M.V.; Ribeiro, J.H.F. Molecular beam-thermal hydrogen desorption from palladium. Rev. Sci. Instrum. 2010, 81, 43103. [Google Scholar] [CrossRef]
- Lobo, R.F.M.; Santos, D.M.F.; Sequeira, C.A.C.; Ribeiro, J.H.F. Molecular Beam-Thermal Desorption Spectrometry (MB-TDS) Monitoring of Hydrogen Desorbed from Storage Fuel Cell Anodes. Materials 2012, 5, 248–257. [Google Scholar] [CrossRef]
- Merzlikin, S.V.; Borodin, S.; Vogel, D.; Rohwerder, M. Ultra high vacuum high precision low background setup with temperature control for thermal desorption mass spectroscopy (TDA-MS) of hydrogen in metals. Talanta 2015, 136, 108–113. [Google Scholar] [CrossRef]
- Hanna, T.; Hiramatsu, H.; Sakaguchi, I.; Hosono, H. Highly hydrogen-sensitive thermal desorption spectroscopy system for quantitative analysis of low hydrogen concentration (∼1 × 10¹⁶ atoms/cm3) in thin-film samples. Rev. Sci. Instrum. 2017, 88, 53103. [Google Scholar] [CrossRef]
- Miyase, T.; Watanabe, K.; Sakaguchi, I.; Ohashi, N.; Domen, K.; Nomura, K.; Hiramatsu, H.; Kumomi, H.; Hosono, H.; Kamiya, T. Roles of Hydrogen in Amorphous Oxide Semiconductor In-Ga-Zn-O: Comparison of Conventional and Ultra-High-Vacuum Sputtering. ECS J. Solid State Sci. Technol. 2014, 3, Q3085–Q3090. [Google Scholar] [CrossRef]
- Woodruff, D.P. Modern Techniques of Surface Science; Cambridge University Press (CUP): Cambridge, UK, 1994. [Google Scholar] [CrossRef]
- Yates, J. Solid State Physics: Methods of Experimental Physics; Park, R., Lagally, M., Eds.; Academic Press: New York, NY, USA, 1985; Volume 22, ISBN-13: 978-0124759640. [Google Scholar]
- Beeby, J.L. The theory of desorption. Crit. Rev. Solid State Mater. Sci. 1978, 7, 153–166. [Google Scholar] [CrossRef]
- Chen, Z.; Ren, W.; Gao, L.; Liu, B.; Pei, S.; Cheng, H.-M. Three-dimensional flexible and conductive interconnected graphene networks grown by chemical vapour deposition. Nat. Mater. 2011, 10, 424–428. [Google Scholar] [CrossRef]
- Chen, B.; Ma, Q.; Tan, C.; Lim, T.-T.; Huang, L.; Zhang, H. Carbon-Based Sorbents with Three-Dimensional Architectures for Water Remediation. Small 2015, 11, 3319–3336. [Google Scholar] [CrossRef]
- Kabiri, S.; Tran, D.N.H.; Cole, M.A.; Losic, D. Functionalized three-dimensional (3D) graphene composite for high efficiency removal of mercury. Environ. Sci. Water Res. Technol. 2016, 2, 390–402. [Google Scholar] [CrossRef]
- Hsieh, Y.-Y.; Zhang, L.; DeArmond, D.; Kanakaraj, S.N.; Adusei, P.K.; Alvarez, N.T.; Fang, Y.; Daum, J.; Shanov, V. Integrated graphene-sulfur cathode and separator with plasma enhancement for Li-S batteries. Carbon 2018, 139, 1093–1103. [Google Scholar] [CrossRef]
- Zhang, L.; DeArmond, D.; Alvarez, N.T.; Malik, R.; Oslin, N.; McConnell, C.; Adusei, P.K.; Hsieh, Y.-Y.; Shanov, V. Flexible Micro-Supercapacitor Based on Graphene with 3D Structure. Small 2017, 13. [Google Scholar] [CrossRef]
- Zhang, L.; DeArmond, D.; Alvarez, N.T.; Zhao, D.; Wang, T.; Hou, G.; Malik, R.; Heineman, W.R.; Shanov, V. Beyond graphene foam, a new form of three-dimensional graphene for supercapacitor electrodes. J. Mater. Chem. A 2015, 4, 1876–1886. [Google Scholar] [CrossRef]
- Zhang, L.; Alvarez, N.T.; Zhang, M.; Haase, M.; Malik, R.; Mast, D.; Shanov, V. Preparation and characterization of graphene paper for electromagnetic interference shielding. Carbon 2015, 82, 353–359. [Google Scholar] [CrossRef]
- Alvarez, N.T.; Miller, P.; Haase, M.; Kienzle, N.; Zhang, L.; Schulz, M.J.; Shanov, V. Carbon nanotube assembly at near-industrial natural-fiber spinning rates. Carbon 2015, 86, 350–357. [Google Scholar] [CrossRef]
- Alvarez, N.T.; Miller, P.; Haase, M.R.; Lobo, R.; Malik, R.; Shanov, V. Tailoring physical properties of carbon nanotube threads during assembly. Carbon 2019, 144, 55–62. [Google Scholar] [CrossRef]
- Jayasinghe, C.; Chakrabarti, S.; Schulz, M.J.; Shanov, V. Spinning yarn from long carbon nanotube arrays. J. Mater. Res. 2011, 26, 645–651. [Google Scholar] [CrossRef]
- Oberoi, A.S.; Nijhawan, P.; Singh, P. A Novel Electrochemical Hydrogen Storage-Based Proton Battery for Renewable Energy Storage. Energies 2018, 12, 82. [Google Scholar] [CrossRef]
- Jurewicz, K.; Frackowiak, E.; Béguin, F. Towards the mechanism of electrochemical hydrogen storage in nanostructured carbon materials. Appl. Phys. A 2004, 78, 981–987. [Google Scholar] [CrossRef]
- King, D.A. Thermal desorption from metal surfaces: A review. Surf. Sci. 1975, 47, 384–402. [Google Scholar] [CrossRef]
- O’Connor, D.; Sexton, A.; Smart, R. Surface Analysis Methods in Materials Science; Springer Science & Business Media: Berlin/Heidelberg, Germany, 2013; ISBN 978-3-662-02767. [Google Scholar]
- Lobo, R.; Berardo, F.; Ribeiro, J. In-situ monitoring of lowermost amounts of hydrogen desorbed from materials. Int. J. Hydrogen Energy 2010, 35, 11405–11411. [Google Scholar] [CrossRef]
- Schlapbach, L.; Züttel, A. Hydrogen-storage materials for mobile applications. Nat. Cell Biol. 2001, 414, 353–358. [Google Scholar] [CrossRef] [PubMed]
- Kowalczyk, P.; Hołyst, R.; Terrones, M.; Terrones, H. Hydrogen storage in nanoporous carbon materials: Myth and facts. Phys. Chem. Chem. Phys. 2007, 9, 1786–1792. [Google Scholar] [CrossRef] [PubMed]
- Jurewicz, K. Influence of charging parameters on the effectiveness of electrochemical hydrogen storage in activated carbon. Int. J. Hydrogen Energy 2009, 34, 9431–9435. [Google Scholar] [CrossRef]
- Mohan, M.; Sharma, V.K.; Kumar, E.A.; Gayathri, V. Hydrogen storage in carbon materials—A review. Energy Storage 2019, 1, e35. [Google Scholar] [CrossRef]
- Babel, K.; Janasiak, D.; Jurewicz, K. Electrochemical hydrogen storage in activated carbons with different pore structures derived from certain lignocellulose materials. Carbon 2012, 50, 5017–5026. [Google Scholar] [CrossRef]
- Lyu, J.; Kudiiarov, V.; Lider, A. An Overview of the Recent Progress in Modifications of Carbon Nanotubes for Hydrogen Adsorption. Nanomaterials 2020, 10, 255. [Google Scholar] [CrossRef]
- Guo, Z.; Ng, S.H.; Wang, J.; Huang, Z.; Liu, H.K.; Too, C.O.; Wallace, G.G. Electrochemical Hydrogen Storage in Single-Walled Carbon Nanotube Paper. J. Nanosci. Nanotechnol. 2006, 6, 713–718. [Google Scholar] [CrossRef]
- Liu, C.; Fan, Y.Y.; Liu, M.; Cong, H.T.; Cheng, H.M.; Dresselhaus, M.S. Hydrogen Storage in Single-Walled Carbon Nanotubes at Room Temperature. Science 1999, 286, 1127–1129. [Google Scholar] [CrossRef]
- Liu, D.; Zeng, C.; Tang, H.; Zheng, D.; Li, R.; Qu, D.; Xie, Z.; Lei, J.; Xiao, L.; Qu, D. Electrochemical Hydrogen Storage in a Highly Ordered Mesoporous Carbon. Front. Energy Res. 2014, 2, 1–6. [Google Scholar] [CrossRef]
- Dillon, A.; Jones, K.; Bekkedahl, T.; Klangt, C.; Bethunet, D.; Heben, M. Storage of hydrogen in single-walled carbon nano-tubes. Nature 1997, 386127, 377–378. [Google Scholar] [CrossRef]
- Shiraishi, M.; Takenobu, T.; Yamada, A.; Ata, M.; Kataura, H. Hydrogen storage in single-walled carbon nanotube bundles and peapods. Chem. Phys. Lett. 2002, 358, 213–218. [Google Scholar] [CrossRef]


Publisher’s Note: MDPI stays neutral with regard to jurisdictional claims in published maps and institutional affiliations. |
© 2021 by the authors. Licensee MDPI, Basel, Switzerland. This article is an open access article distributed under the terms and conditions of the Creative Commons Attribution (CC BY) license (https://creativecommons.org/licenses/by/4.0/).
Share and Cite
Lobo, R.; Alvarez, N.; Shanov, V. Hydrogen Nanometrology in Advanced Carbon Nanomaterial Electrodes. Nanomaterials 2021, 11, 1079. https://doi.org/10.3390/nano11051079
Lobo R, Alvarez N, Shanov V. Hydrogen Nanometrology in Advanced Carbon Nanomaterial Electrodes. Nanomaterials. 2021; 11(5):1079. https://doi.org/10.3390/nano11051079
Chicago/Turabian StyleLobo, Rui, Noe Alvarez, and Vesselin Shanov. 2021. "Hydrogen Nanometrology in Advanced Carbon Nanomaterial Electrodes" Nanomaterials 11, no. 5: 1079. https://doi.org/10.3390/nano11051079
APA StyleLobo, R., Alvarez, N., & Shanov, V. (2021). Hydrogen Nanometrology in Advanced Carbon Nanomaterial Electrodes. Nanomaterials, 11(5), 1079. https://doi.org/10.3390/nano11051079