Abstract
Anionic S2−-doped TiO2 nanorod arrays (S2−-TiO2) were synthesized by a facile and controllable vapor-phase hydrothermal (VPH) approach based on the sulfur source of H2S gas. After the VPH treatment of TiO2 nanorod arrays (TNA), the isolated O2− species replaces the S2− ion in TiO2 (TiO2−xSx). The structural, morphological, optical, compositional, photocatalytic and photoelectrochemical (PEC) properties of the obtained samples were investigated in detail. It was found that S2−-TiO2 can enhance the separation rate of electron–hole pairs, improve the absorption of visible light, and augment the photocatalytic and photoelectrochemical properties. Anionic S2− doping can significantly adjust the absorption cut-off wavelength (409.5–542.5 nm) and shorten the bandgap (3.05-2.29 eV) of TNA. For the degradation of methylene orange (MO) under mercury lamp light, the 0.24 At%S2−-TiO2 (0.24S2−-TiO2) sample exhibited the best photogradation efficiency of 73% in 180 min compared to bare TiO2 (46%). The 0.24S2−-TiO2 showed the highest photocurrent of 10.6 μA/cm2, which was 1.73 times higher than that of bare TiO2 (6.1μA/cm2). The results confirmed that the visible light absorption, photocurrent and photocatalytic activity optimization of TNA are closely related not only to anionic S2−-doped but also different ratios of anionic S2−-doped. It is noteworthy that the VPH approach is very promising for applications in low cost and highly efficient ion doping into nanomaterials for energy devices.
1. Introduction
Since the 1970s, titanium dioxide (TiO2) has been recognized as a promising solar-driven photocatalyst due to its high availability, efficiency, excellent functionality, long-term stability, nontoxicity and low cost [1]. However, there are two main problems in the application of TiO2: the low separation efficiency of photoinduced electron–hole pairs and the wide bandgap (3.0 eV for rutile and 3.2 eV for anatase). It can only use the ultraviolet region of solar light and photocatalytic activity is limited [1,2,3]. Introducing exterior element doping into material structures has been proven to be an effective approach. Therefore, many reports have indicated that using various ions (C, N, F, S, Fe, Co, Ag, Ni) doped into TiO2 narrows the bandgap of TiO2 and improves the photocatalytic activity of TiO2 under visible light [4,5,6,7,8]. Seed growth, chemical vapor deposition (CVD), hydrothermal and sol-gel methods synthesize various element-doped TiO2 common routes. However, transition (Fe, Co, Ag, Ni) metal-doped TiO2 has a high electron–hole recombination rate [7,8]. To overcome that disadvantage, non-metal-doped TiO2 has been synthesized by intensive efforts [9]. Sulfur is one of the most common non-metal elements, and is easy to synthesize, has a low manufacture cost and is easily industrialized. By theoretical calculation, anionic S has a larger ionic radius compared to O, N and F, which visibly modifies the electronic structures of TiO2 and narrows the TiO2 bandgap. Umebayashi et al. synthesized S-doped TiO2 for the photocatalytic degradation of methylene blue in visible light [10,11,12]. Interestingly, unlike other elements, S tends to have two species (cations S4+/S6+ and anionic S2−). The occurrence of an anionic or cationic state is considered to be dependent on the location in TiO2: in substitution for either O or Ti atoms [2,11]. Yamamoto et al. reported their theoretical results on S-doped rutile TiO2, showing the necessity of experiments to investigate different chemical species of S-doped TiO2 [13,14].
In previous experimental works on S-doped TiO2, cations S4+ (Ti1−2xO2S2x) and S6+ (Ti1−3xO2S2x) were used instead of Ti4+, which shows a slight optical absorption shift from the ultraviolet region to the visible light region (near 40 nm) and the optical effect was not obvious [13,14,15,16,17]. The first principle calculations revealed that anionic sulfur (S2−)-doped TiO2 shows completely different spectral behavior compared to that of bare TiO2 and of cationic S4+/S6+-doped TiO2. Anionic S2−-doped TiO2 has a broad absorption spectrum (400–700 nm), which greatly reduces the bandgap and improves the photocatalytic activity under visible light [2,12]. This is due to new occupied and strongly localized electronic states which are formed in the gap, the anionic S3p electron orbitals form shallow impurity levels in the bandgap, located about 0.9–1.6 eV above the TiO2 valence band [13].
While experiments have confirmed that both (anionic or cationic) states of S ions are simultaneously doped into TiO2 nanotubes [2], only one chemical species of anionic S2−-doped TiO2 has rarely been observed in the experimental stage. To this extent, the main reason is that a single anionic S2− source is not easy to synthesize in the conventional experiment. H2S is a good source of S2−. In this work, we speculate that the vapor-phase hydrothermal (VPH) process could be superior to that of conventional liquid-phase hydrothermal (LPH) processes for collecting H2S gas and providing a single anionic S2− source for the experiment [17,18,19,20]. Compared with the traditional LPH method, all the reactions are triggered by volatile reactants and reflect on the substrate surface [18]. The VPH process differs dramatically from LPH processes in which the chemical forms and available concentrations of substance can be affected by many factors (solution composition, pH and the concentration), yet these factors hardly affect the VPH process [17]. Under VPH conditions, to achieve high concentrations of anions, S2−-doped TiO2 is easier to implement and more operationally controllable compared to the LPH process [19,20]. Until now, it has rarely been reported that only one chemical species of anionic S2−-doped TiO2 can shorten the optical bandgap and promote the utilization of the solar energy spectrum. In this paper, only one species of anionic S2− (not cations S4+ and S6+) -doped TNA is observed, which is different from the previous works about the introduction of induced S (S2−, S4+, S6+)-doped TiO2 nanotubes. In order to realize only one species of anionic S2−-doped TiO2, TNA with tiny size is selected by as the precursor, whose special structure made it possess a high reaction activity and facilitate the diffusion of S2− into TiO2 by the VPH method.
2. Experimental
2.1. Preparation of Anionic S2−-TiO2 Nanorod Arrays
MaterialsTetrabutyl titanate C16H36O4Ti, 37% hydrochloric acid (HCl), Ferrous sulfide (FeS), deionized water and absolute ethanol were used for the sample preparation. All the chemicals and reagents were of analytical grade and used without further purification.
Using C16H36O4Ti (TBT) as the Ti source, H2S, prepared from FeS and hydrochloric acid (HCl), was used as an anionic S2− source, S2−-TiO2 was prepared by VPH. The S2−-doped TNA was prepared using a two-step method. First, the TNA was fabricated using a simple hydrothermal method. In detail, 15 mL HCl (10 mol per liter) and 15 mL deionized water were mixed in a 50 mL beaker, followed by the addition of 0.5 mL of TBT. The mixture is stirred for 20 min, then transferred to a teflon-lined autoclave (50 mL). Pre-cleaning fluorine-doped tin oxide film (FTO) was used as a substrate (1.5 cm × 3 cm) and the mixture was injected into a polytetrafluoroethylene-lined cylindrical autoclave. The TNA was formed by heating for 12 h at 150 °C [3]. Secondly, the TNA was in situ doped in the VPH reactor (about 150 mL teflon-lined autoclave), where H2S gas was produced slowly by FeS and HCl reaction [21,22]. The chemical processes of FeS and HCl are as follows:
This formula is used because it can yield single H2S gas from a cheap source of FeS; although it can be performed at room temperature, in order to improve the efficiency of H2S production, FeS and HCl were placed in the VPH reactor where the TNA, on FTO substrate, was held above the reactants. The overall formation process of S2−-TNA was realized by VPH as illustrated in Scheme 1 and Figure 1 (Supporting Information) [17].
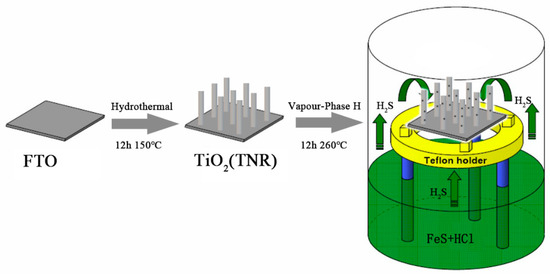
Scheme 1.
Fabrication procedure of S2−-TiO2 by the vapor-phase hydrothermal (VPH) approach.
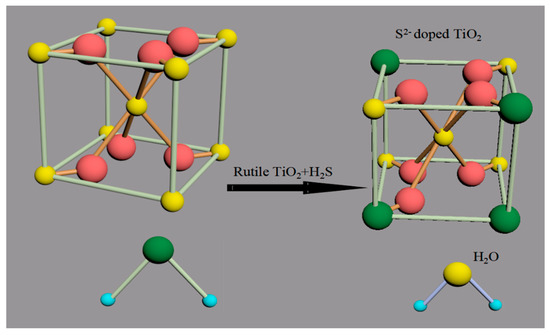
Figure 1.
Schematic diagram of the S2−-doped rutile TiO2 crystal growth process.
As the reaction proceeded, H2S was used as anionic S2− precursor, and a part of the O2− ions in the rutile TiO2 crystal are replaced by S2− ions and ultimately S2−-TiO2 formation, as shown in Figure 1.
In the VPH processes, TNA used as a substrate, as it is well known that the gas concentration provided for VPH treatment essentially drives the interaction between the original TiO2 crystal and H2S gas [17]. Therefore, the concentration of H2S was studied in the second aspect. The VPH treatments were carried out at different masses of FeS (2.2, 4.4, 6.6 g) and volumes of HCl (5, 10, 15 mL) in a duration (12 h for 260 °C). Unfortunately, when there is a mass of 8.8 g FeS and 20 mL of HCl, a large amount of HCl liquid boils at 260 °C, causing the TNA to be destroyed and the anion doping cannot be achieved. By theoretical calculations, (2.2, 4.4, 6.6, 8.8 g) the FeS complete reaction under standard conditions (0 °C, 100 kPa) produced 560 mL, 1120 mL, 1680 mL, and 2240 mL of H2S gas, respectively. The H2S gas produced is much larger than the volume of the VPH reactor (150 mL), resulting in an increase in the internal pressure, which is beneficial to replace O2− with S2− ions. The duration of the VPH was set to 12 h and the aim is to make VPH react to completely dope at 260 °C. The VPH reaction was carried out at 260 °C for 12 h, then the autoclave was removed from the oven and allowed to cool to room temperature. Before optical testing or structural characterization, the S2−-TiO2 was washed with deionized water to remove the sulfur produced during the VPH treatment.
2.2. Characterizations
The microstructures of samples were studied by an X-ray diffractometer (XRD, M18XHF, Tokyo, Japan) with Cukα radiation (λ = 0.154 nm) operated at 40 kV and 30 mA. The morphological and structural information of samples was characterized using field emission scanning electron microscopy (SEM, Hitachi-S4800, Dallas, TX, USA), a transmission electron microscope (TEM, HITACHI, Tokyo Japan) and the attached energy dispersive X-ray (EDX) spectroscopy. The chemical composition and quantitative investigation of chemical states of various elements in films is performed by X-ray photoelectron spectroscopy (XPS, Ulvac-Phi 5000 Versaprobe, hermo-VG Scientific, West Sussex, UK). The measurement absorption intensity (by direct transmittance measurements) and calculation of the bandgap of the samples were characterized by an ultraviolet-visible spectrophotometer (UV-vis, Shimadzu, Shanghai, China).
2.3. Photoelectrochemical and Photocatalytic Measurements
Photoelectrochemical (PEC) properties of the samples were tested on an electrochemical workstation (CHI 660D, Chenhua, Shanghai, China). Na2SO4 aqueous solution (0.1 M) was used as the electrolyte, and a 150 W Xe lamp (150 A, Zolix, Shanghai, China) was used as the working electrode of light sourcing. The optical responses of different samples were measured by a 20s optical switch period with a bias voltage of 0 V.
A diagram of the photocatalytic experimental setup is illustrated in Scheme 2. The photocatalytic properties of the samples were evaluated by monitoring the photodegradation of methylene orange (MO) under simulated solar light at ambient atmospheric pressure and temperature. The photodegradation efficiency of the samples was tested by simulating sunlight exposure (full spectrum). A 25 W mercury lamp was used as the full spectrum source. In the test, the sample (1 cm × 1.5 cm) was immersed in an oval beaker of 10 mL MO solution. Before the test, the dye solution was kept in the dark for 30 min to achieve an equilibrium of adsorption and desorption between the sample and the dye. The distance between the lamp and the sample is maintained at approximately 10 cm. At the same intervals, 5 mL of the MO solution was collected and the concentration of the MO solution was analyzed using a UV-vis spectrophotometer (UV-vis, Shimadzu, Shanghai, China). At the end of each test, the solution was carefully returned to the reaction beaker and the reaction was continued until the degradation of a sample was almost complete.
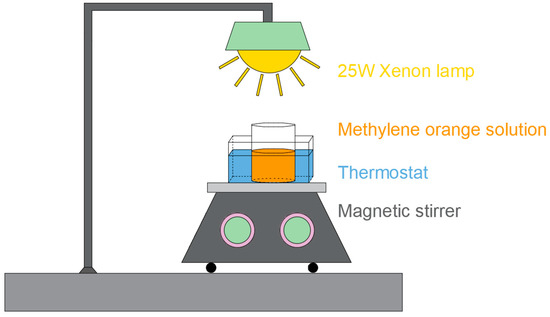
Scheme 2.
Schematic diagram of photocatalytic reaction facility.
3. Results and Discussion
3.1. Microstructure Analysis
Figure 2 shows the XRD patterns of TiO2, 0.07 At%S2−-TiO2 (0.07S2−-TiO2), 0.11 At%S2−-TiO2 (0.11S2−-TiO2) and 0.24 At%S2−-TiO2 (0.24S2−-TiO2) samples. XRD patterns were recorded for the TiO2 with different S2−-doped percentages. Figure 2a shows XRD data of the samples before and after VPH doping, showing similar diffraction patterns, which may be attributed to the TiO2 crystal structure of rutile phase. Diffraction dominating peaks centered at 2θ = 36.0°, 41.2°, 54.3°, and 62.7° are ascribed to (101), (111), (211) and (002) planes of rutile TiO2 (JCPDS 21-1276), respectively. However, the sulfur diffraction peak cannot be detected in the XRD pattern, which is mainly due to the strong diffraction intensity of rutile TiO2 and the low content of sulfur ion. These favorable results indicate that VHP can hardly change the crystal structure. In addition, the slight displacement of the diffraction peak after VPH doping indicates an increase in the lattice strain due to the addition of sulfur to the lattice. The calculation method of crystal surface spacing is based on the Bragg equation;
where d is the spacing between crystal planes, 2θ is the diffraction angle, λ is the wavelength fixed by the instrument (λ = 0.154 nm), this formula asserting that the smaller the angle, the bigger the d. In geometry, the direct effect of replacing O with a larger radius of S ion should be the expansion of TiO2 crystal planes. By doping anionic S2− ions with different ratios into TNA, the diffraction peak is slightly shifted to a low angle compared with the original TNA, due to the radius of the sulfur ion being larger than the radius of the oxygen ion (S2− = 2.05 Å and O2− = 1.44 Å) [23,24]. Figure 2b shows the S2−-doped TNA diffraction peaks being slightly shifted, which is mainly realized in (101) peaks. The calculation results show that the expansion of unit plane spacing caused by S-doping exists regardless of the doping level and the XRD spectral line shifts to a smaller angle more obvious with the increase of doping ratio. Interestingly, noteworthy is that the half-width peak was getting bigger, especially in (101), as shown in Figure 2b. In fact, there may be two reasons for the widening of the diffraction peak: the grain size is small for a moment, and there is a “microscopic strain” inside the grain. Here, it may be the latter, which indicates that perhaps the anionic S2−-doped TiO2 have “microscopic strain” of the lattice. XRD results confirm that the structure of TNA, in the rutile phase of these samples, did not change significantly, but there is an obvious doping phenomenon.
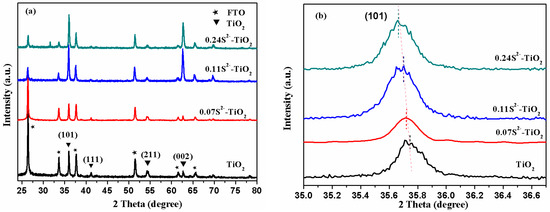
Figure 2.
(a) X-ray diffraction (XRD) pattern of TiO2 nanorod arrays (TNA), with different doping ratios. (b) The (101) planes diffraction peaks of S2−-TNA with different atomic percentage.
To gain insight into the morphological and microstructures of the as-synthesized TNA and S2−-TiO2, samples were performed using field emission scanning electron microscopy (SEM) and transmission electron microscope (TEM), as shown in Figure 3 and Figure 4.
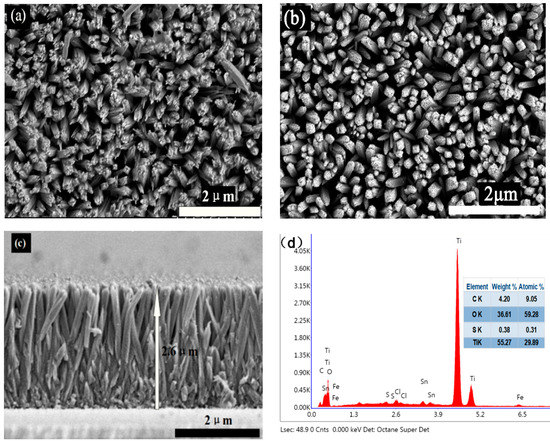
Figure 3.
Field emission scanning electron microscopy images of the samples: (a) top view of the 0.24S2−-TiO2 sample, (b) top view of bare TNA sample and (c) cross-section view of the 0.24S2−-TiO2 sample. (d) Energy dispersive X-ray (EDX) analysis of the 0.024S2−-TiO2 sample.
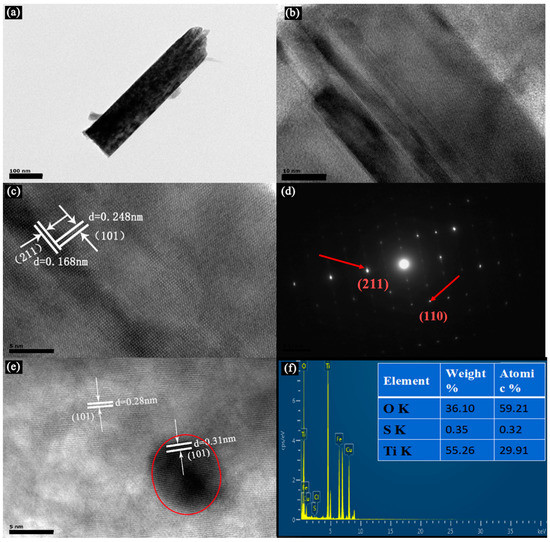
Figure 4.
(a) Transmission electron microscope (TEM) and (b,c,e) High-Resolution TEM (HRTEM) images of the 0.24S2−-TiO2 sample. (d) The electron diffraction diagram (SAED) patterns of the 0.24S2−-TiO2 sample. (f) Element mapping and EDX analysis of the 0.24S2−-TiO2 sample.
Figure 3a,b show a top view of the 0.24S2−-TiO2 and bare TNA. It is evident that TiO2 has a well-aligned nanorod array structure in the FTO, with an average diameter of 300 nm. Figure 3c shows a cross-section view of the 0.24S2−-TiO2 with a height of about 2.6 μm. Regarding the SEM images of samples before and after VPH treatment, the results indicated that the TNA treated with VPH has hardly significant structural or morphological changes, which is consistent with the XRD results. In addition, according to the EDX analysis in Figure 3d, the weight ratio of C, O, S, and Ti was determined to be 9.05%, 59.28%, 0.31%, and 29.89%, respectively. TEM and High-Resolution TEM (HRTEM) images in Figure 4 further indicate the morphology and structure of S2−-doped into TNA. Figure 4a shows the side view of a TiO2 nanorod, approximately 100 nm in diameter. The HRTEM images in Figure 4b,c clearly show two kinds of lattice fringes of bare TNA and 0.24 At%S2−-TiO2. It is estimated that the stripe spacing on the same side of TiO2 is different, and the crystal plane spacing of these two structures could be 0.28 nm and 0.31 nm, respectively, as shown in Figure 4e. The HRTEM images of samples before and after VPH treatment reveal that some large radius ions may dope into the TiO2 nanorod, resulting in weak lattice distortion. This phenomenon shows that a small part of ion substitution may effectively change the electron orbit and ensure the improvement of optical properties. Figure 4d shows the electron diffraction diagram (SAED) in the selected region, further verifying the TiO2 nanorod array by VPH can not be changed by the single crystal properties of a nanorod [3]. Similarly, Figure 4f analyzed EDX of the samples after VPH under TEM image, and the weight ratio of O, S, and Ti was determined to be 36.10%, 0.35%, and 55.26%, respectively. The EDX data of TEM and SEM image analysis are essentially the same.
3.2. XPS Analysis
XPS was used to further investigate the electronic state of the present elements in the near-surface region (about 10 nm). The chemical states and content of elements in TNA were analyzed by XPS, as shown in Figure 5.
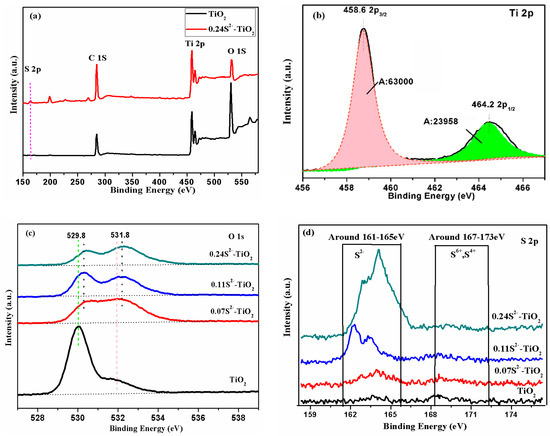
Figure 5.
X-ray photoelectron spectroscopy (XPS) spectra of the as-prepared samples: (a) survey, (b) Ti2p, (c) O1s, (d) S2p.
For comparison, the XPS spectra of the TiO2 and the 0.24S2−-TiO2 samples were analyzed. Figure 5a shows a wide-scan survey spectrum, S, O, Ti and C in the 0.24S2−-TiO2 sample and O, Ti, and C in the TiO2 sample can be clearly observed. It is proved that sulfur is doped into TNA by VPH.
The application of XPS in the quantitative analysis of elements is that the intensity signal of the measured spectral line is transformed into the content of elements, converting the area of the peak to the concentration of the corresponding elements. At present, the most widely used method is the element sensitivity factor method for quantitative analysis, using the formula:
where A and S represent the integral area of curve and sensitivity factors (C1s:1; O1s:2.88; S2p:1.88; Ti2p:6.47). According to the integral area of Figure 5b curve, the A (I × eV) of each element is calculated, as shown in Table 1.

Table 1.
The A (I × eV) of sample composition was obtained by XPS analysis and fitting peak.
After calculation, the results are shown in Table 2.

Table 2.
The atomic ratio of each element is obtained by calculation.
This shows that S was doped, and the TNA and S ion doping rate increases with the increase of FeS by VPH.
The calculations indicate that the ratio of O atom decreases and S gradually increases with the increase of H2S concentration. This conclusion implies that the S substitutes for a small number of O atoms. The main reason is that the thermal energy provided in the VPH treatment essentially drives the interaction between the bare TNA crystals and the H2S gas. However, the low ratio of S is due to the radius of the S2− ions, which is relatively large, and only a small amount of O ions can be replaced by S ions in the TiO2 crystal (O2− = 1.44 Å and S2− = 2.05 Å) [25,26]. The weak change of the lattice size of TiO2 is caused by the substitution of O by S, which is a good explanation for the small distortion spectrum of XRD. Figure 5d shows the oxidation state of the S atoms incorporated into the TiO2 particles, which is determined to be mainly S2− from XPS spectra. The XPS peak appeared in the region with the binding energy of 160–163 eV at the S2p nuclear level, which was believed to be due to the Ti-S bond formed when O2− was replaced by S2−, and the presence of S6+ and S4+ made binding energy peak in the range of 167–170 eV [27,28,29]. This result confirms that only one chemical state anionic S2− was successfully doped into TNA, which is different from the previous works about S-doped TiO2 that contained cationic S4+ and S6+ [30].
3.3. Optical Properties of S2−-TiO2 Nanorod Arrays
The absorption intensity and calculation of the bandgap of the samples were characterized by a UV-vis spectrophotometer, as shown in Figure 6. The absorption intensity was obtained from direct transmittance measurements.
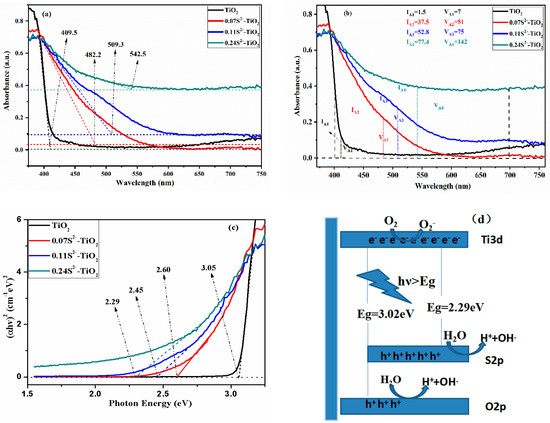
Figure 6.
(a) UV-Vis of S2−-doped TNA with different atomic percentage. (b) IA and VA of S2−-doped TNA with different atomic percentage. (c) The determination of the absorption edges of the samples. (d) Schematic diagram of the 0.24S2−-TiO2 and charge separation of system under visible light.
Compared to the bare TiO2, it was observed that S2−-TiO2 had obvious red shift and enhancement of visible light absorption, as shown in Figure 6a,b. In this paper, the intrinsic absorption intensity (IA) is defined as the integral area under the sample absorption curve from 400 nm to the cut-off wavelength range. It is estimated that the IA (I × nm) of 1.5, 37.5, 52.8, 77.4 corresponds to 0.00, 0.07, 0.11 and 0.24 doping anionic S2− levels, respectively, as shown in Figure 6b. The visible light absorption intensity (VA) is defined as the integral area under the sample absorption curve in the visible light region (400–700 nm). It is estimated that the VA (I × nm) of 7, 51, 75, 142 corresponds to 0.00, 0.07, 0.11 and 0.24 doping anionic S2− levels, respectively, as shown in Figure 6b. Figure 6a,c show S2− doping can significantly adjust the absorption cut-off wavelength from 409.5 nm to 542.5 nm and the bandgaps also decreased from 3.05 to 2.29 eV. Figure 6b also shows that intrinsic absorption values are different at different doping ratios. Interestingly, when the doping ratio is 0.11% and 0.24%, the absorption curve has a relatively weak absorption in the absorption spectrum besides S2−-TiO2 intrinsic absorption. It can be found that this absorption may be a doping energy level caused by S2− doping. However, many studies have shown the UV-vis absorption optical spectra and bandgap of S4+ or S6+-doped TiO2 (Table 3) [31,32], indicating that S2− doping is more pronounced. The bandgap (Eg) of the sample can be calculated by the cut-off absorb wavelength (λ) according to the formula: Eg = 1240/λ [33]. The result of the cut-off wavelength, absorption intensity of visible light, bandgap theoretical value and the bandgap of each sample are shown in Table 4.

Table 3.
Comparison of UV-vis absorption optical spectrum and bandgap of S-doped TiO2.

Table 4.
The cut-off wavelength, intrinsic absorption intensity (IA), visible light absorption intensity (VA), bandgap of theoretical value (Bandgap T) and bandgap of TiO2-doped with different ratios of anionic S2−.
The narrow bandgap and the high visible light absorption intensity suggest that S2−-TiO2 improves the absorption of visible light, so that the photoelectrochemical and photocatalytic properties can be improved.
Many experimental results and literature show that the cut-off wavelength of cationic S4+ or S6+-doped TiO2 did not change significantly (about 40 nm) [35,36]. It is only theoretically calculated that there is only one chemical species of anionic S2−-doped TiO2 UV-vis absorption, as few experiments have been verified [13]. Fortunately, in this paper, only one chemical state anionic S2− was successfully doped into TNA by VPH. Favorable experimental values are due to some S2− occupying the replacement of some O atoms on the TNA. The bare TiO2 band structure: the valence band maximum (VBM) is mainly composed of the O2p orbit, and the conduction band minimum (CBM) is mainly occupied by the Ti3d state. The S3p state is slightly higher than the upper edge of the bare TiO2 valence band (O2p) [36]. Harb et al. calculates the optical absorption of anionic S2− doping in bulk anatase TiO2 by first-principle calculations. It has been confirmed that anionic S2−-TiO2 provides new occupied and strongly localized electronic states in the gap, situated at about 0.9–1.6 eV above VBM of anatase TiO2, which causes the absorption red shift [13]. Some of the new electron transitions are from S3p orbit to Ti3d orbit, which results in the broad visible-light absorption and narrow bandgap, as shown in Figure 6d. It is noteworthy that the 0.24S2−-TiO2 bandgap shortens 0.76 eV, as it is good to verify the theoretical results of the anionic S2−-doped TiO2.
3.4. Photoresponse
The generation and transport efficiency of the excited electron for S2−-doped and bare TNA were studied by transient photocurrent response experiments. The optical response performance of the electrode was carried out under the irradiation of simulated sunlight. Figure 7 shows the photocurrent–time characteristics of the S2−-doped and bare TNA. It was clear that all photoanodes had a fast and good optical response. Under dark conditions, the photocurrent density is almost zero, while the current density increases immediately after intermittent light is turned on. In particular, the photocurrent of the samples gradually increases with increasing S2−. Figure 7 shows the current density of different ratios; S2−-doped is about 1.16 times, 1.35 times and 1.74 times higher than that of bare TNA, respectively. This shows more efficient transfer performance of interfacial electrons with an increase in the S2− ratio. The result shows low concentration single-ion doping TNA has an ideal effect on PEC properties.
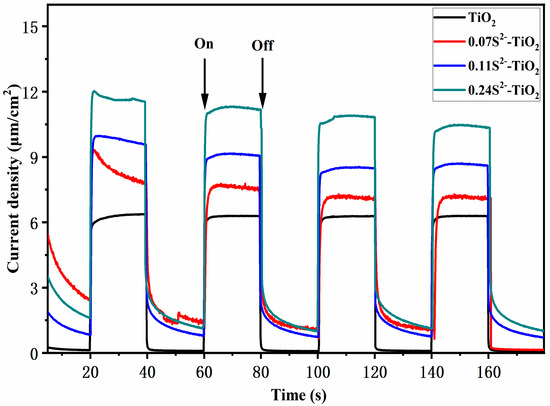
Figure 7.
Transient photocurrent responses of different samples.
3.5. Photocatalytic Activity Measurements
MO is a common refractory organic pollutant that is not volatile. Its chemical structure belongs to most kinds of azo dyes. Therefore, taking MO as the research object has certain representativeness. With 25 W mercury lamp as the light source, TiO2 and different ratios of S2−-TiO2 samples were a photocatalyst, and MO was the target degradant. The decolorization rate was measured by UV-vis spectrophotometry, which was attributed to 462.2 nm, corresponding to the absorption peak of the azo structure in MO. In each experiment, the samples were immersed in a rectangular quartz cell containing a 12 mL of MO solution (25 mg/L). Before the experiment, different samples were put into MO for dark adsorption for 2 h, so that MO could reach the maximum adsorption equilibrium on the photocatalyst surface. The experimental environment is identical, except for the samples. Then, the photocatalytic reaction was carried out and the degradation efficiency was measured by UV-vis regular sampling. The degradation efficiency of pollution after UV irradiation of OM was calculated based on the relationship between absorbance and concentration,
where C0 and A0 represent the initial concentration and absorbance, Ct and At represent the concentration and absorbance after t min reaction of the MO at the characteristic absorption wavelength of 464.2 nm.
Figure 8 shows that the photocatalytic activity of samples is evaluated by the degradation of MO under a 25 W mercury lamp. With the increasing exposure time, the characteristic absorption peak of MO at 462.2 nm drastically decreases. Figure 8a–d show photodegradation curves of MO using samples under the 25 W mercury lamp for various durations, respectively. Figure 8e,f show the MO degradation rate of bare TiO2, 0.07S2−-TiO2, 0.11S2−-TiO2 and 0.24S2−-TiO2 is about 46%, 54%, 60% and 73% under 25 W mercury lamp irradiation for 180 min, respectively. Compared with bare TiO2, the TNA treated by VPH shows better photocatalytic activity. According to the above photocatalytic mechanisms, it can be concluded that the S2−-doped TNA resulted in an excellent photocatalytic performance.
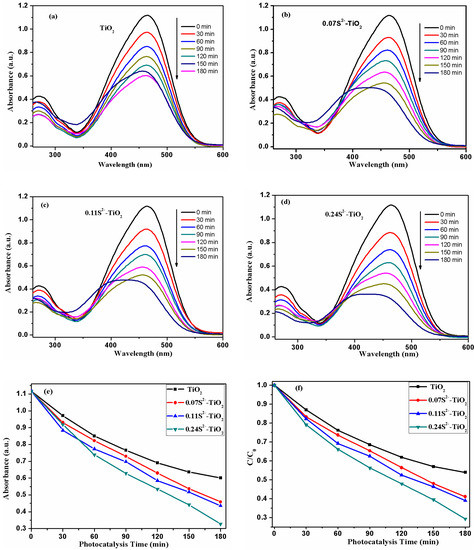
Figure 8.
(a–d) UV-vis absorption spectrum of methylene orange (MO) solution by different samples under 25 W mercury lamp. (e) Ct/C0 plots of MO solution by different samples. (f) Corresponding photocatalytic degradation curves of MO solution by different samples.
To further demonstrate the remarkable effect of S2− doping, we added a filter to a 25 W mercury lamp so that the light source illuminates the sample at a wavelength between 380–800 nm and then compared the effect of sample degradation as shown in Figure 9. Figure 9 shows the degradation curves of MO in TiO2 and 0.24S2−-TiO2 photocatalysts. Due to the wider bandgap, TiO2 is stimulated only by UV light (380–400 nm). The MO decomposition rate of bare TiO2 was 22.3%, indicating its lower photocatalytic activity. The photocatalytic activity of 0.24S2−-TiO2 to MO solution (51.8%) was enhanced by doping with S2−, indicating that S2− plays a key role in enhancing the photocatalytic activity.
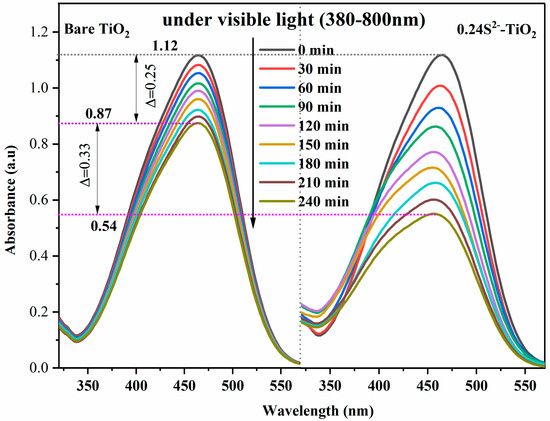
Figure 9.
UV-Vis absorption spectral curves of by bare TiO2 and 0.24S2−-TiO2 in visible light degraded MO solution.
4. Conclusions
In conclusion, in this paper, a facile VPH approach was demonstrated in anionic S2− to replace a part of O2− in TNA so that it enhances the photoelectrochemical performance and improves the photocurrent. It was found that the S3p orbit of anionic S2− played a key effect on the properties of TNA. Anionic S2− doping TNA can significantly adjust the absorption cut-off wavelength, expanding to the visible light range from 409.5 nm to 542.5 nm of TNA and reducing the bandgap of TNA to 2.29 eV. Compared with the bare TNA, the VA (7–42) and IA (1.5–77.4) of S2−-TiO2 samples are greatly enhanced, which has a potential application prospect. In the photodegradation of MO, the 0.24S2−-TiO2 sample shows the strongest degradation efficiency of 73%, while the degradation efficiency of bare TiO2 is 46%. The 0.24S2−-TiO2 sample also shows the highest photocurrent of 10.6μA/cm2, which was 1.73 times higher than that of bare TiO2 (6.1 μA/cm2). Sample characterization and optical absorption intensity evaluation results demonstrated a close relationship between the S2− dopant level of TIO and their photocatalysis activity and PEC. Interestingly, the 0.24S2−-TiO2 bandgap shortens to 0.76 eV, well verifying the theoretical results of the anionic S2− doping TiO2. In addition, it is few reported that H2S, as an anionic S2− source, dopes into TNA by VPH, which has a new broad application prospect in effective and low-cost doping.
Author Contributions
Z.S. is involved in the Conceptualization, Investigation, Student and Doctor Mentoring, Supervision, and Manuscript Preparation. H.Y. (Hai Yu) is involved in Sample Fabrication, Experimentation, Data Collection and Analysis, and Manuscript Preparation. M.Z., Y.W., H.Y. (Haocheng Yang) are involved in assisting with Experimentation and Data Collection, and L.Y. and G.H. are involved with Data Analysis and Manuscript Preparation. Y.L. is involved in Conceptualization. All authors have read and agreed to the published version of the manuscript.
Funding
This work was financially supported by the National Natural Science Foundation of China (No. 51772003, 51472003, 51701001, 61804039), Natural Science Foundation of Anhui Province (NO.1808085QE126).
Conflicts of Interest
The authors declare no conflict of interest.
References
- Hernández-Alonso, M.D.; Fresno, F.; Suárez, S.; Coronado, J.M. Development of alternative photocatalysts to TiO2: Challenges and opportunities. Environ. Sci. 2009, 2, 1231–1257. [Google Scholar] [CrossRef]
- Sun, S.; Zhang, J.; Gao, P.; Wang, Y.; Yang, P. Full visible-light absorption of TiO2 nanotubes induced by anionic S2− doping and their greatly enhanced photocatalytic hydrogen production abilities. Appl. Catal. B Environ. 2017, 206, 168–174. [Google Scholar] [CrossRef]
- Wang, Y.F.; Zhang, M.; Yu, H.; Zuo, Y.; Gao, J.; He, G.; Sun, Z.Q. Facile fabrication of Ag/graphene oxide/TiO2 nanorod array as a powerful substrate for photocatalytic degradation and surface-enhanced Raman scattering detection. Appl. Catal. B Environ. 2019, 252, 174–186. [Google Scholar] [CrossRef]
- Mahroug, A.; Boudjadar, S.; Hamrit, S.; Guerbous, L. Structural morphological and optical properties of undoped and Co-doped ZnO thin films prepared by sol–gel process. J. Mater. Sci. Mater. Electron. 2014, 25, 4967–4974. [Google Scholar] [CrossRef]
- Murakami, N.; Chiyoya, T.; Tsubota, T.; Ohno, T. Switching redox site of photocatalytic reaction on titanium(IV) oxide particles modified with transition-metal ion controlled by irradiation wavelength. Appl. Catal. A Gen. 2008, 348, 148–152. [Google Scholar] [CrossRef]
- Park, Y.; Kim, W.; Park, H.; Tachikawa, T.; Majima, T.W. Carbon-doped TiO2 photocatalyst synthesized without using an external carbon precursor and the visible light activity. Appl. Catal. B Environ. 2009, 91, 355–361. [Google Scholar] [CrossRef]
- Rockafellow, E.M.; Stewart, L.K.; Jenks, W.S. Is sulfur-doped TiO2 an effective visible light photocatalyst for remediation? Appl. Catal. B Environ. 2009, 91, 554–562. [Google Scholar] [CrossRef]
- Yu, J.C.; Ho, W.; Yu, J.; Yip, H.; Wong, P.K.; Zhao, J. Efficient visible-Light-Induced photocatalytic disinfection on sulfur-doped nanocrystalline titania. Environ. Sci. Technol. 2005, 39, 1175–1179. [Google Scholar] [CrossRef]
- Chen, X.Q.; Su, Y.L.; Zhang, X.W.; Lei, L.C. Fabrication of visible-light responsive S-F-codoped TiO2 nanotubes. Chin. Scie. Bull. 2008, 53, 1983–1987. [Google Scholar] [CrossRef][Green Version]
- Izumi, Y.; Itoi, T.; Peng, S.; Oka, K.; Shibata, Y. Site structure and photocatalytic role of sulfur or nitrogen-doped titanium oxide with uniform mesopores under visible light. J. Phys. Chem. C 2009, 113, 12926. [Google Scholar] [CrossRef]
- Bayati, M.R.; Moshfegh, A.Z.; Olestani-Fard, G.F. Micro-arc oxidized S-TiO2 nanoporous layers: Cationic or anionic doping? Mater. Lett. 2010, 64, 2215–2218. [Google Scholar] [CrossRef]
- Umebayashi, T.; Yamaki, T.; Itoh, H.; Asai, K. Band gap narrowing of titanium dioxide by sulfur doping. Appl. Phys. Lett. 2002, 81, 454–456. [Google Scholar] [CrossRef]
- Harb, M.; Sautet, P.; Raybaud, P. Anionic or cationic S-doping in bulk anatase TiO2: Insights on optical absorption from First Principles Calculations. J. Phys. Chem. C 2013, 117, 8892–8902. [Google Scholar] [CrossRef]
- Di Salvo, F.J.; Moncton, D.E.; Waszczak, J.V. Electronic properties and superlattice formation in the semimetal TiSe2. Phys. Rev. B Condens. Matter 1976, 14, 4321–4328. [Google Scholar] [CrossRef]
- Burda, C.; Chen, X. The electronic origin of the visible-light absorption properties of C-, N- and S-doped TiO2 nanomaterials. J. Am. Chem. Soc. 2008, 130, 5018–5019. [Google Scholar]
- Rengifo-Herrera, J.A.; Pierzchala, K.; Sienkiewicz, A.; Forró, L.; Kiwi, J.; Pulgarin, C. Abatement of organics and escherichia coli by N, S co-doped TiO2 under UV and visible light. Implications of the formation of singlet oxygen (1O2) under visible light. Appl. Catal. B Environ. 2009, 88, 398–406. [Google Scholar] [CrossRef]
- Ohno, T. Preparation of visible light active S-doped TiO2 photocatalysts and their photocatalytic activities. Water Sci. Technol. 2004, 49, 159–163. [Google Scholar] [CrossRef]
- Wu, T.; Zhu, X.; Wang, G.; Zhang, Y.; Zhang, H.; Zhao, H.J. Vapor-phase hydrothermal growth of single crystalline NiS2, nanostructure film on carbon fiber cloth for electrocatalytic oxidation of alcohols to ketones and simultaneous H2 evolution. Nano Res. 2018, 11, 1004–1017. [Google Scholar] [CrossRef]
- Liu, P.; Wang, Y.; Zhang, H.; An, T.; Yang, H.; Tang, Z. Vapor-phase hydrothermal transformation of HTiOF3 intermediates into {001} faceted anatase single-crystalline nanosheets. Small 2012, 8, 3664–3673. [Google Scholar] [CrossRef]
- Wu, T.X.; Wang, G.Z.; Zhu, X.G.; Liu, P.; Zhang, X.; Zhang, H.M. Growth and in situ transformation of TiO2 and HTiOF3 crystals on chitosan-polyvinyl alcohol co-polymer substrates under vapor phase hydrothermal conditions. Nano Res. 2016, 9, 745–754. [Google Scholar] [CrossRef]
- Liu, P.; Zhang, H.; Liu, H.; Wang, Y.; An, T.; Cai, W. Vapor-phase hydrothermal growth of novel segmentally configured nanotubular crystal structure. Small 2013, 9, 3043–3050. [Google Scholar] [CrossRef] [PubMed]
- Liu, P.; Zhang, H.; Liu, H.; Wang, Y.; Yao, X.; Zhu, G. A facile vapor-phase hydrothermal method for direct growth of titanate nanotubes on a titanium substrate via a distinctive nanosheet roll-up mechanism. J. Am. Chem. Soc. 2011, 133, 19032–19035. [Google Scholar] [CrossRef] [PubMed]
- Tan, Z.; Liu, P.; Zhang, H.; Wang, Y.; Al-Mamun, M.; Yang, H.G. An in situ vapour phase hydrothermal surface doping approach for fabrication of high performance Co3O4 electrocatalysts with an exceptionally high S-doped active surface. Chem. Commun. 2015, 51, 5695. [Google Scholar] [CrossRef] [PubMed]
- Bae, S.Y.; Seo, H.W.; Park, J. Vertically aligned Sulfur-doped ZnO nanowires synthesized via chemical vapor deposition. J. Phys. Chem. B 2004, 35, 5206–5210. [Google Scholar] [CrossRef]
- Sayago, D.I.; Serrano, P.; Böhme, O. Adsorption and desorption of SO2 on the TiO2 110-(1×1) surface: A photoemission study. Surf. Sci. 2001, 482, 9–14. [Google Scholar] [CrossRef]
- Hebenstreit, E.L.D.; Hebenstreit, W.; Diebold, U. Structures of sulfur on TiO2 (110) determined by scanning tunneling microscopy, X-ray photoelectron spectroscopy and low-energy electron diffraction. Surf. Sci. 2001, 470, 347–360. [Google Scholar] [CrossRef]
- Agorku, E.S.; Mamba, B.B.; Pandey, A.C.; Mishra, A.K. Sulfur/Gadolinium-codoped TiO2 nanoparticles for enhanced visible-light photocatalytic performance. J. Nanomater. 2014, 2014, 289150. [Google Scholar] [CrossRef]
- Han, C.; Andersen, J.; Likodimos, V.; Falaras, P.; Linkugel, J.; Dionysiou, D.D. The effect of solvent in the sol–gel synthesis of visible light-activated, sulfur-doped TiO2 nanostructured porous films for water treatment. Cataly. Today 2014, 224, 132–139. [Google Scholar] [CrossRef]
- Tang, X.; Li, D. Sulfur-doped highly ordered TiO2 nanotubular arrays with visible light response. J. Phys. Chem. C 2008, 112, 5405–5409. [Google Scholar] [CrossRef]
- Ismail, A.A.; Faisal, M.; Harraz, F.A.; Al-Hajry, A.; Al-Sehemi, A.G. Synthesis of mesoporous sulfur-doped Ta2O5 nanocomposites and their photocatalytic activities. J. Colloid Interface Sci. 2016, 471, 145–154. [Google Scholar] [CrossRef]
- Han, C.; Pelaez, M.; Likodimos, V.; Kontos, A.G.; Falaras, P.; O’Shea, K.D.; Dionysiou, D.D. Innovative visible light-activated sulfur doped TiO2 films for water treatment. Appl. Catal. B Environ. 2011, 107, 77–87. [Google Scholar] [CrossRef]
- Wang, Y.; Huang, Y.; Ho, W.; Zhang, L.; Zou, Z.; Lee, S. Biomolecule-controlled hydrothermal synthesis of C–N–S-tridoped TiO2 nanocrystalline photocatalysts for NO removal under simulated solar light irradiation. J. Hazard. Mater. 2009, 169, 77–87. [Google Scholar] [CrossRef] [PubMed]
- Zhao, W.; Ma, W.H.; Chen, C.C.; Zhao, J.C.; Shuai, Z.G. Efficient degradation of toxic organic pollutants with Ni2O3/TiO(2−x)Bx under visible irradiation. J. Am. Chem. Soc. 2004, 126, 4782–4783. [Google Scholar] [CrossRef] [PubMed]
- Wang, Y.; Li, J.; Peng, P.; Lu, T.; Wang, L. Preparation of S-TiO2 photocatalyst and photodegradation of L-acid under visible light. Appl. Surf. Sci. 2008, 254, 5276–5280. [Google Scholar] [CrossRef]
- Tian, F.H.; Liu, C.B. DFT description on electronic structure and optical absorption properties of anionic S-doped anatase TiO2. J. Phys. Chem. B 2006, 110, 17866–17871. [Google Scholar] [CrossRef] [PubMed]
- Ohtani, B.; Kawaguchi, J.I.; Kozawa, M. Photocatalytic racemization of amino acids in aqueous polycrystalline cadmium (II) sulfide dispersions. J. Chem. Soc. 1995, 91, 1103. [Google Scholar] [CrossRef]
© 2020 by the authors. Licensee MDPI, Basel, Switzerland. This article is an open access article distributed under the terms and conditions of the Creative Commons Attribution (CC BY) license (http://creativecommons.org/licenses/by/4.0/).