The Effect of Vacancies on Grain Boundary Segregation in Ferromagnetic fcc Ni


Abstract
1. Introduction
2. Materials and Methods
3. Results
3.1. Bulk Material
3.1.1. Elemental Bulk Material
3.1.2. Bulk Material with Impurities
3.1.3. Bulk Material with Impurity and Vacancy
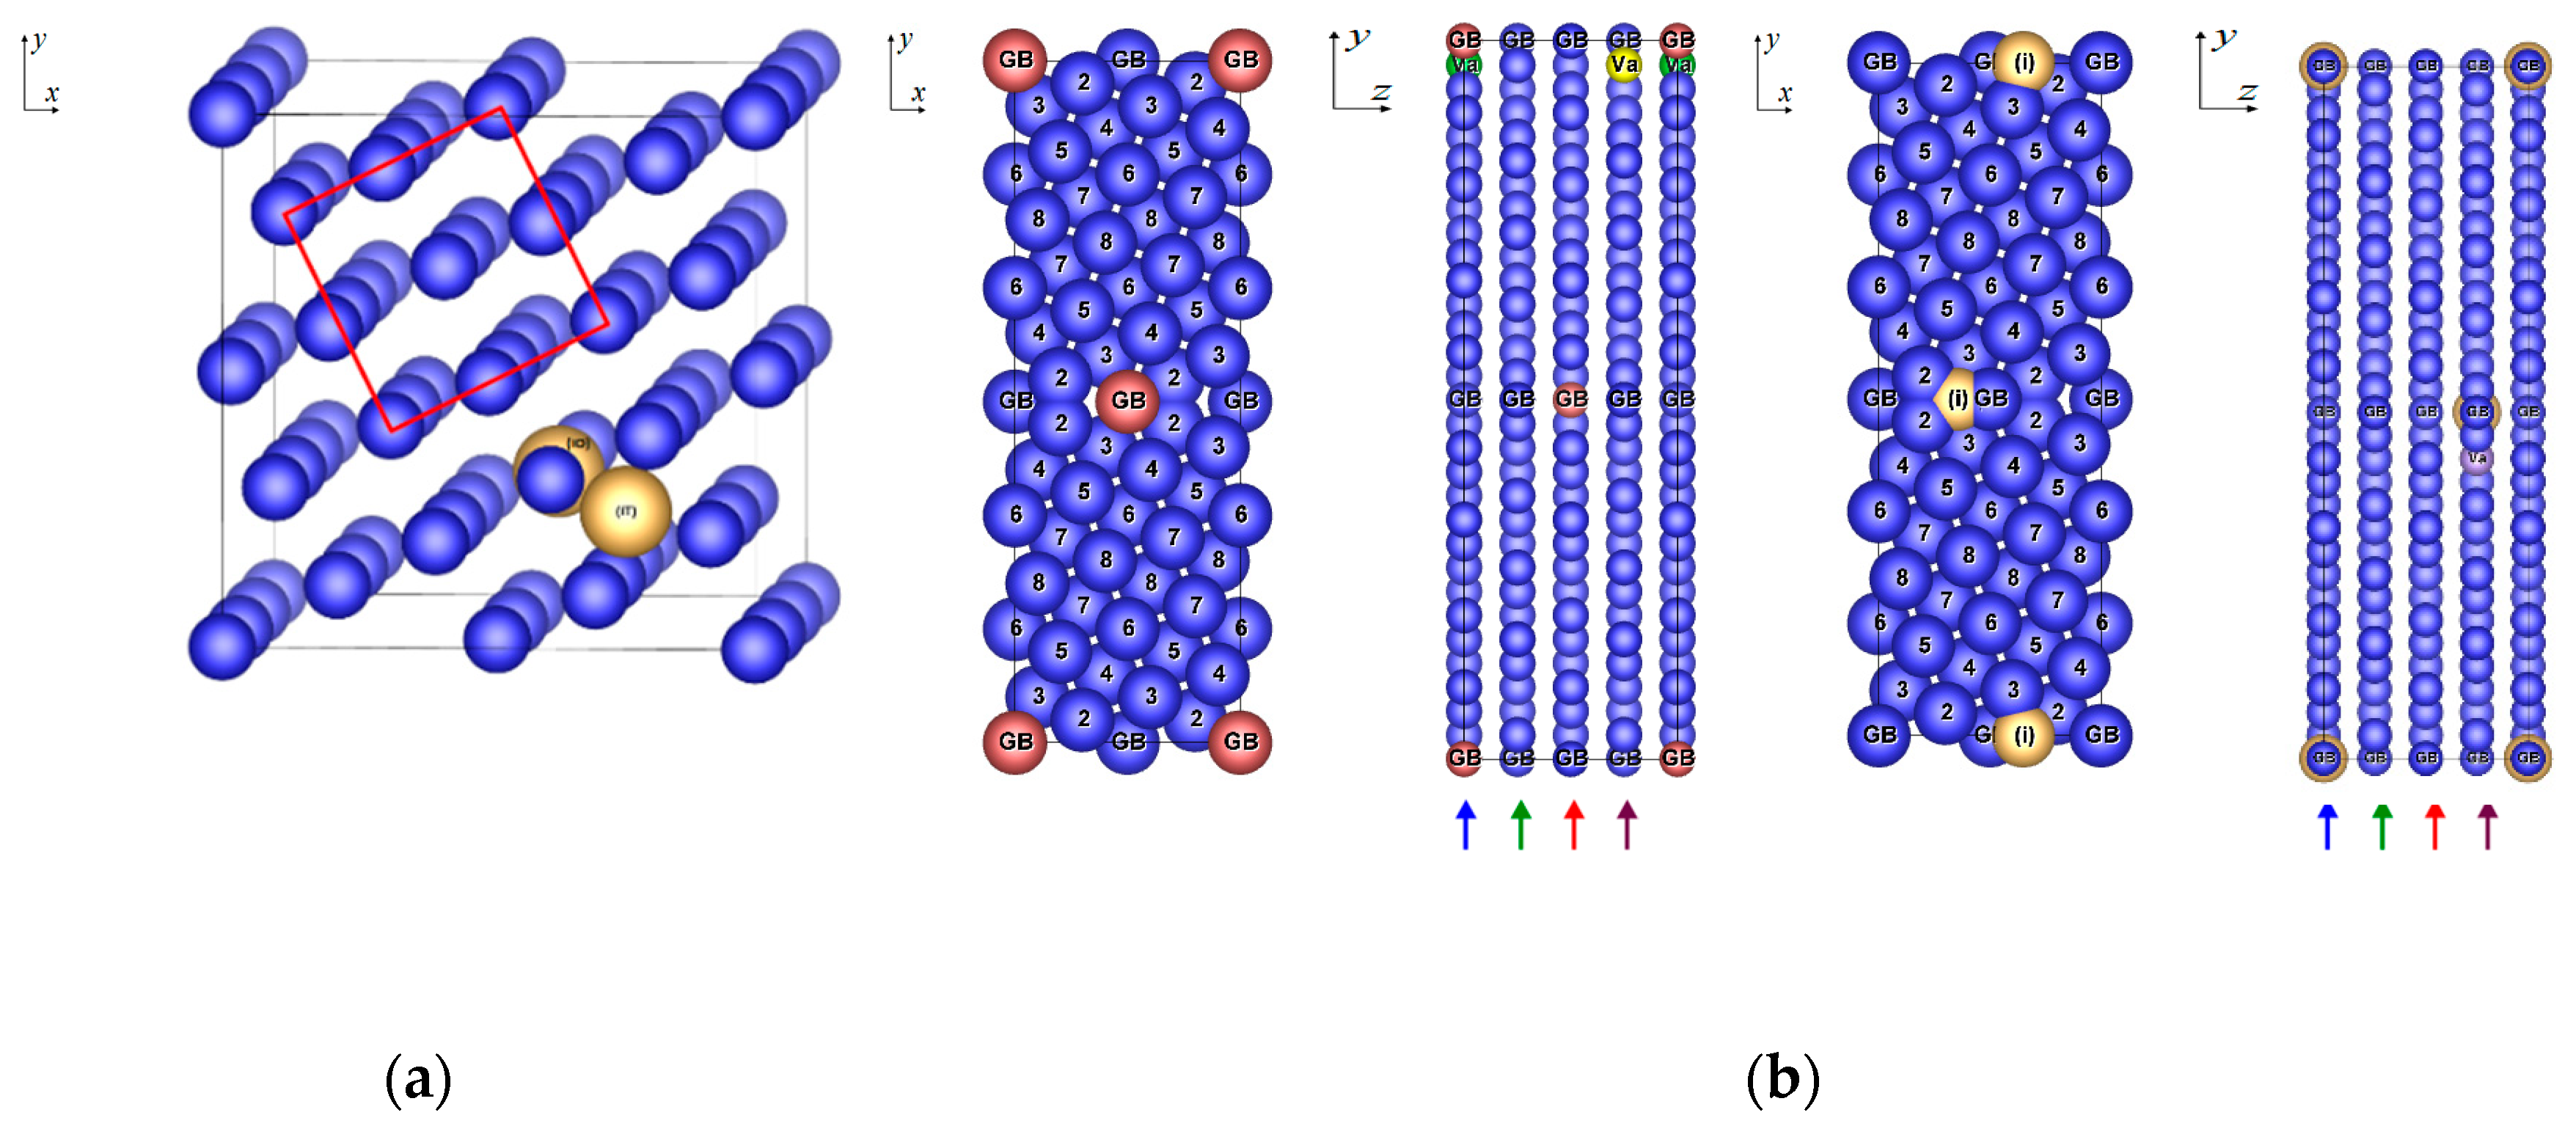
3.2. Clean Grain Boundary
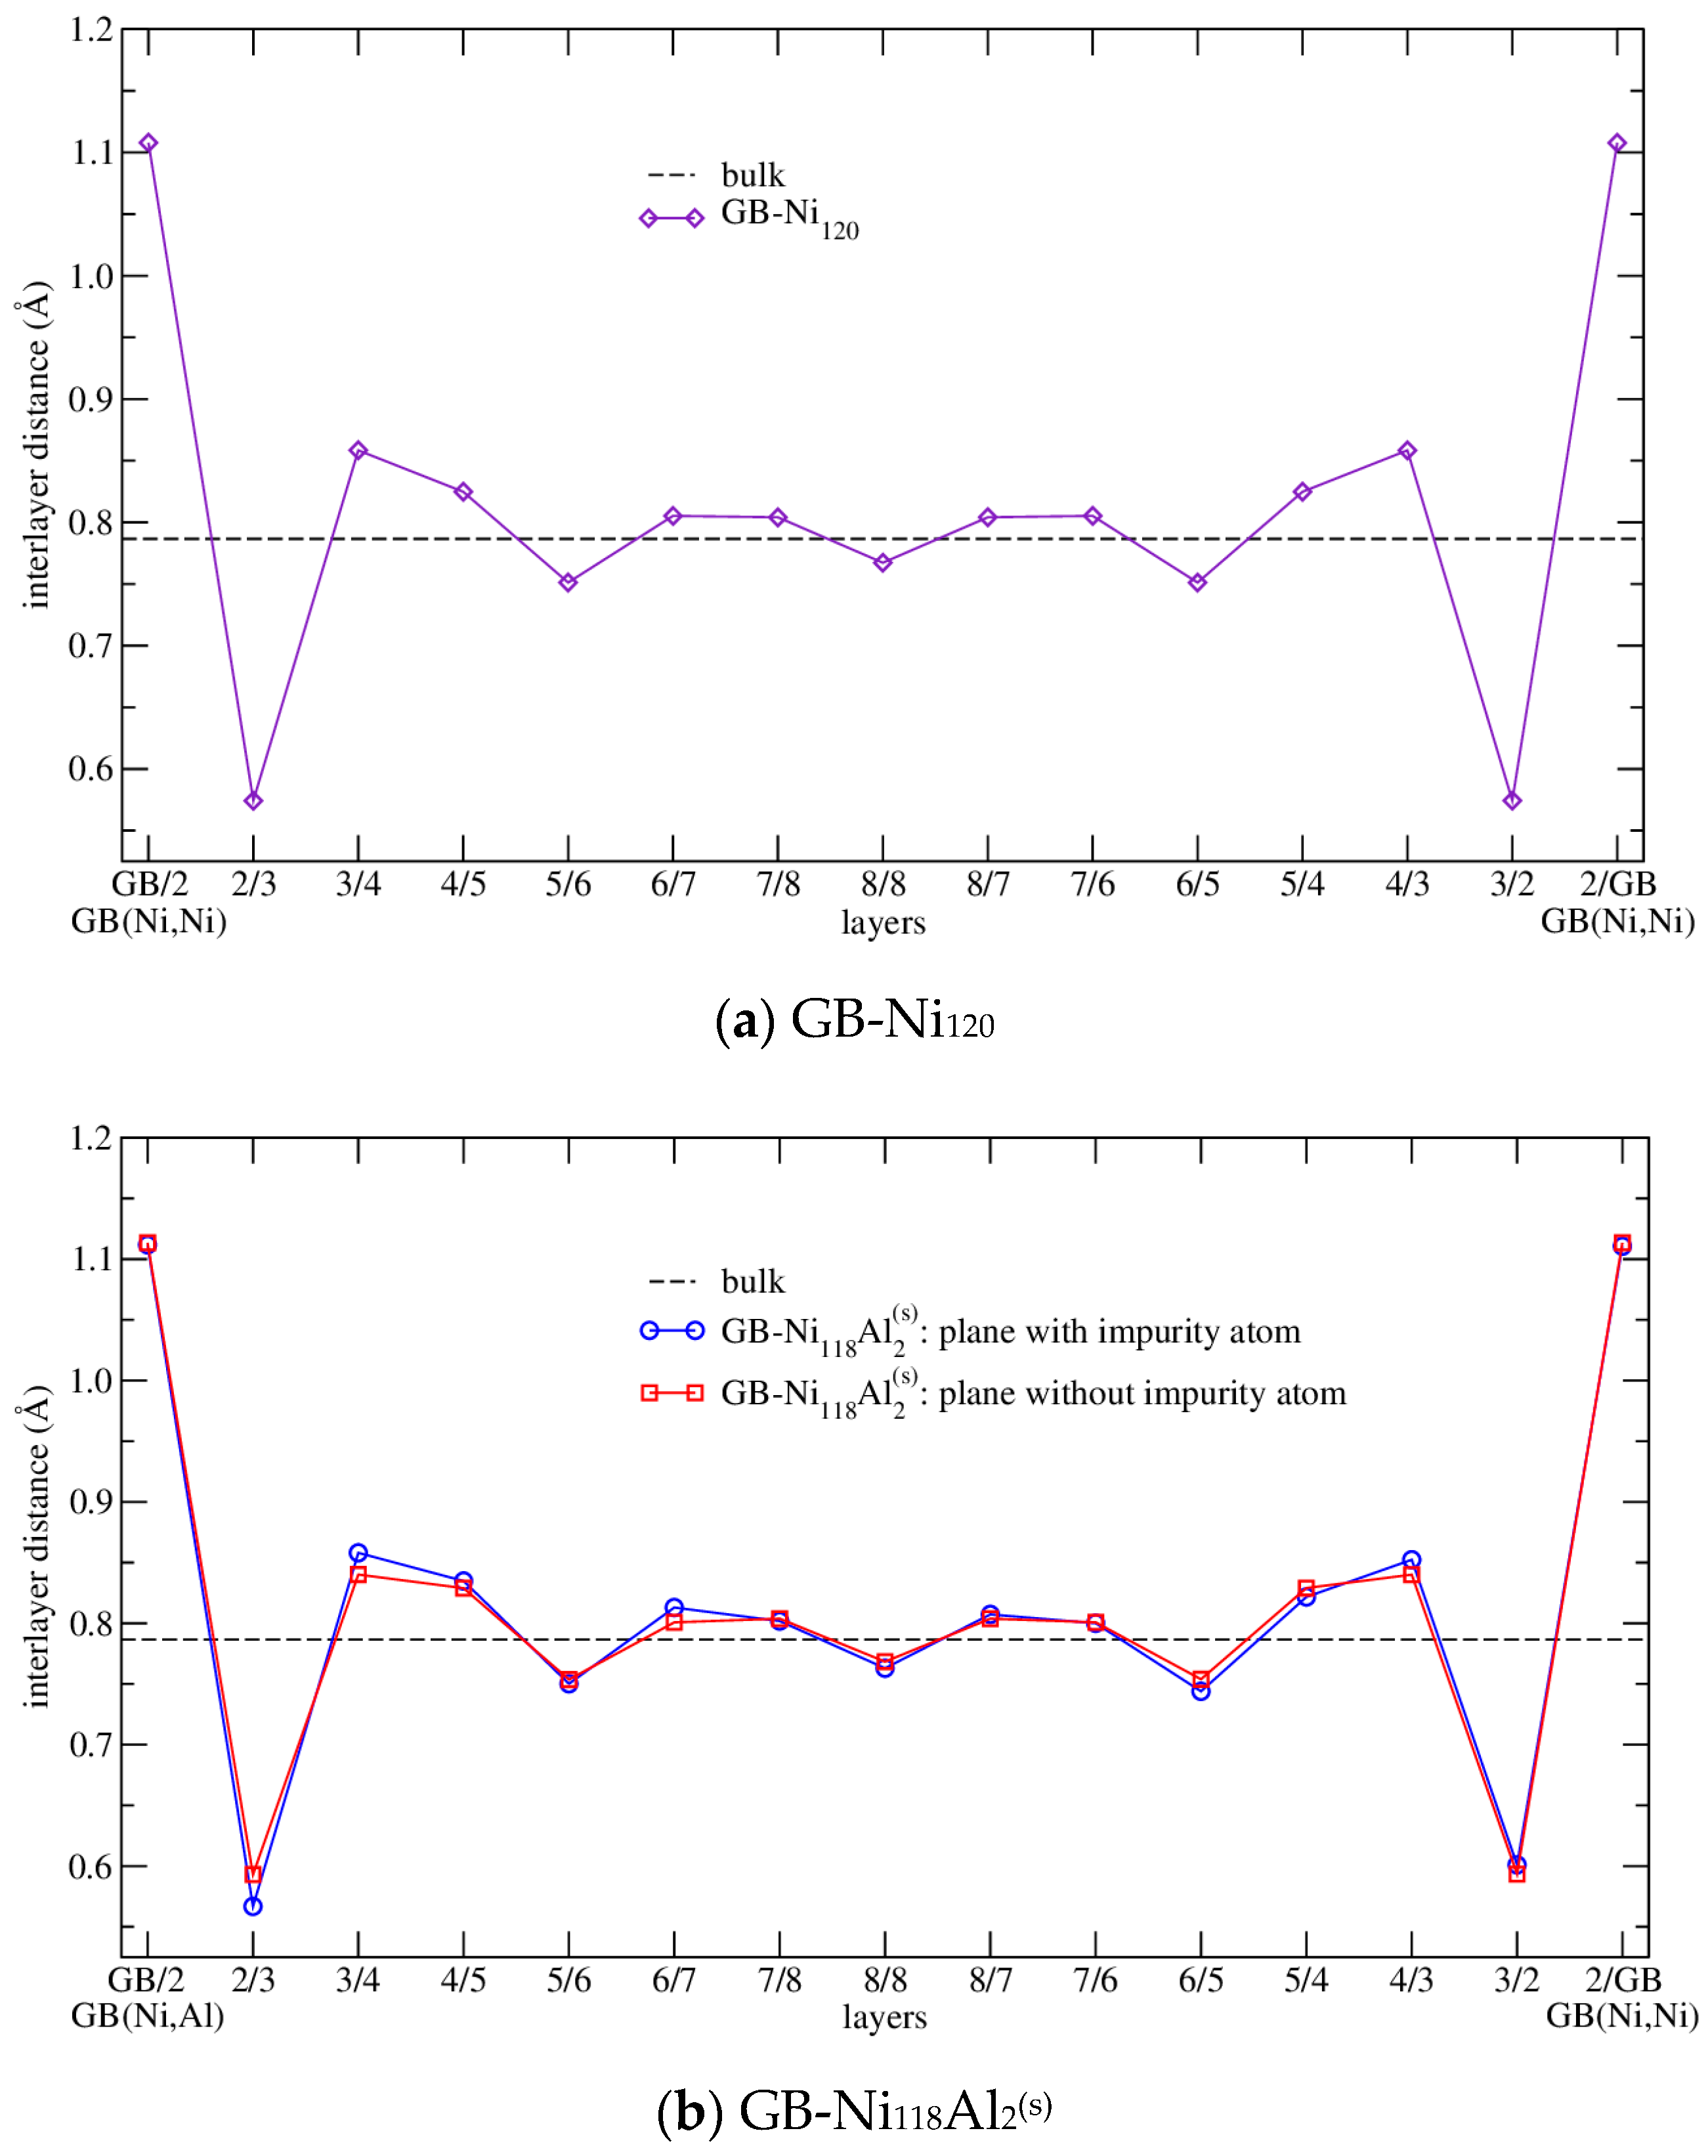
3.2.1. Structure Arrangement
3.2.2. Energetics
3.2.3. Magnetism
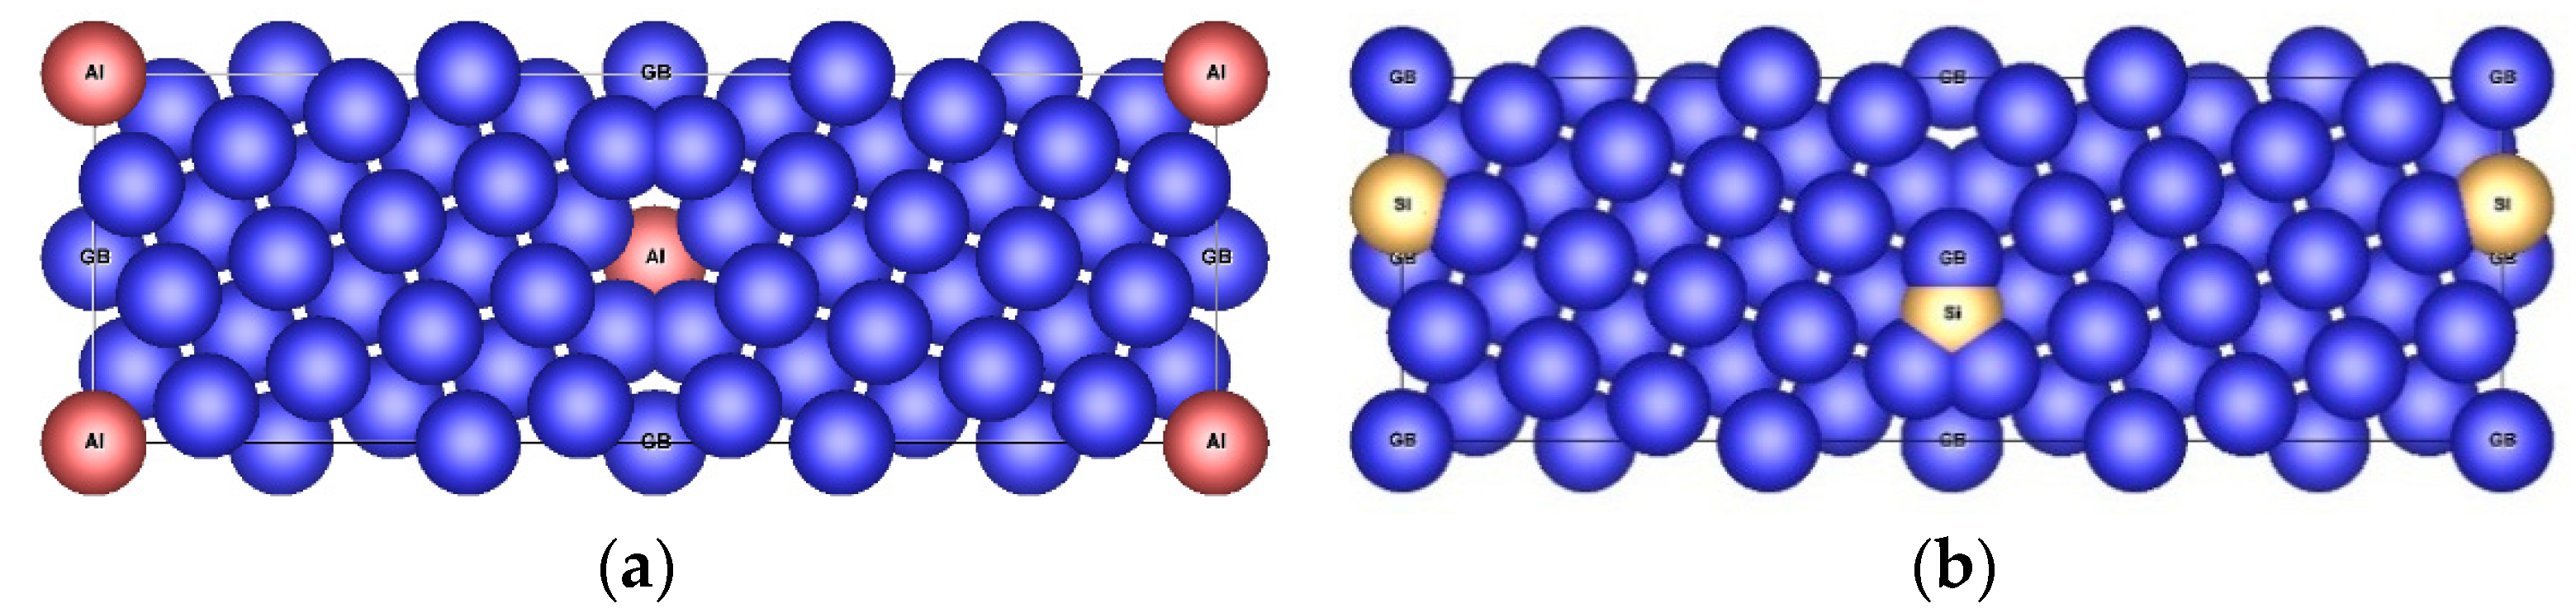
3.3. Grain Boundary with Impurities
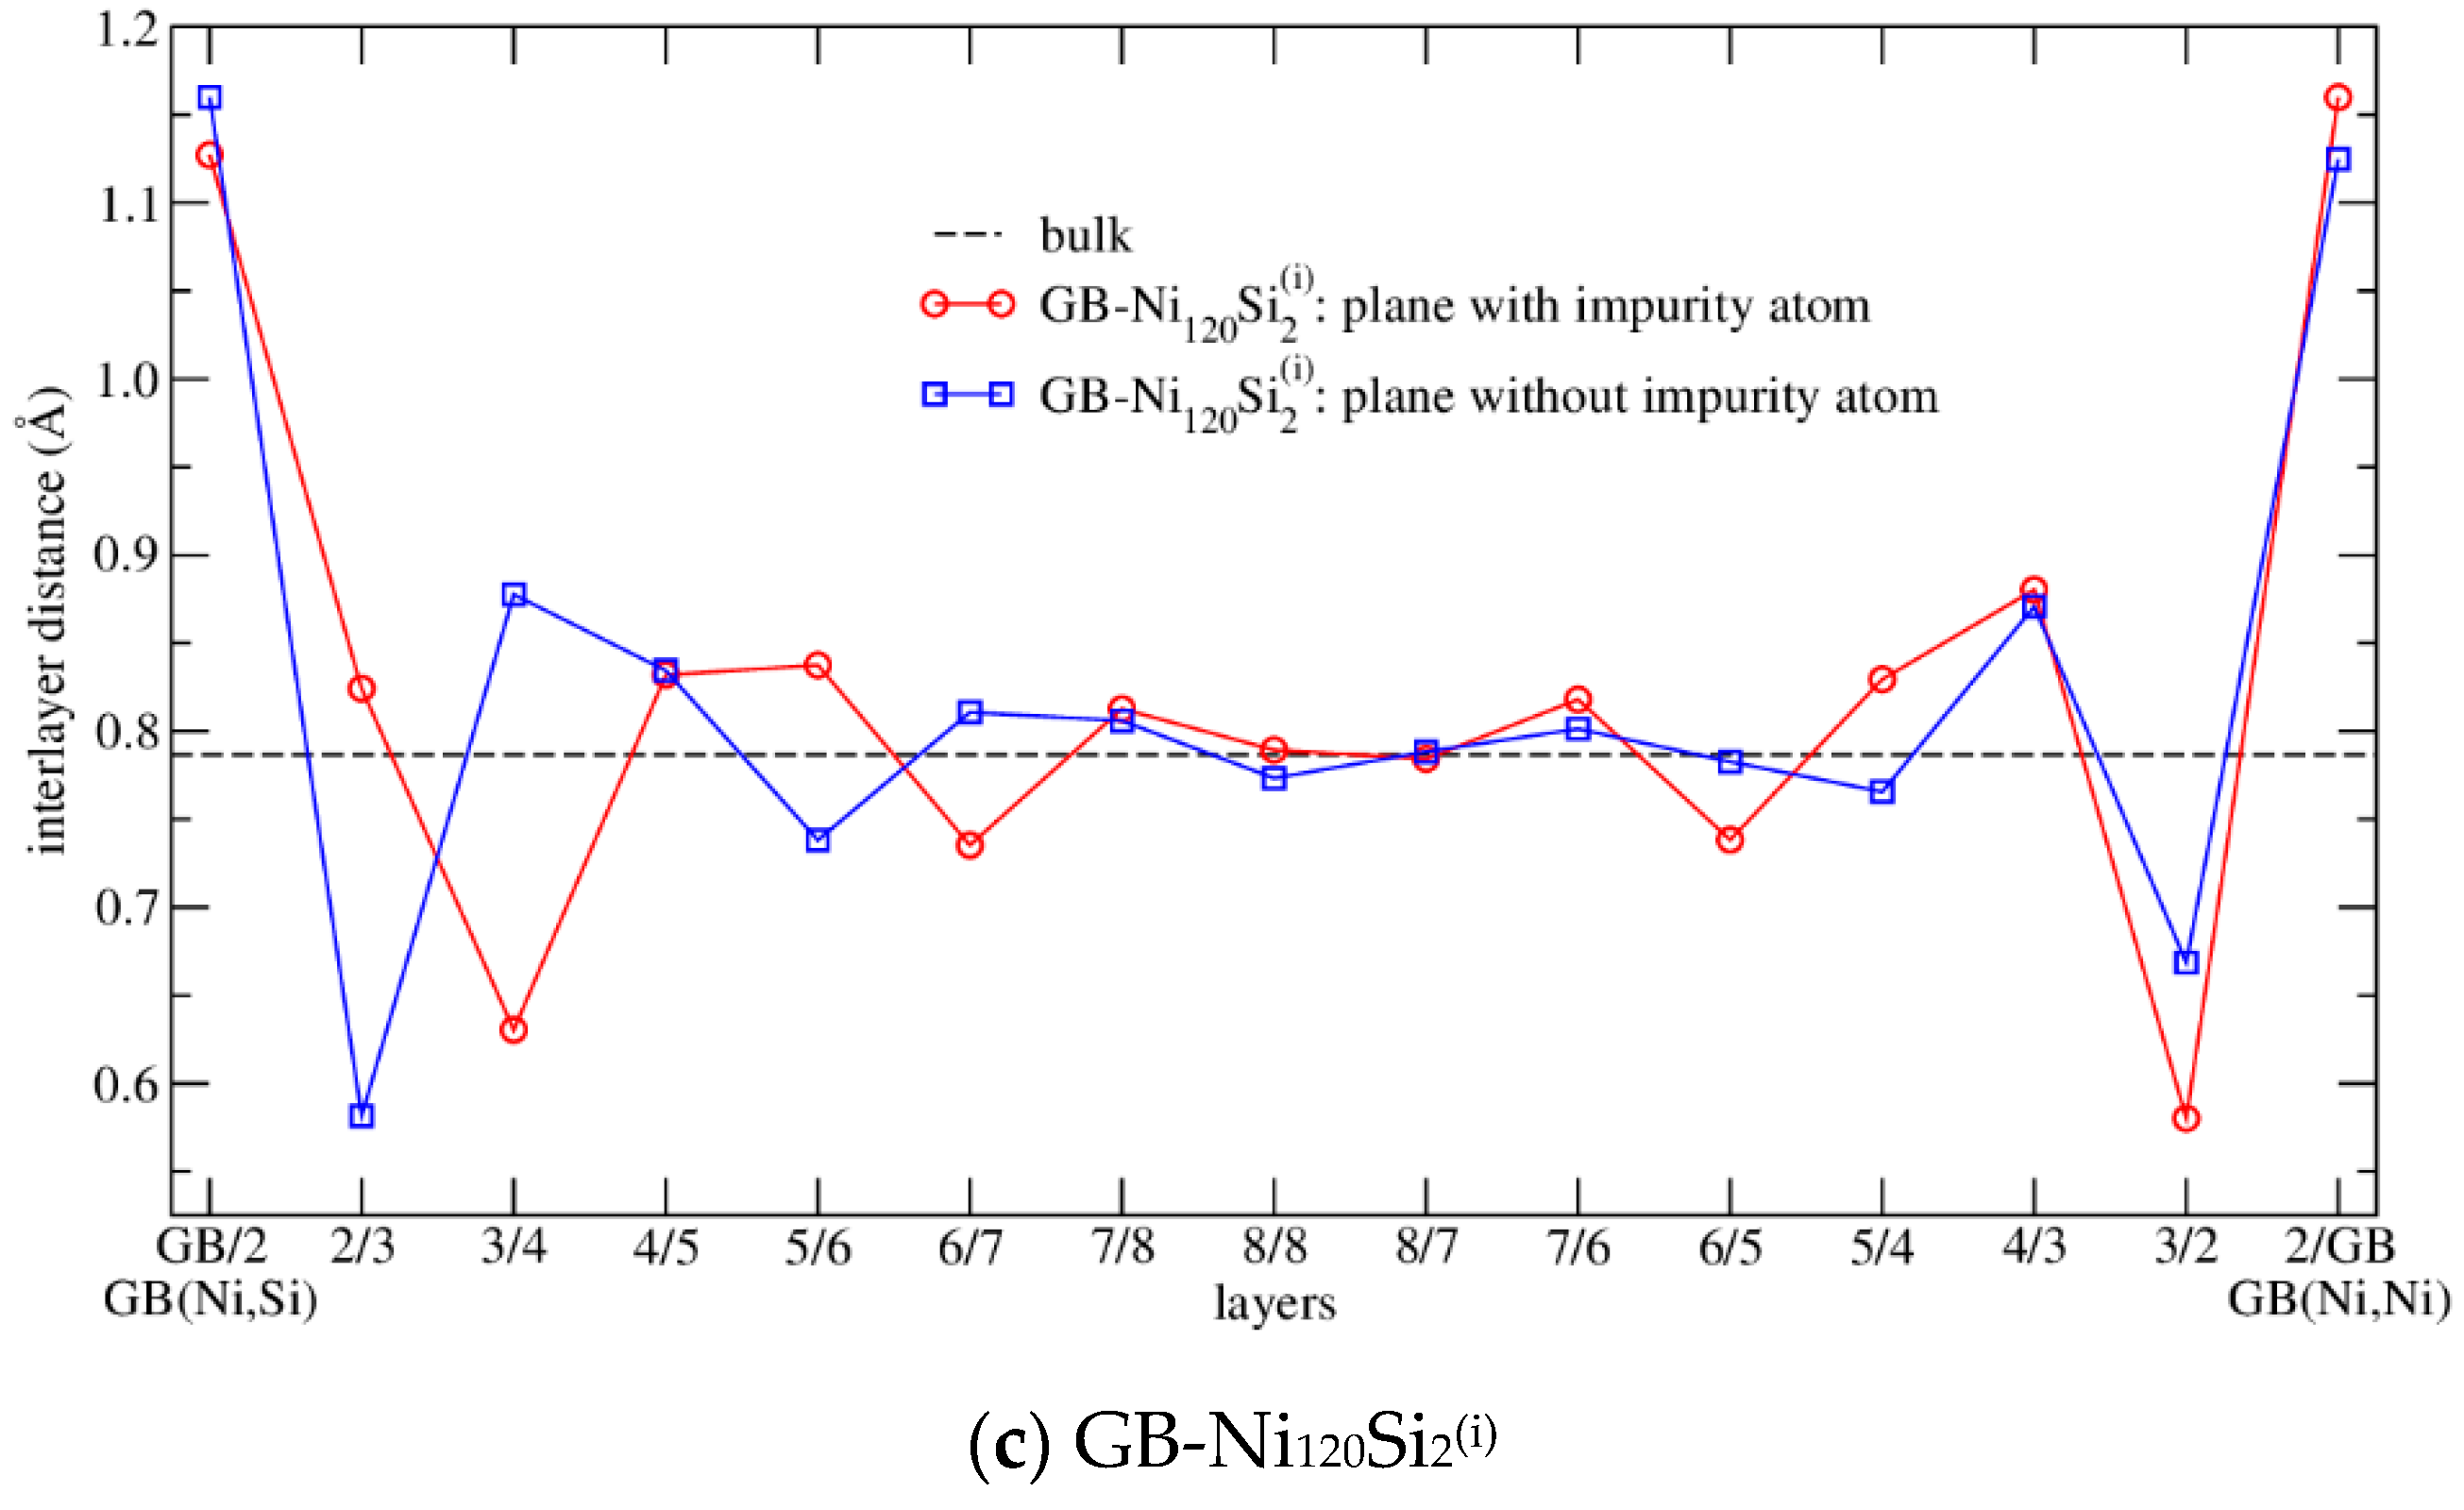
3.3.1. Structure Arrangement
3.3.2. Energetics
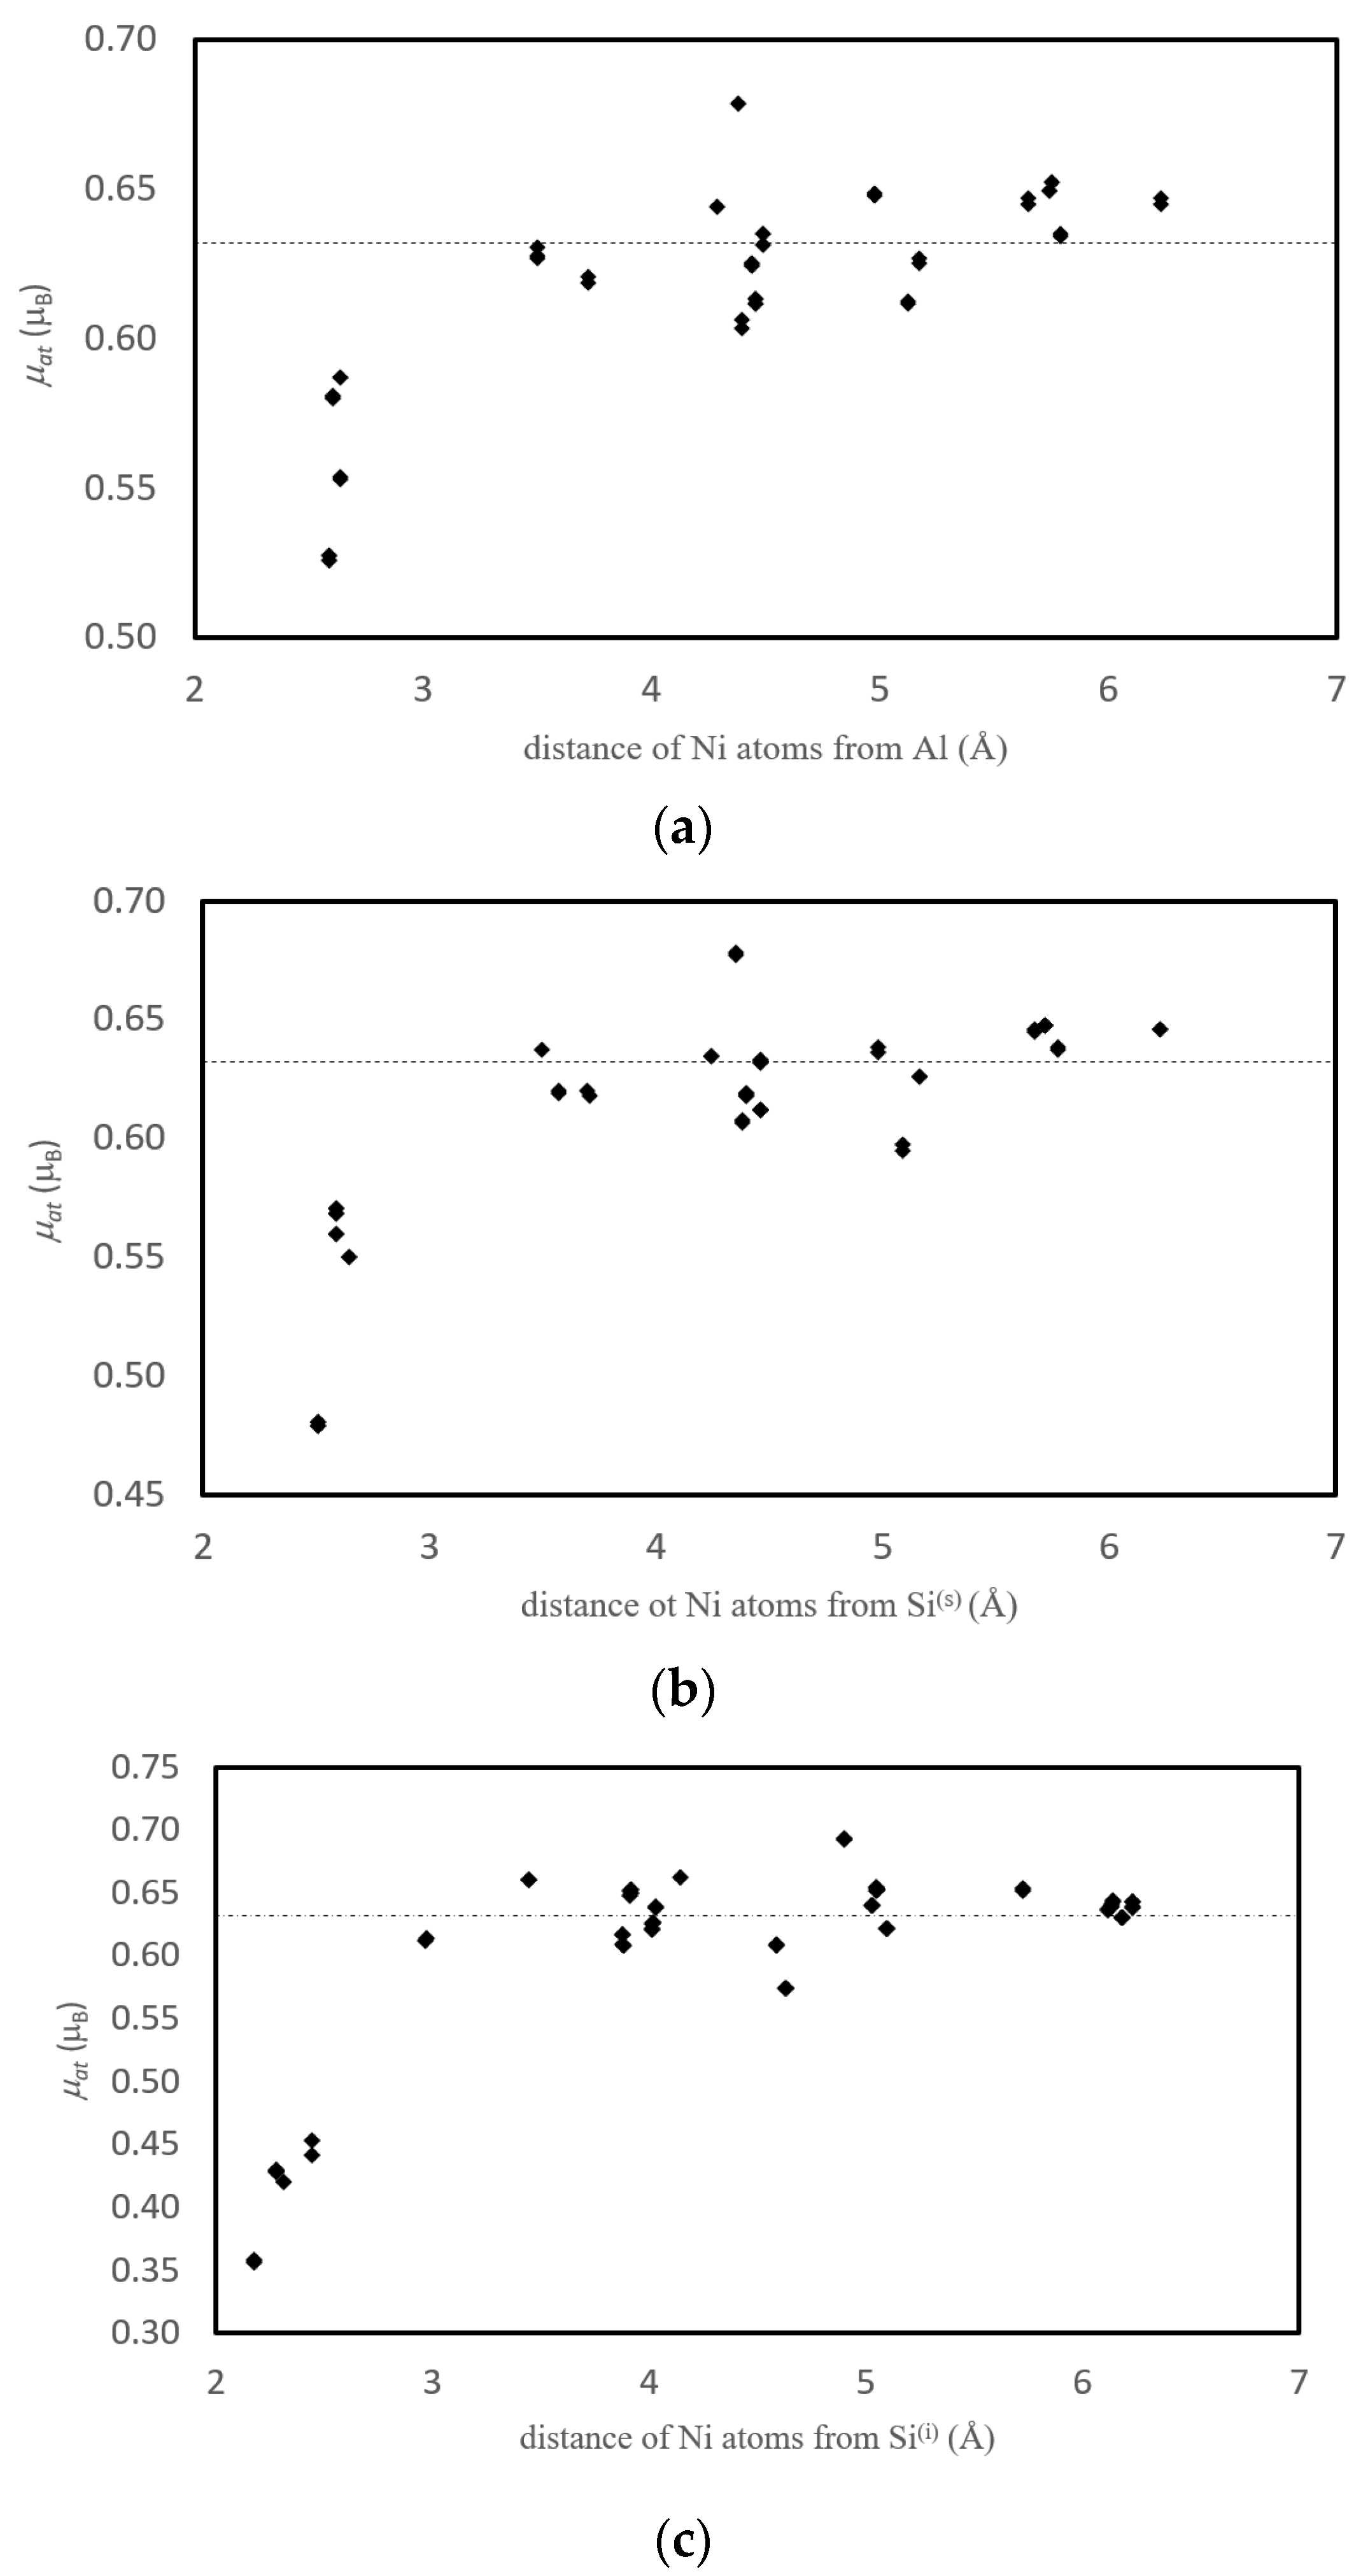
3.3.3. Magnetism
3.4. Grain Boundary with Impurities and Vacancies
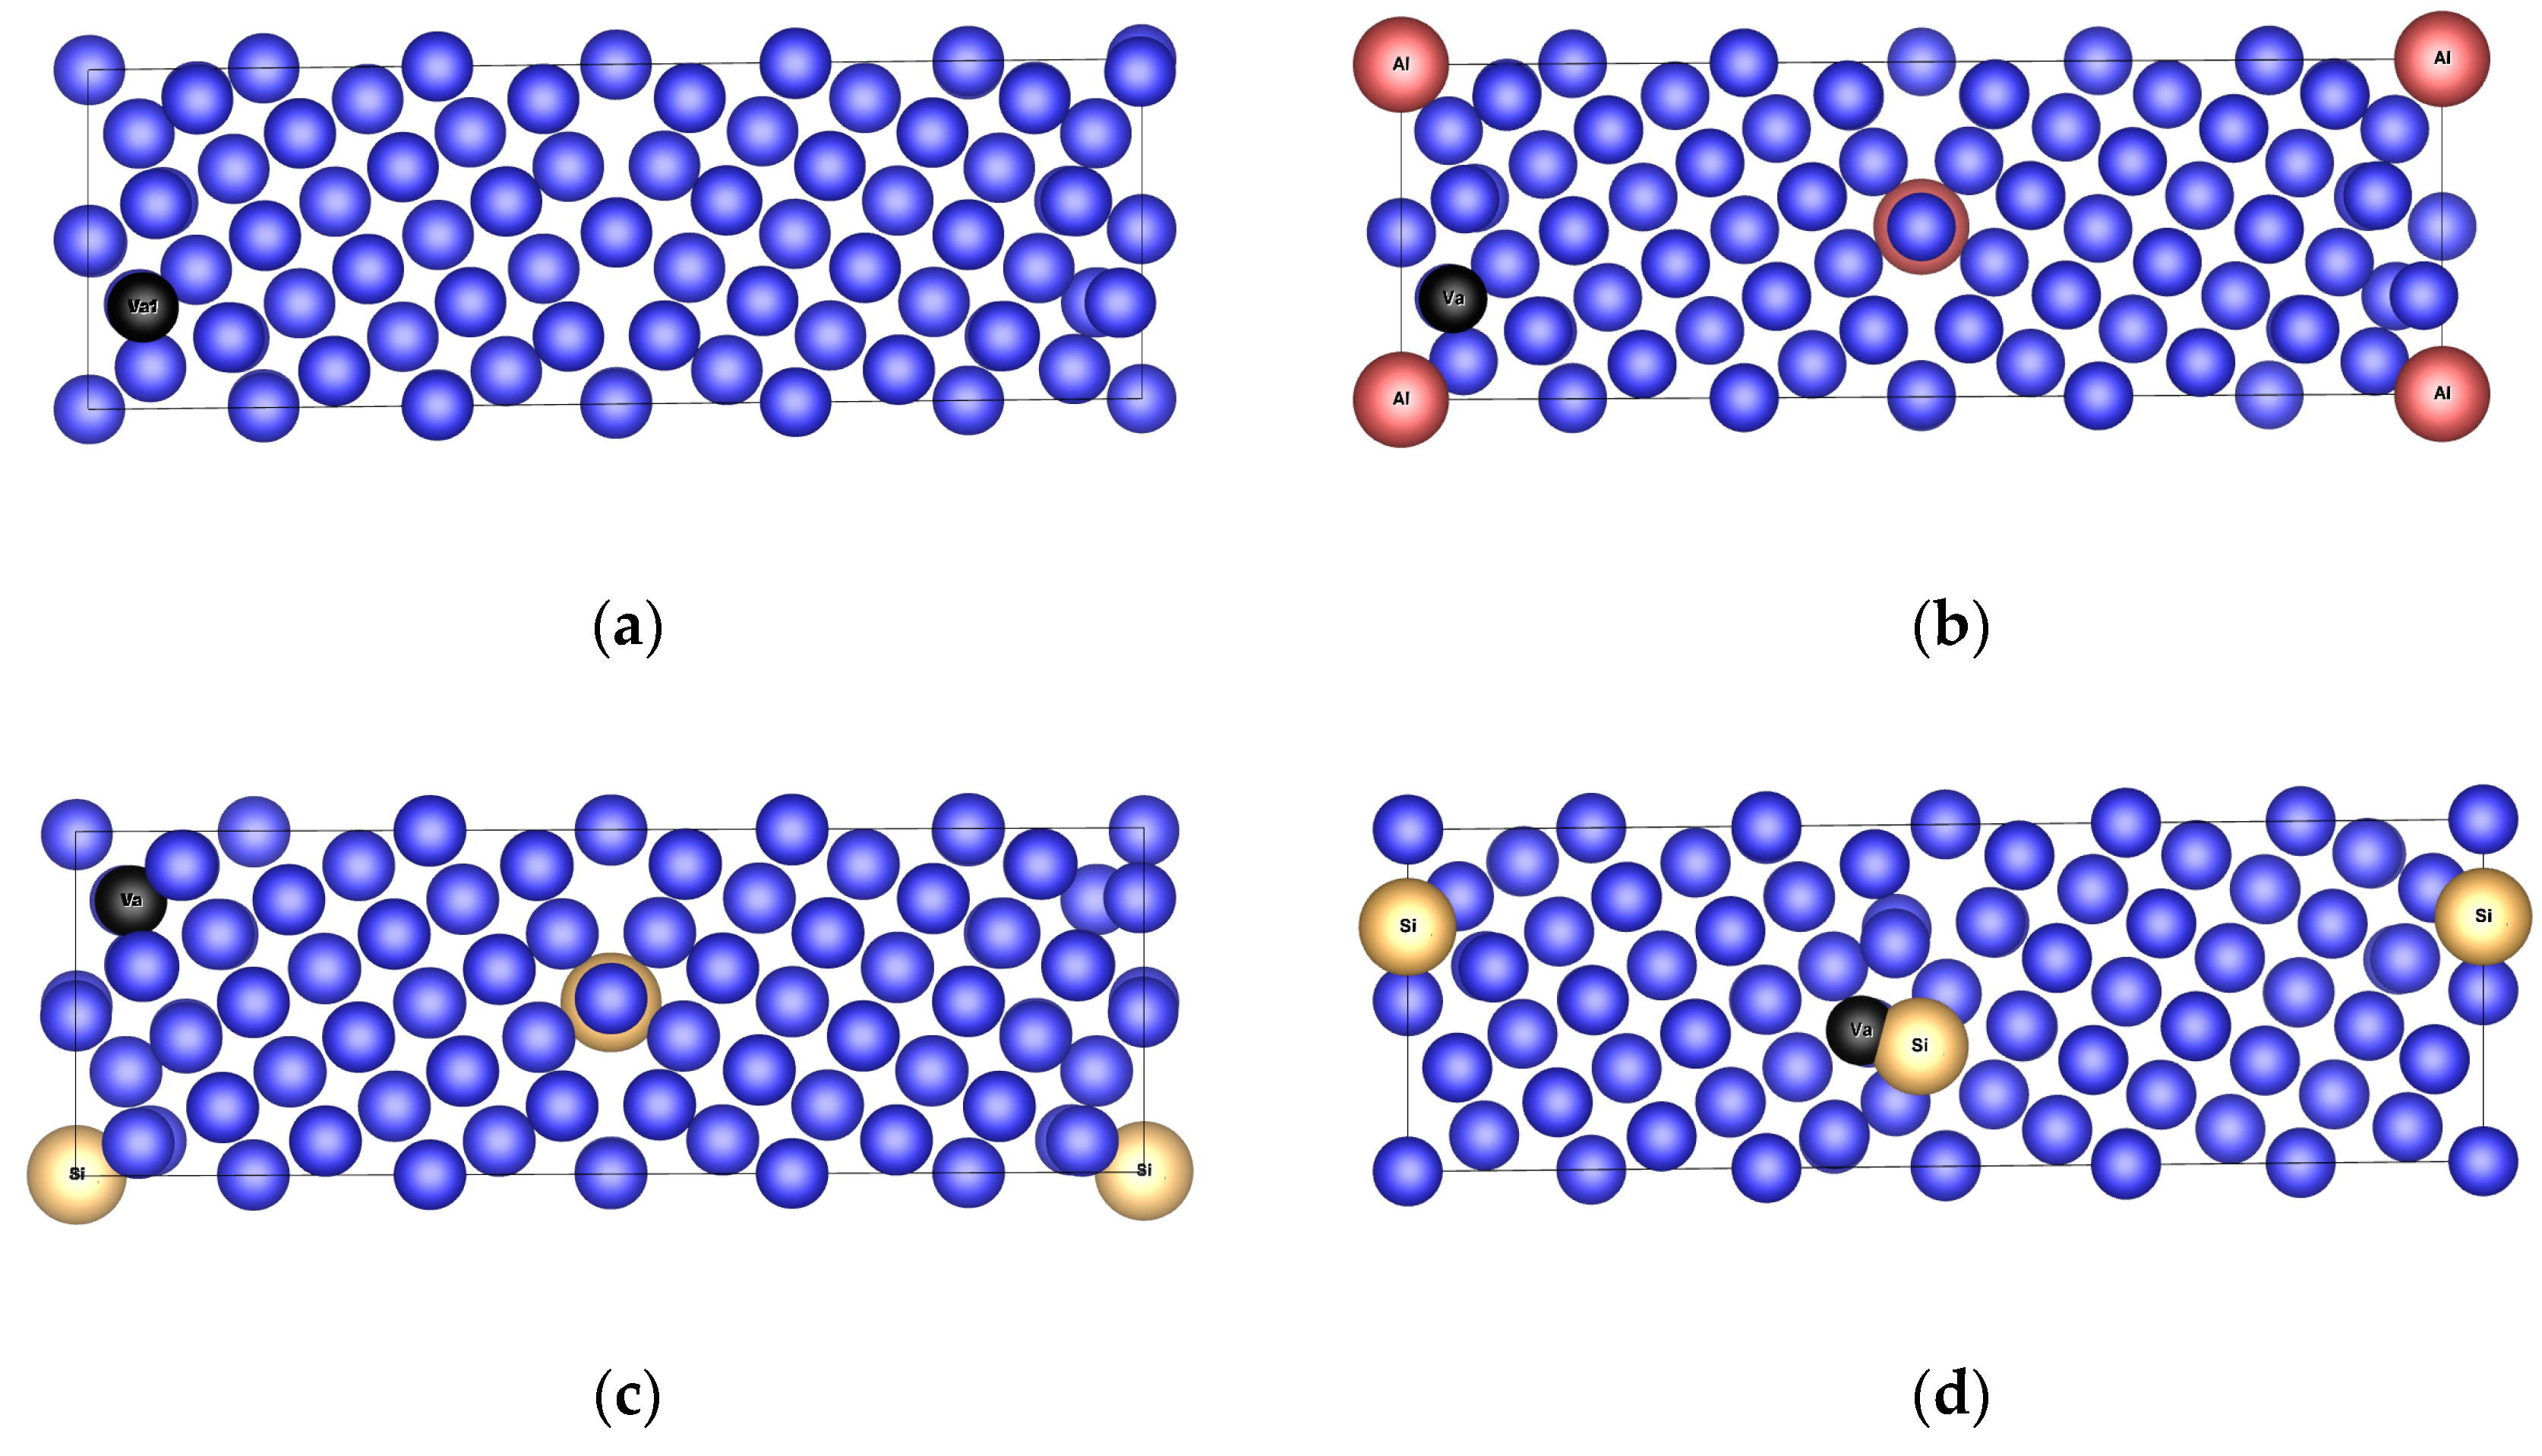
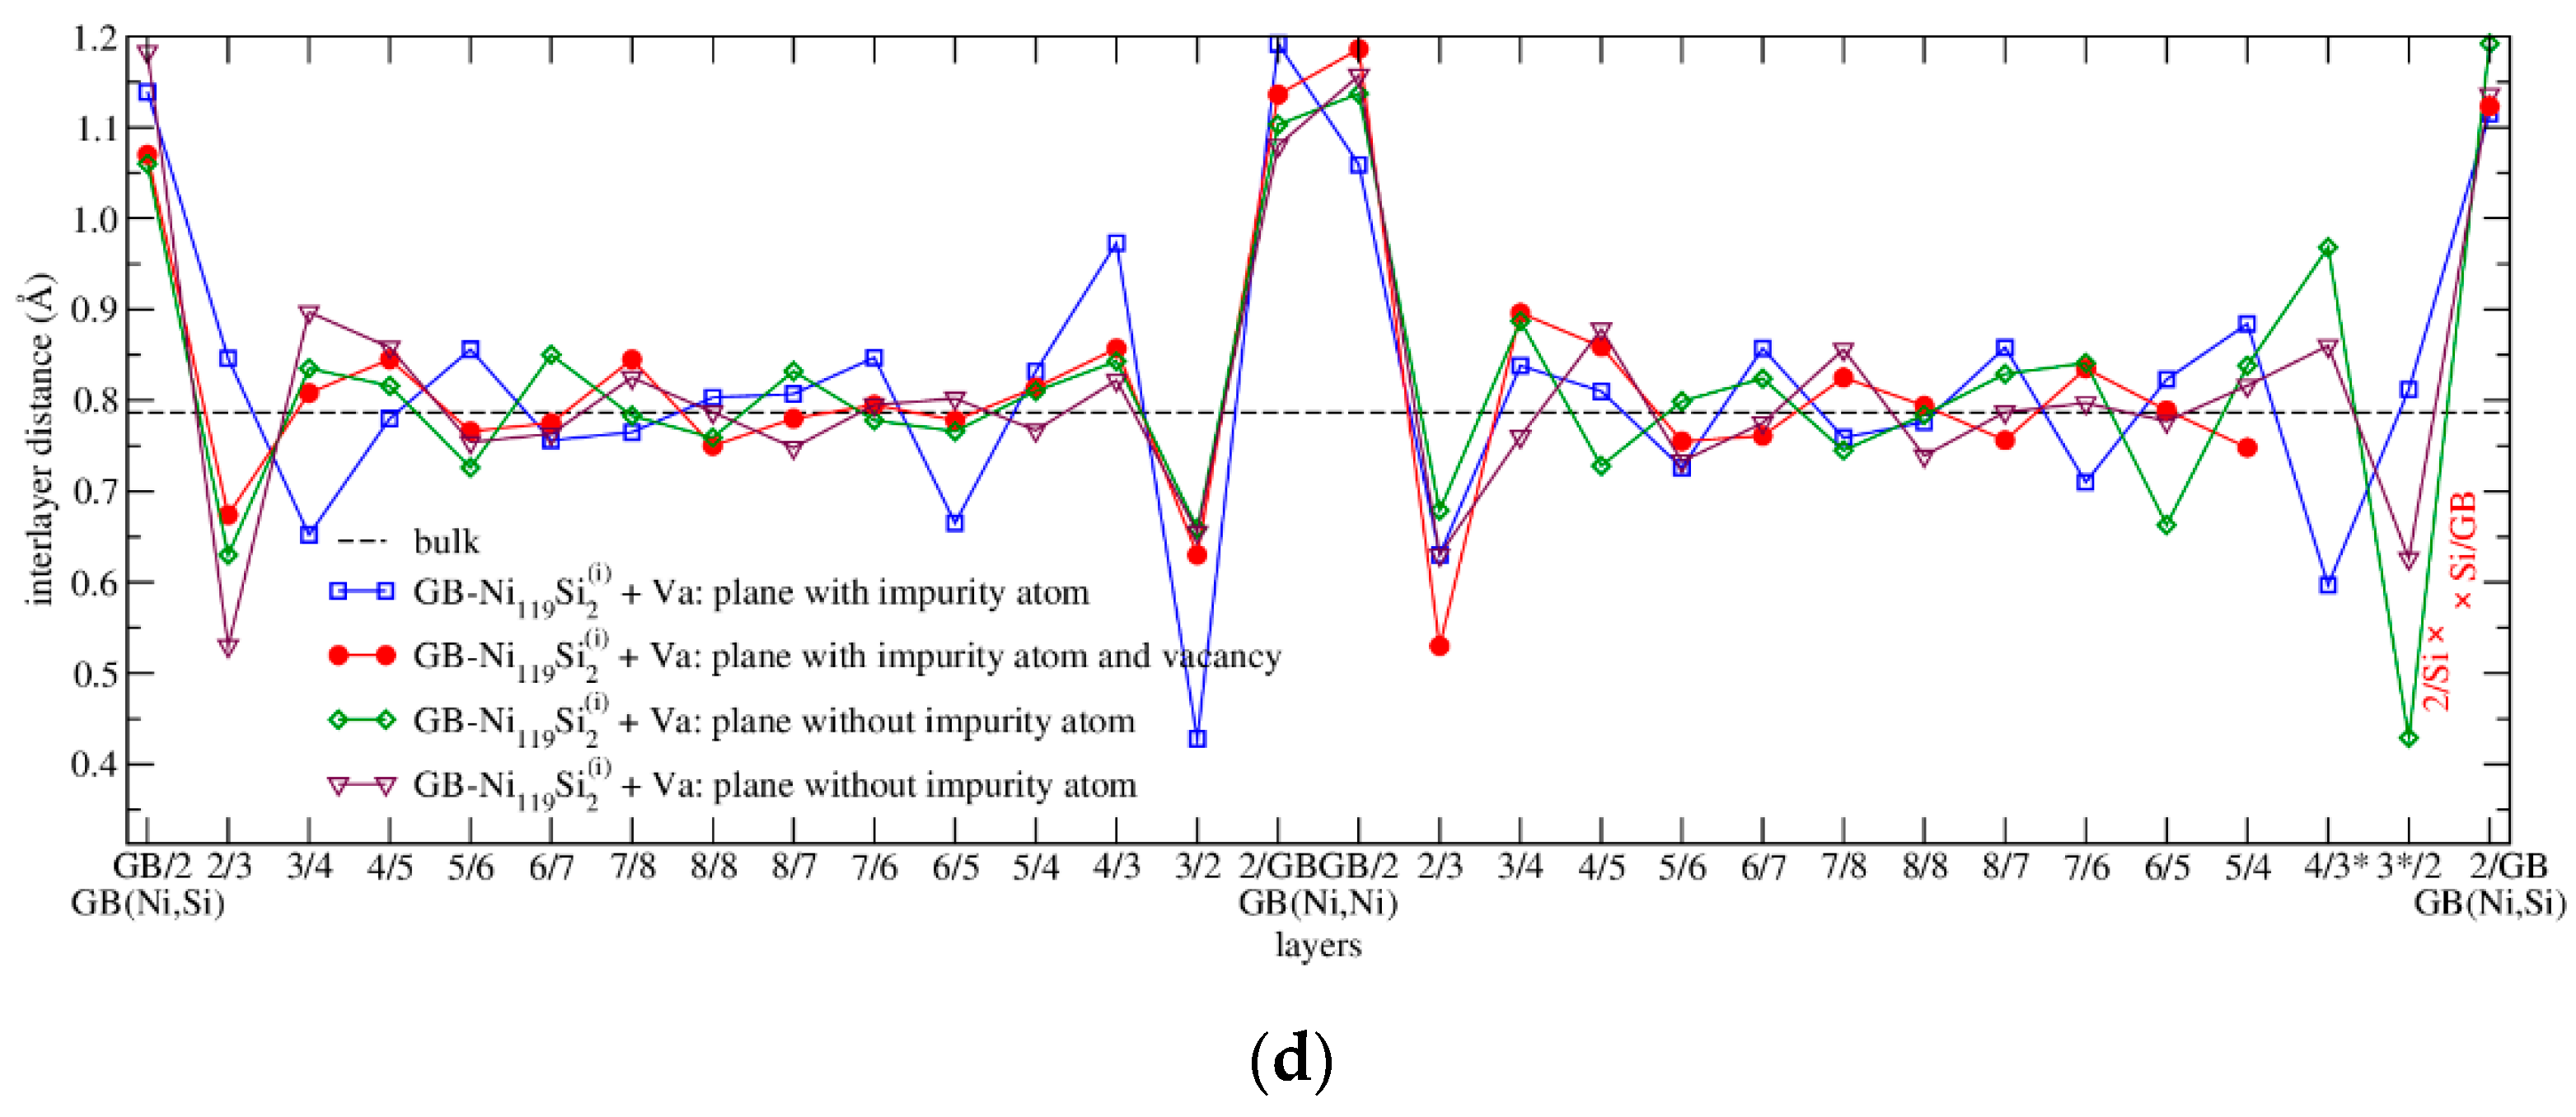
3.4.1. Structure Arrangement
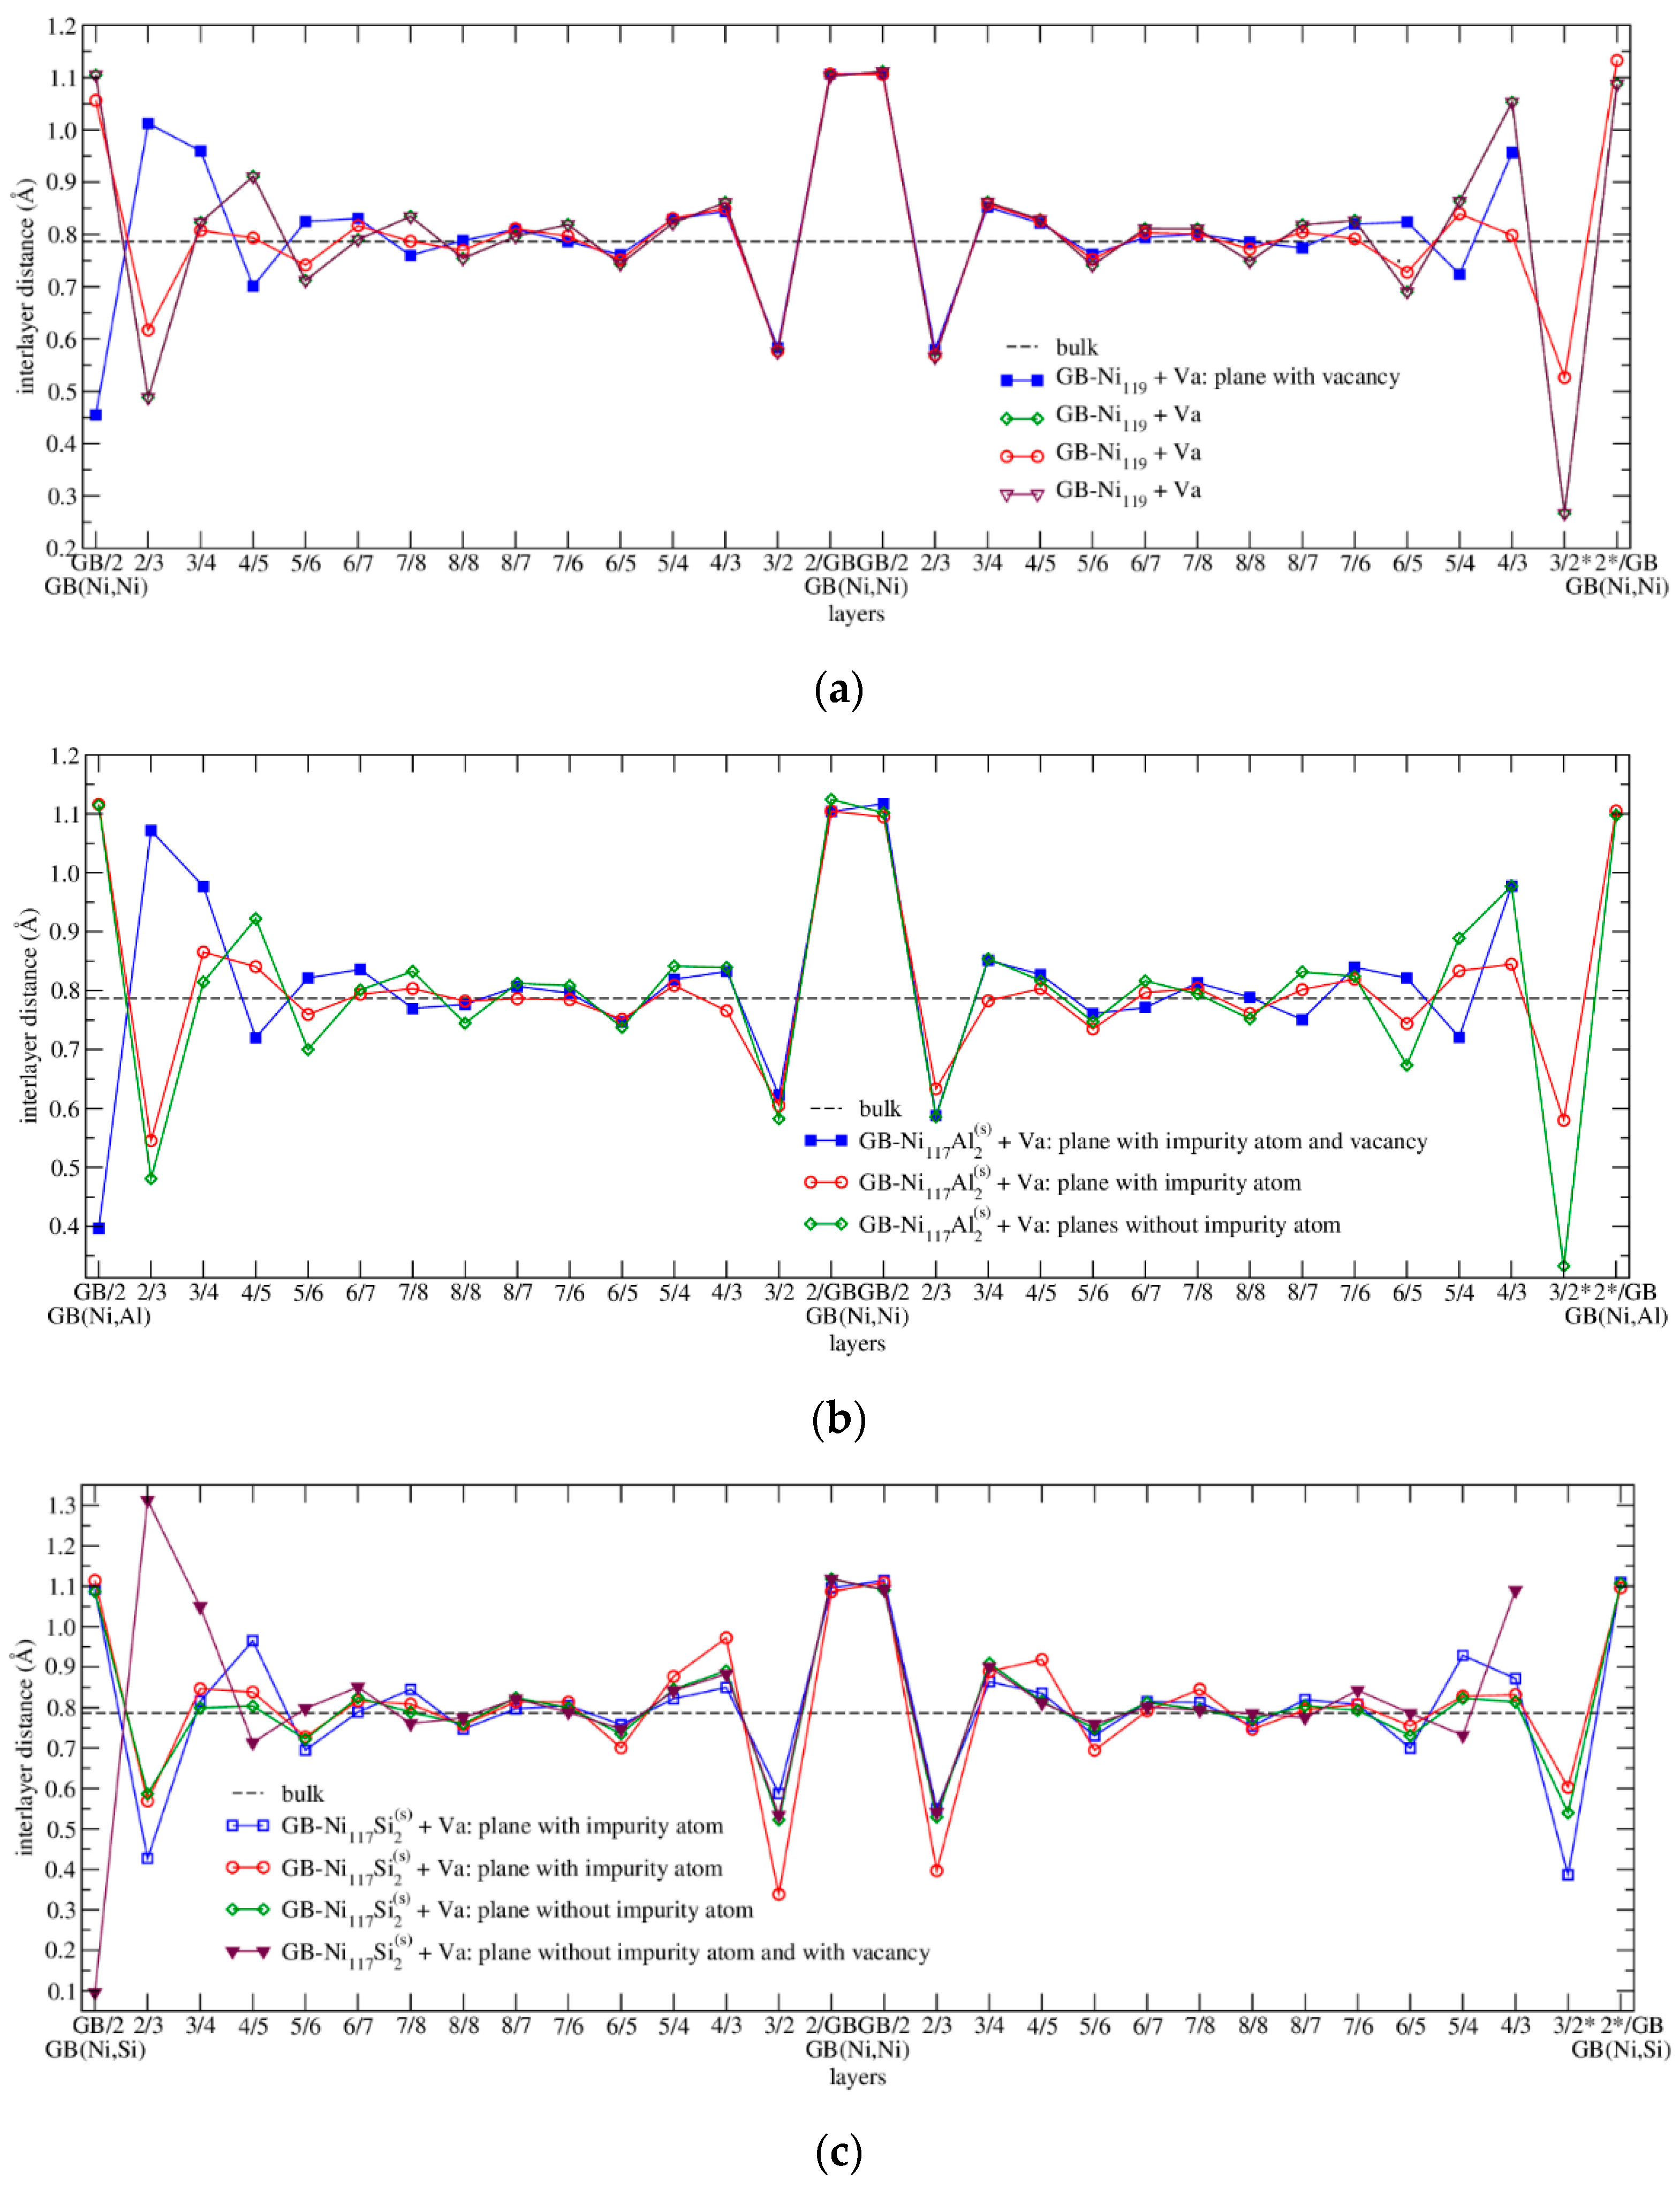
3.4.2. Energetics
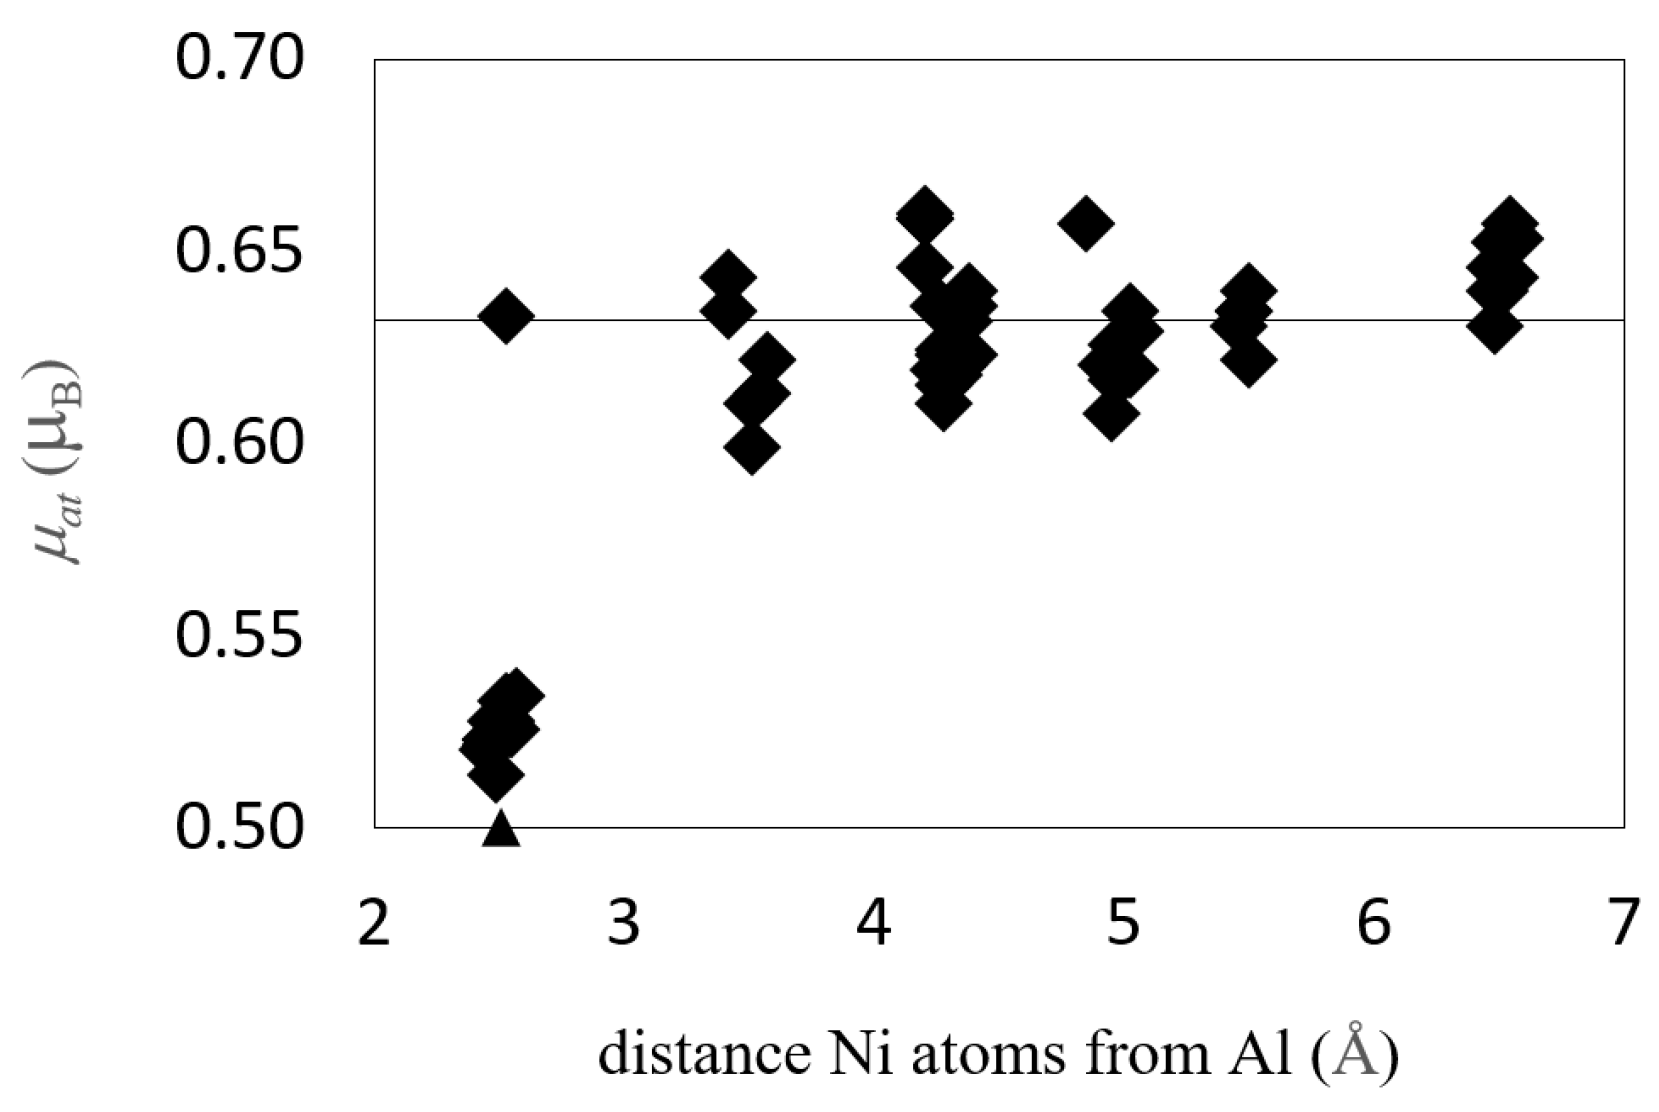
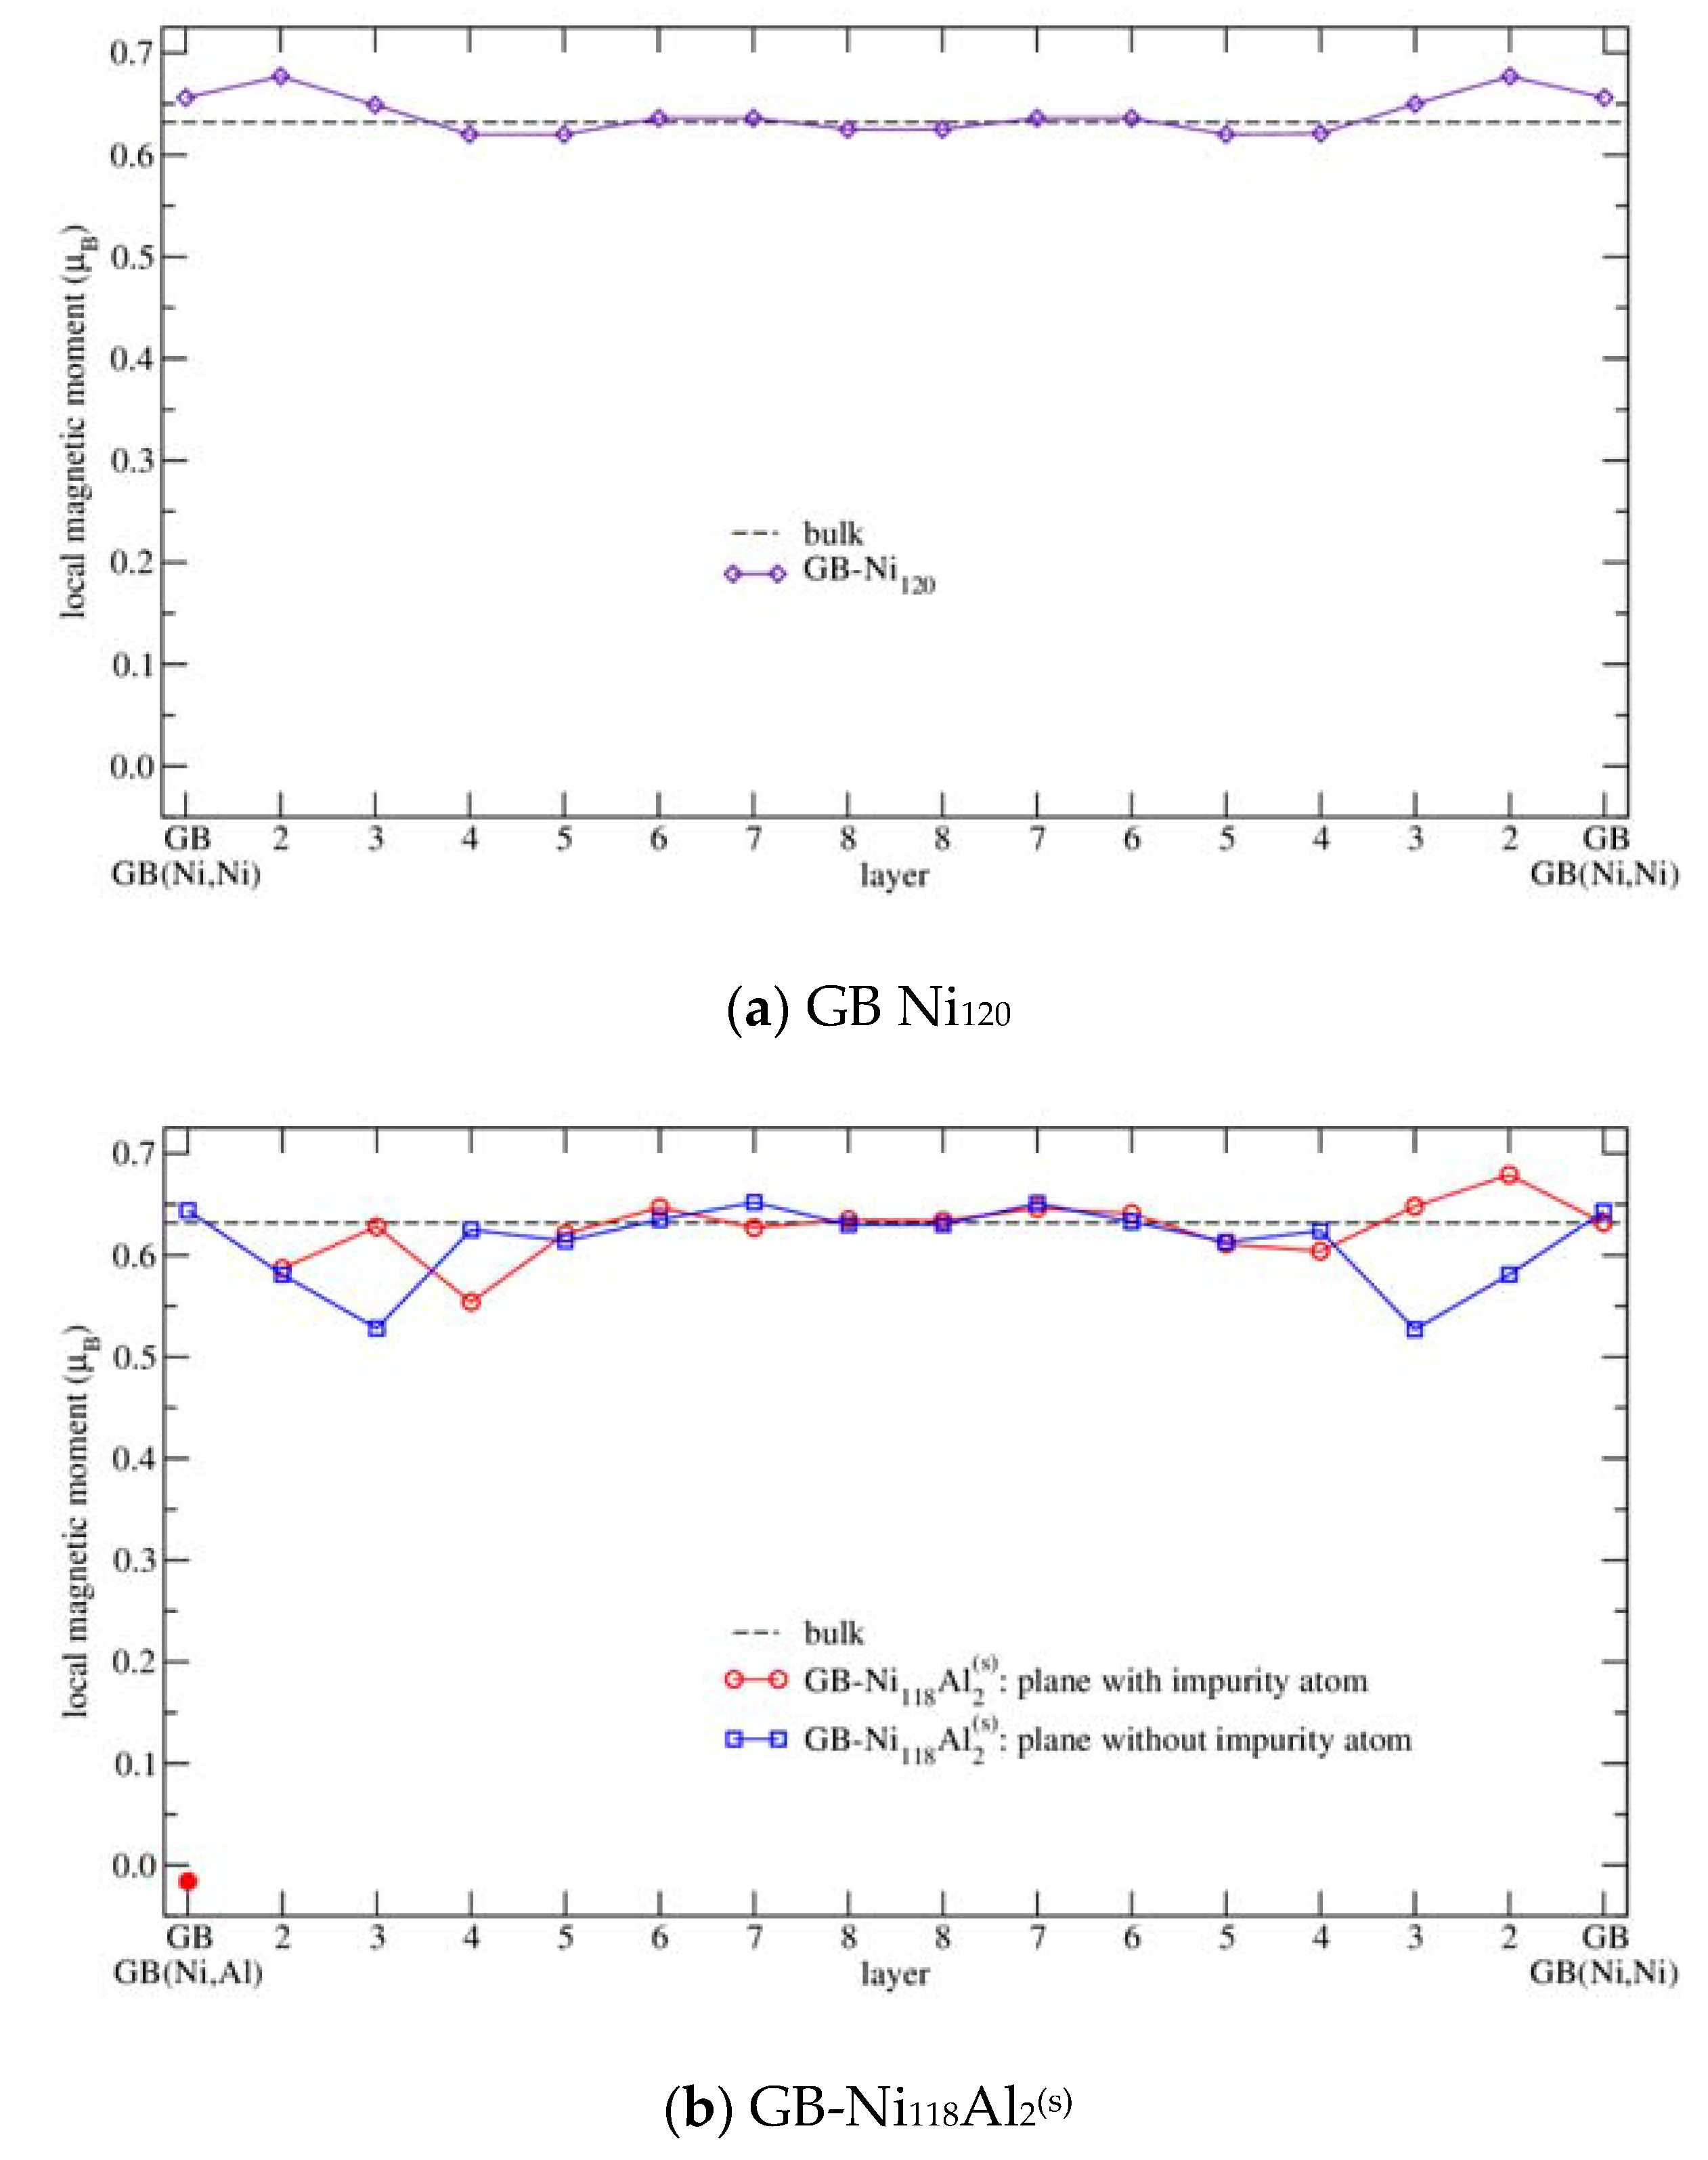
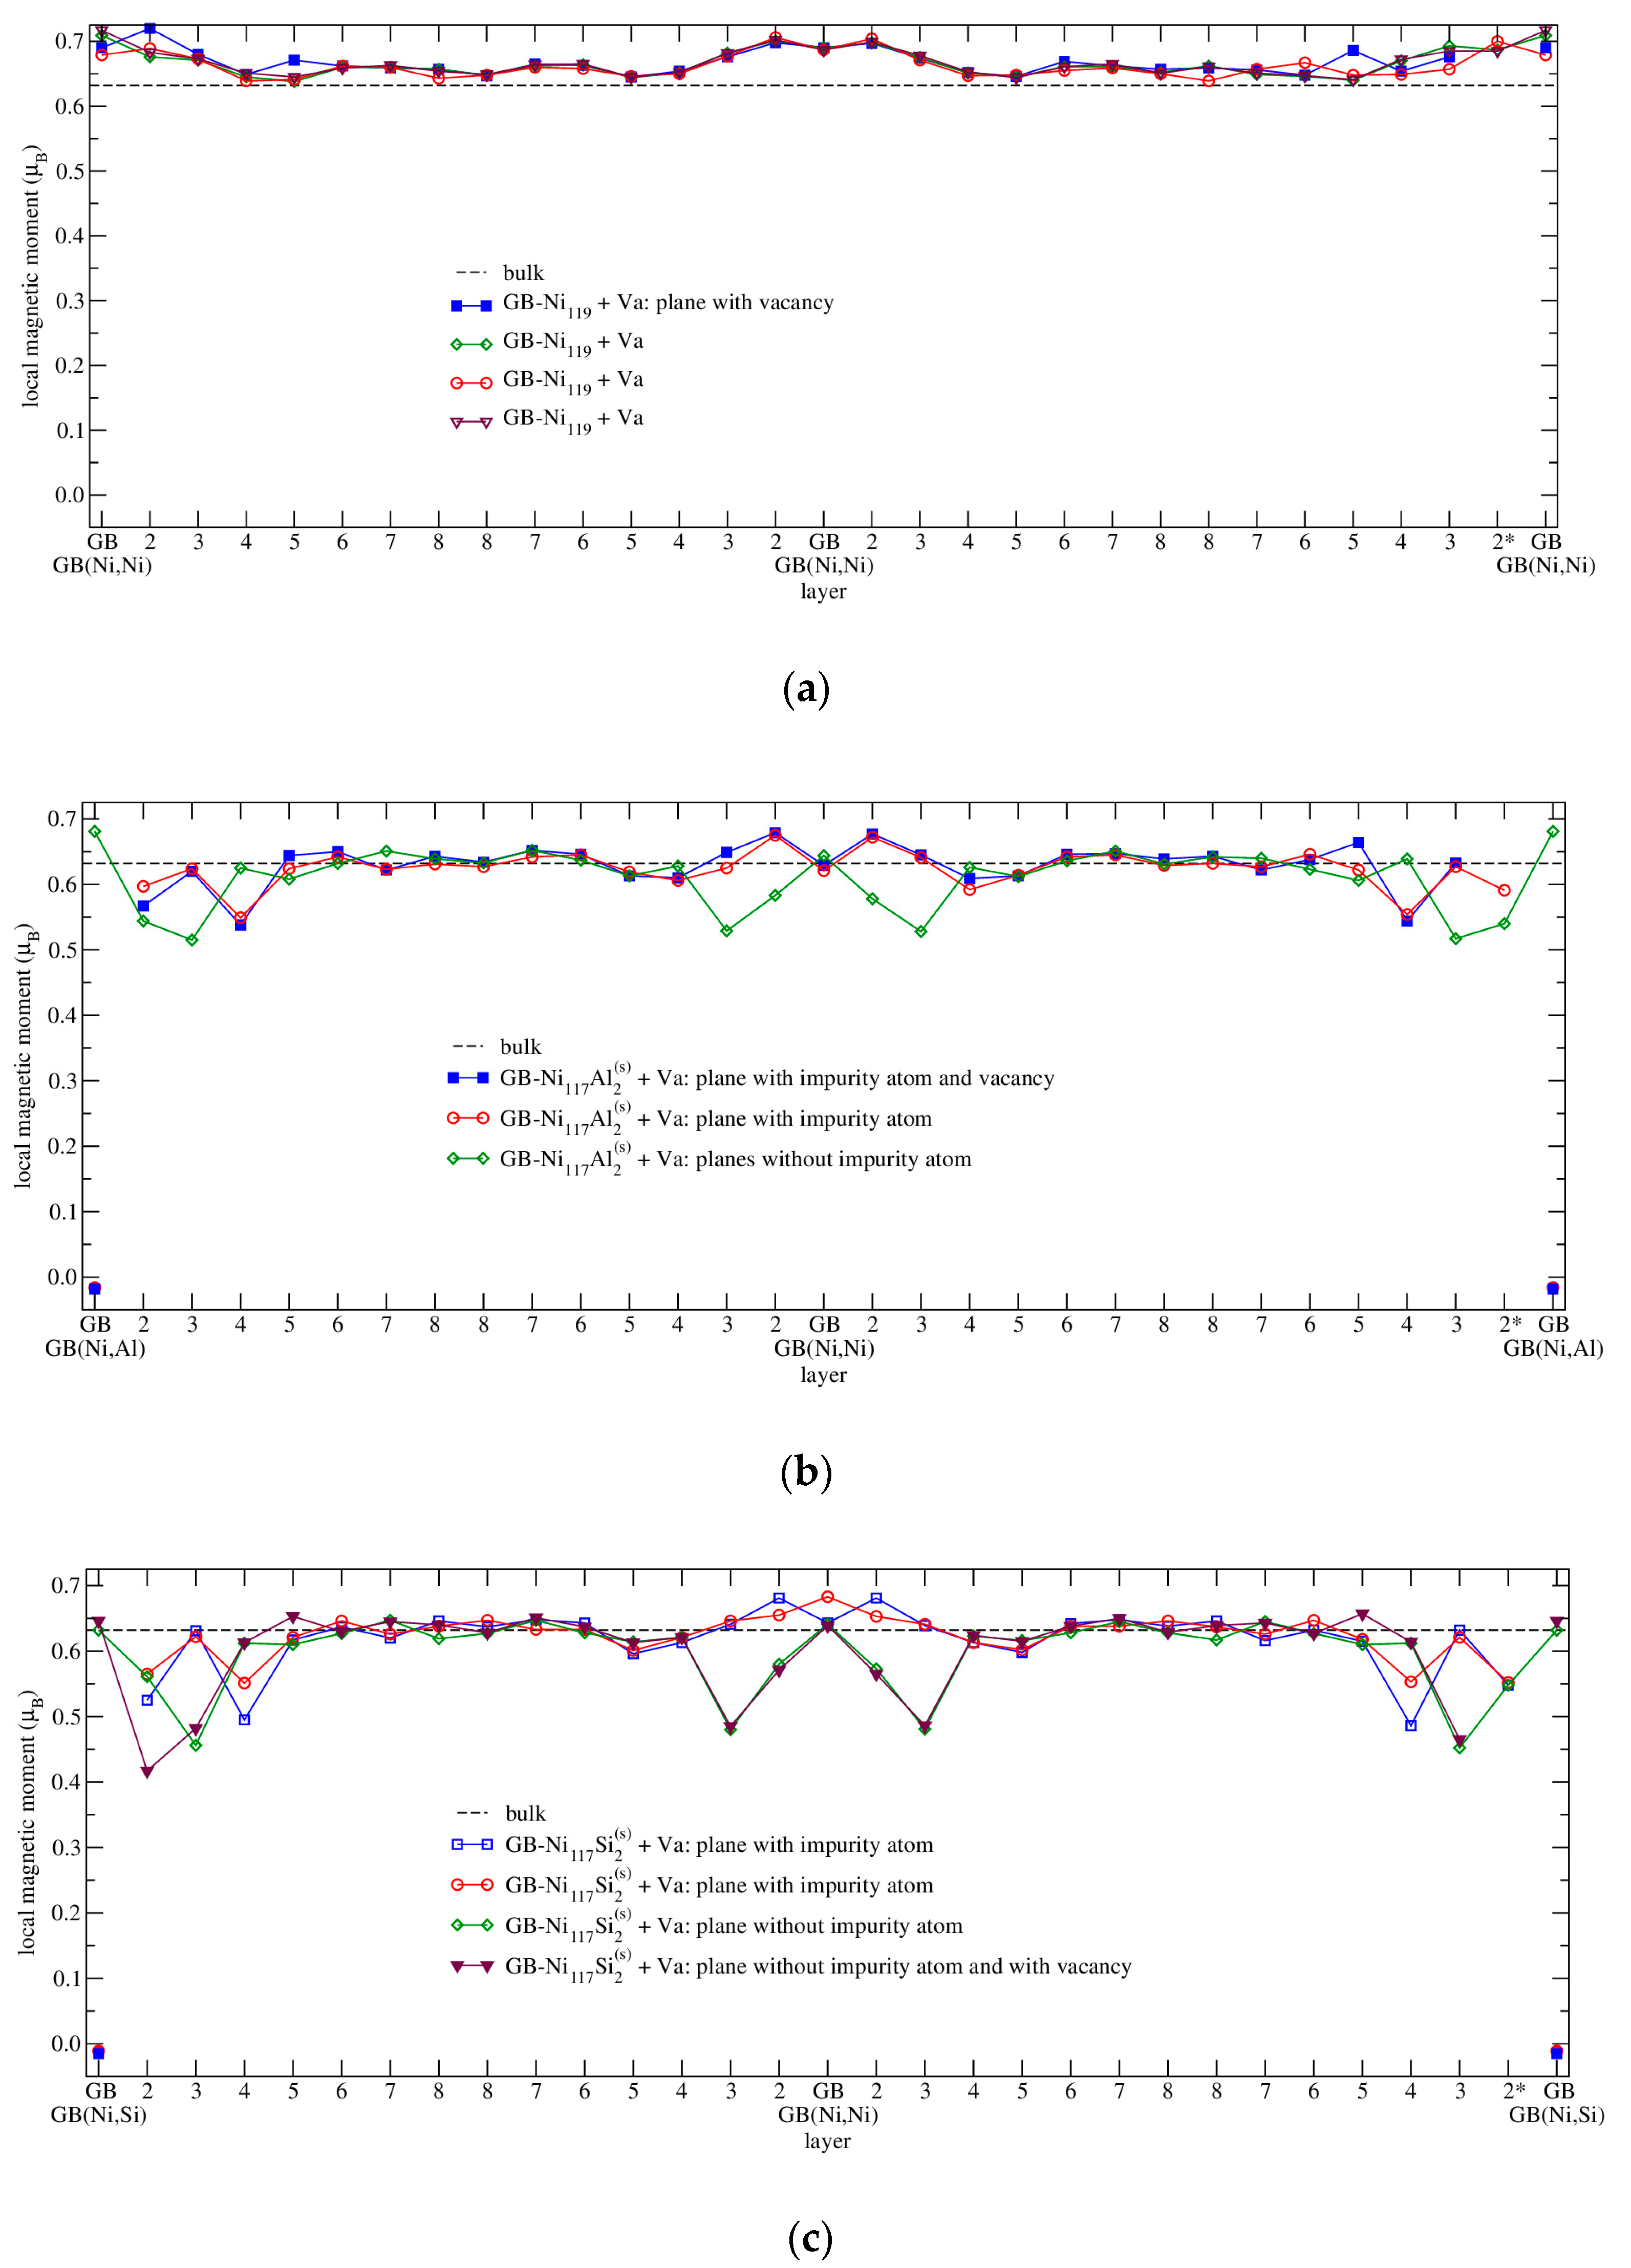
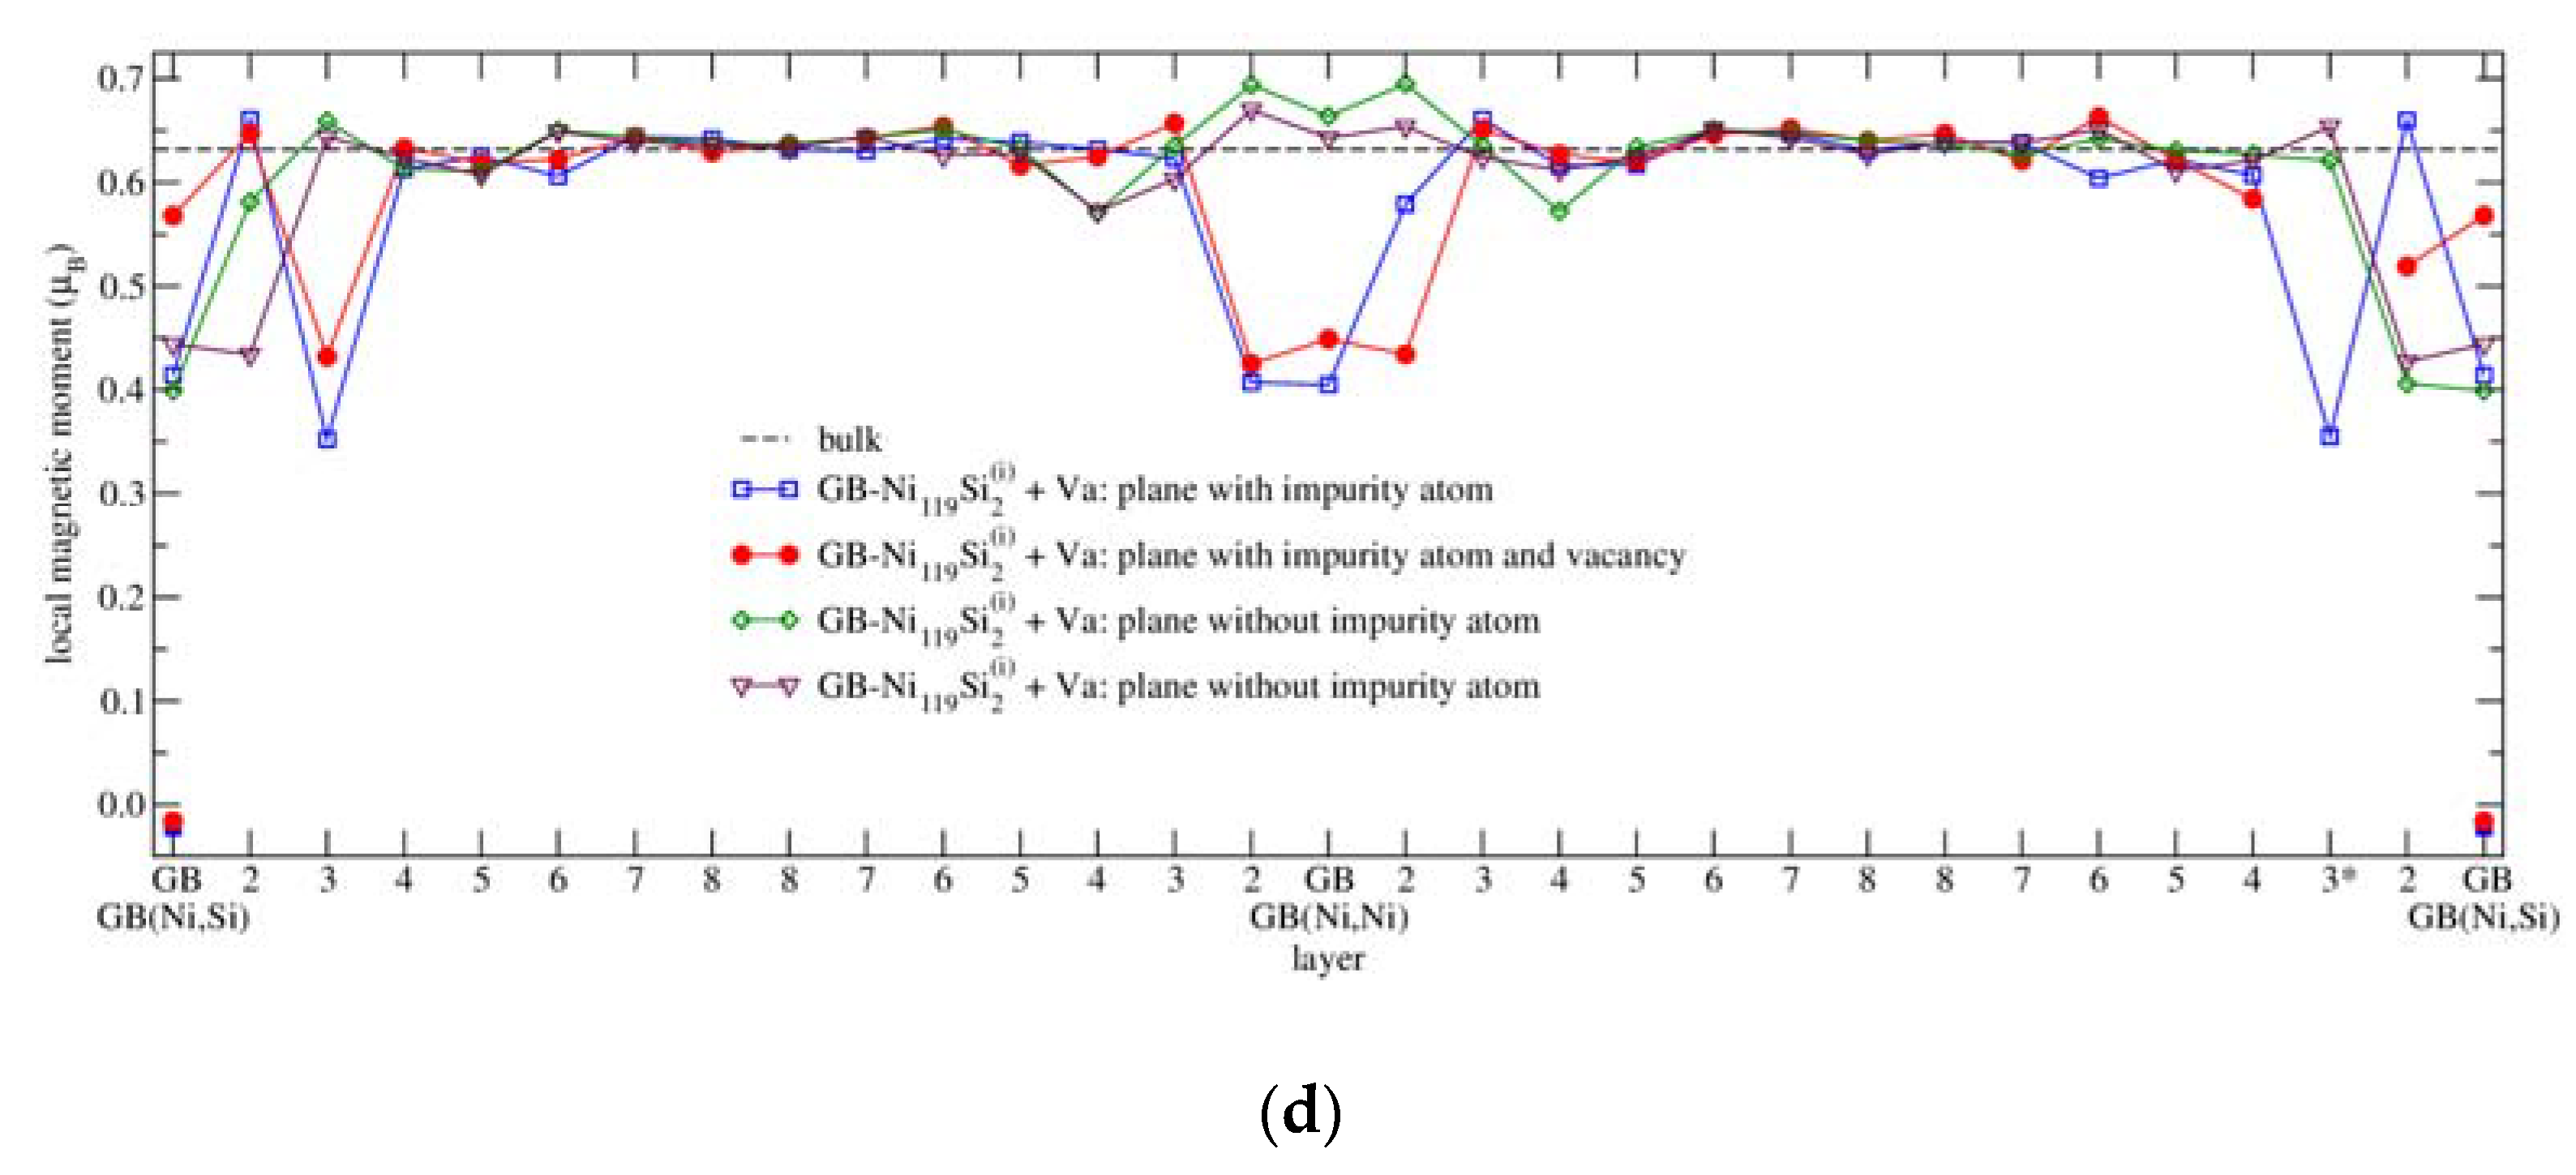
3.4.3. Magnetism
4. Conclusions
Supplementary Materials
Author Contributions
Funding
Acknowledgments
Conflicts of Interest
References
- Lejček, P. Grain Boundary Segregation in Metals. In Springer Series in Materials Science; Springer: Berlin/Heidelberg, Germany, 2010; Volume 136. [Google Scholar]
- Všianská, M.; Šob, M. The effect of segregated sp-impurities on grain-boundary and surface structure, magnetism and embrittlement in nickel. Prog. Mater. Sci. 2011, 56, 817. [Google Scholar] [CrossRef]
- Lejček, P.; Šob, M.; Paidar, V. Interfacial segregation and grain boundary embrittlement: An overview and critical assessment of experimental data and calculated results. Prog. Mater. Sci. 2017, 87, 83. [Google Scholar] [CrossRef]
- Všianská, M.; Vémolová, H.; Šob, M. Segregation of sp-impurities at grain boundaries and surfaces: Comparison of fcc cobalt and nickel. Model. Simul. Mater. Sci. Eng. 2017, 25, 085004. [Google Scholar] [CrossRef]
- Razumovskiy, V.I.; Lozovoi, A.Y.; Razumovskii, I.M. First-principles-aided design of a new Ni-base superalloy: Influence of transition metal alloying elements on grain boundary and bulk cohesion. Acta Mater. 2015, 82, 369. [Google Scholar] [CrossRef]
- Liu, W.; Han, H.; Ren, C.; Yin, H.; Zou, Y.; Huai, P.; Xu, H. Effects of rare-earth on the cohesion of Ni Σ5(012) grain boundary from first-principles calculations. Comput. Mater. Sci. 2015, 96, 374. [Google Scholar] [CrossRef]
- Wenguan, L.; Yuan, Q.; Dongxun, Z.; Youshi, Z.; Xingbo, H.; Xinxin, C.; Huiqin, Y.; Guo, Y.; Guanghua, W.; Shengwei, W.; et al. A theoretical study of the effects of sp-elements on hydrogen in nickel-based alloys. Comput. Mater. Sci. 2017, 128, 37. [Google Scholar]
- Bentria, E.T.; Lefkaier, I.K.; Benghia, A.; Bentria, B.; Kanoun, M.B.; Goumri-Said, S. Toward a better understanding of the enhancing/embrittling effects of impurities in Nickel grain boundaries. Sci. Rep. 2019, 9, 1424. [Google Scholar] [CrossRef]
- Divinski, S.V.; Edelhoff, H. Diffusion and segregation of silver in copper ∑5(310) grain boundary. Phys. Rev. B 2012, 85, 144104. [Google Scholar] [CrossRef]
- Muller, D.A.; Subramanian, S.; Batson, P.E.; Silcox, J.; Sass, S.L. Structure, chemistry and bonding at grain boundaries in Ni3Al—I. The role of boron in ductilizing grain boundaries. Acta Mater. 1996, 44, 1637. [Google Scholar] [CrossRef]
- Aksoy, D.; Dingreville, R.; Spearot, D.E. Embedded-atom method potential parameterized for sulfur-induced embrittlement of nickel. Model. Simul. Mater. Sci. Eng. 2019, 27, 085016. [Google Scholar] [CrossRef]
- Lejček, P.; Všianská, M.; Šob, M. Recent trends and open questions in grain boundary segregation. J. Mater. Res. 2018, 33, 2647. [Google Scholar] [CrossRef]
- Prakash, S. Structural alloys for power plants. In Operational Challenges and High-Temperature Materials; Woodhead Pub.: Waltham, MA, USA, 2014. [Google Scholar]
- Wang, M.; Deng, Q.; Du, J.; Tian, Y.; Zhu, J. The Effect of aluminum on microstructure and mechanical properties of ATI 718Plus alloy. Mater. Trans. 2015, 56, 635. [Google Scholar] [CrossRef]
- Zhu, H.Q.; Guo, S.R.; Guan, H.R.; Zhu, V.X.; Hu, Z.Q.; Murata, V.; Morinaga, M. The effect of silicon on the microstructure and segregation of directionally solidified IN738 superalloy. Mater. High Temp. 2016, 12, 285. [Google Scholar] [CrossRef]
- Lefkaier, I.K.; Bentria, E.T. The Effect of Impurities in Nickel Grain Boundary: Density Functional Theory Study. In Study of Grain Boundary Character; Tanski, T., Borek, W., Eds.; IntechOpen: Rijeka, Croatia, 2017; Volume 1, p. 1. [Google Scholar]
- Smith, R.W.; Geng, W.T.; Geller, C.B.; Wu, R.; Freeman, A.J. The effect of Li, He and Ca on grain boundary cohesive strength in Ni. Scr. Mater. 2000, 43, 957. [Google Scholar] [CrossRef][Green Version]
- Brodetskii, I.L.; Kharchevnikov, V.P.; Belov, B.F.; Trotsan, A.I. Effect of calcium on grain boundary embrittlement of structural steel strengthened with carbonitrides. Met. Sci. Heat Treat. 1995, 37, 200. [Google Scholar] [CrossRef]
- Floreen, S.; Westbrook, J.H. Grain boundary segregation and the grain size dependence of strength of nickel-sulfur alloys. Acta Metall. 1969, 17, 1175. [Google Scholar] [CrossRef]
- Kronberg, M.L.; Wilson, F.H. Secondary recrystallization in copper. Trans. AIME 1949, 185, 501. [Google Scholar] [CrossRef]
- Wang, G.J.; Sutton, A.P.; Vítek, V. A computer simulation study of <001> and <111> tilt boundaries: The multiplicity of structures. Acta Metall. 1984, 32, 1093. [Google Scholar] [CrossRef]
- Wetzel, J.T.; Machlin, E.S. On calculated energies of segregation, grain boundary energies and lattice energy functions. Scr. Metall. 1983, 17, 555. [Google Scholar] [CrossRef]
- Chen, P.; Srolovitz, D.J.; Voter, A.F. Computer simulation on surfaces and [001] symmetric tilt grain boundaries in Ni, Al, and Ni3Al. J. Mater. Res. 1989, 4, 62. [Google Scholar] [CrossRef]
- Kresse, G.; Hafner, J. Ab initio molecular dynamics for open-shell transition metals. Phys. Rev. B 1993, 48, 13115. [Google Scholar] [CrossRef]
- Kresse, G.; Furthmüller, J. Efficient iterative schemes for ab initio total-energy calculations using a plane-wave basis set. Phys. Rev. B 1996, 54, 11169. [Google Scholar] [CrossRef]
- Kresse, G.; Furthmüller, J. Efficiency of ab-initio total energy calculations for metals and semiconductors using a plane-wave basis set. Comput. Mater. Sci. 1996, 6, 15. [Google Scholar] [CrossRef]
- Blöchl, P.E. Projector augmented-wave method. Phys. Rev. B 1994, 50, 17953. [Google Scholar] [CrossRef] [PubMed]
- Kresse, G.; Joubert, D. From ultrasoft pseudopotentials to the projector augmented-wave method. Phys. Rev. B 1999, 59, 1758. [Google Scholar] [CrossRef]
- Perdew, J.P.; Burke, K.; Ernzerhof, M. Generalized gradient approximation made simple. Phys. Rev. Lett. 1996, 77, 3865. [Google Scholar] [CrossRef]
- Haglund, J.; Guillermet, F.; Grimvall, G.; Korling, M. Theory of bonding in transition-metal carbides and nitrides. Phys. Rev. B 1993, 48, 11685. [Google Scholar] [CrossRef]
- Kohlhaas, R.; Donner, P.; Schmitz-Pranghe, N.; Angew, Z. The temperature-dependence of the lattice parameters of iron, cobalt, and nickel in the high temperature range. Physics 1967, 23, 245. [Google Scholar]
- Všianská, M. Electronic Structure and Properties of Grain Boundaries in Nickel. Ph.D. Thesis, Masaryk University, Brno, Czech Republic, 2013. [Google Scholar]
- Saal, J.E.; Kirklin, S.; Aykol, M.; Meredig, B.; Wolverton, C. The open quantum materials database (OQMD): Materials design and discovery with high-throughput density functional theory. J. Miner. Met. Mater. Soc. 2013, 65, 1501. [Google Scholar] [CrossRef]
- Kirklin, S.; Saal, J.E.; Meredig, B.; Thompson, A.; Doak, J.W.; Aykol, M.; Rühl, S.; Wolverton, C. The open quantum materials database (OQMD): Assessing the accuracy of DFT formation energies. Comput. Mater. 2015, 1, 15010. [Google Scholar] [CrossRef]
- Connétable, D.; Andrieu, E.; Monceau, D. First-principles nickel database: Energetics of impurities and defects. Comput. Mater. Sci. 2015, 101, 77. [Google Scholar] [CrossRef]
- Kandaskalov, D.; Monceau, D.; Mijoule, C.; Connétable, D. First-principles study of sulfur multi-absorption in nickel and its segregation to the Ni(100) and Ni(111) surfaces. Surf. Sci. 2013, 617, 15. [Google Scholar] [CrossRef]
- Korhonen, T.; Puska, M.J.; Nieminen, R.M. Vacancy-formation energies for fcc and bcc transition metals. Phys. Rev. B 1995, 51, 9526. [Google Scholar] [CrossRef] [PubMed]
- Wolff, J.; Franz, M.; Kluin, J.E.; Schmid, D. Vacancy formation in nickel and α-nickel-carbon alloy. Acta Mater. 1997, 45, 4759. [Google Scholar] [CrossRef]
- Connétable, D.; Ter-Ovanessian, B.; Andrieu, E. Diffusion and segregation of niobium in fcc-nickel. J. Phys. Condens. Matter 2012, 24, 095010. [Google Scholar] [CrossRef]
- Nazarov, R.; Hickel, T.; Neugebauer, J. Ab initio study of H-vacancy interactions in fcc metals: Implications for the formation of superabundant vacancies. Phys. Rev. B 2014, 89, 144108. [Google Scholar] [CrossRef]
- Tanguy, D.; Wang, Y.; Connétable, D. Stability of vacancy-hydrogen clusters in nickel from first-principles calculations. Acta Mater. 2014, 78, 135. [Google Scholar] [CrossRef]
- Subashiev, A.V.; Nee, H.H. Hydrogen trapping at divacancies and impurity-vacancy complexes in nickel: First principles study. J. Nucl. Mater. 2017, 487, 135. [Google Scholar] [CrossRef]
- Kostromin, B.F.; Plishkin, Y.M.; Podchinyonov, I.E.; Trakhtenberg, I.S. Detecting the relation between the diffusion parameters and the point defect microscopic characteristics by a computer simulation method. Fiz. Met. Metalloved. 1983, 55, 450. [Google Scholar]
- Ackland, G.I.; Tichy, G.; Vitek, V.; Finnis, M.W. Simple N-body potentials for the noble metals and nickel. Philos. Mag. A 1987, 56, 735. [Google Scholar] [CrossRef]
- Krause, U.; Kuska, J.P.; Wedell, R. Monovacancy formation energies in cubic crystals. Phys. Status Solidi 1989, 151, 479. [Google Scholar] [CrossRef]
- Rosato, V.; Guillope, M.; Legrand, B. Thermodynamical and structural properties of f.c.c. transition metals using a simple tight-binding model. Philos. Mag. A 1989, 59, 321. [Google Scholar] [CrossRef]
- Ghorai, A. Calculation of some defect parameters in F.C.C. Metals. Phys. Status Solidi 1991, 167, 551. [Google Scholar] [CrossRef]
- Černý, M.; Šesták, P.; Řehák, P.; Všianská, M.; Šob, M. Atomistic approaches to cleavage of interfaces. Model. Simul. Mater. Sci. Eng. 2019, 27, 035007. [Google Scholar] [CrossRef]
- Čák, M.; Šob, M.; Hafner, J. First-principles study of magnetism at grain boundaries in iron and nickel. Phys. Rev. B 2008, 78, 054418. [Google Scholar] [CrossRef]
- Yamaguchi, M.; Shiga, M.; Kaburaki, H. Energetics of segregation and embrittling potency for non-transition elements in the Ni Σ5 (012) symmetrical tilt grain boundary: A first-principles study. J. Phys. Condens. Matter 2004, 16, 3933. [Google Scholar] [CrossRef]
- Shvindlerman, L.S.; Gottstein, G. Cornerstones of grain structure evolution and stability: Vacancies, boundaries, triple junctions. J. Mater. Sci. 2005, 40, 819. [Google Scholar] [CrossRef]
- Shvindlerman, L.S.; Gottstein, G.; Ivanov, V.A.; Molodov, D.A.; Kolesnikov, D.; Lojkowski, W. Grain boundary excess free volume—direct thermodynamic measurement. J. Mater. Sci. 2006, 41, 7725. [Google Scholar] [CrossRef]
- Berthier, F.; Legrand, B.; Tréglia, G. New structures and atomistic analysis of the polymorphism for the ∑5(210) [001] Tilt Boundary. Interface Sci. 2000, 8, 55. [Google Scholar] [CrossRef]
- Rajagopalan, M.; Tschopp, M.A.; Solanki, K.N. Grain boundary segregation of interstitial and substitutional impurity atoms in alpha-iron. J. Miner. Met. Mater. Soc. 2014, 66, 129. [Google Scholar] [CrossRef]
- Yamaguchi, M.; Shiga, M.; Kaburaki, H. Grain boundary decohesion by impurity segregation in a nickel-sulfur system. Science 2005, 307, 393. [Google Scholar] [CrossRef] [PubMed]
- Všianská, M.; Šob, M. Magnetically dead layers at sp-impurity-decorated grain boundaries and surfaces in nickel. Phys. Rev. B 2011, 84, 014418. [Google Scholar] [CrossRef]
- Turek, I.; Kudrnovský, J.; Šob, M.; Drchal, V.; Weinberger, P. Ferromagnetism of imperfect ultrathin Ru and Rh films on a Ag (001) substrate. Phys. Rev. Lett. 1995, 74, 2551. [Google Scholar] [CrossRef] [PubMed]
- Kisker, H.; Kronmüller, H.; Schaefer, H.E.; Suzuki, T. Magnetism and microstructure of nanocrystalline nickel. J. Appl. Phys. 1996, 79, 5143. [Google Scholar] [CrossRef]
- Suliţanu, B.; Brînzã, F. Structure-properties relationships in electrodeposited Ni-W thin films with columnar nanocrystallites. J. Optoelectron. Adv. Mater. 2003, 5, 421. [Google Scholar]
- Tanimoto, H.; Pasquini, L.; Prümmer, R.; Kronmüller, H.; Schaefer, H.E. Self-diffusion and magnetic properties in explosion densities nanocrystalline Fe. Scr. Mater. 2000, 42, 961. [Google Scholar] [CrossRef]
- Kecskes, L.; Qiu, X.; Lin, R.; Graeter, J.; Guo, S.M.; Wang, J. Combustion synthesis reaction behavior of cold-rolled Ni/Al and Ti/Al multilayers. In Army Research Laboratory Report ARL-TR-5507; U.S. Army Research Research Laboratory: Aberdeen Proving Ground, MD, USA, 2011. [Google Scholar]
- Nash, P.; Nash, A. The Ni−Si (Nickel-Silicon) system. Bull. Alloy Phase Diagr. 1987, 8, 6. [Google Scholar] [CrossRef]
- Lejček, P.; Šob, M.; Paidar, V.; Vitek, V. Why calculated energies of grain boundary segregation are unreliable when segregant solubility is low. Scr. Mater. 2013, 68, 547. [Google Scholar] [CrossRef]
- Farkas, D. Atomistic theory and computer simulation of grain boundary structure and diffusion. J. Phys. Condens. Matter 2000, 12, 497. [Google Scholar] [CrossRef]
- Sørensen, M.R.; Mishin, Y.; Voter, A.F. Diffusion mechanisms in Cu grain boundaries. Phys. Rev. B 2000, 62, 3658. [Google Scholar] [CrossRef]
- Brokman, A.; Bristove, P.D.; Ballufi, R.W. Computer simulation study of the structure of vacancies in grain boundaries. J. Appl. Phys. 1981, 52, 6116. [Google Scholar] [CrossRef]
- Gillan, M.J. Calculation of the vacancy formation energy in aluminium. J. Phys. Condens. Matter 1989, 1, 689. [Google Scholar] [CrossRef]
- Mattsson, T.R.; Mattsson, A.E. Calculating the vacancy formation energy in metals: Pt, Pd, and Mo. Phys. Rev. B 2002, 66, 214110. [Google Scholar] [CrossRef]
- Zhang, P.; Zou, T.; Zhao, J.; Zheng, P.; Chen, J. Effect of helium and vacancies in a vanadium grain boundary by first-principles. Nucl. Instrum. Methods Phys. Res. Sect. B 2015, 352, 121. [Google Scholar] [CrossRef]
- Janot, C.; George, B.; Delcroix, P. Point defects in vanadium investigated by Mossbauer spectroscopy and positron annihilation. J. Phys. F Met. Phys. 1982, 12, 47. [Google Scholar] [CrossRef]
- Fitzsimmons, M.R.; Röll, A.; Burkel, E.; Sickafus, K.E.; Nastasi, M.A.; Smith, G.S.; Pynn, R. The magnetization of a grain boundary in nickel. Nanostructured Mater. 1995, 6, 539. [Google Scholar] [CrossRef]
- Hirayama, K.; Ii, S.; Tsurekawa, S. Transmission electron microscopy/electron energy loss spectroscopy measurements and ab initio calculation of local magnetic moments at nickel grain boundaries. Sci. Technol. Adv. Mater. 2014, 15, 015005. [Google Scholar] [CrossRef]
- Crampin, S.; Vvedensky, D.D.; MacLaren, J.M.; Eberhart, M.E. Electronic structure near (210) tilt boundaries in nickel. Phys. Rev. B 1989, 40, 3413. [Google Scholar] [CrossRef]
- Geng, W.T.; Freeman, A.J.; Wu, R.; Geller, C.B.; Raynolds, J.E. Embrittling and strengthening effects of hydrogen, boron, and phosphorus on a 5 nickel grain boundary. Phys. Rev. B 1999, 60, 7149. [Google Scholar] [CrossRef]
- Szpunar, B.; Erb, U.; Palumbo, G.; Aust, K.T.; Lewis, L.J. Magnetism in complex atomic structures: Grain boundaries in nickel. Phys. Rev. B 1996, 53, 5547. [Google Scholar] [CrossRef]
- Kuriplach, J.; Melikhova, O.; Hou, M.; Van Petegem, S.; Zhurkin, E.; Šob, M. Positron annihilation in vacancies at grain boundaries in metals. Appl. Surf. Sci. 2008, 255, 128. [Google Scholar] [CrossRef]
- Kuriplach, J.; Melikhova, O.; Hou, M.; Van Petegem, S.; Zhurkin, E.; Šob, M. Positron annihilation at grain boundaries in metals. Phys. Status Solidi C 2007, 4, 3461. [Google Scholar] [CrossRef]
- Černý, M.; Šesták, P.; Řehák, P.; Všianská, M.; Šob, M. Ab initio tensile tests of grain boundaries in the fcc crystals of Ni and Co with segregated sp-impurities. Mater. Sci. Eng. A Struct. Mater. Prop. Microstruct. Process. 2016, 669, 218. [Google Scholar] [CrossRef]
- Řehák, P.; Černý, M.; Šob, M. Mechanical stability of Ni and Ir under hydrostatic and uniaxial loading. Model. Simul. Mater. Sci. Eng. 2015, 23, 055010. [Google Scholar] [CrossRef]
- Xiao, W.; Liu, C.S.; Tian, Z.X.; Geng, W.T. Effect of applied stress on vacancy segregation near the grain boundary in nickel. J. Appl. Phys. 2008, 104, 053519. [Google Scholar] [CrossRef]
- Lejček, P.; Hofmann, S.; Paidar, V. The significance of entropy in grain boundary segregation. Materials 2019, 12, 492. [Google Scholar] [CrossRef]


| Configuration | a | b | c | Vat | Ef | μNi | μNi,NN | Reference |
|---|---|---|---|---|---|---|---|---|
| (Å) | (Å) | (Å) | (Å3) | (eV.atom−1) | (μB) | (μB) | ||
| Si | 5.469 | 5.469 | 5.469 | 20.443 | 0 | - | - | This work |
| Al | 4.040 | 4.040 | 4.040 | 16.481 | 0 | - | - | This work |
| Ni60 | 7.866 | 7.866 | 10.552 | 10.882 | 0 | 0.632 | - | This work |
| 7.824 | 7.824 | 10.497 | 10.710 | - | 0.628 | - | [32] | |
| 7.821 | 7.821 | 10.494 | 10.669 | - | 0.607 | - | [30] a | |
| 7.857 | 7.857 | 10.541 | 10.846 | - | - | - | [31] a | |
| Ni59Al(s) | 7.872 | 7.872 | 10.562 | 10.909 | −0.026 ** | 0.608 | 0.525 | This work |
| - | - | - | 10.735 | - | - | 0.528 | [32] | |
| - | - | - | - | −0.029 | - | - | [33,34] b | |
| Ni59Si(s) | 7.866 | 7.866 | 10.550 | 10.878 | −0.027 ** | 0.624 | 0.499 | This work |
| - | - | - | 10.699 | - | - | 0.484 | [32] | |
| - | - | - | - | −0.031 | - | - | [33,34] b | |
| Ni60Si(iT) * | 7.945 | 7.929 | 10.654 | 11.003 | 0.024 | 0.579 | 0.278 | This work |
| Ni120Si(iT) | 7.899 | 7.899 | 21.245 | 10.956 | 0.020 | 0.600 | 0.251 | This work |
| Ni60Si(iO) * | 7.938 | 7.938 | 10.670 | 11.021 | 0.026 | 0.598 | 0.302 | This work |
| Ni120Si(iO) | 7.903 | 7.903 | 21.218 | 10.951 | 0.014 ** | 0.623 | 0.302 | This work |
| Config. | D (Å) | a (Å) | b (Å) | c (Å) | Vat (Å3) | Ef (eV.atom−1) | Ef(Va) (eV.Va−1) | Eb(X;Va) (eV.X−1Va−1) |
|---|---|---|---|---|---|---|---|---|
| Ni59+Va | - | 7.8496 | 7.8497 | 10.5332 | 11.0003 | 0.0239 | 1.4101 | - |
| Ni58Al(s)+Va | 2.4594 | 7.8541 | 7.8652 | 10.5256 | 11.0206 | −0.0035 | 1.3664 | −0.0451 |
| 3.5249 | 7.8566 | 7.8561 | 10.5375 | 11.0236 | −0.0022 | 1.4431 | 0.0316 | |
| 4.2946 | 7.8595 | 7.8607 | 10.5340 | 11.0307 | −0.0023 | 1.4372 | 0.0257 | |
| 4.9448 | 7.8562 | 7.8615 | 10.5326 | 11.0255 | −0.0029 | 1.4018 | −0.0097 | |
| Ni58Si(s)+Va | 2.4263 | 7.8489 | 7.8409 | 10.5318 | 10.9856 | −0.0052 | 1.3005 | −0.1110 |
| 3.5024 | 7.8490 | 7.8493 | 10.5229 | 10.9883 | −0.0036 | 1.3949 | −0.0166 | |
| 4.2894 | 7.8485 | 7.8495 | 10.5259 | 10.9910 | −0.0030 | 1.4303 | 0.0188 | |
| 4.9468 | 7.8462 | 7.8470 | 10.5296 | 10.9881 | −0.0034 | 1.4067 | −0.0048 | |
| Ni59Si(iT)+Va (Ni59Si(s)*) | 1.5092 * | 7.8628 | 7.8630 | 10.5499 | 10.8050 | −0.0269 | −3.0488 * | --- * |
| 2.9128 * | 7.8630 | 7.8628 | 10.5500 | 10.8050 | −0.0269 | −3.0488 * | --- * | |
| 3.8100 * | 7.8630 | 7.8630 | 10.5498 | 10.8050 | −0.0269 | −3.0492 * | --- * | |
| 4.5578 * | 7.8643 | 7.8645 | 10.5406 | 10.8654 | −0.0269 | −3.0485 * | --- * | |
| 5.2036 * | 7.8630 | 7.8628 | 10.5499 | 10.8709 | −0.0269 | −3.0488 * | --- * | |
| Ni119Si(iT)+Va (Ni119Si(s)*) | 1.5233 * | 7.8639 | 7.8644 | 21.0950 | 10.8718 | −0.0136 | −4.0395 * | --- * |
| 2.9169 *,a | 8.2455 | 10.8490 | 14.9017 | 11.1086 | −0.0141 | −4.1043 * | --- * | |
| 4.5700 *,a | 9.5257 | 9.2313 | 14.8911 | 10.9022 | 0.0098 | −1.2291 * | --- * | |
| 5.1815b | 7.8916 | 7.8899 | 21.2043 | 11.0021 | 0.0244 | 0.5153 | −0.1578 | |
| Ni59Si(iO)+Va (Ni59Si(s)*) | 1.7603 * | 7.8632 | 7.8633 | 10.5498 | 10.8717 | −0.0271 | −3.2177 * | --- * |
| 3.4306 c | 7.9078 | 7.9159 | 10.6642 | 11.1259 | 0.0461 | 1.1772 | −0.2343 | |
| 3.9362 * | 7.8629 | 7.8629 | 10.5494 | 10.8703 | −0.0271 | −3.2181 * | --- * | |
| 5.2802 * | 7.8625 | 7.8630 | 10.5499 | 10.8704 | −0.0271 | −3.2192 * | --- * | |
| Ni119Si(iO)+Va (Ni119Si(s)*) | 1.7436 * | 7.8631 | 7.8631 | 21.1068 | 10.8749 | −0.0138 | −3.3306 * | --- * |
| 3.1287 | 7.9000 | 7.8963 | 21.2041 | 11.0227 | 0.0257 | 1.4128 | 0.0012 ** | |
| 3.9332 * | 7.8623 | 7.8629 | 21.1038 | 10.8720 | −0.0138 | −3.3306 * | --- * | |
| 5.2770 * | 7.8669 | 7.8669 | 21.1127 | 10.8886 | −0.0268 | −4.8852 * | --- * |
| Method of relax. | GB-Ni60 | GB-Ni120 | ||||||||||
| b/a | Vat (Å 3) | Vf (Å3.Å−2) | γGB (J.m−2) | b/a | Vat (Å3) | Vf (Å3.Å−2) | γGB (J.m−2) | |||||
| 1 | 3.13 | 11.12 | 0.26 | 1.29 1.23 [2] | 3.13 | 11.12 | 0.26 | 1.29 | ||||
| 2a | 3.09 | 11.20 | 0.34 | 1.31 1.43 * [50] | 3.09 | 11.20 | 0.34 | 1.30 | ||||
| 2b | 3.09 | 11.20 | 0.34 | 1.31 | 3.09 | 11.21 | 0.35 | 1.30 | ||||
| Method of relax. | GB-Ni118Al2(s) | GB-Ni118Si2(s) | GB-Ni120Si2(i) | |||||||||
| b/a | Vat (Å 3) | Vf (Å3.Å−2) | γGB (J.m−2) | b/a | Vat (Å 3) | Vf (Å3.Å−2) | γGB (J.m−2) | b/a | Vat (Å 3) | Vf (Å3.Å−2) | γGB (J.m−2) | |
| 1 | 3.11 | 11.14 | 0.26 | 2.50 | 3.12 | 11.11 | 0.26 | 2.71 | 3.15 | 11.10 | 0.11 | 0.64 |
| 2a | 3.08 | 11.22 | 0.29 | 2.53 | 3.08 | 11.19 | 0.28 | 2.75 | 3.13 | 11.13 | 0.13 | 0.65 |
| 2b | 3.09 | 11.23 | 0.29 | 2.53 | 3.08 | 11.19 | 0.28 | 2.75 | 3.13 | 11.13 | 0.14 | 0.65 |
| Structure | GB-Ni118Al2(s) | GB-Ni118Si2(s) | GB-Ni120Si2(i) |
|---|---|---|---|
| Method of relaxation | |||
| 1 | −0.144 | 0.222 | −0.258 |
| −0.22 * [2] | −0.76 * [2] | ||
| 0.05 * [8] | −0.71 * [8] | ||
| 2a | −0.132 | 0.252 | −0.281 |
| −0.19 * [50] | −0.83 * [50] | ||
| 2b | −0.132 | 0.252 | −0.275 |
| Structure | Plane | R (Å) | μat (μB) | Layer |
|---|---|---|---|---|
| GB-Ni118Al2(s) GB (Ni,X) | clean | 2.586 | 0.528 | 3 |
| clean | 2.599 | 0.581 | 2 | |
| with X | 2.634 | 0.588 | 2 | |
| with X | 2.639 | 0.554 | 4 | |
| GB-Ni118Si2(s) GB (Ni,X) | clean | 2.504 | 0.483 | 3 |
| clean | 2.588 | 0.572 | 2 | |
| with X | 2.592 | 0.563 | 2 | |
| with X | 2.645 | 0.552 | 4 | |
| GB-Ni120Si2(i) GB (Ni,X) | with X | 2.177 | 0.357 | 3 |
| clean | 2.278 | 0.429 | 2 | |
| with X | 2.312 | 0.420 | GB (Ni,X) | |
| clean | 2.444 | 0.453 | GB (Ni,X) |
| Structure | GB-Ni119+Va | GB-Ni117Al2(s)+Va | GB-Ni117Si2(s)+Va | GB-Ni119Si2(i)+Va | ||||
|---|---|---|---|---|---|---|---|---|
| Layer with Va | Ef(Va) (eV.Va−1) | Vf (Å3.Va−1) | Ef(Va) (eV.Va−1) | Vf (Å3.Va−1) | Ef(Va) (eV.Va−1) | Vf (Å3.Va−1) | Ef(Va) (eV.Va−1) | Vf (Å3.Va−1) |
| GB | 1.5727 | −1.2460 | 1.5808 | 6.3510 | 1.4961 | 2.6906 | 1.4304 | −5.6628 |
| 2 | 0.5791 | −9.7127 | 0.6169 | −3.3396 | 0.2466 | −5.7481 | 0.9106 | −10.8557 |
| 3 | 1.2866 | −4.0505 | 1.2833 | 3.2737 | 1.2105 | −1.3837 | 0.5746 | −14.3407 |
| 4 | 1.3088 | −4.9483 | 1.3428 | 1.5724 | 1.1510 | −5.5262 | 1.2894 | −8.8176 |
| 5 | 1.2874 | −4.7500 | 1.3190 | 1.8658 | 1.2819 | −0.4996 | 1.3253 | −9.1865 |
| Structure | GB-Ni119+Va | GB-Ni117Al2(s)+Va | GB-Ni117Si2(s)+Va | GB-Ni119Si2(i)+Va |
|---|---|---|---|---|
| Layer with Va | (eV.cell−1) | |||
| GB | 10.33 | 6.94 | 7.52 | 6.50 |
| 2 | 9.34 | 5.97 | 6.27 | 5.98 |
| 3 | 10.05 | 6.64 | 7.24 | 5.64 |
| 4 | 10.07 | 6.70 | 7.18 | 6.36 |
| 5 | 10.05 | 6.68 | 7.31 | 6.39 |
| Structure | Eb(Va;GB+X) | Eb(X;GB+Va) | Eb(GB+X;GB+Va) | Eb(X+Va;X+GB) | Eb(Va+X;Va+GB) |
|---|---|---|---|---|---|
| (eV) | (eV) | (eV.X−1Va−1) | (eV.Va−1GB−1) | (eV.X−1GB−1) | |
| GB-Ni117Al2(s)+VaL2 | −0.81 | −0.10 | 0.04 | −0.75 | −0.04 |
| GB-Ni117Si2(s)+VaL2 | −1.18 | −0.11 | −0.33 | −1.05 | 0.02 |
| GB-Ni119Si2(i)+VaL3 | −0.85 | −8.98 | 0.00 | −0.84 | −3.52 |
| Structure | Ef(X+Va) | Eb(X;GB;Va) | Eb(X;GB;Va)* |
|---|---|---|---|
| (eV.X−1Va−1) | (eV.X−1Va−1GB−1) | (eV.X−1Va−1GB−1) | |
| GB-Ni117Al2(s)+VaL2 | −1.08 | −0.92 | 0.08 |
| GB-Ni117Si2(s)+VaL2 | −1.12 | −0.92 | −0.22 |
| GB-Ni119Si2(i)+VaL3 | −1.27 | −4.35 | 0.31 |
| Structure | Structure | |||||
|---|---|---|---|---|---|---|
| (eV.cell−1) | (eV.cell−1) | (eV.cell*−1) | (eV.cell*−1) | (kJ.mol of atoms−1) | ||
| --- | --- | --- | GB-Ni120 | −323.654 | 0.000 | 0.000 |
| Ni59Al(s) | −327.888 | 0.000 | GB-Ni118Al2(s) | −323.596 | −0.037 | −0.060 |
| Ni59Si(s) | −329.598 | 0.000 | GB-Ni118Si2(s) | −324.935 | −0.043 | −0.070 |
| Ni120Si(iO) | −659.820 | 0.000 | GB-Ni120Si2(i) | −330.900 | −0.025 | −0.039 |
| Ni59+Va | −321.155 | 0.000 | GB-Ni119+VaL2 | −317.601 | −0.007 | −0.011 |
| Ni58Al(s)+Va | −321.054 | 0.000 | GB-Ni117Al2(s)+VaL2 | −317.536 | −0.014 | −0.022 |
| Ni58Si(s)+Va | −322.830 | 0.000 | GB-Ni117Si2(s)+VaL2 | −319.258 | −0.006 | −0.010 |
| Ni59Si(iO)+Va | −325.222 | 0.000 | GB-Ni119Si2(i)+VaL3 | −324.873 | −0.011 | −0.017 |
| Structure | ||||
|---|---|---|---|---|
| (eV.X−1) | (eV.X−1) | (eV.X−1) | (eV.X−1) | |
| GB-Ni117Al2(s)+VaL2 | −0.125 | −0.104 | −0.080 | −0.042 |
| GB-Ni117Si2(s)+VaL2 | 0.241 | −0.108 | 0.352 | 0.019 |
| GB-Ni119Si2(i)+VaL3 | −3.518 | −0.260 | −0.128 | −0.132 |
© 2020 by the authors. Licensee MDPI, Basel, Switzerland. This article is an open access article distributed under the terms and conditions of the Creative Commons Attribution (CC BY) license (http://creativecommons.org/licenses/by/4.0/).
Share and Cite
Mazalová, M.; Všianská, M.; Pavlů, J.; Šob, M. The Effect of Vacancies on Grain Boundary Segregation in Ferromagnetic fcc Ni. Nanomaterials 2020, 10, 691. https://doi.org/10.3390/nano10040691
Mazalová M, Všianská M, Pavlů J, Šob M. The Effect of Vacancies on Grain Boundary Segregation in Ferromagnetic fcc Ni. Nanomaterials. 2020; 10(4):691. https://doi.org/10.3390/nano10040691
Chicago/Turabian StyleMazalová, Martina, Monika Všianská, Jana Pavlů, and Mojmír Šob. 2020. "The Effect of Vacancies on Grain Boundary Segregation in Ferromagnetic fcc Ni" Nanomaterials 10, no. 4: 691. https://doi.org/10.3390/nano10040691
APA StyleMazalová, M., Všianská, M., Pavlů, J., & Šob, M. (2020). The Effect of Vacancies on Grain Boundary Segregation in Ferromagnetic fcc Ni. Nanomaterials, 10(4), 691. https://doi.org/10.3390/nano10040691