Abstract
In parallel with the vast medical research on clinical treatment of COVID-19, an important action to have the disease completely under control is to carefully monitor the patients. What the detection of COVID-19 relies on most is the viral tests, however, the study of X-rays is helpful due to the ease of availability. There are various studies that employ Deep Learning (DL) paradigms, aiming at reinforcing the radiography-based recognition of lung infection by COVID-19. In this regard, we make a comparison of the noteworthy approaches devoted to the binary classification of infected images by using DL techniques, then we also propose a variant of a convolutional neural network (CNN) with optimized parameters, which performs very well on a recent dataset of COVID-19. The proposed model’s effectiveness is demonstrated to be of considerable importance due to its uncomplicated design, in contrast to other presented models. In our approach, we randomly put several images of the utilized dataset aside as a hold out set; the model detects most of the COVID-19 X-rays correctly, with an excellent overall accuracy of 99.8%. In addition, the significance of the results obtained by testing different datasets of diverse characteristics (which, more specifically, are not used in the training process) demonstrates the effectiveness of the proposed approach in terms of an accuracy up to 93%.
1. Introduction
The coronavirus that appeared in 2019—the severe acute respiratory syndrome (SARS-CoV-2)—has become a matter of considerable public concern. COVID-19 leads to complications such as acute respiratory disorder, heart problems, and secondary infections in a rather high proportion of patients, with an appallingly high mortality rate. Identifying the infected individuals is naturally a matter of the utmost importance not only to undergo treatment, also to be kept away from others to prevent the disease from spreading [1]. Surveillance programs, which are widely implemented, commonly employ serological tests. However, the limited number of test kits available to many countries can be considered as one of the issues regarding the identification of patients [2], where the identification of patients becomes a tough challenge. Furthermore, these tests take between a few hours and a day for the results to be provided. While some countries may lack the means to adequately perform antibody or viral tests, in addition, these types of medical examinations might be error-prone. Consequently, in this critical situation, what requires addressing is a viable alternative to these tests.
The radiology gives a decisive advantage when we monitor how the disease runs its course, and it represents a common approach due to its availability [3,4,5]. Hence, along with biomedical methods—like polymerase chain reaction (PCR) that allows the diagnosis of infectious diseases—the study of lung X-rays could prove highly beneficial, specifically to countries with less access to biomedical facilities.
Considering that deep learning (DL) architectures have been successfully applied to various fields, including medical image analysis, it could even further enhance our ability to cope with the difficulty of diagnosing the disease [6]. In fact, the capabilities and influences of these state-of-the-art techniques are growing constantly [7,8,9]. At the present time, the development of deep neural networks (DNNs), capable of detecting COVID-19 symptoms in an accurate (and simultaneously fast) way, has become a matter of concern to many researchers [10]. A set of studies show the ability of DNNs, specifically the convolutional neural networks (CNNs) [11] to efficiently detect the symptoms of COVID-19 in X-rays [12]. A series of recent studies focus on undertaking a comparative study of pretrained DL models applied to the classification of COVID-19, by using Computed Tomography (CT) Scans or X-rays in specific datasets [13,14,15,16,17,18,19,20]. However, the state-of-the-art research contributions adopt, for the most part, “Transfer Learning” [21,22,23,24] as the approach to automatic detection of COVID-19 symptoms. These contributions pursue the goal of developing novel methods, however, they possess their own disadvantages. Regarding these methods, in general, it must be stated the key issue is that only at the cost of high complexity does the accuracy of these designed models improve. In other words, a great accuracy is achieved, provided that the systems complexities increase. Otherwise, the results would not be acceptable. The well-known networks, for instance, AlexNet [25], variants of ResNet [26], VGG [27], GoogLeNet [28], EfficientNet [29], and DensNet [30] prove themselves to be powerful in many applications; however, a major drawback to them is that they usually require significant training time, causing a high cost in real-world applications [31].
In our opinion, DL techniques represent a powerful tool for reinforcing the process of automated (binary) classification of X-rays into normal and infected by COVID-19 images. In this regard, the general framework of deep learning applied to the automatic detection of COVID-19 symptoms can be named as COVID-in-Depth (CoDe).
However, since DNNs are computationally demanding and memory-hungry, a number of techniques have been introduced to tackle this issue [32]. A first approach that can be taken is to minimize the size of DNNs, and simultaneously try to maintain the resulting accuracy at a reasonable level. Another technique addresses this issue by reducing the whole number of parameters [33]. A simple model helps to prevent the overfitting when datasets are limited in size [34]. In this paper, we have tried to minimize the size of the neural network and number of parameters. The main advantage of this network, compared to other models, is its simplicity and low complexity, which leads to a major reduction in computational cost, while maintaining the accuracy at a high level. Consequently, the model is perfectly capable of running fast on low-performance computers with high accuracy.
Fresh Contribution of the Paper
Motivated by these considerations, in this paper, we pursue two main goals:
- We first draw a comparison of the state-of-the-art approaches that work towards the goal of classifying X-rays into normal and COVID-19 categories. This provides an overview on how the state-of-the-art approaches behave on different dataset commonly used in the literature;
- We also propose a variant of CNNs—a custom-designed architecture with optimized parameters—that performs very well on a recent dataset. In our contribution, we concentrate our concerted efforts, specifically, on reducing the network complexities, whilst simultaneously achieving the accuracy of a superbly high level. To accomplish our goal, we have optimized our model for an excellent performance and a straightforward design. Moreover, in order to assess the proposed architecture and demonstrate its effectiveness, we test it on some additional datasets, not used in the training phase. In similar works, it is rarely observed that a model is evaluated by referring to large external datasets.
Our proposed CNN-based classifier is trained from scratch, which is different from other contributions that adopt a transfer learning approach. Specifically, the main features of the proposed architecture are:
- A considerably high accuracy of COVID-19 identification;
- A highly reduced system complexity, compared to other state-of-the-art models;
- The usability of the model in resource-limited execution environments;
- The assessment of the proposed model by using external datasets not involved in training process.
The rest of this article is organized as follows. Section 2 is devoted to the related work on binary COVID-19 classification from X-rays, by using CNNs. Section 3 presents the related information on data type, preprocessing, and data augmentation. A detailed description of the proposed architecture is demonstrated in Section 4, while details about experimental setup along with the results, and performance evaluation are discussed in Section 5. In Section 6, the capability of the model will be challenged by the act of classifying X-rays of external datasets. A comparison between state-of-the-art contributions is drawn in Section 7. Finally, the conclusion and possible future research directions are outlined in Section 8.
2. Related Work
The majority of previous research contributions has applied pretrained frameworks to classification of COVID-19 infected patients. In [35], the authors utilize the AlexNet architecture as a feature extractor, where the most efficient features are selected using the Relief algorithm and then in the final stage, the classification of the effective features is conducted, by using the support-vector machines (SVM) classifier. The test results demonstrate an accuracy score of . However, finding the optimal parameters for the SVM, and also optimal values for the Relief algorithm, can be considered as the limitations of this study.
ResNet-50 CNN, with conventional transfer learning scheme from ImageNet database, has been used in [36,37,38,39]. The validation accuracy of these networks have not exceeded 98%, and some of them present a dramatically low degree of accuracy. Moreover, ResNet-50 is utilized as the feature extractor, and the SVM as the classifier in [40]. This work is not an end-to-end network and the low number of COVID-19 X-rays in the dataset (25 images) causes the result not to be so valuable, while the overall accuracy of the study is 95.38%. With modified ResNet-18, [41] develops a deep convolutional generative adversarial network to produce synthetic data, but is not rather able to produce unique synthetic data, since the proposed network is trained separately for each class. The test accuracy for detection of COVID-19 is reported to be 82.91%. A Deep Convolutional Autoencoder approach, COVIDomaly, is proposed by [42]. After performing 3-fold cross-validation, a pooled ROC–AUC of 0.6902 is obtained for the binary classification.
In [43], the authors perform multi-dilation convolutional layers, where the group convlution uses several dilation rates. The training convergence of the model is very erratic, where it fluctuates a lot after 45 epochs, and the accuracy of 97.4% is achieved for COVID/Normal cases. The ability of capsule networks, in order to classify COVID-19 X-rays is examined in study by [44]. The proposed method, CapsNet, achieves an accuracy of 97.24% in binary classification. In [45], the authors investigate a set of different approaches, in which AlexNet, GoogLeNet, and RestNet-18 are used for multi-classification, where the GoogLeNet is adopted as the main deep transfer model for classification of COVID-19 and normal images. Although, the work achieves 99.9% in the validation accuracy, the use of a very small dataset for the training (69 image of COVID-19 without augmentation) causes a low-level reliability. The EfficientNet [29], based on transfer learning, shows a valuable accuracy on several datasets. However, the authors of [46] employ a network for COVID-19 classification, obtaining a validation accuracy that does not exceed 93.9%. Among the various applied deep transfer learning approaches, [47] achieves a high validation accuracy, by using Xception network (99.52%) for the training, however, the results are not efficient enough in the test analysis (97.40%), compared to the validation accuracy.
A recent study by [48] concludes that the validity of the usual testing protocols in most papers dealing with the automatic diagnosis of COVID-19 might be biased and learn to predict features that predict features that are more dependent on the source dataset than relevant medical information. The attempt, made in [49] based on a modified version of AlexNet, results in the accuracy of 98%, while VGG-19 and DenseNet-201 [50] are not capable of achieving higher overall accuracy than 90%. The authors of [51] utilize the standard version of DenseNet-169 and reach a resulting accuracy of 95.72%. The standard version of VGG-16 with synthetic data augmentation technique, for classifying COVID-19, results in the validation accuracy rate of 95% [52]. A model, based on the combination of a CNN and long short-term memory (LSTM), is developed by [53] to diagnose COVID-19 automatically from X-rays. This network is composed of 21 layers and achieves an accuracy of 99.4%, with a long training time of more than 5 hours. However, their operations take advantage of running at high speeds.
The research by [54] focuses only on the screening stage. The synthetic data, which are generated by a conditional deep convolutional generative adversarial network (conditional DC-GAN), is used to augment the training dataset for COVID-19 classification. The proposed method attains a mean accuracy of 96.97%. In addition, the transfer learning method is used to train four CNNs, including ResNet18, ResNet50, SqueezeNet and DenseNet-121, to identify COVID-19 symptoms in the analyzed chest X-ray images, and three of these networks do not exceed a sensitivity rate of 98%, while the results of the other one are not considerable at all [55]. The VGG-19 and the MobileNet-V2 are employed by the authors of [56] and they confirm that these two networks are not capable of classifying the COVID-19 X-ray images. The ResNet-50 and VGG-16 produce comparatively better results than VGG-19 and MobileNet-V2. The AUC scores of ResNet-50 and VGG-16 are evaluated to be 0.6578 and 0.7264, respectively. The Inception-V3 produces better results than other pre-trained networks, however, the highest AUC score in transfer learning experiments is obtained by DenseNet-121 (0.9648). In [57], the authors proposed nCOVnet, by using neural network-based method on VGG-16, to achieve the overall accuracy of 88.10%. However, for the most part, the obtained results are biased due to the small amount of COVID-19 X-rays [43]. It should be considered that the proposed schemes provide performance in different combinations of classification with balanced sets of data. Moreover, the larger number of non-COVID X-rays are properly utilized for the initial training phase that is effectively transferred for diagnosing COVID-19 in the final transfer learning phase.
A critical question, here, would be whether or not an automatic COVID-19 identification, with a correlation of high accuracy and low system complexity is achievable?
3. Data Type and Preprocessing
3.1. X-ray Images DataSet
The data used in this work has been collected from “The Cancer Imaging Archive (TCIA)” [58]—a collection of X-rays and CT images—related to patients with positive COVID-19 tests [59]. We have separated 253 X-rays from the CTs (last modification in September 15, 2020). The related information has been collected from 105 patients, both females and males, with a minimum age of 19 and maximum age of 91 years old. The mortality was of 10 out of 105 patients. The images, provided in the dataset, have been of very low resolutions, and in addition, each image has been presented in a different resolution to other ones. The original images have been in Digital Imaging and Communications in Medicine (DICOM) format. Normal X-rays are selected randomly from the data collection of Mendeley [60] in the ‘jpeg’ format. Age, sex and any other information regarding the patients of this dataset is not provided due to privacy concerns. The difference of image sizes and the need to manipulate them for some random samples are shown in Figure 1.
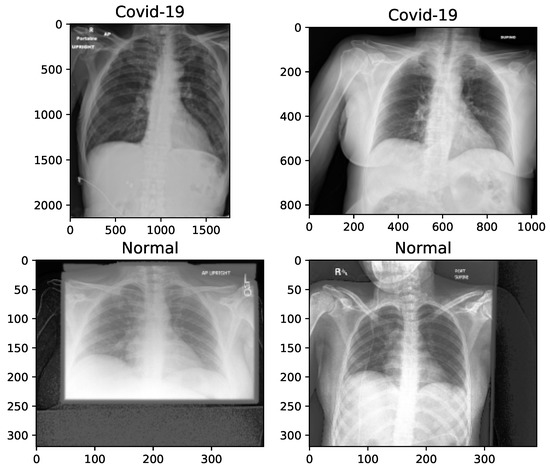
Figure 1.
X-ray image samples of two categories before image manipulation.
3.2. Augmentation of Images
The key problem with small and unbalanced datasets is that models trained with them may not be generalized. Hence, these models suffer the issue of overfitting. Data augmentation is an approach to reducing overfitting, by which we are able to increase the amount of data, with only using available data [61]. In this paper, 100 images, with an equal proportion of classes, is held out for testing the model, and the number of samples of each class is balanced by increasing the number of COVID-19 chest X-rays to 500 images. The augmented images are randomly selected from the original X-rays. In total, 1000 (500 normal + 500 COVID-19) images are employed for the training phase. On the other hand, image preprocessing is needed, because the images are not of the same size, as shown in Figure 1, and therefore are converted into the same size for training. In Table 1, we present the manipulations that are applied to the X-rays, before proceeding with the augmentation.

Table 1.
Manipulation of the X-ray images before augmentation.
For this purpose, we have used the “Augmentor”—a Python package designed to aid the augmentation and artificial generation of image data for machine learning tasks. It is primarily a data augmentation tool, but also incorporate basic image preprocessing functionality. It has an emphasis on providing operations that are typically used in the generation of image data for machine learning problems. The visualization of X-ray images of each class, after manipulation, is shown in Figure 2.
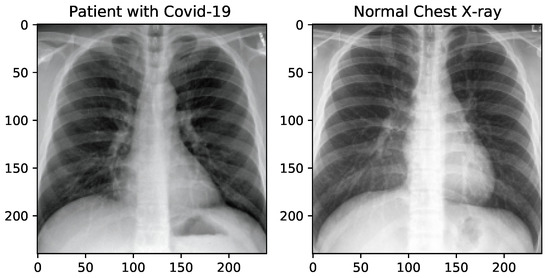
Figure 2.
X-ray image samples of two categories after image manipulation.
4. Proposed Method
The proposed method, framed inside the CoDe vision, is explained by discussing the network topology and development parameters. The architecture of the model is explained with the help of diagrams, leading to the CNN model, and its operation and evaluation metrics will be explained later.
4.1. Architecture of the Model
The proposed model deploys Keras functional API, and its overall architecture is presented according to the execution graph of Tensorboard in Figure 3. The learning phase flag in the execution graph, is a ’Boolean tensor’ (0 = test, 1 = train) to be passed as input to any Keras function that uses a different behavior at train and test time.
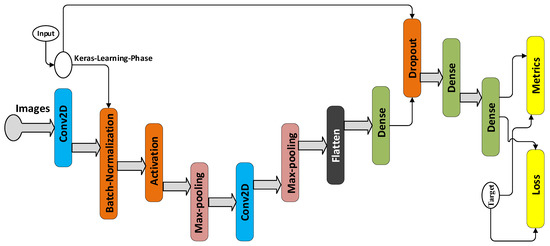
Figure 3.
Architecture of the proposed model.
There are 12 layers in this network including convolution, max-pooling, batch normalization, dropout, activation, and fully-connected layers, whose details are summarized in Figure 2. The kernel size of the two convolution layers, i.e., layers 2 and 6 are equal to 3. After each convolution layer, a max-pooling operation is applied to the feature maps, but before the first max-pooling, batch normalization and then the rectified linear unit (ReLU) activation are employed. is the element-wise maximum of 0 and the input tensor. The purpose of batch normalization is to normalize the activation of the previous layer at each batch, i.e., applying a transformation that maintains the mean activation close to 0 and the activation standard deviation close to 1.
The normalization operation is computed by using the following Equations (1) and (2) [62]. Considering the intermediate activation x of a mini-batch of size, we can compute the mean and variance of the batch:
and then compute a normalized version of x, including a small factor for numerical stability:
and finally, is linearly transformed by and , which are two learned parameters: .
Max-pooling is for reducing the size of the feature map. The parameters for the kernel (filter) size in this work is obtained through brute force technique, and moreover, the stride for convolution and max-pooling operation is set at 2. A ‘valid’ padding is adopted. To avoid overfitting, we try to keep the model as simple as possible, additionally, we use a dropout layer to make a regularized network section for the inferences. We set the dropout rate to , which yields the maximum regularization. Otherwise, in the networks, if all the weights are learned together, normally some of the connections will attain more predictive capability than the others. In such a scenario, as the network is trained iteratively, these powerful connections are learned more, while the weaker ones are ignored [11]. Over many iterations, only a fraction of the node connections is trained and the rest stop participating. In the other words dropout works by probabilistically removing a neuron from designated layers during training or by dropping certain connections [63]. It is worth pointing out that ‘Non-trainable parameters’, as displayed in Table 2, refer to the number of weights that are not updated during training with back propagation which perform like statistics in the batch normalization layer. They are updated with mean and variance, but they are not “trained with back propagation”.
Table 2.
Summary of the proposed model.
4.2. Evaluation Metrics
The performance of the proposed model is evaluated with 5-fold cross-validation. The dataset is divided into two parts, i.e., training and hold out. The held out part is aimed at testing the model, at the end, while the train set is divided into 5 parts. Figure 4 shows the segmentation applied to the dataset.
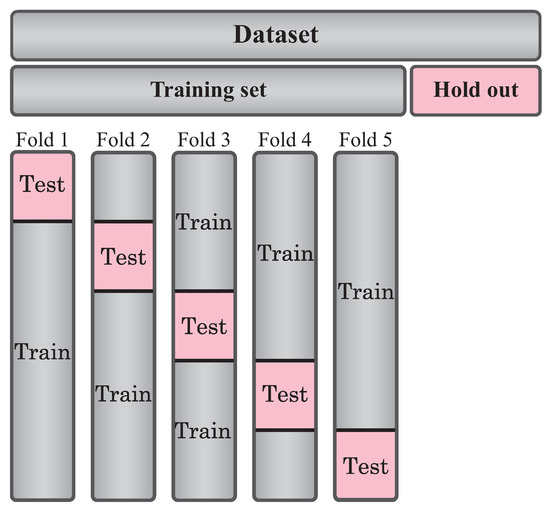
Figure 4.
Schematic overview of the 5-fold cross-validation and hold out set.
The training process is carried out 5 times, and the performance of the method is calculated by taking the average of trainings. The evaluation metrics selected in this work, which are commonly used to measure the quality of the model, are: confusion matrix, accuracy, specificity, sensitivity, F1-score, the area under the (Receiver Operating Characteristic) curve (AUC), and the Matthews correlation coefficient (MCC). The calculated parameters of these metrics are based on true positive (TP), true negative (TN), false positive (FP), false negative (FN) rates, as shown in Table 3.
Table 3.
The performance metrics for the evaluation of the model.
5. Experimental Phase
5.1. Primary Preparation
In the experimental setup, first, the dataset is randomly divided into two parts: 653 and 100 images of the dataset belong to the training and hold out respectively. The hold out part is separated with the goal of testing the model after the training is performed. The process is illustrated in Figure 5. Thereafter we perform the augmentation to raw images in training set. All the input images are resized to pixel size. In the meantime, the dataset is shuffled to overcome the negative effect of the overfitting. The train set is split with respect to 5-fold cross-validation. Afterwards, 25% of each training set is considered as a validation set, in order to use the early stopping strategy. The early stopping and ReduceLROnPlateau methods are employed to monitor the improvement of validation loss, and in the case that no improvement is verified for a ‘patience’ number of five iterations, the learning rate () is reduced at the of (). On the other hand, if the validation loss does not improve for a ’patience’ number of 10 iterations, the training will be stopped automatically. The process is now well prepared for the Gradient descent Optimization (SGD) of the Keras. Setting the ‘restore_best_weights’ to ‘True’, model weights are restored from the epoch with the best value of the monitored quantity. The training is conducted for 100 epochs, with a batch size of 32. After we reach the best weights, we implement the testing phase by the unseen hold out dataset. The diagram of the process is illustrated in Figure 5 that highlights the division of dataset during the processing.
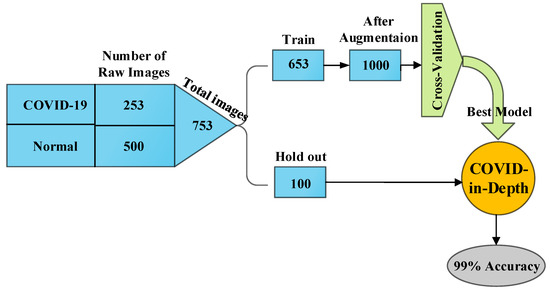
Figure 5.
Schematic diagram of the process.
The experimental work is carried out by using Python programming language. Some information about configuration of the model can be found in Table 4.
Table 4.
Main information of configuring the model for training.
5.2. Numerical Results
When the epoch number of training iterations increases, the loss value does not change considerably, suggesting that the model converges well on a relatively optimal state without distinct overfitting or underfitting. The training curves of the loss value and the accuracy for the last fold of training are shown in Figure 6 and Figure 7. The system can be considered a fit model, since the validation error is low, while slightly higher than the training error.
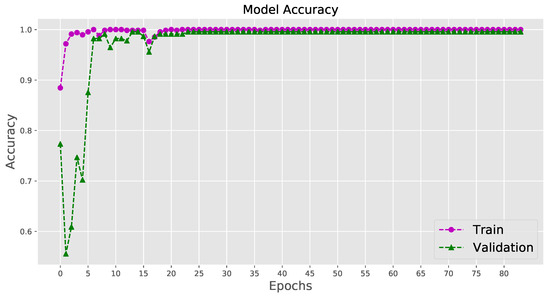
Figure 6.
Visualizing the accuracy for the last fold cross-validation training.
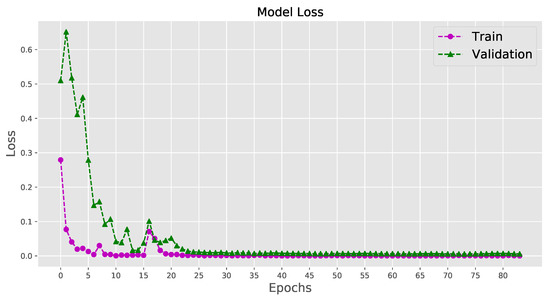
Figure 7.
Visualizing the loss for the last fold cross-validation training.
The validity of implementation, associated with the performance metrics, such as precision, recall and F1-score, is shown in Table 5. All the estimations are made through the ‘scikit-learn’ API [64]. Approximately, for about 400 iterations in 5 times training, the proposed model achieves almost the accuracy of 99.80%, for correct identification of infected cases. Moreover, 100% of not infected people are correctly identified as being healthy. The resultant precision, recall, F1-score, and AUC are all competent enough, to validate the high efficiency of the proposed model. All the measures’ values are the average of the 5-fold cross-validation.
Table 5.
Performance of the model in average of 5-fold cross-validation for both classes.
Confusion matrices for all the 5-fold cross-validation training process are presented in Figure 8.
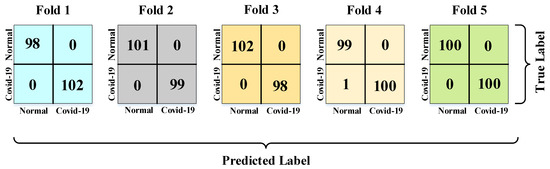
Figure 8.
Confusion matrices for the 5-fold cross-validation training process.
The performance of the network for detecting normal and COVID-19 X-rays, corresponding to the average of the 5-fold cross-validation, is shown in Figure 9. We know that in binary classification, the recall of the positive class is also known as ‘sensitivity’, and the recall of the negative class is ‘specificity’. Therefore, as we can see in the graph of Figure 9, recall of the ‘not-infected’ is specificity or the true negative rate of the result.
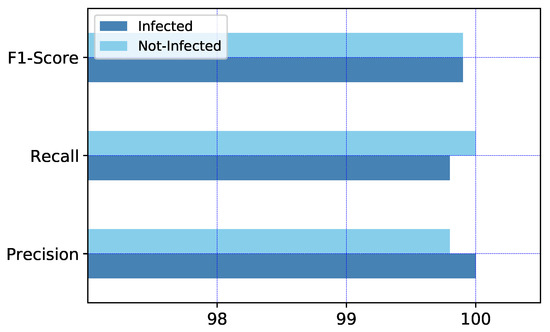
Figure 9.
The graph of model performance in average of 5-fold cross-validation for both classes.
5.3. Hold Out Test Dataset
To ensure how well the model works, we employ 100 images belonging to the dataset, which are randomly held out with the same original proportion. The hold out dataset is not involved in the process of training. In total, 66 normal images and 34 images with COVID-19 symptoms evaluate the model performance. The network is capable of identifying all the infected patients correctly and only one misdiagnosing in normal X-rays, with the accuracy of 99%. The confusion matrix for demonstrating the performance is shown in Figure 10, and Table 6 represents the highly considerable performance of the model.
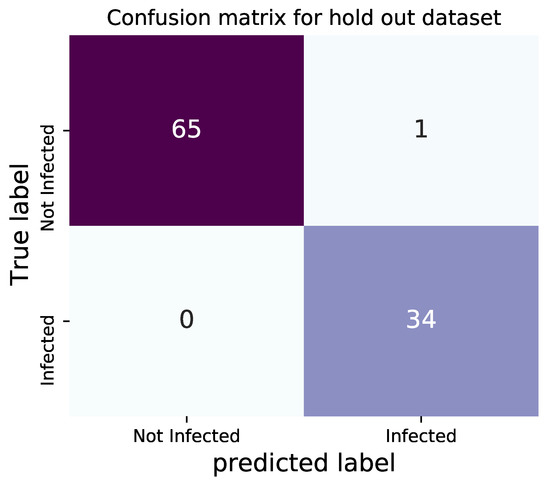
Figure 10.
Confusion matrix of testing for hold out X-rays.
Table 6.
Model performance using hold out test data.
The area under the receiver operating characteristic curve, which is known as AUC, is equal to 0.99.
5.4. Comparison between Results Obtained by Using Similar Dataset
Although the access to public datasets of COVID-19 X-rays are highly limited, on the other hand, a wide variety of datasets including normal X-rays are reachable. The information about Uniform Resource Locator (URL) of datasets, including the amount of X-rays, which have been employed by other similar classification networks, are presented in Table 7.
Table 7.
Available datasets and number of images.
The COVID-19 dataset [59] used in this work (number 9 in Table 7) is derived from a rather new source that has not been employed by similar works yet, but the normal X-rays are selected through a popular dataset [60] (number 1 in Table 7), and the related article could be observed in [65]. Table 8 presents a comparison between results obtained by several other studies that employ the same dataset of normal X-rays (with different amounts of images) as we have utilized.
Table 8.
Comparative analysis of binary classification of COVID-19 for the similar utilized dataset.
As Table 8 shows, the results obtained by the proposed model’s performance is considerable compared to other contributions. Although it appears that the accuracy reported by GoogLeNet in [45,66] is equal or slightly higher, however, this item could be easily justified by considering the fact that the training process is performed based on using a quite smaller dataset than ours, and importantly enough, without augmentation. In addition, the computational cost of the approaches, adopted by the authors (GoogLeNet and VGG-16), are higher.
6. Model Evaluation by External Dataset
In order to assess the proposed architecture and demonstrate its effectiveness, we aim at testing it on some datasets not used in the training phase. It could be rarely observed in similar works that a model is evaluated by referring to a considerably large external dataset. However, in this contribution, with the aim of further performance evaluation and ensuring no occurrence of overfitting, we employ other independent datasets of normal and COVID-19 images, which have not been used in the training phase of the proposed model and selected from those available in Table 7. The best weights, achieved by the proposed model, are employed to measure the accuracy of the model for these unseen datasets.
6.1. External Dataset 1
As the first trial, we select two datasets that contain 744 and 1341 COVID-19 and normal images, respectively, for a total of 2085 images. Normal chest X-rays are imported from Kaggle repository “Chest X-Ray Images (Pneumonia)” [69] (number 7 in Table 7) and COVID-19 images from [70] (number 2 in Table 7), both of which are vastly utilized for binary classification, for instance, in [19,23,40,57,71]. The confusion matrix obtained by testing our trained architecture on such datasets is presented in Figure 11.
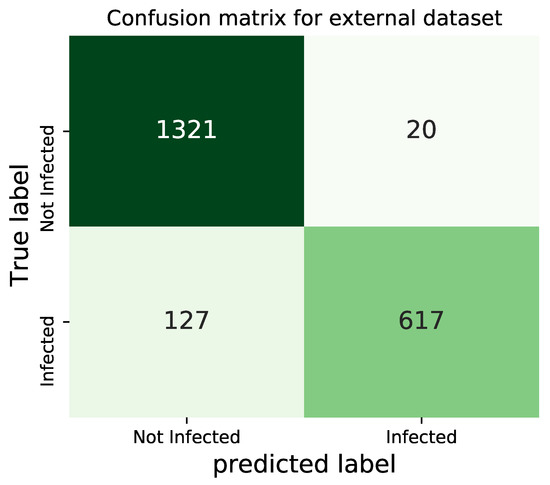
Figure 11.
Confusion matrix for the external dataset-1.
The obtained results in terms of precision, recall and F1-score, are presented in Table 9. The overall accuracy of the model, in the presence of the independent datasets for the unseen 2085 images, is 92.95%.
Table 9.
Performance of the model in external dataset-1 for both classes.
It is very interesting that the proposed architecture, trained on a different dataset, is capable of achieving very good accuracy, comparable to many state-of-the-art approaches, like those shown in Table 8.
According to the results presented in Figure 11, it is observed that the model could identify the normal X-rays far better than the COVID-19 images. This point can be explained by the fact that the unseen COVID-19 dataset may contain a lot of images that are related to patients at their early stages of the disease, and therefore, cannot be identified as COVID-19 X-rays.
6.2. External Dataset 2
Two of the datasets, presented in Table 7, are selected here for the second trial: dataset number 6 and 8 are COVID-19 and normal cases, respectively. In total, 1538 images are employed in the testing process. The confusion matrix obtained by testing our trained architecture on such datasets is shown in Figure 12.
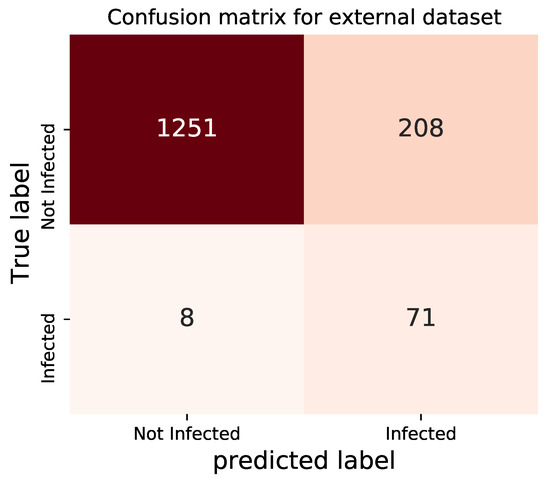
Figure 12.
Confusion matrix for the external dataset-2.
The obtained results in terms of precision, recall and F1-score, are presented in Table 10. The overall accuracy of the model, in the presence of this independent dataset for unseen 1583 images, is 85.96%.
Table 10.
Performance of the model in external dataset-2 for both classes.
Once again, the proposed architecture, trained on a different dataset, has been capable of achieving good accuracy.
Contrary to the previous testing, for these datasets, it appears that the performance of the model in identifying COVID-19 improves, which confirms the fundamental difference between datasets. However, the overall accuracy is relatively in acceptable range.
7. Discussion
By analyzing the results, we demonstrate that the proposed model successfully identifies the symptoms of COVID-19, automatically extracting the COVID-19 images from X-rays. The resulting ‘accuracy’ describes how effectively the values are predicted. The ‘precision’ determines the reproducibility of the measurement, or how many predictions are correct. The ‘recall’ shows how many of the correct results are discovered. The ‘F1-score’ is the harmonic mean of precision and recall.
In Section 5.4, we have compared the most interesting contributions in binary classifications of COVID-19, in which the same dataset of normal X-rays as ours has been used. Table 11 presents another batch of approaches, that have used other identical datasets. The COVID-19 and normal datasets, utilized by the works presented in the Table 11, can be seen in number 2 and 7 in Table 7 respectively.
Table 11.
Comparative analysis of binary classification of COVID-19 based on similar datasets.
Table 12 shows some information on the software and hardware that are used in this work.
Table 12.
Software and hardware information.
A detailed observation of Table 8 and Table 11 shows that the results obtained by the proposed model compete with the state-of-the-art methods. In other words, the proposed model presents a superior set of results in terms of all the validation factors. In spite of the methods based on transfer learning with their complexities, our model delivers a preferable performance with a high level of accuracy accompanied by its simplicity. Those contributions that utilize the same architecture, for example, the works [24,68] in Table 8, appear to produce a quite similar set of results. Although both the papers [19,47] utilize the Xception network, their results appear to be different from each other. The adequate explanation concerning why the two sets of results are different is that the authors of [19] use the Xception method, only as the base model, accompanied by a dropout and two fully-connected layers at the end. The nCOVnet, a VGG-16-based 24-layer network proposed in [57], and the CovXNet, with a large number of convolutional layers introduced by the author of [43] in Table 8, utilize a very deep and complex architecture. Even though we do not replicate the previous methods, our obtained results indicate a high accuracy and a low complexity, compared to all other works in the literature. Obviously, Inception, EfficientNet, ResNet, VGG, and DenseNet involve a computational complexity, considerably greater than our proposed approach. Just for a comparison purpose, Table 13 recaps the number of the trainable parameters of the most common deep architectures used in the approaches compared in Table 8 and Table 11 [73]. Table 13 clearly shows the affordability of the proposed idea.
Table 13.
Number of trainable parameters of the most common deep models (in millions).
Therefore, the superior results achieved by our model, along with its simplicity and low computational cost, confirm the efficiency with which the model is able to detect COVID-19 X-rays, with a true positive rate of 99.80%. The accuracy of 99.90%, the AUC of 0.9990, and also the hold out test accuracy of 99% indicate that the model is capable of separating the two classes, indubitably. Moreover, performance of the model, in the presence of different datasets with various characteristics, results in the accuracy of 92.95% and 85.96%. The outcomes of the study indicate that the model is highly capable of classifying the X-rays into COVID-19 and healthy.
8. Conclusions and Hints for Future Research
A fast diagnosis method has a key role in the control of infectious diseases and pandemic situations like the current COVID-19. Some limitations of the PCR test reveal a need for fast alternative methods to be able to serve the front-line experts to make them reach a rapid and accurate diagnosis. Building DNN-based networks, which are capable of identifying COVID-19 symptoms fast and efficiently, and, at the same time, possess uncomplicated architectures, is a major concern to researchers. In this regard, we draw a comparison of the noteworthy approaches devoted to the binary classification of infected images by using Deep Learning techniques with high accuracy (a general framework that we called COVID-in-Depth CoDe). We also propose a variant of a convolutional neural network with optimized parameters that performs very well on a recent dataset. The model presents the average performance accuracy of 99.90% on 5-fold cross validation, and 99.80% for the single recognition of COVID-19. The test accuracy of 99% indicates that the model performs with high precision.
Moreover, we utilize two external datasets to examine the performance of our model, while the obtained results demonstrate that the model achieves 92.95% and 85.96% degrees of accuracy. A hint that could be given here, on the further achievement is pursuing the matter of generalization of the CoDe framework, by providing suitable datasets for training the model that can be large enough and well balanced. In addition, this work can be extended, as a future work, to models capable of recognizing the stages of COVID-19 progression.
Being still in its infancy the topic of this paper, we finally observe that the presented results could be further developed in several directions. In this regard, the (quite recent) contribution in [74] points out that a main promising research direction could be the exploitation of the emerging paradigm of Fog Computing for the distributed implementation and execution of Deep-Learning based analytics engines. Hence, since technological Fog Computing platforms are based on wireless (and possible mobile) technologies [75], a first research direction of potential interest may concern the utilization of massive numbers of transmit/receive antennas at the Fog nodes [76,77,78] for improving the (possibly, randomly time-varying [79] and a priori unknown [80]) communication capacity of the underlying Fog-based execution platforms, so to shorten the resulting execution time of the supported Deep Learning engines. Motivated by this consideration, we outline a second promising research direction, which can be focused on the utilization of the emerging paradigm of the so-called Conditional Deep Neural Networks (CDNNs) with multiple early-exits to speed up the overall Fog-supported COVID-19 diagnosis process [81].
Author Contributions
The authors contributed equally to this work. All authors have read and agreed to the published version of the manuscript.
Funding
This work has been supported by the projects: “SoFT: Fog of Social IoT” funded by Sapienza University of Rome Bando 2018 and 2019; “End-to-End Learning for 3D Acoustic Scene Analysis (ELeSA)” funded by Sapienza University of Rome Bando Acquisizione di medie e grandi attrezzature scientifiche 2018; and, “DeepFog – Optimized distributed implementation of Deep Learning models over networked multitier Fog platforms for IoT stream applications” funded by Sapienza University of Rome Bando 2020.
Institutional Review Board Statement
Not applicable.
Informed Consent Statement
Not applicable.
Data Availability Statement
Publicly available datasets were analyzed in this study. This data can be found in the web links of Table 7.
Conflicts of Interest
The authors declare no conflict of interest.
References
- Lai, C.C.; Shih, T.P.; Ko, W.C.; Tang, H.J.; Hsueh, P.R. Severe acute respiratory syndrome coronavirus 2 (SARS-CoV-2) and corona virus disease-2019 (COVID-19): The epidemic and the challenges. Int. J. Antimicrob. Agents 2020, 105924. [Google Scholar] [CrossRef]
- Peeling, R.W.; Wedderburn, C.J.; Garcia, P.J.; Boeras, D.; Fongwen, N.; Nkengasong, J.; Sall, A.; Tanuri, A.; Heymann, D.L. Serology testing in the COVID-19 pandemic response. Lancet Infect. Dis. 2020, 20, 245–249. [Google Scholar] [CrossRef]
- Sahar, F.; Iqbal, R.; Maha, H.; Salim, S. Radiological Findings in Patients with COVID-19. Cureus 2020, 12. [Google Scholar] [CrossRef]
- Lomoro, P.; Verde, F.; Zerboni, F.; Simonetti, I.; Borghi, C.; Fachinetti, C.; Natalizi, A.; Martegani, A. COVID-19 pneumonia manifestations at the admission on chest ultrasound, radiographs, and CT: Single-center study and comprehensive radiologic literature review. Eur. J. Radiol. Open 2020, 7, 100231. [Google Scholar] [CrossRef]
- Wong, H.Y.F.; Lam, H.Y.S.; Fong, A.H.T.; Leung, S.T.; Chin, T.W.Y.; Lo, C.S.Y.; Lee, E.Y.P.; Macy Lui, M.; Lee, J.C.Y.; Chiu, K.W.; et al. Frequency and distribution of chest radiographic findings in COVID-19 positive patients. Radiology 2020, 296, 201160. [Google Scholar] [CrossRef]
- Goodfellow, I.; Bengio, Y.; Courville, A. Deep Learning; Adaptive Ccomputation and Machine Learning Series; MIT Press: Cambridge, UK, 2016; p. 800. [Google Scholar]
- Ai, T.; Yang, Z.; Hou, H.; Zhan, C.; Chen, C.; Lv, W.; Tao, Q.; Sun, Z.; Xia, L. Correlation of chest CT and RT-PCR testing in coronavirus disease 2019 (COVID-19) in China: A report of 1014 cases. Radiography 2020, 296, 200642. [Google Scholar] [CrossRef]
- Song, F.; Shi, N.; Shan, F.; Zhang, Z.; Shen, J.; Lu, H.; Ling, Y.; Jiang, Y.; Shi, Y. Emerging 2019 novel coronavirus (2019-nCoV) pneumonia. Radiology 2020, 295, 210–217. [Google Scholar] [CrossRef] [PubMed]
- Fang, Y.; Zhang, H.; Xie, J.; Lin, M.; Ying, L.; Pang, P.; Ji, W. Sensitivity of chest CT for COVID-19: Comparison to RT-PCR. Radiology 2020, 200432. [Google Scholar] [CrossRef]
- Shuja, J.; Alanazi, E.; Alasmary, W.; Alashaikh, A. COVID-19 open source data sets: A comprehensive survey. Appl. Intell. 2020, 1–30. [Google Scholar] [CrossRef]
- Goodfellow, I.; Bengio, Y.; Courville, A. Deep Learning; MIT Press: Cambridge, MA, USA, 2016. [Google Scholar]
- Tartaglione, E.; Barbano, C.A.; Berzovini, C.; Calandri, M.; Grangetto, M. Unveiling COVID-19 from Chest X-ray with deep learning: A hurdles race with small data. Int. J. Environ. Res. Public Health 2020, 17, 6933. [Google Scholar] [CrossRef] [PubMed]
- Shi, F.; Wang, J.; Shi, J.; Wu, Z.; Wang, Q.; Tang, Z.; He, K.; Shi, Y.; Shen, D. Review of artificial intelligence techniques in imaging data acquisition, segmentation and diagnosis for COVID-19. IEEE Rev. Biomed. Eng. 2020. [Google Scholar] [CrossRef] [PubMed]
- Albahri, O.; Zaidan, A.; Albahri, A.; Zaidan, B.; Abdulkareem, K.H.; Al-Qaysi, Z.; Alamoodi, A.; Aleesa, A.; Chyad, M.; Alesa, R.; et al. Systematic review of artificial intelligence techniques in the detection and classification of COVID-19 medical images in terms of evaluation and benchmarking: Taxonomy analysis, challenges, future solutions and methodological aspects. J. Infect. Public Health 2020, 13, 1381–1396. [Google Scholar] [CrossRef] [PubMed]
- Karim, M.; Döhmen, T.; Rebholz-Schuhmann, D.; Decker, S.; Cochez, M.; Beyan, O. DeepCOVIDExplainer: Explainable covid-19 predictions based on chest x-ray images. arXiv 2020, arXiv:2004.04582. [Google Scholar]
- Victor, U.; Dong, X.; Li, X.; Obiomon, P.; Qian, L. Effective COVID-19 screening using chest radiography images via deep learning. Training 2020, 7, 152. [Google Scholar]
- Selvan, R.; Dam, E.; Detlefsen, N.S.; Rischel, S.; Sheng, K.; Nielsen, M.; Pai, A. Lung Segmentation from Chest X-rays using Variational Data Imputation. In ICML Workshop on the Art of Learning with Missing Values (ICML Artemiss); 2020; Available online: https://arxiv.org/abs/2005.10052 (accessed on 20 November 2020).
- Alafif, T. Machine and Deep Learning Towards COVID-19 Diagnosis and Treatment: Survey, Challenges, and Future Directions. engrXiv 2020. [Google Scholar] [CrossRef]
- Khan, A.I.; Shah, J.L.; Bhat, M.M. CoroNet: A deep neural network for detection and diagnosis of COVID-19 from chest x-ray images. Comput. Methods Programs Biomed. 2020, 105581. [Google Scholar] [CrossRef]
- Butt, C.; Gill, J.; Chun, D.; Babu, B.A. Deep learning system to screen coronavirus disease 2019 pneumonia. Appl. Intell. 2020, 1. [Google Scholar] [CrossRef]
- Toğaçar, M.; Ergen, B.; Cömert, Z. COVID-19 detection using deep learning models to exploit Social Mimic Optimization and structured chest X-ray images using fuzzy color and stacking approaches. Comput. Biol. Med. 2020, 103805. [Google Scholar] [CrossRef]
- Ucar, F.; Korkmaz, D. COVIDiagnosis-Net: Deep Bayes-SqueezeNet based Diagnostic of the Coronavirus Disease 2019 (COVID-19) from X-Ray Images. Med. Hypotheses 2020, 109761. [Google Scholar] [CrossRef]
- Elasnaoui, K.; Chawki, Y. Using X-ray images and deep learning for automated detection of coronavirus disease. J. Biomol. Struct. Dyn. 2020, 38, 1–22. [Google Scholar] [CrossRef]
- Vaid, S.; Kalantar, R.; Bhandari, M. Deep learning COVID-19 detection bias: Accuracy through artificial intelligence. Int. Orthop. 2020, 44, 1539–1542. [Google Scholar] [CrossRef] [PubMed]
- Krizhevsky, A.; Sutskever, I.; Hinton, G.E. ImageNet classification with deep convolutional neural networks. Commun. ACM 2017, 60, 84–90. [Google Scholar] [CrossRef]
- He, K.; Zhang, X.; Ren, S.; Sun, J. Deep residual learning for image recognition. In Proceedings of the IEEE Conference on Computer Vision and Pattern Recognition, Las Vegas, NV, USA, 27–30 June 2016; pp. 770–778. [Google Scholar] [CrossRef]
- Simonyan, K.; Zisserman, A. Very deep convolutional networks for large-scale image recognition. In Proceedings of the International Conference on Learning Representations, San Diego, CA, USA, 7–9 May 2015. [Google Scholar]
- Szegedy, C.; Liu, W.; Jia, Y.; Sermanet, P.; Reed, S.; Anguelov, D.; Erhan, D.; Vanhoucke, V.; Rabinovich, A. Going deeper with convolutions. In Proceedings of the IEEE Conference on Computer Vision and Pattern Recognition, Boston, MA, USA, 7–12 June 2015; pp. 1–9. [Google Scholar] [CrossRef]
- Tan, M.; Le, Q.V. EfficientNet: Rethinking model scaling for convolutional neural networks. In Proceedings of the 36th International Conference on Machine Learning, Long Beach, CA, USA, 9–15 June 2019; pp. 6105–6114. [Google Scholar]
- Huang, G.; Liu, Z.; Van Der Maaten, L.; Weinberger, K.Q. Densely connected convolutional networks. In Proceedings of the IEEE Conference on Computer Vision and Pattern Recognition, Honolulu, HI, USA, 21–26 July 2017; pp. 4700–4708. [Google Scholar] [CrossRef]
- Zhang, L.; Schaeffer, H. Forward stability of ResNet and its variants. J. Math. Imaging Vis. 2020, 62, 328–351. [Google Scholar] [CrossRef]
- Véstias, M.P. A survey of convolutional neural networks on edge with reconfigurable computing. Algorithms 2019, 12, 154. [Google Scholar] [CrossRef]
- Qiu, J.; Wang, J.; Yao, S.; Guo, K.; Li, B.; Zhou, E.; Yu, J.; Tang, T.; Xu, N.; Song, S.; et al. Going Deeper with Embedded FPGA Platform for Convolutional Neural Network. In Proceedings of the 2016 ACM/SIGDA International Symposium on Field-Programmable Gate (FPGA ’16), Monterey, CA, USA, 21–23 February 2016. [Google Scholar] [CrossRef]
- Dieterle, F.J. Multianalyte Quantifications by Means of Integration of Artificial Neural Networks, Genetic Algorithms and Chemometrics for Time-Resolved Analytical Data. Ph.D. Thesis, Eberhard-Karls-Universität Tübingen, Tübingen, Germany, 2003. [Google Scholar]
- Turkoglu, M. COVIDetectioNet: COVID-19 diagnosis system based on X-ray images using features selected from pre-learned deep features ensemble. Appl. Intell. 2020, 1–14. [Google Scholar] [CrossRef]
- Narin, A.; Kaya, C.; Pamuk, Z. Automatic detection of coronavirus disease (covid-19) using x-ray images and deep convolutional neural networks. arXiv 2020, arXiv:2003.10849. [Google Scholar]
- Farooq, M.; Hafeez, A. Covid-ResNet: A deep learning framework for screening of covid19 from radiographs. arXiv 2020, arXiv:2003.14395. [Google Scholar]
- Wu, X.; Hui, H.; Niu, M.; Li, L.; Wang, L.; He, B.; Yang, X.; Li, L.; Li, H.; Tian, J.; et al. Deep learning-based multi-view fusion model for screening 2019 novel coronavirus pneumonia: A multicentre study. Eur. J. Radiol. 2020, 109041. [Google Scholar] [CrossRef]
- Hall, L.O.; Paul, R.; Goldgof, D.B.; Goldgof, G.M. Finding covid-19 from chest x-rays using deep learning on a small dataset. arXiv 2020, arXiv:2004.02060. [Google Scholar]
- Sethy, P.K.; Behera, S.K. Detection of coronavirus disease (COVID-19) based on deep features. Preprints 2020. [Google Scholar] [CrossRef]
- Loey, M.; Manogaran, G.; Khalifa, N.E.M. A deep transfer learning model with classical data augmentation and CGAN to detect COVID-19 from chest CT radiography digital images. Neural Comput. Appl. 2020, 1–13. [Google Scholar] [CrossRef] [PubMed]
- Khoshbakhtian, F.; Ashraf, A.B.; Khan, S.S. COVIDomaly: A Deep Convolutional Autoencoder Approach for Detecting Early Cases of COVID-19. arXiv 2020, arXiv:2010.02814. [Google Scholar]
- Mahmud, T.; Rahman, M.A.; Fattah, S.A. CovXNet: A multi-dilation convolutional neural network for automatic COVID-19 and other pneumonia detection from chest X-ray images with transferable multi-receptive feature optimization. Comput. Biol. Med. 2020, 122, 103869. [Google Scholar] [CrossRef]
- Toraman, S.; Alakus, T.B.; Turkoglu, I. Convolutional CapsNet: A novel artificial neural network approach to detect COVID-19 disease from X-ray images using capsule networks. Chaos Solitons Fractals 2020, 140, 110122. [Google Scholar] [CrossRef]
- Loey, M.; Smarandache, F.; M Khalifa, N.E. Within the Lack of Chest COVID-19 X-ray Dataset: A Novel Detection Model Based on GAN and Deep Transfer Learning. Symmetry 2020, 12, 651. [Google Scholar] [CrossRef]
- Luz, E.; Silva, P.L.; Silva, R.; Moreira, G. Towards an efficient deep learning model for covid-19 patterns detection in x-ray images. arXiv 2020, arXiv:2004.05717. [Google Scholar]
- Das, N.N.; Kumar, N.; Kaur, M.; Kumar, V.; Singh, D. Automated deep transfer learning-based approach for detection of COVID-19 infection in chest X-rays. IRBM 2020. [Google Scholar] [CrossRef]
- Maguolo, G.; Nanni, L. A critic evaluation of methods for covid-19 automatic detection from x-ray images. arXiv 2020, arXiv:2004.12823. [Google Scholar]
- Maghdid, H.S.; Asaad, A.T.; Ghafoor, K.Z.; Sadiq, A.S.; Khan, M.K. Diagnosing COVID-19 pneumonia from X-ray and CT images using deep learning and transfer learning algorithms. arXiv 2020, arXiv:2004.00038. [Google Scholar]
- Hemdan, E.E.D.; Shouman, M.A.; Karar, M.E. COVIDX-Net: A framework of deep learning classifiers to diagnose covid-19 in x-ray images. arXiv 2020, arXiv:2003.11055. [Google Scholar]
- Hammoudi, K.; Benhabiles, H.; Melkemi, M.; Dornaika, F.; Arganda-Carreras, I.; Collard, D.; Scherpereel, A. Deep Learning on Chest X-ray Images to Detect and Evaluate Pneumonia Cases at the Era of COVID-19. arXiv 2020, arXiv:2004.03399. [Google Scholar]
- Waheed, A.; Goyal, M.; Gupta, D.; Khanna, A.; Al-Turjman, F.; Pinheiro, P.R. CovidGAN: Data augmentation using auxiliary classifier gan for improved covid-19 detection. IEEE Access 2020, 8, 91916–91923. [Google Scholar] [CrossRef]
- Islam, M.Z.; Islam, M.M.; Asraf, A. A combined deep CNN-LSTM network for the detection of novel coronavirus (COVID-19) using X-ray images. Informatics Med. Unlocked 2020, 20, 100412. [Google Scholar] [CrossRef] [PubMed]
- Zulkifley, M.A.; Abdani, S.R.; Zulkifley, N.H. COVID-19 Screening Using a Lightweight Convolutional Neural Network with Generative Adversarial Network Data Augmentation. Symmetry 2020, 12, 1530. [Google Scholar] [CrossRef]
- Minaee, S.; Kafieh, R.; Sonka, M.; Yazdani, S.; Jamalipour Soufi, G. Deep-COVID: Predicting COVID-19 from chest X-ray images using deep transfer learning. Med. Image Anal. 2020, 65, 101794. [Google Scholar] [CrossRef]
- Sekeroglu, B.; Ozsahin, I. Detection of COVID-19 from Chest X-Ray Images Using Convolutional Neural Networks. Slas Technol. Transl. Life Sci. Innov. 2020, 1–13. [Google Scholar] [CrossRef]
- Panwar, H.; Gupta, P.; Siddiqui, M.K.; Morales-Menendez, R.; Singh, V. Application of Deep Learning for Fast Detection of COVID-19 in X-Rays using nCOVnet. Chaos Solitons Fractals 2020, 109944. [Google Scholar] [CrossRef]
- Clark, K.; Vendt, B.; Smith, K.; Freymann, J.; Kirby, J.; Koppel, P.; Moore, S.; Phillips, S.; Maffitt, D.; Pringle, M.; et al. The Cancer Imaging Archive (TCIA): Maintaining and operating a public information repository. J. Digit. Imaging 2013, 26, 1045–1057. [Google Scholar] [CrossRef]
- Desai, S.; Baghal, A.; Wongsurawat, T.; Al-Shukri, S.; Gates, K.; Farmer, P.; Rutherford, M.; Blake, G.; Nolan, T.; Powell, T.; et al. Data from Chest Imaging with Clinical and Genomic Correlates Representing a Rural COVID-19 Positive Population [Data set]. Cancer Imaging Arch. 2020. [Google Scholar] [CrossRef]
- Kermany, D.; Zhang, K.; Goldbaum, M. Labeled optical coherence tomography (OCT) and Chest X-Ray images for classification. Mendeley Data 2018, 2. [Google Scholar] [CrossRef]
- Perez, L.; Wang, J. The effectiveness of data augmentation in image classification using deep learning. arXiv 2017, arXiv:1712.04621. [Google Scholar]
- Ioffe, S.; Szegedy, C. Batch normalization: Accelerating deep network training by reducing internal covariate shift. In Proceedings of the 32nd International Conference on Machine Learning, Lille, France, 6–11 July 2015. [Google Scholar]
- Gal, Y.; Ghahramani, Z. A theoretically grounded application of dropout in recurrent neural networks. In Proceedings of the Advances in Neural information processing systems, Barcelona, Spain, 5–10 December 2016; pp. 1019–1027. [Google Scholar]
- Pedregosa, F.; Varoquaux, G.; Gramfort, A.; Michel, V.; Thirion, B.; Grisel, O.; Blondel, M.; Prettenhofer, P.; Weiss, R.; Dubourg, V.; et al. Scikit-learn: Machine learning in Python. J. Mach. Learn. Res. 2011, 12, 2825–2830. [Google Scholar]
- Kermany, D.S.; Goldbaum, M.; Cai, W.; Valentim, C.C.; Liang, H.; Baxter, S.L.; McKeown, A.; Yang, G.; Wu, X.; Yan, F.; et al. Identifying medical diagnoses and treatable diseases by image-based deep learning. Cell 2018, 172, 1122–1131. [Google Scholar] [CrossRef] [PubMed]
- Dansana, D.; Kumar, R.; Bhattacharjee, A.; Hemanth, D.J.; Gupta, D.; Khanna, A.; Castillo, O. Early diagnosis of COVID-19-affected patients based on X-ray and computed tomography images using deep learning algorithm. Soft Comput. 2020, 28, 1–9. [Google Scholar] [CrossRef]
- Narayanan, B.N.; Hardie, R.C.; Krishnaraja, V.; Karam, C.; Davuluru, V.S.P. Transfer-to-Transfer Learning Approach for Computer Aided Detection of COVID-19 in Chest Radiographs. AI 2020, 1, 539–557. [Google Scholar] [CrossRef]
- Apostolopoulos, I.D.; Mpesiana, T.A. Covid-19: Automatic detection from x-ray images utilizing transfer learning with convolutional neural networks. Phys. Eng. Sci. Med. 2020, 43, 635–640. [Google Scholar] [CrossRef]
- Chest X-ray Images (Pneumonia). 2020. Available online: https://www.kaggle.com/paultimothymooney/chest-xray-pneumonia (accessed on 20 November 2020).
- Cohen, J.P. COVID-19 Image Data Collection. 2020. Available online: https://github.com/ieee8023/COVID-chestxray-dataset (accessed on 20 November 2020).
- Marques, G.; Agarwal, D.; de la Torre Díez, I. Automated medical diagnosis of COVID-19 through EfficientNet convolutional neural network. Appl. Soft Comput. 2020, 96, 106691. [Google Scholar] [CrossRef]
- Ozturk, T.; Talo, M.; Yildirim, E.A.; Baloglu, U.B.; Yildirim, O.; Acharya, U.R. Automated detection of COVID-19 cases using deep neural networks with X-ray images. Comput. Biol. Med. 2020, 121, 103792. [Google Scholar] [CrossRef]
- Khan, A.; Sohail, A.; Zahoora, U.; Qureshi, A.Q. A survey of the recent architectures of deep convolutional neural networks. Artif. Intell. Rev. 2020, 53, 5455–5516. [Google Scholar] [CrossRef]
- Baccarelli, E.; Scardapane, S.; Scarpiniti, M.; Momenzadeh, A.; Uncini, A. Optimized training and scalable implementation of Conditional Deep Neural Networks with early exits for Fog-supported IoT applications. Inf. Sci. 2020, 521, 107–143. [Google Scholar] [CrossRef]
- Shojafar, M.; Pooranian, Z.; Vinueza Naranjo, P.G.; Baccarelli, E. FLAPS: Bandwidth and delay-efficient distributed data searching in Fog-supported P2P content delivery networks. J. Supercomput. 2017, 73, 5239–5260. [Google Scholar] [CrossRef]
- Baccarelli, E.; Biagi, M. Power-allocation policy and optimized design of multiple-antenna systems with imperfect channel estimation. IEEE Trans. Veh. Technol. 2004, 53, 136–145. [Google Scholar] [CrossRef]
- Baccarelli, E.; Biagi, M.; Pelizzoni, C. On the information throughput and optimized power allocation for MIMO wireless systems with imperfect channel estimation. IEEE Trans. Signal Process. 2005, 53, 2335–2347. [Google Scholar] [CrossRef]
- Baccarelli, E.; Biagi, M. Performance and optimized design of space-time codes for MIMO wireless systems with imperfect channel estimates. IEEE Trans. Signal Process. 2004, 52, 2911–2923. [Google Scholar] [CrossRef]
- Baccarelli, E.; Cusani, R.; Galli, S. A novel adaptive receiver with enhanced channel tracking capability for TDMA-based mobile radio communications. IEEE J. Sel. Areas Commun. 1998, 16, 1630–1639. [Google Scholar] [CrossRef]
- Baccarelli, E.; Cusani, R. Recursive Kalman-type optimal estimation and detection of hidden Markov chains. Signal Process. 1996, 51, 55–64. [Google Scholar] [CrossRef]
- Scardapane, S.; Scarpiniti, M.; Baccarelli, E.; Uncini, A. Why should we add early exits to neural networks? Cogn. Comput. 2020, 12, 954–966. [Google Scholar] [CrossRef]


Publisher’s Note: MDPI stays neutral with regard to jurisdictional claims in published maps and institutional affiliations. |
© 2021 by the authors. Licensee MDPI, Basel, Switzerland. This article is an open access article distributed under the terms and conditions of the Creative Commons Attribution (CC BY) license (http://creativecommons.org/licenses/by/4.0/).