Abstract
One of the key components of the software quality model is reliability. Its importance has grown with the increasing use and reuse of open-source components in software development. Software reliability growth models are commonly employed to address this aspect by predicting future failure rates and estimating the number of remaining defects throughout the development process. This paper investigates two software reliability growth models derived from the Verhulst model, with a particular focus on a structural property known as Hausdorff saturation. We provide analytical estimates for this characteristic and propose it as an additional criterion for model selection. The models are evaluated using four open-source datasets, where the Hausdorff saturation metric supports the conclusions drawn from standard goodness-of-fit measures. Furthermore, we introduce an interactive software reliability assessment tool that integrates with GitHub, enabling expert users to analyze real-time issue-tracking data from open-source repositories. The tool facilitates model comparison and enhances practical applicability. Overall, the proposed approach contributes to more robust reliability assessment by combining theoretical insights with actionable diagnostics.
Keywords:
software reliability growth model; non-homogeneous Poisson process (NHPP); Hausdorff saturation; open-source projects; reliability assessment tool; GitHub MSC:
68N30; 90B25; 41A46
1. Introduction
Reliability is one of the key attributes of a quality model according to ISO/IEC 25010:2023 (Systems and software engineering—Systems and software Quality Requirements and Evaluation (SQuaRE)—Product quality model) [1]. Moreover for software it is a critical quality metric that reflects a system’s resistance to failure during operation. Traditional reliability assessment methods often require extensive testing or production deployment data. One basic approach of software reliability prediction is using software reliability growth models (SRGMs). Their main aim is supporting the reliability estimation in the process of software development, especially in the phases of testing and validation.
The development of new software reliability growth models constitutes an important topic in the scientific literature. Each of them is based on distinct assumptions concerning the software fault detection process. For instance, some models assume perfect debugging, where faults are immediately and completely removed without introducing new errors. However, this is often unrealistic, as the difficulty of correcting faults tends to increase as testing progresses. In contrast, other models incorporate imperfect debugging, acknowledging that the fault correction process may be incomplete and may introduce additional ones. Some new models for imperfect debugging can be found in [2,3,4,5,6,7].
Open-source software (OSS) projects are developed collaboratively by geographically dispersed developers without centralized management. Unlike traditional software, the testing phase is not clearly demarcated; it is carried out in parallel with coding. It relies on users to identify defects rather than dedicated test teams, so all bugs cannot be fully detected. Given the dynamic and distributed nature of OSS development, assessing its reliability is essential, particularly as such software is increasingly used in new systems. Studying OSS reliability helps ensure quality despite the absence of formal testing phases. Our objective is to investigate the reliability of open-source projects by applying an SRGM. While this is not a novel technique, it remains a meaningful approach for understanding and predicting the fault-finding process. Other advanced methods and applications of the methodology are extensively explored in various studies, such as [8,9,10,11,12].
Most software reliability growth models assume that software faults follow a nonhomogeneous Poisson process (NHPP). They are characterized by a model-specific mean value function used to estimate the expected number of faults detected over time. Based on , the reliability function for a NHPP model can be expressed as the conditional probability , which represents the probability that no software failure will occur in the time interval , where and . Formally, this can be written as
Table 1 presents summary of some basic software reliability growth models including the definitions of their mean value functions and their corresponding types (concave or S-shaped).

Table 1.
Summary of some basic software reliability models.
In 2018, Pham [20] proposed estimating the mean value function using a logistic growth model, also known as the Verhulst model, defined by
where is fault content function and is software fault detection rate per unit of time.
Haque and Ahmad [21] proposed the software reliability model that takes into account the improvement of the testing team’s skills over time. Its mean value function is expressed by
They used (1) with , and . Function is the same as in the Generalized Goel Model and represents an initial increase followed by a decrease in the failure rate.
Song, Kim and Chang [22] consider a software reliability model that considers the number of finite faults and dependent faults with the mean value function defined by
It is obtained from (1) with , and . This model is assumed to be used for open-source software.
Some other SRGM models obtained by the logistic growth model can be found in [23,24,25].
In this study, we have two main aims. First, we introduce an intrinsic characteristic known as Hausdorff saturation for software reliability models. It provides a quantitative measure of how close the software is to completing its failure discovery process. In Section 2 we present a detailed analysis for two software reliability models—Haque–Ahmad and Song–Kim–Chang . We prove precise estimates of Hausdorff distance to the horizontal asymptote. Additionally, we utilize four datasets from an open-source platforms to perform a comparative analysis between three classical and two proposed software reliability growth models. We apply standard goodness-of-fit tests and Hausdorff saturation to determine the most appropriate approximation model. Our second goal is assessing the reliability of open-source software (OSS) projects by analyzing the patterns of issue creation and resolution over time. By focusing on the trends in opened and closed issues, we aim to determine the maturity and reliability of OSS projects. Section 3 describes the development of a software reliability assessment tool designed for this purpose. The proposed tool implements five software reliability growth models within a dynamic Wolfram Language environment that directly interfaces with the GitHub API. The presented process enables real-time reliability assessment and provides comparative analysis of model fits to determine the most appropriate for a given software project.
2. Approximation Results
2.1. Hausdorff Saturation
The main aim of this subsection is investigation of the intrinsic characteristic named Hausdorff saturation. It presents the distance between the mean value function of software reliability growth model and a -shaped curve connecting its endpoints. This metric can be applied to models with a horizontal asymptote, which typically represents the theoretical maximum number of defects that can be detected over time. By evaluating the proximity of the model’s predictions to this asymptote, Hausdorff saturation provides insight into the maturity and completeness of the software testing process. This characteristic can aid in selecting the most suitable software reliability model for approximating a given dataset.
The advantages of the Hausdorff metric for approximating functions and point sets in the plane, compared to the uniform metric, have been highlighted in numerous publications and monographs over the past 70 years. Recently, this classical theory has been applied in the study of dynamic models in various fields, including growth theory such as investigations into epidemic models, particularly those related to the COVID-19 pandemic [26], the synthesis and analysis of antenna patterns and filters [27], the approximation of data related to computer virus propagation [28], debugging and test theory [29,30,31,32,33].
We consider Euclidean space with the maximum norm, namely, for the points and in , we have . Hence we can define the Hausdorff distance [34,35].
Definition 1.
The Hausdorff distance (the H-distance) between two interval functions on is the distance between their completed graphs and considered as closed subsets of . More precisely,
Definition 2.
The saturation of a software reliability model on , is the Hausdorff distance between the completed graph of the mean value function with asymptote h and the Γ-shaped curve consisting of two lines—one vertical between the points and and another horizontal between and .
Corollary 1.
The saturation of an SRGM model with mean value function to the horizontal asymptote h at the “median level” satisfies the following nonlinear equation:
where .
Proof.
The proof follows immediately from Definitions 1 and 2. Equation (4) has a unique root since the function is increasing and continuous. □
According to Definitions 1 and 2, we have that Hausdorff saturation d is the smallest square (box) ball touching the graph of the mean value function of the software reliability model. The Hausdorff metric is an approximation error between the sigmoidal (mean value) function and a step function. Figure 1 presents a graphical representation of the problem.
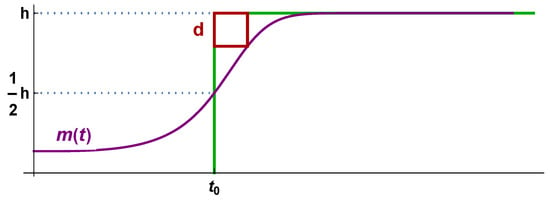
Figure 1.
Graphical representation of Hausdorff saturation d of mean value function .
A small Hausdorff distance indicates that the model’s predicted failure counts are approaching the theoretical upper bound, suggesting that the majority of detectable defects have been identified and resolved. This reflects a mature testing process and a high level of software reliability. Conversely, a large Hausdorff distance implies a significant gap between current failure predictions and the model’s asymptote, indicating that the software remains in the reliability growth phase and is not yet suitable for high-assurance deployment.
The next theorem gives some useful estimates for Hausdorff saturation of the software reliability model.
Theorem 1.
The Hausdorff saturation d of Haque–Ahmad software reliability model defined by (2) satisfies
where
with .
Proof of Theorem 1.
First we note that and for . We apply Corollary 1 as we consider the function
We apply the Taylor series for function
With simple calculations, we have
Hence, . From here we can conclude that , where
with defined by (5). Therefore function approximates for with . Function is also monotonically increasing since . If , then and , which completes the proof. □
Theorem 2.
The Hausdorff saturation d of the Song–Kim–Chang software reliability model defined by (3) satisfies
where
with , and is the Lambert-W function.
Proof of Theorem 2.
Regarding analogues, first we compute . Moreover for . We apply Corollary 1 as we consider the function
We consider the analogue from the Taylor series, and
and we obtain that . Hence , where
with defined by (6). Therefore function approximates for with . We have analogue proof of and , which ends the proof. □
2.2. Numerical Examples
In this subsection, we present two examples involving the fitting of software reliability growth models (SRGMs) to an open-source dataset containing detected software faults. We constructed a nonlinear regression model based on an SRGM using the NonlinearModelFit function in the CAS Wolfram Mathematica [36]. Let us note that this function estimates the parameters of nonlinear models via the least-squares method, under the assumption that the residuals are independent and normally distributed. It returns a FittedModel object, which provides access to a wide range of diagnostic information. A key advantage of this model-fitting framework is the ability to retrieve detailed results and diagnostics without refitting the model. The available properties include parameter estimates, standard errors, confidence intervals, residuals and goodness-of-fit statistics.
Example 1.



The GNOME (GNU’s Not Unix Network Object Model Environment) project is an open-source platform that has a free and complete set of user friendly applications and tools. We consider the dataset (Table 2) from version GNOME 2.2 [37]. The first row is time in weeks, and the second one is for cumulative detected faults.

Table 2.
Detected faults in GNOME 2.2 official public releases.
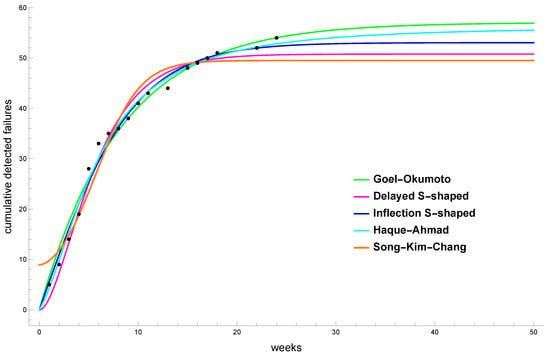
We propose a comparison between software reliability models that have horizontal asymptote , namely, the Goel–Okumoto, delayed S-shaped, inflection S-shaped, Haque–Ahmad and Song–Kim–Chang models. Values of estimated parameters with four digits after the decimal point for the considered models are presented in Table 3.

Table 3.
Parameter estimation for GNOME 2.2 dataset.
Figure 2 shows a graphical representation of the cumulative number of failures (with black dots) and estimated mean value functions of the proposed software reliability models.

Figure 2.
Fitting results for GNOME 2.2 dataset.
We evaluate the goodness-of-fit of the considered software reliability models using standard criteria, available as properties of the FittedModel object. Namely, we use the Akaike information criterion (AIC), Bayesian information criterion (BIC), coefficient of determination ( or R-squared), and Adjusted R-squared. Let us recall that, among a set of approximation models, the preferred model is the one with the minimum AIC and BIC values and the maximum R-squared and adjusted R-squared values. The numerical results are presented in Table 4. We can see that Haque–Ahmad software reliability model has the best criteria values.

Table 4.
Comparison of criteria values for GNOME 2.2 dataset.
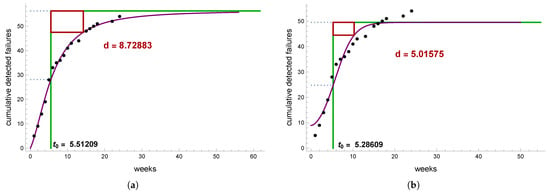
Let us consider the Hausdorff saturation of obtained approximation models with parameters from Table 3. For Haque–Ahmad software reliability model defined by (2) for , and , the value of Hausdorff distance is with . The values of upper and lower estimates and are computed using Theorem 1. According to Theorem 2 for the Song–Kim–Chang software reliability model, we have for with corresponding estimates and . Figure 3 graphically presents the obtained results. It is obvious that Haque–Ahmad software reliability model is better for the GNOME 2.2 dataset.

Figure 3.
Hausdorff saturation for (a) Haque–Ahmad software reliability model. (b) Song–Kim–Chang software reliability model.
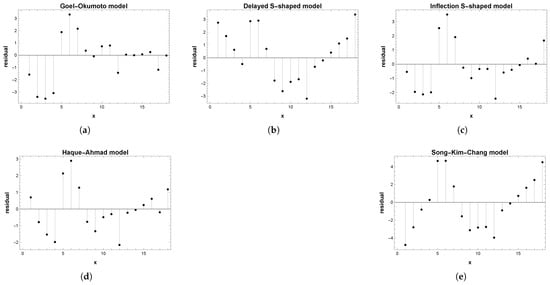
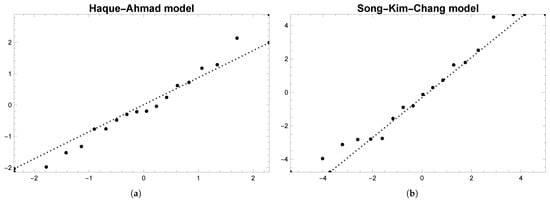
The residuals from a fitted model are defined as the differences between the observed and predicted values. The fitting residuals data is distributed according to the Normal distribution. The residual vs. predictor plot of fitting residuals for all five models is presented in Figure 4. Also Figure 5 presents the quantile plot of fitting residuals for Haque–Ahmad and Song–Kim–Chang software reliability models.

Figure 4.
Residual vs. predictor plot of fitting residuals for (a) Goel–Okumoto, (b) delayed S-shaped, (c) inflection S-shaped, (d) Haque–Ahmad and (e) Song–Kim–Chang software reliability models.

Figure 5.
Quantile plot of fitting residuals for (a) Haque–Ahmad software reliability model and (b) Song–Kim–Chang software reliability model.
Also we tested the hypothesis that fitting residuals for all five compared models follow a normal distribution. It is not rejected at the 5 percent significance level according to the Jarque–Bera ALM, Mardia Combined, Mardia Kurtosis, Mardia Skewness or Shapiro–Wilk standard goodness-of-fit tests.
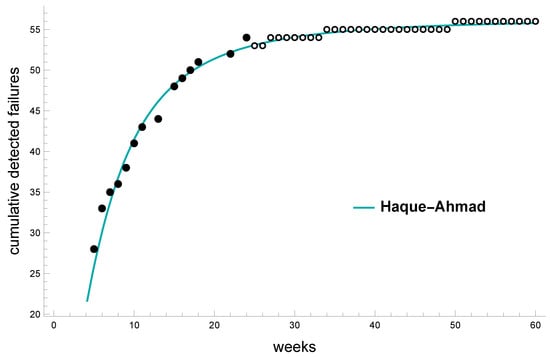
We propose comparing different types of software reliability models for approximating the GNOME 2.2 dataset. According to the standard test of goodness-of-fit and Hausdorff saturation, we can conclude that Haque–Ahmad software reliability model is the best for predicting the number of faults in the future. Figure 6 presents actual and predicted number of software faults. The solid black points show the faults that were actually observed during testing, while the open (unfilled) points show the predicted values from our model. This kind of plot helps us assess how stable the fault detection process is and gives us a sense of whether the software is reaching a reliable state before release.

Figure 6.
Prediction for the number of faults for GNOME 2.2 dataset.
Example 2.



Ansible is an open-source automation tool that supports provisioning, configuration, application deployment and infrastructure management following the Infrastructure as Code (IaC) paradigm. It uses a declarative language to define system states and operates across Unix-based systems and Windows. As a widely adopted DevOps tool, Ansible plays a crucial role in automating complex tasks and ensuring efficient, repeatable infrastructure operations.
We consider a dataset (Table 5) from Ansible software used in [38]. The time period is from 1 January 2016 to 31 December 2017 as for each month we take the cumulative detected faults.

Table 5.
Detected faults in Ansible official public releases.
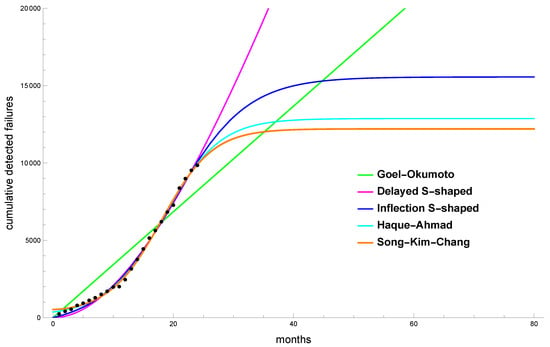
Table 6 presents values of estimated parameters with four digits after the decimal point for the considered models. Figure 7 shows a graphical representation of the cumulative number of failures (with black dots) and estimated mean value functions of the proposed software reliability models.

Table 6.
Parameter estimation for Ansible software dataset.

Figure 7.
Fitting results for Ansible dataset.
Table 7 presents the values of standard criteria for evaluation the goodness-of-fit. Although the Haque–Ahmad software reliability model has the best values for three of the proposed criteria, both the Haque–Ahmad and Song–Kim–Chang models yield extremely similar results. Therefore, we can conclude that both models are suitable for application to the considered dataset.

Table 7.
Comparison of criteria values for Ansible software dataset.
The Hausdorff saturation is calculated for obtained parameters from Table 6. We obtain the value of Hausdorff distance with for Haque–Ahmad software reliability model . By Theorem 1 we have estimates and . Regarding the analogue for Song–Kim–Chang software reliability model , we have for with corresponding estimates and by Theorem 2. The obtained Hausdorff saturation values are highly similar, particularly when normalized with respect to the horizontal asymptote. This suggests that both models are equally appropriate for application to the given dataset.
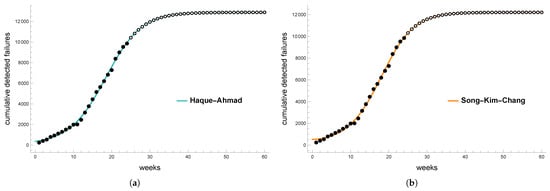
Based on the fault detection data for the Ansible software over a two-year period, both the Haque–Ahmad and Song–Kim–Chang models demonstrate comparable performance in terms of goodness-of-fit and Hausdorff saturation. Therefore, both models can be effectively used for fault prediction in this context. As shown in Figure 8, the actual number of faults (solid black points) is followed by predicted values (open, unfilled points), with both models closely capturing the observed trend. This consistency indicates that either model can be reliably applied for fault prediction and reliability assessment of the software.

Figure 8.
Prediction number of faults for the Ansible software for (a) Haque–Ahmad software reliability model. (b) Song–Kim–Chang software reliability model.
Example 3.



Electron is an open-source project under the OpenJS Foundation maintained by an active community of contributors. It is designed for developing cross-platform desktop applications with HTML, CSS and JavaScript. Electron is built on Node.js and Chromium, which makes it a suitable choice for web developers.
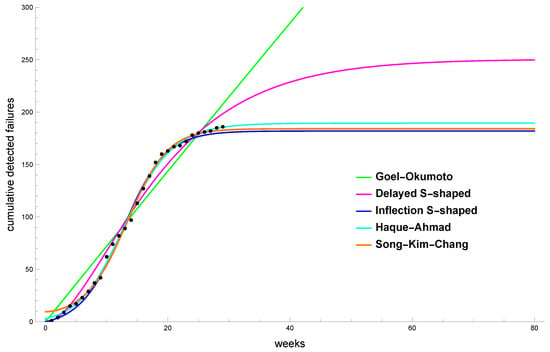
Electron frequently releases major versions in sync with every other Chromium release. We consider the issue reports from GitHub for version 31.0.0 during its Stable phase. Table 8 presents the cumulative number of detected faults over a period of 29 weeks, from 10 April 2024 to 30 October 2024.

Table 8.
Detected faults in Electron official public releases.
Table 9 presents the estimated parameters for the models under consideration, with values rounded to four decimal places. Figure 9 provides a graphical representation of the cumulative number of failures (indicated by black dots) alongside the estimated mean value functions of the proposed software reliability models. A quantitative evaluation of the models’ performance, based on standard goodness-of-fit criteria, is detailed in Table 10.

Table 9.
Parameter estimation for Electron 31.0.0 dataset.

Figure 9.
Fitting results for Electron 31.0.0.

Table 10.
Comparison of criteria values for Electron software dataset.
Using the parameters estimated in Table 9, we calculated the Hausdorff saturation for the Haque–Ahmad software reliability model (). The Hausdorff distance is with . Consistent with Theorem 1, the lower and upper bounds were estimated as and , respectively. Similarly, an analogous calculation for the Song–Kim–Chang software reliability model () yielded a Hausdorff distance of at . The corresponding estimates, as established by Theorem 2, are and .
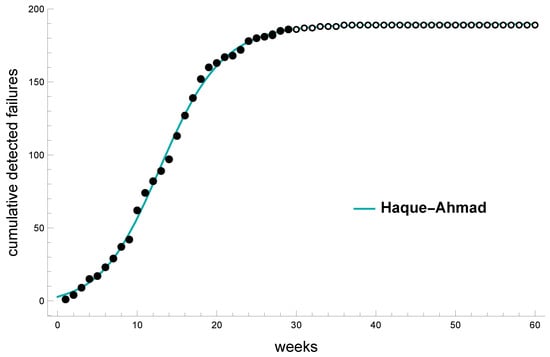
The analysis of Hausdorff saturation demonstrates the stability of the models under consideration. Based on the combined results of standard goodness-of-fit tests and the Hausdorff saturation, we can conclude that the Haque–Ahmad software reliability model is the most suitable for forecasting future fault occurrences. This is illustrated in Figure 10.

Figure 10.
Prediction for the number of faults for Electron dataset.
Example 4.


Eclipse Foundation platform is a major open-source software ecosystem. It is primarily Java-based with a plugin architecture supporting multiple programming languages such as C, C++, PHP, Perl, JavaScript, Python and others.
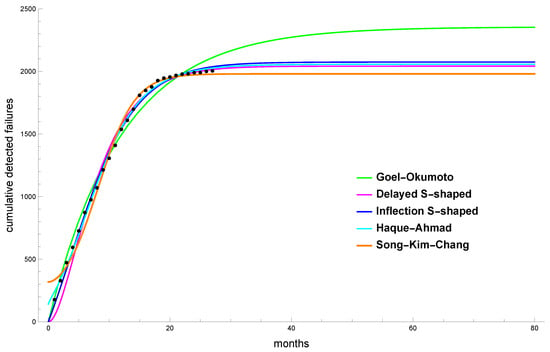
Table 11 contains real defect reports submitted by users and developers during routine software operation. The defect reports were obtained from the public Eclipse Bugzilla repository. It covers the period of 27 months (from 01.2023 to 03.2025), during which ten releases (4.26–4.35) were issued.

Table 11.
Detected faults in Eclipse.
The estimated parameters of the analyzed models are given in Table 12. Table 13 summarizes the quantitative performance assessment based on standard goodness-of-fit metrics. A visual comparison is shown in Figure 11, where the cumulative observed failures (black dots) are plotted alongside the estimated mean value functions of the proposed software reliability models.

Table 12.
Parameter estimation for Eclipse dataset.

Table 13.
Comparison of criteria values for Eclipse software dataset.

Figure 11.
Fitting results for Eclipse.
The corresponding values of the Hausdorff saturation for the Haque–Ahmad software reliability model are with with estimates and , respectively. Analogous for the Song–Kim–Chang software reliability model we have Hausdorff distance at with corresponding estimates and .
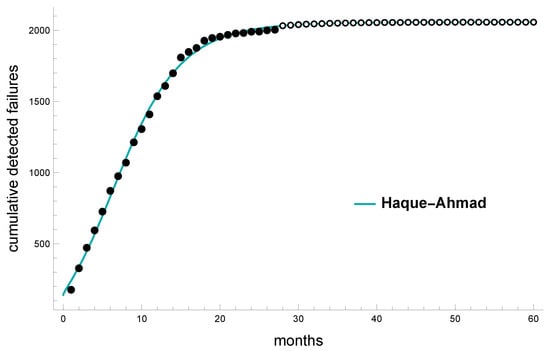
Based on the Haque–Ahmad software reliability model, Figure 12 gives the predicted with open (unfilled) points and actual number solid black points of software faults.

Figure 12.
Prediction for the number of faults for Eclipse dataset.
3. Software Reliability Assessment Tool
Although software reliability growth models can be implemented manually using specialized mathematical software, this process is often time-consuming and demands a high level of expertise. Most software engineers are reluctant to implement these models due to limited awareness, a lack of understanding of the underlying mathematical concepts or time constraints. The development of software engineering tools has been driven by the objective of bridging the gap between theoretical academic research and its practical application. In [39] Xiao, Okamura and Dohi present a review of over 40 software reliability assessment tools. A review of five open-source tools, SFRAT (https://github.com/LanceFiondella/srt.core, accessed on 27 July 2025), SRATS (https://github.com/SwReliab/SRATS2010, accessed on 27 July 2025), RSRAT (https://github.com/SwReliab/Rsrat, accessed on 27 July 2025), PHSRM (https://github.com/okamumu/phsrm, accessed on 27 July 2025) and SMERFS (https://www.slingcode.com/smerfs/, accessed on 27 July 2025), can be found in [40]. Some examples of other tools are SFRAT [41], C-SFRAT [42] and C SFRAT [43]. The basic difference among the tools lie in how they collect data, which software reliability models are used and the programming languages used in their development.
Several tools support the full process of reliability analysis. For instance, STRAIT [44] is a free, open-source tool that collects issue report data directly from GitHub and supports nine software reliability models. It was developed using Java and R. Another example is RAAF-OSS [45], a reliability automatic assessment framework designed for open-source software and compatible with Jira. It is implemented in Python and supports six software reliability models.
We present a computational tool for assessing software reliability through the analysis of issue tracking patterns in GitHub repositories. The tool supports the full reliability analysis process and is designed to be accessible to users without expert knowledge.
It is a dynamic Wolfram Language environment that directly interfaces with GitHub’s API. To the best of the authors’ knowledge, this is the first tool of its kind.
The tool processes five main steps: data collection, data normalization, model fitting, visualization and evaluation.
Data Collection: In open-source software (OSS) projects, public repositories serve both as development platforms and as sources for issue data collection. Issues are retrieved from the GitHub repository, and their creation and closure timestamps are captured. The dataset used comprises closed issues from GitHub repositories, obtained via the GitHub REST API v3. Data points are organized as pairs, where t is the time in days since the first reported issue and is the cumulative number of issues up to time t. This transformed dataset emulates software reliability growth testing data, where the time of discovery of software faults (represented by issues) is modeled over calendar time. This modeling is performed in the absence of formal test-phase data, which is often unavailable in open-source projects. Our tool automates the collection and storage of issue reports directly from GitHub using the project URL. Users only need to provide the repository owner and name.
Data Normalization: Timestamps are normalized to analyze the progression of issues over time. The raw timestamps undergo the following processing steps: 1. conversion to absolute time values; 2. normalization relative to the creation date of the first issue; and 3. binning into daily intervals for consistent time series analysis. In the interactive interface, the user has opportunity to choose amount of data to include, choosing either all issue reports or only a portion using a dynamic slider. Another option allows the user to set the maximum number of iterations to be used during the model fitting process.
Accurate parameter estimation is essential for the effective application of software reliability growth models. Since software failures exhibit nonlinear behavior, merely fitting test data to models is insufficient. Instead, optimization techniques are required to identify the most suitable parameters that ensure reliable prediction accuracy. Our tool allows users to select the most appropriate optimization method for parameter estimation, including
- “ConjugateGradient”—nonlinear conjugate gradient;
- “Gradient” —gradient descent;
- “LevenbergMarquardt”—Gauss–Newton method for least squares;
- “Newton”—Newton method;
- “QuasiNewton” —quasi-Newton BFGS;
- “InteriorPoint”—interior point method;
- “NMinimize”—optimization that always attempts to find a global minimum;
- “Automatic”—automatic default method.
Model Fitting: Various reliability growth models, such as Goel–Okumoto, delayed S-shaped, inflection S-shaped, Haque–Ahmad and Song–Kim–Chang, are applied to the issue data. Each model can be selected by the user. We use CAS Wolfram Mathematica to fit data with high precision. The model fitting function NonlinearModelFit [36] returns a FittedModel object, which provides convenient access to both model predictions and diagnostic information without the need to refit the model. One of the key advantages is its ability to support direct evaluation at specific input values, as well as queries for parameter estimates, residuals and other diagnostic metrics. Once a model is chosen, the parameter estimations are displayed in a table view. The table presents the best-fit parameter information, including values for “Estimate,” “Standard Error,” “t-Statistic” and “p-Value.”
Visualization: Plots are generated to visualize how the selected models fit the actual issue data. These plots allow for analysis of issue trends and provide a clear graphical representation of model performance, helping users choose the most appropriate model.
Evaluation: Criteria values for model comparison present some properties that measure the goodness-of-fit of the considered models in table view. The presented criteria are as follows: “AIC” (Akaike information criterion), “BIC” (Bayesian information criterion), “R-Squared” (coefficient of determination ) and “Adjusted R-Squared” ( adjusted for the number of model parameters). In each row of the table, the most suitable value is highlighted in blue for the selected software reliability models—specifically, the minimum values for AIC and BIC, and the maximum values for R-squared and adjusted R-squared. This facilitates the identification of the model that demonstrates the best fit to the observed data.
The main advantages provided by the interactive interface of our tool are as follows:
- Dynamic model fitting with adjustable sample sizes;
- Support for multiple optimization algorithms;
- Visual comparison of model fits;
- Parameter estimates with statistical significance;
- Ease of use, even for users without expert knowledge.
We demonstrate capabilities of our tool by using the MPAndroidChart repository as a case study (see Figure 13). MPAndroidChart is a powerful and user-friendly charting library for Android https://github.com/PhilJay/MPAndroidChart (accessed on 27 July 2025). This open-source project belongs to Philipp Jahoda and is licensed under the Apache License, Version 2.0. Its repository issue tracker is dedicated exclusively to bug reports and feature requests.
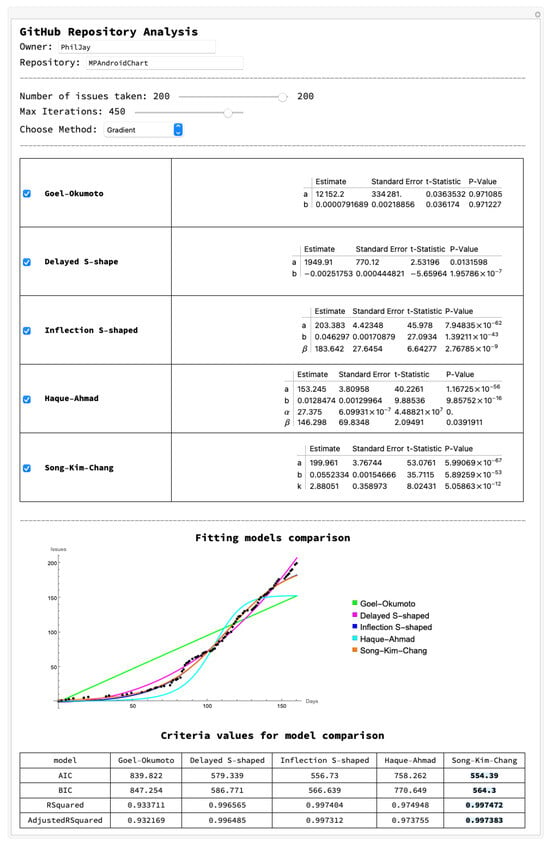
Figure 13.
Software reliability assessment tool.
Analysis of the MPAndroidChart repository revealed a decreasing trend in opened issues over time, suggesting a reduction in the introduction of new defects. Also we observe a high closure rate. A significant proportion of opened issues have been resolved and closed, indicating active maintenance and responsiveness from the development community.
In our software reliability tool, we provide a comparative analysis of all five models. Based on parameter estimations and standard goodness-of-fit tests, we conclude that the Song–Kim–Chang software reliability model offers the most accurate predictions for the number of future faults.
The decreasing number of opened issues, coupled with a high closure rate, suggests that the MPAndroidChart project is maturing and becoming more reliable over time. This aligns with findings from previous studies indicating that OSS projects exhibit reliability growth patterns similar to closed source projects. Moreover, the active engagement of the community in resolving issues contributes to the project’s reliability. As more users and developers participate in identifying and fixing bugs, the software becomes more robust.
By analyzing issue tracking data, we can gain valuable insights into the reliability and maturity of OSS projects. The trends observed in the MPAndroidChart repository demonstrate that a decreasing rate of new issues and a high resolution rate are indicative of a reliable and well-maintained project.
4. Discussion and Conclusions
Open-source projects have become integral to modern software development, offering transparency and collaborative improvement. However, assessing the their reliability remains a challenge due to the decentralized nature of their development. The paper presents an analysis of the so-called Hausdorff saturation characteristic for two software reliability models based on the logistic growth model. The main goal is to propose an additional criterion for model selection. Thus, this distance acts as a geometric indicator of software reliability maturity, helping assess how close we are to a stable, dependable system. This methodology can be successfully applied to other models as well. We considered four numerical examples using fault detection datasets from two different open-source projects. In the presented two examples, the proposed metric supports the results obtained from the previous metrics, including standard goodness-of-fit tests. The question of the usefulness of the proposed Hausdorff saturation criterion remains open and will be the subject of future research, particularly in the context of large datasets. We present a new dynamic tool for evaluating the reliability of open-source software through the analysis of issue tracking dynamics. The tool supports the complete reliability assessment process in real time and is designed for use by individuals without specialized expertise. To demonstrate its applicability, we include a case study based on an open-source project. Furthermore, the tool is easily extensible, allowing for the integration of additional software reliability growth models.
The applicability of SRGMs to real-world projects is heavily dependent on the characteristics of software repositories and the adopted development methodology. For OSS in particular, development typically follows agile practices rather than classical waterfall models. This approach, characterized by short iterations, continuous feedback and the parallel execution of coding and testing, aligns perfectly with the decentralized nature of OSS communities. Consequently, the reliability assessment of OSS must account for the heterogeneity of the reported data, which includes not only genuine defects but also duplicates, enhancement requests and rejected reports. This reality distinguishes OSS reliability analysis from that of traditional systems, where testing is a more formalized and managed process. Some recent studies [46,47,48] emphasize the need to integrate repository mining and empirical software engineering into SRGM-based analysis, while foundational works [49] continue to provide the guiding theoretical framework. Future research may explore several enhancements to improve software reliability assessment. We can consider incorporating additional metrics. While this study focuses on issue opening and closing trends, integrating other indicators such as pull request activity, code churn, commit frequency and test coverage could offer a more comprehensive view of software reliability and overall project health. One promising direction is analyzing the roles and behaviors of contributors to gain insight into how community dynamics impact the evolution of reliability in open-source projects. Another avenue involves developing a real-time monitoring dashboard that continuously tracks issue dynamics and estimates software reliability, thereby supporting maintainers and contributors in evaluating project status on an ongoing basis. Another promising direction involves correlating issue trends with external quality indicators, such as user ratings, download counts or real-world usage in production systems, to strengthen the link between internal repository data and perceived reliability. Lastly, predictive modeling based on historical issue data could enable the forecasting of future reliability trends, issue arrival rates and resolution times, ultimately aiding in resource planning and risk assessment allocation for OSS projects.
Author Contributions
Conceptualization, M.T.V. and G.P.; methodology, M.T.V.; software, G.P.; validation, M.T.V. and G.P.; formal analysis, M.T.V. and G.P.; data curation, G.P.; writing—original draft preparation, M.T.V. and G.P.; writing—review and editing, M.T.V. and G.P. All authors have read and agreed to the published version of the manuscript.
Funding
This research was funded by project No. FP25-FMI-010, “Innovative interdisciplinary research in Informatics, Mathematics, and Pedagogy of Education”, of the Scientific Fund of the Paisii Hilendarski University of Plovdiv, Bulgaria.
Data Availability Statement
The original data presented in the study are openly available in Github at https://github.com/PhilJay/MPAndroidChart (accessed on 27 July 2025).
Conflicts of Interest
The authors declare no conflicts of interest.
References
- ISO/IEC 25010:2023; Systems and Software Engineering—Systems and Software Quality Requirements and Evaluation (SQuaRE)—Product Quality Model. International Organization for Standardization: Geneva, Switzerland, 2023.
- Huang, Y.S.; Chiu, K.C.; Chen, W.M. A software reliability growth model for imperfect debugging. J. Syst. Softw. 2022, 188, 111267. [Google Scholar] [CrossRef]
- Tian, Q.; Yeh, C.W.; Fang, C.C. Bayesian decision making of an imperfect debugging software reliability growth model with consideration of debuggers’ learning and negligence factors. Mathematics 2022, 10, 1689. [Google Scholar] [CrossRef]
- Luo, H.; Xu, L.; He, L.; Jiang, L.; Long, T. A novel software reliability growth model based on generalized imperfect debugging NHPP framework. IEEE Access 2023, 11, 71573–71593. [Google Scholar] [CrossRef]
- Lee, D.; Chang, I.; Pham, H. Study of a new software reliability growth model under uncertain operating environments and dependent failures. Mathematics 2023, 11, 3810. [Google Scholar] [CrossRef]
- Nazir, R.; Iqbal, J.; Masoodi, F.S.; Shrivastava, A.K. Developing an innovative imperfect debugging software reliability growth model with enhanced testing coverage strategies. Int. J. Reliab. Qual. Saf. Eng. 2024, 31, 2450017. [Google Scholar] [CrossRef]
- Samal, U. Software reliability growth model considering imperfect debugging and fault removal efficiency. Qual. Reliab. Eng. Int. 2025, 41, 1268–1278. [Google Scholar] [CrossRef]
- Yamada, S.; Tamura, Y. OSS Reliability Measurement and Assessment; Springer Series in Reliability Engineering; Springer: Cham, Switzerland, 2016; ISBN 978-3-319-31818-9. [Google Scholar]
- Miyamoto, S.; Tamura, Y.; Yamada, S. A Method of OSS Reliability Assessment Based on Public Repository Analysis. Int. J. Reliab. Qual. Saf. Eng. 2023, 30, 2350021. [Google Scholar] [CrossRef]
- Tamura, Y.; Yamada, S. Applied OSS Reliability Assessment Modeling, AI and Tools; Springer Series in Reliability Engineering; Springer: Cham, Switzerland, 2024; ISBN 978-3-031-64803-8. [Google Scholar]
- Tamura, Y.; Miyamoto, S.; Zhou, L.; Anand, A.; Kapur, P.K.; Yamada, S. OSS reliability assessment method based on deep learning and independent Wiener data preprocessing. Int. J. Syst. Assur. Eng. Manag. 2024, 15, 2668–2676. [Google Scholar] [CrossRef]
- Miyamoto, S.; Tamura, Y.; Yamada, S. A Method of Reliability Assessment Based on Trend Analysis for Open Source Software. Int. J. Reliab. Qual. Saf. Eng. 2024, 31, 2450004. [Google Scholar] [CrossRef]
- Goel, A.L.; Okumoto, K. Time-dependent error-detection rate model for software reliability and other performance measures. IEEE Trans. Reliab. 1979, 28, 206–211. [Google Scholar] [CrossRef]
- Yamada, S.; Ohba, M.; Osaki, S. S-shaped reliability growth modeling for software error detection. IEEE Trans. Reliab. 1983, 32, 475–484. [Google Scholar] [CrossRef]
- Ohba, M. Inflexion S-shaped software reliability growth models. In Stochastic Models in Reliability Theory; Osaki, S., Hatoyama, Y., Eds.; Springer: Berlin, Germany, 1984; pp. 144–162. [Google Scholar]
- Yamada, S.; Tokuno, K.; Osaki, S. Imperfect debugging models with fault introduction rate for software reliability assessment. Int. J. Syst. Sci. 1992, 23, 2241–2252. [Google Scholar] [CrossRef]
- Pham, H.; Nordmann, L.; Zhang, X. A general imperfect software debugging model with S-shaped fault detection rate. IEEE Trans. Reliab. 1999, 48, 169–175. [Google Scholar] [CrossRef]
- Pham, H.; Zhang, X. An NHPP Software Reliability Model and Its Comparison. Int. J. Reliab. Qual. Saf. Eng. 1997, 4, 269–282. [Google Scholar] [CrossRef]
- Pham, H. An imperfect-debugging fault-detection dependent-parameter software. Int. J. Automat. Comput. 2007, 4, 325–328. [Google Scholar] [CrossRef]
- Pham, H. A Logistic fault-dependent detection software reliability model. J. Univers. Comput. Sci. 2018, 24, 1717–1730. [Google Scholar]
- Haque, M.A.; Ahmad, N. An effective software reliability growth model. Saf. Reliab. 2021, 40, 209–220. [Google Scholar] [CrossRef]
- Song, K.Y.; Kim, Y.S.; Chang, I.H. Software reliability model for open-source software that considers the number of finite faults and dependent faults. Math. Biosci. Eng. 2023, 20, 11785–11804. [Google Scholar] [CrossRef]
- Haque, M.A.; Ahmad, N. A logistic growth model for software reliability estimation considering uncertain factors. Int. J. Reliab. Qual. Saf. Eng. 2021, 28, 2150032. [Google Scholar] [CrossRef]
- Haque, M.A.; Ahmad, N. A software reliability model using fault removal efficiency. J. Reliab. Stat. Stud. 2022, 15, 459–472. [Google Scholar] [CrossRef]
- Haque, M.A.; Ahmad, N. A logistic software reliability model with Loglog fault detection rate. Iran J. Comput. Sci. 2025, 8, 1–7. [Google Scholar] [CrossRef]
- Kyurkchiev, N. Selected Topics in Mathematical Modeling: Some New Trends. Dedicated to Academician Blagovest Sendov (1932–2020); LAP LAMBERT Academic Publishing: Saarbrucken, Germany, 2020; ISBN 978-613-9-45608-6. [Google Scholar]
- Kyurkchiev, N. Some intrinsic properties of Tadmor–Tanner functions: Related problems and possible applications. Mathematics 2020, 8, 1963. [Google Scholar] [CrossRef]
- Kyurkchiev, N.; Kyurkchiev, V.; Iliev, A.; Rahnev, A. Some nonstandard differential models with applications to the population dynamics and computer viruses propagation. Dyn. Syst. Appl. 2019, 28, 757–788. [Google Scholar]
- Pavlov, N.; Iliev, A.; Rahnev, A.; Kyurkchiev, N. Some Software Reliability Models: Approximation and Modeling Aspects; LAP LAMBERT Academic Publishing: Saarbrücken, Germany, 2018; ISBN 978-613-9-82805-0. [Google Scholar]
- Pavlov, N.; Iliev, A.; Rahnev, A.; Kyurkchiev, N. Nontrivial Models in Debugging Theory (Part 2); LAP LAMBERT Academic Publishing: Saarbrücken, Germany, 2018; ISBN 978-613-9-87794-2. [Google Scholar]
- Pavlov, N.; Iliev, A.; Rahnev, A.; Kyurkchiev, N. Analysis of the Chen’s and Pham’s software reliability models. Cybern. Inf. Technol. 2018, 18, 37–47. [Google Scholar] [CrossRef]
- Rahneva, O.; Golev, A.; Spasov, G. Investigations on Some New Models in Debugging and Growth Theory (Part 3); LAP LAMBERT Academic Publishing: Saarbrücken, Germany, 2020; ISBN 978-620-66655-8. [Google Scholar]
- Kyurkchiev, N.; Iliev, A.; Golev, A.; Rahnev, A. Some Non-Standard Models in “Debugging and Test Theory” (Part 4); Plovdiv University Press: Plovdiv, Bulgaria, 2020; ISBN 978-619-2-02584-7. [Google Scholar]
- Hausdorff, F. Set Theory, 2nd ed.; Chelsea Publication: New York, NY, USA, 1962. [Google Scholar]
- Sendov, B.L. Hausdorff approximations. In Mathematics and Its Applications; Springer Science & Business Media: Berlin/Heidelberg, Germany, 1990; Volume 50, pp. 1–367. [Google Scholar]
- Wolfram Research, NonlinearModelFit (2008), Wolfram Language Function, (Updated 2025). Available online: https://reference.wolfram.com/language/ref/NonlinearModelFit.html (accessed on 27 July 2025).
- Ramadan, I.S.; Harb, H.M.; Mousa, H.M.; Malhat, M.G. Reliability assessment for open-source software using deterministic and probabilistic models. Int. J. Inf. Technol. Comput. Sci. 2022, 14, 1–15. [Google Scholar] [CrossRef]
- Micko, R.; Chren, S.; Rossi, B. Applicability of software reliability growth models to open source software. In Proceedings of the 2022 48th Euromicro Conference on Software Engineering and Advanced Applications (SEAA), Gran Canaria, Spain, 31 August–2 September 2022; pp. 255–262. [Google Scholar]
- Xiao, X.; Okamura, H.; Dohi, T. Survey of software reliability assessment tools. In Advances in Reliability Science, Developments in Reliability Engineering; Ram, M., Ed.; Elsevier Inc: Amsterdam, The Netherlands, 2024; pp. 575–601. [Google Scholar]
- Lu, S.; Li, H.; Jiang, Z. Comparative study of open source software reliability assessment tools. In Proceedings of the 2020 IEEE International Conference on Artificial Intelligence and Information Systems (ICAIIS), Dalian, China, 20–22 March 2020; pp. 49–55. [Google Scholar]
- Nagaraju, V.; Shekar, V.; Steakelum, J.; Luperon, M.; Shi, Y.; Fiondella, L. Practical software reliability engineering with the Software Failure and Reliability Assessment Tool (SFRAT). SoftwareX 2019, 10, 100357. [Google Scholar] [CrossRef]
- Aubertine, J.; Nagaraju, V.; Fiondella, L. The Covariate Software Failure and Reliability Assessment Tool (C-SFRAT). In Proceedings of the International Conference on Reliability and Quality in Design, Online, 19–22 April 2021. [Google Scholar]
- Aubertine, J.; Chen, K.; Nagaraju, V.; Fiondella, L. A covariate software tool to guide test activity allocation. SoftwareX 2022, 17, 100909. [Google Scholar] [CrossRef]
- Chren, S.; Micko, R.; Buhnova, B.; Rossi, B. STRAIT: A tool for automated software reliability growth analysis. In Proceedings of the 2019 IEEE/ACM 16th International Conference on Mining Software Repositories (MSR), Montreal, QC, Canada, 25–31 May 2019; pp. 105–110. [Google Scholar]
- Wang, Q.; Zhang, W.; Jiang, J.; Li, L. A reliability automatic assessment framework of open source software based on JIRA. In Proceedings of the 2020 9th International Conference on Software and Computer Applications, Langkawi, Malaysia, 18–21 February 2020; pp. 188–193. [Google Scholar]
- Pena, G.; Barraza, N.R.; Anand, A. Increasing failure rate software reliability models for agile projects: A comparative study. In System Performance Modeling; De Gruyter Series on the Applications of Mathematics in Engineering and Information Sciences; De Gruyter: Berlin, Germany; Boston, MA, USA,, 2020; pp. 32–58. ISBN 3110604507. [Google Scholar]
- Lin, J.S.; Huang, C.Y.; Fang, C.C. Analysis and assessment of software reliability modeling with preemptive priority queueing policy. J. Syst. Softw. 2022, 187, 111249. [Google Scholar] [CrossRef]
- Li, Q.; Wang, Y.; Tian, D.; Yuan, C.; Hu, C. Component-based modeling of cascading failure propagation in directed dual-weight software networks. Comput. Netw. 2024, 255, 110861. [Google Scholar] [CrossRef]
- Lyu, M.R. Handbook of Software Reliability Engineering; IEEE Computer Society Press: Los Alamitos, CA, USA, 1996. [Google Scholar]
Disclaimer/Publisher’s Note: The statements, opinions and data contained in all publications are solely those of the individual author(s) and contributor(s) and not of MDPI and/or the editor(s). MDPI and/or the editor(s) disclaim responsibility for any injury to people or property resulting from any ideas, methods, instructions or products referred to in the content. |
© 2025 by the authors. Licensee MDPI, Basel, Switzerland. This article is an open access article distributed under the terms and conditions of the Creative Commons Attribution (CC BY) license (https://creativecommons.org/licenses/by/4.0/).