Abstract
The problem of reducing the increasing number of road traffic accidents has become more relevant in recent years. According to the United Nations plan this number has to be halved by 2030. A very effective way to handle it is to apply the machine learning paradigm to retrospective road traffic accident datasets. This case study applies machine learning techniques to form typical “portraits” of drivers violating road traffic rules by clustering available data into seven homogeneous groups. The obtained results can be used in forming effective marketing campaigns for different target groups. Another relevant problem under consideration is to use available retrospective statistics on mechanical road traffic accidents without victims to estimate the probable type of road traffic accident for the driver taking into account her/his personal features (such as social characteristics, typical road traffic rule violations, driving experience, and age group). For this purpose several machine learning models were applied and the results were discussed.
1. Introduction
The United Nations General Assembly has set an ambitious target of halving the global number of deaths and injuries from road traffic crashes by 2030 (A/RES/74/299). This decision is explained by the increasing number of deaths caused by road traffic accidents (approximately 1.3 million human lives each year). Between 20 and 50 million more people suffer non-fatal injuries, with many incurring a disability as a result of their injury [1]. One of the reasons is the insufficiently high level of drivers trained in driving schools who break traffic regulation rules, as well as poorly organized marketing campaigns to promote compliance with traffic rules. In 2021, new exam rules for traffic police came into force in Russia; they exclude practical tests on special “field” conditions. The list of gross mistakes, due to which driving candidates will be sent to retake exams, has also been changed.
The percentage of graduates who pass the theoretical and practical tests on the first attempt is used to evaluate the success of driving schools. The share of theoretical and practical exams passed by the school graduates, as well as the number of accidents and victims caused by novice drivers, will be taken into account. Various projects (actions, campaigns) are undertaken annually at the federal and regional levels in Russia.
To increase the behavioral safety and to form a legal awareness of road users is a priority in the sphere of information and propaganda support of the activities of the State Traffic Police. Actions are not efficient without applying telecommunications and information technologies, including Internet resources. Opportunities for their use vary, ranging from specialized web-resources to video hosting, using popular hashtags for high-quality infographics, mobile apps, applications to perform mass thematic mailings, social advertising, etc. Planning marketing campaigns is not efficient without taking into account the regional component that could be detected by analyzing retrospective datasets on road traffic accidents. The authors firstly explored available datasets with the goal to cluster drivers who violated road traffic rules in the study [2].
The research question of the current study is the applicability of machine learning approaches to a road traffic accident dataset with the goal of exploring its structure and building models connecting drivers who are initiators of road traffic accidents with their personal features. Only mechanical road traffic crashes without victims were taken into account. The results can help to analyze the distribution of traffic accidents in the Lipetsk region and to form typical “portraits” of traffic offenders to plan effective marketing campaigns as well as to make a prediction of probable traffic violations based on the specific features of an average driver.
The paper introduces classical machine learning models and approaches applied to researching road traffic accident datasets to construct homogeneous groups of drivers who cause accidents and to predict the most probable accident type.
2. Problem Formulation and Related Works
This section is organized as follows. In the beginning we introduce a conceptual scheme providing our contribution to road traffic accident data exploration based on applying machine learning approaches and models, then we observe the existing practices of related problems with their limitations. At the end of the section, relying on the best practices, we choose the models to be used in our study.
2.1. Conceptual Scheme of the Proposed Solution
Figure 1 explains the motivation of the study and data flows used to reach the declared objectives.
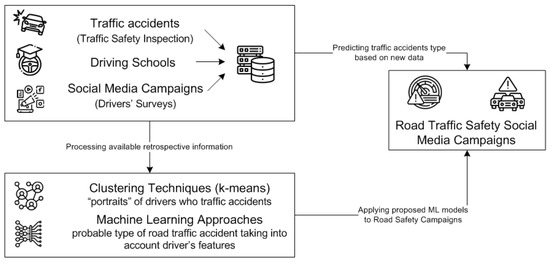
Figure 1.
Conceptual scheme of applying the proposed methods to analyze the structure of traffic accident retrospective data.
The gathering and storing of information on road traffic accidents calls for the explanation and the prediction of new accidents. The goals of this particular case study are as follows: (I) to form typical “portraits” of drivers who cause traffic accidents based on available retrospective data and to use this information in social media campaigns; and (II) to predict the most probable type of traffic accident for drivers as a part of a marketing campaign.
To achieve goal (I) we use a clustering technique (namely k-means clustering) with the explanation of the choice of clusters optimal number taking into account the joint information of different approaches in estimating this number (elbow approach and silhouette coefficients) and agglomerative hierarchical clustering with classical Euclidean distance. Goal (II) is achieved by comparing classical machine learning techniques and choosing the most prominent to predict the type of road traffic accident.
2.2. World Practices of Marketing Campaigns in Road Traffic Safety
Marketing campaigns aimed at confronting traffic violations are important in increasing drivers’ behavioral safety. Most of these campaigns are fear-based [3], which means that their content is aimed at increasing fear in the minds of drivers to protect them from traffic violation. However, such actions should be used carefully to reach a wider audience. The other direction of preventing crashes is using non-fear-based safety campaigns [4], but they are limited in number, and their impact is significant in changing public attitudes towards safety. The efficient campaign has to take into account personal, social, and cultural issues to provide a higher level of quality [5]. Conducting actions should take into account special issues during new driver training depending on their social position, sex, age, or possible combinations of these factors [6]. These features of drivers who violate traffic rules were used in the study not only to classify them into groups but also to estimate the probable type of traffic accident within a social campaign for drivers.
2.3. Clustering Approaches to Segment Drivers Who Cause Road Traffic Accidents
The first problem of this study is to find a structure in data on traffic violations. The obvious approach is to cluster all available statistics and to form typical “portraits” of drivers who violate traffic rules. This approach was applied in the study [7], which stresses that the deviant driving behavior is considered to be the main cause of road traffic accidents in Pakistan. The authors use cluster analysis to divide the driving population into four relatively homogeneous and distinct groups of drivers. The results show the interaction between attitudes, behaviors, and socio-demographic characteristics of drivers. Their findings are used to recommend targeted information-based road safety solutions with a focus on the diverse characteristics of each of the identified segments. Clustering scenarios are also used to determine regions where road crash rates are similar [8,9]. The study [10] proposes comparing approaches to clustering and also uses obtained information to determine factors affecting crashes. Discussing algorithms can also be applied for classification of road segments causing traffic accidents. In this study we have applied the k-means clustering technique to form groups of drivers violating traffic regulations.
There is a direction of studies of special interest [11,12,13,14] introducing geo-based scenarios also with the application of clustering techniques. They mainly aimed at optimal smart-meter placement to create a scalable route map for the least-cost deployment of wireless heterogeneous networks supporting traffic from the advance metering infrastructure. The authors show that upgrading the standard k-means approach can increase its efficiency more than 2.4 times. It should also be noted that the mentioned studies are based on using heterogeneous data from different available sources. Nevertheless, the authors of the current study have also proposed a scheme to take into account available data to control an intelligent transportation system [15]. The proposed case study uses datasets of a special predefined structure obtained from the Traffic Inspectorate and introduces the application of standard approaches to find a structure in the mentioned data.
2.4. Machine Learning Approaches in Exploring Road Traffic Accidents
According to the specified conditions, the probability of road traffic accidents can vary. Many studies propose models to estimate the impact of different factors on the road traffic accident probability. As an example, the study [16] proposes a model to predict the incidence of road traffic crashes caused by weather conditions. It was compared with the number of occurrences in practice, which show similar results. The case study [17] investigates and determines factors affecting vehicle and pedestrian accidents taking place in Iran. A neural network model was chosen in the study as the superior approach in predicting the number and severity of crashes. The obtained results were validated and showed a high predictive performance. These two examples show that within the last decade a wide range of classical and modern models were applied to solve the problem of road traffic safety. The question discussed in this study is to use machine learning techniques to predict the probable road traffic accident type taking into account the personal features of drivers. These estimates can be used during social campaigns to attract the attention of drivers to the strict following of traffic regulations. Another example of effectively applying machine learning approaches in an Internet of Things context is given in the study [18].
Table 1 systematizes the latest related studies on road traffic safety, classifying them on the machine learning models used.

Table 1.
Latest studies on road traffic safety using machine learning models and approaches.
Based on the analysis of the latest applied techniques, we chose the following common approaches to the problem of predictive determination of road traffic accident type:
- Logistic regression,
- Ridge regression,
- Decision trees,
- Random forest,
- CatBoost gradient boosting approach,
- Neural network model.
3. Models Used
This section is organized as follows. In the beginning we describe the clustering approach with its limitations and optimal number of clusters choice. Then, we introduce machine learning models used in the applications of the study. The last part is devoted to dataset description.
3.1. Clustering Techniques. k-Means Approach
The k-means algorithm [25] supposes dividing datasets into homogeneous sub-sets and, being an unsupervised approach, is usually used in data mining and pattern recognition. Aiming at minimizing the cluster performance index, square-error, and error criterion are foundations of this algorithm. The idea of the approach is to seek the optimal division trying to divide instances into k different clusters to satisfy a certain criterion. Normally this criterion is the Euclidean distance as the similarity index and the clustering targets minimize the sum of the squares of the various types. The goal is to minimize
Here, k represents K cluster centers, represents the k-th center, and represents the i-th point in the dataset.
Usually, the central idea of the algorithm consists of the following steps:
- 1.
- Determination of the number k of clusters. It is also necessary to limit the number of possible iterations.
- 2.
- Initialization of cluster central points.
- 3.
- Connection of any observed data to the nearest cluster with Euclidean distance spacing measurements.
- 4.
- Gathering the remaining sample instances to their cluster in accordance with the criterion of minimum distance.
- 5.
- Modification of clusters’ centers if the classification is unreasonable.
The described procedure has an iterative nature and stops when the predefined quality criterion is obtained.
There are some metrics to find an optimal number of k, such as the elbow method and silhouette method. The elbow approach [26], being mostly well-known, supposes calculating the within-cluster-sum of squared errors (WSS) for different values of k, and choosing the k for which WSS becomes first starts to diminish. In the plot of WSS-versus-k, this is visible as an elbow. The silhouette technique [27] supposes calculation of the coefficient using the mean intra-cluster distance (a) and the mean nearest-cluster distance (b) for each sample. The silhouette coefficient for a sample is
The best value is 1 and the worst value is −1. Values near 0 indicate overlapping clusters. Negative values generally indicate that a sample has been assigned to the wrong cluster, as a different cluster is more similar.
It should be mentioned that in a general case, the k-means approach and similar approaches to clustering procedures are unstable in choosing a rational number of clusters. The stability exploration is based on the study [25], where it was proposed to use, among others, the pairwise stability, which is defined as the adjusted Rand index between pairs of clustering results averaged across all pairs.
3.2. Logistic Regression Model (LR)
This model is nonlinear where the deviation or variance of the predictor variable is a function of its mean. The value of the predictor variable depends on the probability that it belongs to a certain class. Structurally, an exponential function is added on top of a simple linear regression model in order to restrain the predictor of response , instead of as it is in the linear model. The LR model could be represented as:
where is the probability that the response or 0; are independent variables; is the constant; are coefficients of regression; and is the error.
3.3. Ridge Regression (RR) Model
This is a well-established method to tackle the multi-collinearity problem [28]. It involves the introduction of some bias into the regression equation to reduce the variance of the estimators of the parameters. The bias is introduced by the use of ridge constant , also known as the shrinkage constant or regularization parameter, which controls the extent to which the ridge estimates differ from the least-squares estimate. The salient feature of ridge regression is that the ridge estimators have smaller mean-squared-error than the ordinary least-squares estimates when the parameter is small enough.
3.4. Decision Trees (DT) and Boosting Paradigm
Tree-based models or ensembles of decision trees are machine learning approaches whereby formal rules are obtained from detected patterns in the datasets; the tree-based models must be trained in a rigorous manner on the data in order to be able to predict the properties presented by a query [29]. Depending on the application features, there are differences in how the tree-based models are constructed: this can be simple DT models, random forest (RF) models [30], or some variations realized in modern software like the CatBoost gradient boosting approach [31].
3.5. Neural Network (NN) Models
Like the tree-ensemble ML models, NNs have to be trained on a dataset to be able to predict the properties of presented features. NN models are a kind of data-processing machine learning techniques that are based on the human brain or neural networks, in which neurons are connected by synapses. This network of neurons takes the available information, analyses it, and then makes judgments or predictions. The processing element, the neuron, may perform filtering operations to ensure that data sent to a certain node does not disrupt the network. The neuron also has the capacity to modify the weights that link the nodes through adaptive learning. Depending on the applied problem, many different types of NN model can be used. In our study we have applied a simple NN model consisting of input, hidden, and output layers, with the interconnections mathematically expressed as
where denotes NN activities; is the weight between two neurons; y is the output signal; x is the activation of the n-th neuron; and is the activation function facilitating input transformation to output by multiplication of the inputs from the processing neuron by corresponding weights (ReLu in the presented study).
3.6. Data Description
To obtain numerical results we used a dataset containing statistics on traffic accidents in the city of Lipetsk between 2014 and 2019. These data describe each of 24,244 traffic accidents without victims with the following information: the type of accident (ranging from 1 to 13), sex of the driver responsible for the accident, her/his social characteristics (officially unemployed, commercial employee, manager, etc.; 47 different possible classes), direct and related violations of traffic rules (these characteristics were grouped within the following classes: maneuvering mistakes, violations of regulations, speed discrepancy with traffic conditions, pedestrian mistakes, other mistakes; in total 26 different violations were compared in these 5 classes), age of the driver, and her/his driving experience. The total number of features used is 7 different personal features describing each road traffic accident.
To apply clustering approaches and machine learning techniques, one-hot encoding was applied to features describing drivers’ social characteristics and types of rule violations.
Figure 2 presents the most common cases in traffic accident statistics: collision of two or more vehicles, hitting a standing vehicle, collision with an obstacle, and another 10 rare types (such as vehicular assault, vehicle rollover, etc.).
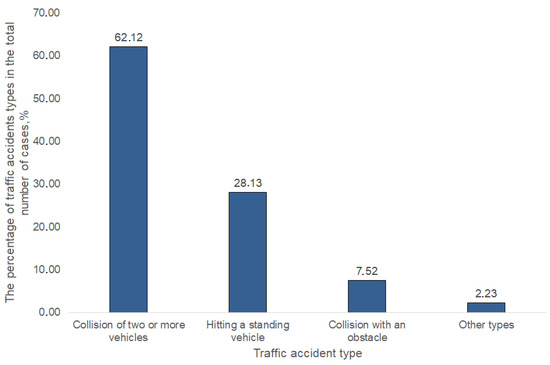
Figure 2.
The distribution of traffic accident types within the dataset. Lipetsk, Russia, from January 2014 to December 2019.
4. Analysis of Results
This section discusses the results of dataset clustering forming typical “portraits” of drivers who caused road traffic accidents and then the results of applying machine learning models to predict the most probable type of accident.
4.1. Clustering of Traffic Accident Dataset
The possibilities of social marketing campaigns on Russian territories were demonstrated during the international project “Road safety in 10 countries (RS 10)” [32]. The presented characteristics allow us to form typical “portraits” of drivers, which are necessary for socio-market research. The data of typical “portraits” allow using methods of focus groups [33]. On the one hand, there is information about a typical representative of the group (driver’s sex, her/his social characteristics, driver’s age, and her/his driving experience). On the other hand, it also describes the cause of the accident (direct and related traffic violations) and consequences (type of accident).
One of the most common practices in choosing the optimal number of clusters is to apply agglomerative techniques. The Ward method was tested with the available dataset (cf. Figure 3, right) and showed that the statistical data can be divided into 7 clusters. This result supports the calculated silhouette coefficients (cf. Table 2) and elbow procedure (cf. Figure 3, left). Besides, results of clustering were analyzed from the point of view of their interpretation. It was found that using 7 clusters allowed us to find homogeneous groups of drivers with similar features from which to form effective social marketing campaigns. Pairwise stability analysis with 1000 clustering starts showed the averaged Rand index of 0.9614, which proves the stability of the obtained results.
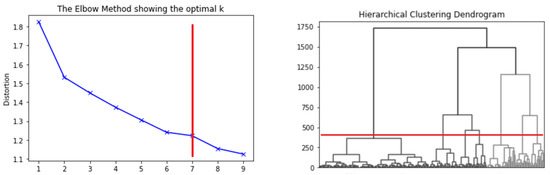
Figure 3.
Results of finding an optimal number of clusters: (left)—Elbow approach, (right)—agglomerative technique.
Table 2.
Silhouette analysis of dataset on road traffic accidents.
Figure 4 presents the distribution of cases within 7 homogeneous clusters. By analyzing clusters it is possible to create a typical “portrait” of a driver using median values of her/his attributes.
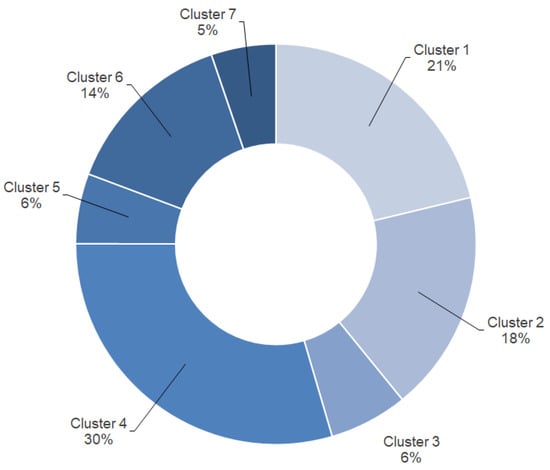
Figure 4.
The distribution of traffic accidents among found clusters, %. Lipetsk, Russia, from January 2014 to December 2019.
Table 3 presents 7 target groups of drivers who caused traffic accidents in the Lipetsk region.
Table 3.
Typical “portraits” of drivers based on the clustering results.
The formed clusters correspond to the groups in the most frequent types of accidents: collision (62.12%), hitting a standing vehicle (28.13%), and hitting an obstacle (7.52%). The most frequent initiators of traffic accidents are men aged from 30 to 40 years with 1 to 13 years of experience. Three groups are formed by employees in the commercial sphere and officially unemployed. One group includes managers and officials, for whom the violation of regulations is frequent.
Groups 6 (14.07%) and 7 (5.22%) are of special interest. Group 6 is represented by women who are not characterized by the most common direct traffic violations (cf. Table 1).
In group 7 the related violations are of special interest: driving under the influence of alcohol or narcotic (toxic) intoxication, driving by a person who is not permitted to drive a vehicle, refusals to pass a medical examination for intoxication, has left the scene of the accident, etc.
When forming target groups, clusters 1 and 3 can be combined to enlarge the target audience. Typical “portraits” in these groups are close: direct violation of traffic rules, sex, driving experience, age group.
4.2. Machine Learning Models to Estimate the Probability of Traffic Accident Type
Based on the available statistical information, the prominent problem is to estimate the most probable type of road traffic accident depending on the drivers’ personal features. For this purpose we applied the machine learning models described above.
With the grid search technique, it was found that the regularization strength parameter is equal to 1 in the RR model. Similarly, we found that the optimal parameter maximal depth of the tree for the DT model is 5 with entropy used as a classification criterion. The RF model used 10 estimators with the maximal depth of the tree also equal to 5. The CatBoost classifier was trained on optimal parameters of maximal depth of the tree equal to 10 and the learning rate equal to 0.04. A simple NN model was used with 9 hidden layers consisting of (40, 35, 30, 40, 30, 25, 15, 10, 6) neurons and the ReLu activation function on hidden layers; the softmax activation function was used in the output layer to estimate the probability of classifying a particular case into one of the available classes.
To estimate the accuracy of models, we applied the cross-validation approach. Table 4 shows accuracy measures to choose the best machine learning model for the prediction.
Table 4.
Accuracy of applied models to estimate the most probable road traffic accident type.
According to the results presented in Table 4, the best classification can be obtained by applying logistic regression and ridge regression models.
Figure 5 presents precision vs. recall ratio (cf. Figure 5, top) and ROC curves (cf. Figure 5, bottom), being common approaches to estimate the quality of classification in multi-class classification problems. By analyzing these graphs, it can be found that the proposed LR model can sustainably predict three of the most common types of road traffic accidents: collision of two or more cars (class 1), hitting a standing vehicle (class 2), and collision with an obstacle (class 3).
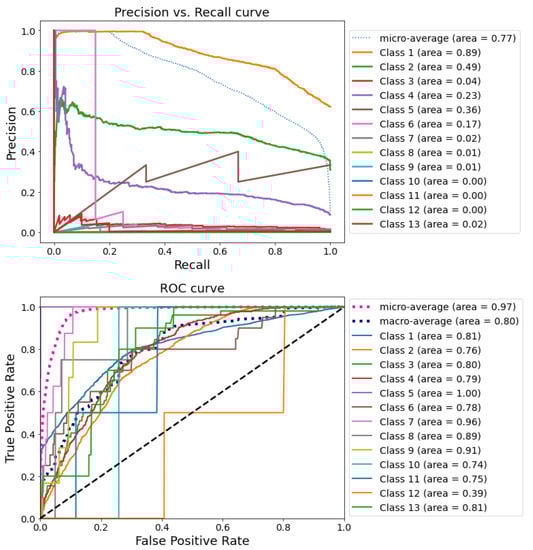
Figure 5.
Precision vs. recall ratio and ROC curves in classifying road traffic accident types. Lipetsk, Russia, from January 2014 to December 2019.
Models of this type can be used in road traffic safety marketing campaigns to estimate the most probable traffic accident for the driver taking into account her/his personal features.
5. Conclusions
The study presented approaches to exploring the structure of traffic accident data; namely, a dataset on road traffic accidents in Lipetsk in 2014–2019 was clustered, and based on the obtained results we formed 7 homogeneous groups of drivers responsible for traffic accidents. Another prospective problem presented was researching the applicability of machine learning techniques to the prediction of the most probable type of traffic accident based on a driver’s personal features.
The main practice contribution is that the described applications of machine learning techniques can significantly increase the effectiveness of social marketing campaigns, taking into account constructed typical “portraits” of the drivers who violated road traffic rules within the target groups found.
However, the obtained results have limitations, among which the main one is their verification only on data gathered in the Lipetsk region (central Russia). Nevertheless, we can say that being a typical Russian region with an effective transportation infrastructure and median geographical and climate position, the Lipetsk region represents an average Russian Federation subject and the results obtained could be extended to other Russian regions. One of the next directions of the study is testing the obtained results on data from other Russian regions.
Further research will be aimed at expanding the capabilities of the described methods. It could be reasonable to widen the dataset by adding information regarding weather conditions and the time of accident to make the estimation of the type more realistic and applicable. It is also recommended for organizations responsible for road safety and educational organizations teaching driving to use the proposed methods during processing statistical information and analyzing the quality of driver training.
Author Contributions
Conceptualization of the problem was performed by V.K. and A.D.; the methodology was proposed by A.S.; software was built by A.M. and V.S.; writing—original draft preparation was performed by A.S.; writing—review and editing was performed by V.K. All authors have read and agreed to the published version of the manuscript.
Funding
This research received no external funding.
Institutional Review Board Statement
Not applicable.
Informed Consent Statement
Not applicable.
Data Availability Statement
The dataset used in the study was gathered by the State Traffic Safety Inspectorate of Lipetsk Region.
Conflicts of Interest
The authors declare no conflict of interest.
References
- World Health Organization. Road Traffic Injuries. Available online: https://www.who.int/health-topics/road-safety (accessed on 10 February 2022).
- Klyavin, V.; Sysoev, A.; Dvurechenskaya, A.; Mamedov, A. Approaches to Traffic Accidents Clustering to Form Effective Marketing Campaign. In Proceedings of the 2021 3rd International Conference on Control Systems, Mathematical Modeling, Automation and Energy Efficiency (SUMMA), Lipetsk, Russia, 10–12 November 2021. [Google Scholar]
- Wundersitz, L.; Hutchinson, T. Road safety advertising and social marketing. J. Australas. Coll. Road Saf. 2011, 22, 34–40. [Google Scholar]
- Das, S.; Dutta, A.; Mudgal, A.; Datta, S. Non-fear-based road safety campaign as a community service: Contexts from social media. In Proceedings of the International Conference on Innovations for Community Services, Bhubaneswar, India, 12–14 January 2020. [Google Scholar]
- Lewis, I.; Forward, S.; Elliott, B.; Kaye, S.A.; Fleiter, J.J.; Watson, B. Designing and evaluating road safety advertising campaigns. In Traffic Safety Culture; Emerald Publishing Limited: Bingley, UK, 2019. [Google Scholar]
- Nwadinigwe, I.P.; Osarenren, N.A.; Otuagoma, F.A. Impact of road safety education on commercial drivers’ knowledge and behaviour towards road traffic codes and safety driving in Delta State. Int. J. Educ. Res. 2018, 5, 110–120. [Google Scholar]
- Batool, Z.; Carsten, O. Attitudinal segmentaion of drivers in Pakistan: The potential for effective road safety campaigns. Accid. Anal. Prev. 2018, 114, 48–54. [Google Scholar] [CrossRef] [PubMed]
- Maruyama, Y.; Kuniyuki, H.; Suganuma, H.; Suzawa, T.; Hara, M.; Yoshimura, Y. Analysis on Characteristics of Traffic Accidents in Nagano (Second Report)—Cluster Analysis. Int. J. Automot. Eng. 2019, 10, 219–225. [Google Scholar] [CrossRef]
- Islam, M.R.; Jenny, I.J.; Nayon, M.; Islam, M.R.; Amiruzzaman, M.; Abdullah-Al-Wadud, M. Clustering algorithms to analyze the road traffic crashes. In Proceedings of the 2021 International Conference on Science & Contemporary Technologies (ICSCT), Dhaka, Bangladesh, 5–7 August 2021. [Google Scholar]
- Nafie Ali, F.M.; Mohamed Hamed, A.A. Usage Apriori and clustering algorithms in WEKA tools to mining dataset of traffic accidents. J. Inf. Telecommun. 2018, 2, 231–245. [Google Scholar] [CrossRef] [Green Version]
- Inga, E.; Cespedes, S.; Hincapie, R.; Cardenas, C.A. Scalable route map for advanced metering infrastructure based on optimal routing of wireless heterogeneous networks. IEEE Wirel. Commun. 2017, 24, 26–33. [Google Scholar] [CrossRef]
- Wang, G.; Zhao, Y.; Huang, J.; Duan, Q.; Li, J. A K-means-based network partition algorithm for controller placement in software defined network. In Proceedings of the 2016 IEEE International Conference on Communications (ICC), Kuala Lumpur, Malaysia, 22–27 May 2016. [Google Scholar]
- Inga, E.; Hincapie, R.; Cespedes, S. Capacitated multicommodity flow problem for heterogeneous smart electricity metering communications using column generation. Energies 2019, 13, 97. [Google Scholar] [CrossRef] [Green Version]
- Wang, G.; Zhao, Y.; Ying, Y.; Huang, J.; Winter, R.M. Data aggregation point placement problem in neighborhood area networks of smart grid. Mob. Netw. Appl. 2018, 23, 696–708. [Google Scholar] [CrossRef]
- Sysoev, A.; Khabibullina, E.; Kadasev, D.; Voronin, N. Heterogeneous data aggregation schemes to determine traffic flow parameters in regional intelligent transportation systems. Transp. Res. Procedia 2020, 45, 507–513. [Google Scholar] [CrossRef]
- Chung, Y.S.; Park, K.R.; Kim, D.H.; Kim, J.M. Study on Predictive Modeling of Traffic Accident incidence of Traffic Accident Statistics and Weather Conditions. Life Sci. J. 2013, 11, 1–6. [Google Scholar]
- Ghasedi, M.; Sarfjoo, M.; Bargegol, I. Prediction and analysis of the severity and number of suburban accidents using logit model, factor analysis and machine learning: A case study in a developing country. SN Appl. Sci. 2021, 3, 13. [Google Scholar] [CrossRef]
- Tran, M.Q.; Elsisi, M.; Mahmoud, K.; Liu, M.K.; Lehtonen, M.; Darwish, M.M. Experimental setup for online fault diagnosis of induction machines via promising IoT and machine learning: Towards industry 4.0 empowerment. IEEE Access 2021, 9, 115429–115441. [Google Scholar] [CrossRef]
- Yassin, S.S. Road accident prediction and model interpretation using a hybrid K-means and random forest algorithm approach. SN Appl. Sci. 2020, 2, 1576. [Google Scholar] [CrossRef]
- Najafi Moghaddam Gilani, V.; Hosseinian, S.M.; Ghasedi, M.; Nikookar, M. Data-driven urban traffic accident analysis and prediction using logit and machine learning-based pattern recognition models. Math. Probl. Eng. 2021, 2021, 9974219. [Google Scholar] [CrossRef]
- Sangare, M.; Gupta, S.; Bouzefrane, S.; Banerjee, S.; Muhlethaler, P. Exploring the forecasting approach for road accidents: Analytical measures with hybrid machine learning. Expert Syst. Appl. 2021, 167, 113855. [Google Scholar] [CrossRef]
- Theofilatos, A.; Chen, C.; Antoniou, C. Comparing machine learning and deep learning methods for real-time crash prediction. Transp. Res. Rec. 2019, 2673, 169–178. [Google Scholar] [CrossRef]
- Santos, D.; Saias, J.; Quaresma, P.; Nogueira, V.B. Machine learning approaches to traffic accident analysis and hotspot prediction. Computers 2021, 10, 157. [Google Scholar] [CrossRef]
- Bokaba, T.; Doorsamy, W.; Paul, B.S. Comparative study of machine learning classifiers for modelling road traffic accidents. Appl. Sci. 2022, 12, 828. [Google Scholar] [CrossRef]
- Sinaga, K.P.; Yang, M.S. Unsupervised K-means clustering algorithm. IEEE Access 2020, 8, 80716–80727. [Google Scholar] [CrossRef]
- Syakur, M.A.; Khotimah, B.K.; Rochman, E.M.S.; Satoto, B.D. Integration k-means clustering method and elbow method for identification of the best customer profile cluster. IOP Conf. Ser. Mater. Sci. Eng. 2018, 336, 012017. [Google Scholar] [CrossRef] [Green Version]
- Rousseeuw, P.J. Silhouettes: A graphical aid to the interpretation and validation of cluster analysis. J. Comput. Appl. Math. 1987, 20, 53–65. [Google Scholar] [CrossRef] [Green Version]
- Hoerl, A.E.; Kennard, R.W. Ridge regression: Biased estimation for nonorthogonal problems. Technometrics 1970, 12, 55–67. [Google Scholar] [CrossRef]
- DeRousseau, M.A.; Kasprzyk, J.R.; Srubar, W.V., III. Computational design optimization of concrete mixtures: A review. Cem. Concr. Res. 2018, 109, 42–53. [Google Scholar] [CrossRef]
- Kang, M.C.; Yoo, D.Y.; Gupta, R. Machine learning-based prediction for compressive and flexural strengths of steel fiber-reinforced concrete. Constr. Build. Mater. 2021, 266, 121117. [Google Scholar] [CrossRef]
- Prokhorenkova, L.; Gusev, G.; Vorobev, A.; Dorogush, A.V.; Gulin, A. CatBoost: Unbiased boosting with categorical features. In Advances in Neural Information Processing Systems; Curran Associates Inc.: Red Hook, NY, USA, 2018; Volume 31. [Google Scholar]
- Yurasova, E.; Sethi, D.; Peden, M.; Klyavin, V. Practical Steps in Enhancing Road Safety Lessons from the Road Safety in 10 Countries Project (RS 10) 2010–2014 in the Russian Federation; WHO Regional Office for Europe: Copenhagen, Denmark, 2015; Volume 64.
- Browell, S. Moderating focus groups: A practical guide for group facilitation. Manag. Learn. 2000, 31, 540. [Google Scholar] [CrossRef]
Publisher’s Note: MDPI stays neutral with regard to jurisdictional claims in published maps and institutional affiliations. |
© 2022 by the authors. Licensee MDPI, Basel, Switzerland. This article is an open access article distributed under the terms and conditions of the Creative Commons Attribution (CC BY) license (https://creativecommons.org/licenses/by/4.0/).