Abstract
Early prediction of mortality and risk of deterioration in COVID-19 patients can reduce mortality and increase the opportunity for better and more timely treatment. In the current study, the DL model and explainable artificial intelligence (EAI) were combined to identify the impact of certain attributes on the prediction of mortality and ventilatory support in COVID-19 patients. Nevertheless, the DL model does not suffer from the curse of dimensionality, but in order to identify significant attributes, the EAI feature importance method was used. The DL model produced significant results; however, it lacks interpretability. The study was performed using COVID-19-hospitalized patients in King Abdulaziz Medical City, Riyadh. The dataset contains the patients’ demographic information, laboratory investigations, and chest X-ray (CXR) findings. The dataset used suffers from an imbalance; therefore, balanced accuracy, sensitivity, specificity, Youden index, and AUC measures were used to investigate the effectiveness of the proposed model. Furthermore, the experiments were conducted using original and SMOTE (over and under sampled) datasets. The proposed model outperforms the baseline study, with a balanced accuracy of 0.98 and an AUC of 0.998 for predicting mortality using the full-feature set. Meanwhile, for predicting ventilator support a highest balanced accuracy of 0.979 and an AUC of 0.981 was achieved. The proposed explainable prediction model will assist doctors in the early prediction of COVID-19 patients that are at risk of mortality or ventilatory support and improve the management of hospital resources.
1. Introduction
Severe acute respiratory syndrome coronavirus 2 (SARS-COV-2) also known as COVID-19, was first diagnosed in China in late 2019. Since then, it has infected around 222 countries worldwide and as of 7 January 2022, the total number of cases is approximately 301,121,144, including 92,107 patients in critical condition [1]. COVID-19 patients can be symptomatic or asymptomatic. Symptomatic patients’ stages can be mild, moderate, or severe. Severe cases may lead to failure of the respiratory system or mortality at the same time. Although the probability of severe cases in patients is not high, sometimes a moderate-stage patient may quickly experience serious complications and need immediate hospitalization and intensive care. Because of this uncertainty, hospitals are sometimes confronted with a huge number of COVID-19-critical patients requiring ventilator support. Similarly, due to the unpredictable nature of COVID-19 [2], it is very crucial to develop an early warning system to predict which patients will deteriorate.
Several artificial intelligence (AI)-based systems have been developed for early diagnosis using clinical data, chest X-rays (CXR) [3], CT scans [4], hybrid data [5], mortality predictions, ventilatory support identification, contact tracing, drug discovery, perceptions of people based on social media data analysis, etc. Studies have proven the significance of AI techniques for combating the COVID-19 pandemic [6,7]. Therefore, early identification of patients who need ventilator support is very crucial for treating patients in a timely manner, as well as for hospitals to manage their resources effectively. Furthermore, it will also assist hospital systems to prioritize their patients. Several studies have been conducted for the early identification of hospitalized patients who are vulnerable to deterioration and require ventilator support, using machine learning (ML) and deep learning (DL).
However, the integration of ML and DL techniques has led to remarkable outcomes in healthcare. These techniques have enhanced the decision-making process, but due to the complexity of the models they engender a lack of interpretability. ML and DL techniques are opaque and represent a form of black-box technique, and fail to provide justification for their respective predictions or decisions [8]. Intrinsically there is a trade-off between predictive power and interpretability; for example, DL models have high prediction accuracy, but the complexity of the model increases the model’s opacity. Similarly, ML algorithms such as the decision tree (DT) have good interpretability but sometimes produce low prediction results compared to DL models [9]. The innate opaqueness of the model has raised the need for transparent and interpretable systems that can assist healthcare professionals in making decisions.
Nevertheless, ML and DL have high predictive power but lack interpretability [10]. To deal with the challenges of ML and DL, recent trends have evolved towards explainable artificial intelligence (EAI) techniques. Although EAI is not a new field, it only integrates interpretability and transparency into the ML and DL models [11]. EAI systems lead to better, more trustworthy, and more interpretable decisions.
Recently, research trends have moved towards EAI [12]. Accordingly, from a healthcare perspective, EAI needs to consider different data modalities to achieve the required result [13]. This necessitates that healthcare professionals should be able to understand the rationale behind the how and why of a particular decision. Therefore, in the current study, EAI techniques are used to predict mortality and identify those COVID-19 patients whose condition is rapidly deteriorating and who may require ventilator support.
Contribution
The objective of the study is twofold, i.e., to predict mortality and ventilatory support. The main contributions of the study are:
- An attempt to propose a model with better predictive power and interpretability compared to the benchmark study, which can help healthcare professionals to make better and more retraceable decisions.
- The proposal of an evidence-based and interpretable decision-making system using EAI techniques for the early prediction of mortality and susceptibility to ventilator support.
- Identification of highly significant risk factors for the early prediction of ventilatory support and mortality.
- To the best of the author’s knowledge, very few studies have investigated EAI for the early identification of the COVID-19 patients who are at risk for mortality and deterioration.
- Overall, the proposed model outperformed the baseline study.
2. Related Studies
Due to the integration of technology in the healthcare and electronic health records, a huge number of studies have been conducted to combat COVID-19 from different perspectives such as diagnosis, triage, prognosis, epidemiology, contact tracing, drug efficacy, genome structure analysis, etc. [14]. Furthermore, different types of data such as chest X-rays, CT scans, and clinical data have been extensively used for the diagnosis of COVID-19 patients, early prediction of mortality, identification of patients requiring ventilator support, and remote triaging of COVID-19 patients. The following section discusses some of the recent studies on early mortality prediction and ventilator support.
2.1. AI-Based Studies for Early Identification of COVID-19 Patients for Ventilator Support
Early prediction of COVID-19 patients who are at risk of deterioration can reduce the risk of mortality and help hospitals to manage their resources. Varzaneh et al. [15] proposed an AI-based model for early prediction of intubation in COVID-19-hospitalized patients, using several ML algorithms such as the decision tree (DT), support-vector machine (SVM), k-nearest neighbor (KNN), and multilayer perceptron (MLP) for the classification. However, the feature selection was performed using a bioinspired technique, i.e., the horse herd optimization algorithm (HOA). The study achieved an accuracy of 0.938 by integrating DT and HOA. However, the dataset contains only 13% of patient samples for the intubation class. Furthermore, the study has identified that in the current dataset some significant paraclinical attributes are missing.
However, Zhang et al. [16] proposed a DL-based model to identify the at-risk COVID-19-hospitalized patients for the mechanical ventilator (MV) after 24 h. The significance of the study is that all relevant patient data such as laboratory results, medications, demographic information, signs and symptoms, and all clinical procedures were used. For the data imputation, the attention method was used. Furthermore, a comparison was made among the ML and DL models, and it was found that the proposed DBNet outperformed with an AUC (area under the curve) of 0.80 and an F1 score of 0.798. However, the study produced a good outcome and utilized patient samples from multiple hospitals, but conversely, needed huge attributes.
Similarly, Aljouie et al. [17] utilized different ML techniques to predict mortality and identify ventilator requirement for COVID-19-hospitalized patients. The study used patients’ clinical data, laboratory results, comorbidity, and CXR findings. Feature selection was performed with ReliefF, while extreme gradient boosting (XGB), random forest (RF), SVM and logistic regression (LR) were used for classification. Similar to the other studies, the dataset suffers from a class imbalance; therefore, several data-augmentation techniques were applied. The study found that CXR data are more significant in predicting ventilatory support as compared to comorbidity, lab results, and other demographic features. A highest AUC of 0.87 and a balanced accuracy of 0.81 were achieved using the features selected from ReliefF, classification with SVM, and data augmentation with random undersampling. Similar to Aljouie, Bae et al. [18] also performed a study that predicted ventilator support and mortality of COVID-19-hospitalized patients using CXR and radiomic features. However, the study only utilized radiomic data. Furthermore, the number of patient samples in the study was few compared to Aljouie et al.’s study. Latent discriminant analysis (LDA), RF, quadrant discriminant analysis (QDA), and the DL model were used for the classification. They found that the DL model with radiomic features produced an AUC of 0.79, a sensitivity of 0.71 and a specificity of 0.71, respectively. The study was multicenter, but the number of samples was lower.
Furthermore, Balbi et al. [19] used LR for identifying patients that required ventilator support using CXR, demographic, clinical, and laboratory data. The objective was to identify the significance of the features and found that along with CXR, patients’ medical history and other vitals have significantly enhanced the prediction. Conversely, another study [20] utilized CXR for predicting MV support using the DenseNet121 model. The significance of the study is that the patients that require MV were identified 3 days before the event. The model achieved an accuracy of 0.90, and a sensitivity and specificity of 0.86 and 0.84, respectively. The study was only limited to CXR for the prediction. Integration of other clinical data at admission might improve the performance of the model.
2.2. AI-Based Studies to Predict Early Mortality in COVID-19 Patients
Similar to the proposed study, Aljouie et al. [17] and Bae et al. [18], proposed a model for two tasks, i.e., mortality and ventilator support prediction for COVID-19-hospitalized patients. In the first study, the author utilized different categories of data and found that comorbidity alone can help in predicting the mortality of COVID-19 patients. However, in the second study, CXR and radiomic data were used and found that the integration of radiomic data improved the early prediction of mortality. Aljouie et al. [15] achieved an AUC of 0.83 and a balanced accuracy of 0.80 using RF. Meanwhile, in Bae et al.’s study [18], the DL model achieved an AUC of 0.83, sensitivity of 0.79, and specificity of 0.74. As previously discussed, the number of patient samples in Aljouie et al. was larger than that of the Bae et al. study; furthermore, the study also utilized different types of patient data such as clinical, comorbidity, demographic, and CXR.
Pourhomayoun and Shakibi [21] developed different ML models such as SVM, ANN, DT, RF, KNN, and LR for the prediction of mortality in COVID-19 patients. The study utilized a dataset from demographically different countries and a huge number of samples as compared to the previous studies mentioned in the literature review. However, the dataset contained huge number of missing values. They achieved an accuracy of 0.89 using ANN. In addition, Khan et al. [22] made a comparison between the ML and DL algorithms to predict mortality in COVID-19 patients using the dataset proposed in Pourhomayoun and Shakibi [21]. They found the significance of the DL method in the early prediction of mortality as compared to the ML algorithms. The DL model achieved enhanced results, with an accuracy of 0.97, a sensitivity of 0.97, and a specificity of 1. Furthermore, the number of features used to train the model was also reduced in the study [22].
Moreover, a study was performed to predict mortality among COVID-19 patients who are in severe condition [23]. The study aimed to identify the risk factors based on different categories of patient data such as clinical, demographic, comorbidity, laboratory tests, radiological data, etc. The study was performed using a small sample size of 150 patients in Romania. The LR model was used for the classification. The study found that D-dimmer, C-reactive protein (CRP), and high heartbeat are the most significant mortality predictors for COVID-19 patients. Furthermore, a correlation was found between these features and patients that needed ICU addition and ventilation. The study identified the limitation that some of the patients in the dataset were in severe condition due to late hospitalization.
Similarly, Pezoulas et al. [24] utilized the EAI concept to identify patients at risk of ICU and mortality among COVID-19 patients, using several ML models such as the gradient boosting (GB) algorithm for classification. Experiments were conducted using 214 patients and used clinical, demographic, comorbidity, and lab results. They achieved an accuracy of 0.79 and 0.81 in predicting mortality among COVID-19 patients in ICU.
Recently, a study was made by Moulaei et al. [25] to compare the performance of different ML techniques to predict mortality using data at the time of admission to hospital. The dataset contained the patients’ clinical, demographic, and laboratory results. A total of 54 features were initially selected from the dataset. Using the genetic algorithm (GA), 38 features were selected. Several ML models such as XGB, RF, MLP, KNN, NB, reinforcement learning, and J48 were used for classification. They were found to outperform, with an accuracy of 0.95, sensitivity of 0.90, and specificity of 0.95. Nevertheless, the study has achieved significant results and used a dataset with a sample of 1500 patients. However, the dataset suffers from a huge imbalance due to the fact that the mortality probability in COVID-19 patients is not high. Furthermore, the dataset was collected from one center.
Nevertheless, most of the previously mentioned studies have successfully utilized ML and DL for the early identification of mortality and ventilation support in COVID-19 patients. However, some of the studies have utilized a very limited dataset size. The largest open-source dataset that can be utilized for the prediction of mortality and ventilation support was proposed by Aljouie et al. [17]. Another benefit is that it does not only contain radiological data but also contains patients’ clinical, demographic, and laboratory results and comorbidities. Therefore, in the current study, we utilize the data introduced in Aljouie et al.’s study. Most of the previous studies utilized ML and DL learning; however, in the current study we will use the concept of EAI to identify the risk factors that contribute to the identification of COVID-19 patients at risk of mortality and ventilator support. To the best of the authors’ knowledge, there is so far only one study (Pezoulas et al. [24]) that has implemented EAI for the prediction of mortality. In the proposed study, we will aim to produce a model with a better outcome compared with the baseline study. Furthermore, we will also attempt to produce the outcome in a more interpretable format using EAI.
3. Materials and Methods
The study was performed using Python ver. 3.9.7. The libraries used during the implementation were Tensor Flow Keras ver. 2.5.2, Dalex ver. 1.4.1, Matplotlib ver. 3.4.3, Sklearn ver. 0.24.2, Pandas ver. 1.3.4 and NumPy ver. 1.19.5. Several sets of experiments were conducted to determine the significance of different categories of attributes in the early prediction of mortality and identification of at-risk patients who require ventilator support. The study mainly consisted of two objectives: to predict the patients who will need ventilatory support and to predict the mortality of the patients. Therefore, we carried out experiments with three cases defined in Table 1. The first case predicted mortality, while cases 2 and 3 predicted ventilator support for COVID-19-hospitalized patients. For each case, three sets of experiments were performed using the full-feature set, with selected features using the EAI feature importance method for all three cases. Meanwhile, the third experiment for case 1 was performed using only the comorbidity feature and for cases 2 and 3 only CXR features were used. These features were used to further investigate the findings made by Aljouie et al. [17]. They found that mortality in COVID-19 patients could be predicted using the comorbidity feature, while CXR functions could be used to predict ventilatory support.

Table 1.
Distribution of patient samples per category for cases 1, 2, and 3.
3.1. Exploratory Dataset Analysis
The study was conducted using retrospective data from COVID-19-hospitalized patients in the Kingdom of Saudi Arabia (KSA). The dataset was introduced and used in the study by Aljouie et al. [17]. The dataset consists of 5739 patient demographics, clinical and laboratory investigations, and CXR findings. Moreover, the dataset includes two target attributes, namely patient outcome (deceased or alive) and ventilatory support. The inclusion criteria for the patient sample included in the current study correspond to those of Aljouie et al. to find the mortality and ventilatory support dataset. Table 1 shows the number of samples per category for case 1 (target class vital status (deceased, alive)), case 2 (ventilatory support status (mechanical ventilator (MV), noninvasive ventilation (NIV) and no ventilator support (NVS)) and case 3 (ventilation support status (ventilation support (VS) and no ventilation support (NVS)). Five values were missing in the ventilator support status attribute, so they were removed in cases 2 and 3.
The dataset contains demographic features (gender, age), laboratory results from complete blood count CBC (hematocrit, hemoglobin, mean corpuscular hemoglobin concentration (MCHC), mean corpuscular hemoglobin (MCH), mean corpuscular volume (MCV), mean platelet volume (MPV), red blood cells (RBC), Platelet count, red cell distribution width (RDW), white blood cells (WBC), and radiological findings and comorbidity (cancer, coronary artery disease (CAD), hypertension (HTN), asthma, chronic obstructive pulmonary disease (COPD), type II diabetes mellitus (T2D), liver cirrhosis (LC), chronic hepatitis B (CHB), chronic hepatitis C (HCV) and chronic kidney disease (CKD)). Age and all CBC attributes are numeric, while the remaining attributes are categorical. The CXRs are annotated in twelve zones, as shown in Figure 1. Initially the CXR is divided in two upper (A) and lower zone (B) and also the junction (C). Then these zones are further divided into twelve zones which indicate the points where the radiologist assign severity levels. The zone attributes consist of three possible values (0–2) indicating the severity of ground glass opacity (GGO). Zero indicates the absence of GGO. Ultimately, the dataset contains 35 predictors and 2 class attributes.
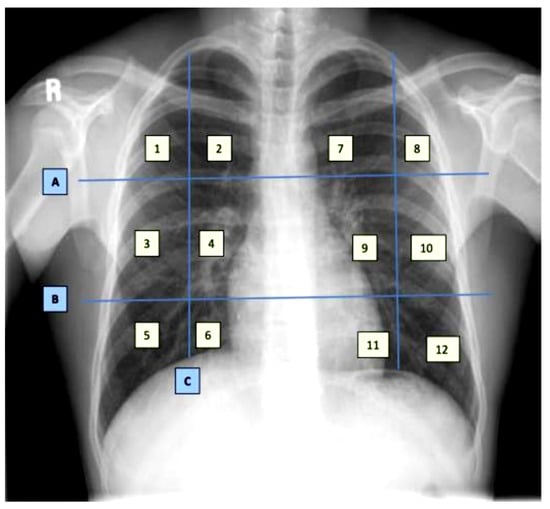
Figure 1.
Chest X-ray zone segmentation and annotation [17].
Furthermore, for the exploratory analysis of the dataset, the age attribute was discretized by applying equal-width binning. The minimum patient age in the dataset was 19 and the maximum age was 107. A bin length of 10 was used, with the first bin range being [19–29), [29–39) and so on. The number of bins was 9. Figure 2 and Figure 3 represent the age distribution of the patients according to their ventilation status and vital status. As seen in Figure 2, the huge number of patients that need MV support were in the range of 50–59. However, for most of the age ranges, the number of patients for the other two categories, i.e., noninvasive ventilator (NV) and no ventilator (NO) was similar. Correspondingly, for the mortality prediction, the maximum number of survived patients was in the range of [49–59). However, the number of deceased patients was high, in the range of [69–79), as shown in Figure 3. The mean age of the patients in the dataset was 54.83. Similarly, Figure 4 indicates the distribution of comorbidity in patients according to their ventilator support status, while Figure 5 indicates the distribution of comorbidity according to the patient’s outcome, i.e., deceased or alive. The dataset contains the sample of the hospitalized COVID-19 patients, and it can be seen from Figure 4 and Figure 5 that the most common chronic diseases are hypertension and Type II diabetes. The dataset contains a huge number of male samples as compared to female samples. Furthermore, Figure 6 represents the correlation of CBC attributes.
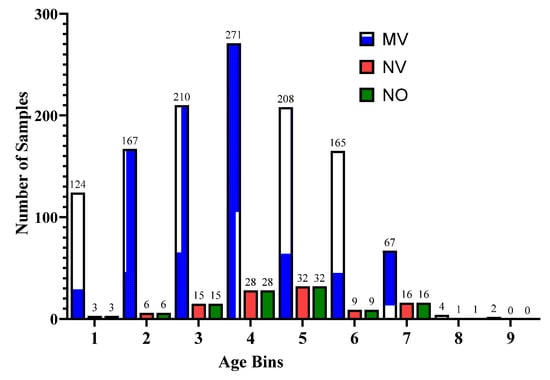
Figure 2.
Distribution of patient age range according to ventilator support cases.
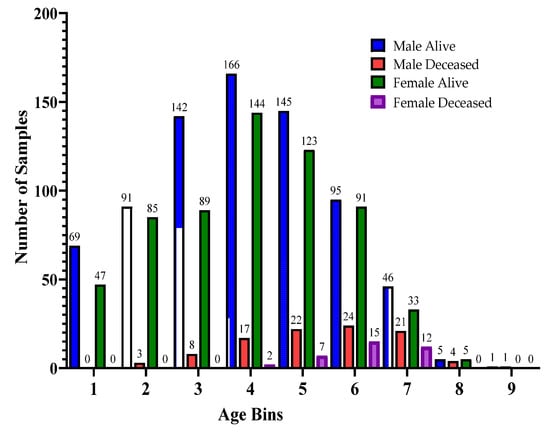
Figure 3.
Distribution of patient age range according to patients’ vital status.
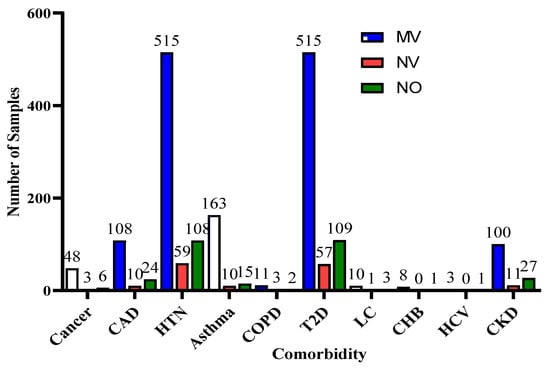
Figure 4.
Distribution of comorbidity according to ventilator support cases.
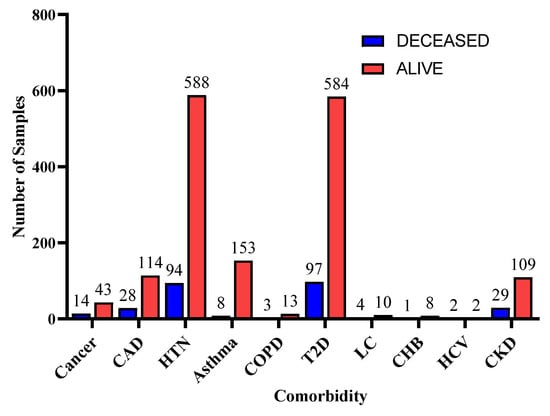
Figure 5.
Distribution of comorbidity according to patients’ vital status.
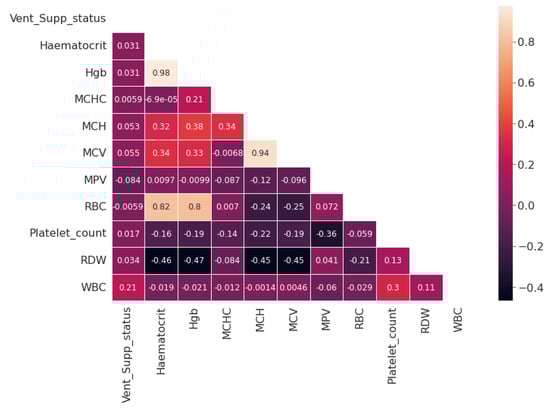
Figure 6.
Correlation map for the Complete Blood Count attribute.
3.2. Deep Learning Model
In the last decades, DL models have been extensively used and investigated for various prediction tasks. Instead of using handcrafted features and then applying the traditional ML technique, DL models are better able to understand and learn complex patterns from the data. These models are feedforward and contain three main layers, i.e., the input layer, hidden layers, and the output layer. The input layer is used to obtain data from the source and provide it to the model for further processing, the hidden layers are mainly used to collect the complex pattern from the data, and the output layer is used to classify the data. The backpropagation technique is used to update the weights of the model using a gradient descent algorithm.
Gradient descent is a first-order derivative function used for optimization in DL. The function measures the effect of parameter values on model performance. The gradient descent equation is shown below:
where y represents the current outcome, x represents the true values, and f(x) represents the predicted outcomes. The negative sign indicates the reduction in GD, and represents the gradient factor, also known as the learning rate. The GD function aims to reduce the cost function, i.e., f(w, y) and achieve the local minima. It is an iterative function and is represented as
Based on the aim of the study, we performed three set of experiments. In the proposed study, three deep learning models were developed with slight variations in the input and output layers, based on the number of features for the input and the number of class labels. We used three sets of data as input to the models (full features, selected features, and comorbidity features). The full-feature set size was 34, the input layer was defined with 34 neurons, and the selected-feature set size was 9, so the input layer was designed with 9 neurons, and the comorbidity-feature set size was 10, so the input layer contained 10 neurons. In addition to this output class, we have 2 output requirements, binary and multiclass i.e., 3 classes. Therefore, the structure of the output layer was modified accordingly: for binary classification, we used 1 neuron in the output layer, while for 3 classes, we used 3 neurons in the output layer.
The structure of the model includes 13 layers. The 12 layers were hidden layers with 1024, 1024, 512, 512, 256, 256, 128, 128, 64, 64, 32, and 32 neurons. Rectified linear unit (ReLU) was used as the activation function for the hidden layers, while dropout layers with a rate of 20% were added after two consecutive hidden layers in order to avoid model overfitting. Sigmoid and softmax activation functions were used at the output layer to perform binary and multiclass classification, respectively.
The equation for the ReLU is
ReLU activation function is used to deal with negative values. If the input is negative, the output is zero, and thus the neuron does not participate in model processing for that particular epoch. This makes the neural network sparser and more efficient. Meanwhile, the sigmoid equation is mentioned below:
The sigmoid function provides the model with a value that is between 0 and 1. This is useful because we can use the resulting value as a probability for a particular class.
where is the input vector for the softmax function, is elements of the input vectors, is the standard exponential function applied to each element, and K represents the number of classes. The softmax function turns a vector of K into values between 0 and 1. These values are considered as probabilities.
The DL model was optimized using the Adam optimizer [26]. Model configurations include the Adam optimization algorithm with a learning rate of 0.001. Moreover, the loss was calculated using binary and categorical cross entropy, and the accuracy metric was used to evaluate the model’s accuracy. To train the model, we used 200 epochs with a batch size of 128. The structure of the model is shown in Figure 7.
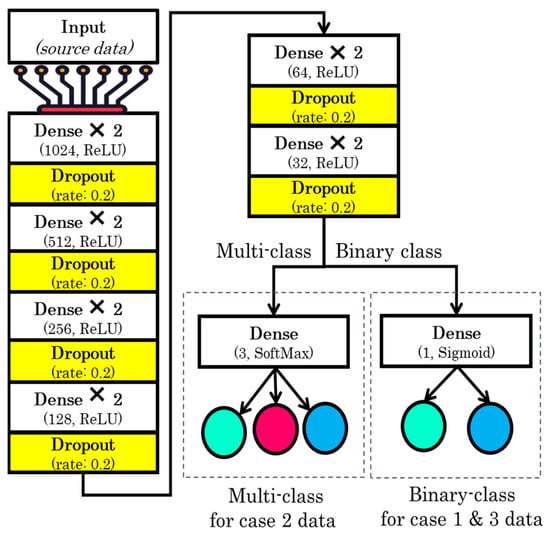
Figure 7.
Structure of the proposed model.
3.3. Explainability of the Proposed Model
An Agnostic modeling approach was used to incorporate the interpretability of the proposed model without compromising the model’s performance. This method is not model-specific; it interprets the model’s behavior without considering the internal logic of the model [27]. In the current study, Shapley was used to find the average impact of the attributes on model performance. Figure 8 shows the mean (SHAP) value for mortality prediction; Figure 9 shows the mean (SHAP) value for predicting patients requiring ventilatory support (case 2 multi-class); Figure 10 indicates the mean (SHAP) value for predicting patients who require ventilator support (case 3 binary class).
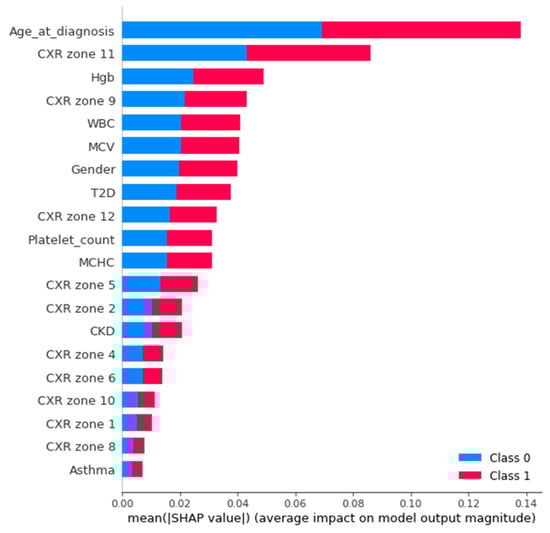
Figure 8.
Mean (SHAP value) for the prediction of mortality (Case 1).
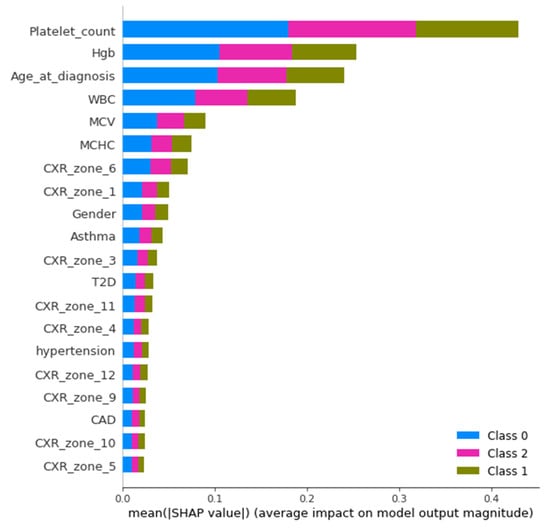
Figure 9.
Mean (SHAP value) for the prediction of ventilatory support patients (Case 2).
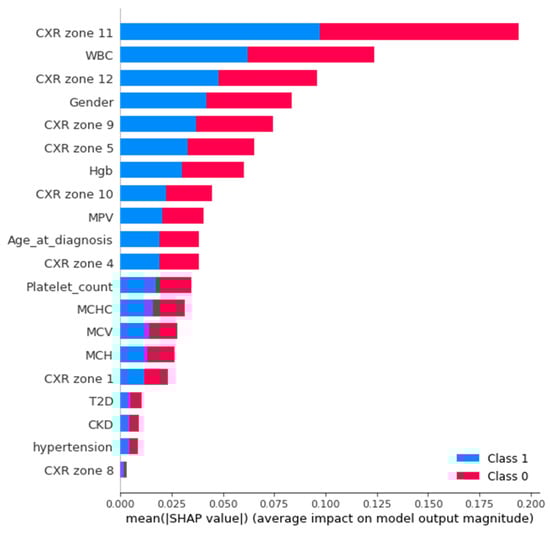
Figure 10.
Mean (SHAP value) for the prediction of ventilatory support patients (Case 3).
Furthermore, the interpretability was further enhanced by using the induced decision tree for case 1, case 2, and case 3. Figure 11, Figure 12 and Figure 13 present the decision tree for all three cases. Experiments were also conducted for all the three cases using DT and is included in Table A1, Table A2 and Table A3 in Appendix A. The performance of DT is investigated because it is an interpretable model. But sometimes due to the tradeoff among the interpretability and model performance, as seen in the appendix the result of DT is not significant.
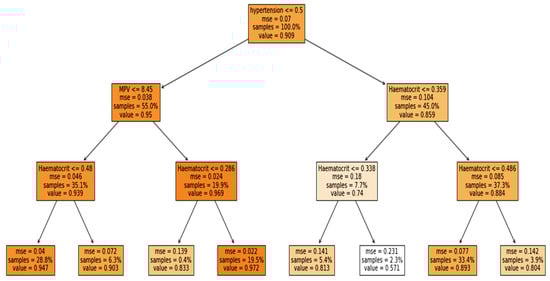
Figure 11.
Case 1: Mortality rate with binary classification.
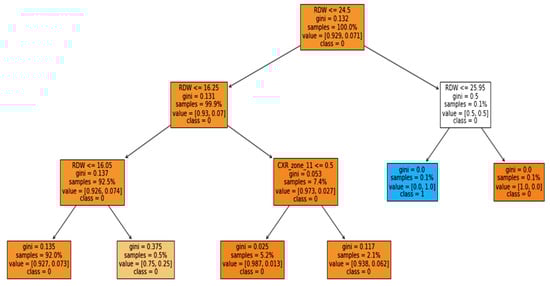
Figure 12.
Case 2: Ventilator with multiclassification.
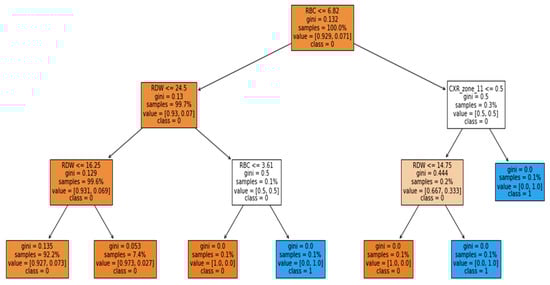
Figure 13.
Case 3: Ventilator with binary classification.
3.4. Evaluation Measures
The performance of the proposed model was compared using balanced accuracy, sensitivity, specificity, Youden index, and area under the curve (AUC). There are several evaluation measures that can be used for investigating the performance of the classification algorithms. Among these measures, some of the measures are highly influenced by class distribution, such as accuracy, precision, and recall [28]. Therefore, the unbalanced class problem uses measures such as balanced accuracy, AUC, and Youden index. Correspondingly, balanced accuracy and AUC are also used in the baseline study.
Sensitivity (SN) represents the true positive rate of the model and is calculated using the following equation:
Specificity represents the true negative rate and is calculated using the equation below:
As can be seen from Equations (6) and (7), the above measures are not affected by class distribution.
Similarly, balanced accuracy is the mean of the sensitivity and the specificity:
Likewise, the Youden index (YI) is one of the measures used specifically to determine the effectiveness of the diagnostic test. It evaluates the discriminative power of the diagnostic test. It is computed using the equation below:
The YI values range from 0–1. A smaller value indicates poor diagnostic capability, while a value closer to 1 indicates the significance of the test.
Furthermore, the model discriminative power is further validated using AUC. As is the case with the Youden index, the value of AUC also ranges from 0–1, with a value closer to zero indicating poor performance and a value closer to 1 indicating significant performance of the model.
4. Results
This section presents the results for all three cases that predict mortality and ventilator support in COVID-19 patients. Furthermore, the dataset suffers from an imbalance, which is why data-sampling techniques were applied, such as SMOTE with oversampling and SMOTE with undersampling. A k-fold cross-validation technique with a value of k equal to 10 was used to partition the data for all experiments. In the k-fold cross-validation, the dataset is initially divided into k-segments, where (k − 1) segments are used to train the model and one segment to test in each iteration. Furthermore, the training segments were then divided into training and validation sets. The validation set was used for parameter tuning. Table 2 represents the testing result of the proposed model for case 1, i.e., to predict the patient’s vital status as surviving or deceased. Similar sensitivity is achieved using the full- and selected-feature sets with the original dataset without any data-sampling technique. The highest sensitivity was achieved using the full-feature set and dataset after SMOTE undersampling. However, for other measures such as specificity, balanced accuracy, Youden index, and AUC, the highest results were obtained using the full-feature set after SMOTE with oversampling. A similar AUC was achieved with full and selected features for SMOTE oversampling with the full-feature set and original dataset with selected features. Meanwhile, the best overall AUC was obtained using selected features and with SMOTE oversampling. In the baseline study by Aljouie et al. [17], the best balanced accuracy of 0.78 and AUC of 0.85 was achieved using LR and oversampling data with the comorbidity attribute. However, in the proposed study, the highest AUC achieved was 0.875 and the balanced accuracy was 0.904 using the comorbidity attributes and the original dataset. We found that after oversampling the dataset, a similar AUC was achieved using comorbidity attributes.
Table 2.
Result of the proposed model for mortality prediction (Case 1).
Furthermore, experiments were also conducted to identify patients who are at risk of the ventilator support. Initially the experiments were carried out for the multiclass, i.e., to predict patients requiring a mechanical ventilator (MV), a noninvasive ventilator (NV), or no ventilator (NV) using all features, selected features, and CXR features. CXR features were used because in the baseline study the author found that CXR features can be used to predict the ventilatory support of COVID-19 patients. Table 3 presents the performance of the proposed DL model using different-feature sets. The table contains the testing results. Analogous to case 1, the model produced the best performance with the full-feature set in this case. It indicates the significance of all the features in predicting patients for ventilator support. However, in this case, SMOTE with the undersampling dataset set achieved the best results for all evaluation measures. For mortality prediction (case 1), a similar AUC was achieved using the full- and selected-feature sets. However, in this case there was a significant difference in the model AUC using full and selected features. Furthermore, the baseline study using the CXR feature achieved the highest results, i.e., balanced accuracy of 0.52 and AUC of 0.76 using XGB and oversampling data. However, the proposed study outperformed the baseline with a balanced accuracy of 0.838 and an AUC of 0.842 using SMOTE oversampling. We also found that the oversampling technique enhanced performance with CXR features compared to the original and undersampled datasets.
Table 3.
Result of the proposed model for ventilator-support prediction (Multiclass) (Case 2).
Lastly, the experiments conducted for the binary class (ventilator support vs. no support) were performed to predict which patients would need ventilation. The result of the proposed model is shown in Table 4 using the test set. Comparable to case 2 (multiclass), the binary class with the undersampled data and with full features also achieved the best results. After converting the multiclass to binary class, the performance of the model was slightly improved. However, there was a significant difference between the full-feature and different datasets’ results, i.e., original and over- and undersampling. Similarly, a baseline study also achieved the highest results using undersampling data with a balanced accuracy of 0.79 and an AUC of 0.82. They found that using XGB with the undersampled dataset gave the best result to predict whether or not the patient was at the risk of needing ventilator support. Meanwhile, the proposed study outperformed the baseline study with an AUC of 0.904 and a balanced accuracy of 0.875 using the original dataset. All results demonstrate the significance of the proposed model for all three cases.
Table 4.
Result of the proposed model for ventilator-support prediction (Binary class) (Case 3).
5. Discussion
Owing to the dynamic clinical indications of COVID-19 and sometimes a sudden deterioration in the condition of moderate-stage patients, it is crucial to develop an automated model that can preemptively predict which patients are at risk for ventilator support and mortality. Furthermore, there is a need to provide a model that can provide a reliable explanation to healthcare professionals. Therefore, in the proposed study, the DL model was used along with the EAI to predict mortality and ventilator support. Several studies have investigated the use of demographic features, lab tests, signs and symptoms, and radiological findings for the prediction. Consequently, demographic, clinical features, comorbidity, and CXR zone features were used in the proposed study.
Among the demographic features, age and gender were found to be significant feature. Similarly, ref. [15,16,17,18,23] found age as one of the key features for predicting intubation in COVID-19 patients. However, Bae et al. [18] used radiomics features and two demographic features (age and gender) to predict mortality and ventilator support. The radiomic scores were assigned by experienced radiologists, who found that radiomic features greatly enhanced the performance of the algorithms. Furthermore, Zhang et al. [16] included information on medication and found that patients taking medication for respiratory disease and pneumonia were more likely to end up on a ventilator. Conversely, Balbi et al. [19] found that some of the patients that were diagnosed as COVID-19-negative with the RT-PCR test, while the CXR analysis of the patients revealed pneumonia. Similarly, some of the patients had no significant signs on the CXR but were predicted to be positive using the RT-PCR test. Nevertheless, they found that CXR attributes can only be used for the prediction if other features such as SpO2, PaO2, and some other clinical features are available. Likewise, Kulkarni et al. [20] used the CXR for early detection of COVID-19 patients requiring ventilator support using the DL model, and found that CXR features can be used to perform the prediction 3 days in advance.
Conversely, [21,22] predict mortality based on demographic, comorbidity, and symptoms. Notwithstanding this, the studies provided significant results; however, the studies lacked some of the significant lab tests and CXR attributes from the dataset. Correspondingly, Aljouie et al. [17] also found that comorbidity alone can predict mortality in COVID-19 patients. In addition, Khan et al. [22] examined three comorbidities (cardiac problems, diabetes, hypertension) as significant features. However, Pezoulas et al. [24] found that some lab tests are a significant attribute in predicting mortality, while Moulaei et al. [25] discovered that shortness of breath and extra oxygen therapy are among the top features to predict mortality.
Nevertheless, the current study has produced significant results; however, there is always room for further improvement. The study was conducted with a dataset from a single center and country. Furthermore, some of the clinical attributes identified as significant such as CPR, D-dimmer, heartbeat, SpO2, and PaO2, etc. are missing from the dataset. In order to further validate the performance of the proposed model, it needs to be experimented with the multicenter dataset, and other features identified as significant in the previous literature also need to be considered. Correspondingly, the dataset also suffers from an imbalance due to the low mortality rate among COVID-19 patients. Therefore, the measures unaffected by class distribution were used in the proposed study. Additionally, the impact of COVID-19 vaccination must also be considered.
6. Conclusions
To sum up, the current study investigated the application of the DL model to predict mortality and the need for ventilator support in COVID-19 patients. The dataset includes COVID-19 patients’ demographic information, laboratory results, comorbidity, and CXR. To alleviate the data-imbalance issue, the SMOTE data-sampling technique was applied to both under- and oversampling. Features were selected using the EAI feature importance technique. The optimization of the DL model was performed using the Adam optimizer. Several sets of experiments were performed using full features, selected features, and comorbidity features only to predict mortality, and CXR findings to predict ventilator support. Experimental results showed that the proposed study outperformed the baseline study, with a balanced accuracy of 0.98 and an AUC of 0.998 for predicting mortality. When identifying patients on ventilator support, the model achieved a balanced accuracy of 0.979 and an AUC of 0.981. Furthermore, EAI is used to incorporate interpretability into the proposed DL model and to identify the impact of attributes on the proposed model’s performance. Shapley was used to compute the influence of attributes, and an induced decision tree was used to extract the rules from the model. In particular, the proposed model can be used as a tool that can assist doctors to predict at-risk patients and aid hospitals to manage and plan their resources effectively. Conversely, this study can potentially be extended to examine performance using the multicenter and multicountry dataset. In addition, some of the significant lab investigation results and COVID-19 vaccinations must be considered.
Funding
This research received no external funding.
Institutional Review Board Statement
Not applicable.
Informed Consent Statement
Not applicable.
Data Availability Statement
The study used an open-source dataset accessible from the weblink https://data.mendeley.com/datasets/r6t9tmzzmz/3 (accessed on 7 December 2021).
Conflicts of Interest
The authors declare no conflict of interest.
Appendix A. Decision Tree Results
Table A1.
Case 1—Decision Tree (Binary-Class, Deceased:0, Alive:1).
Table A1.
Case 1—Decision Tree (Binary-Class, Deceased:0, Alive:1).
| Feature Set | Technique | SN | SP | Bal-Acc | YI | AUC |
|---|---|---|---|---|---|---|
| Full Features | Original Dataset | 0.884 | 0.250 | 0.567 | 0.134 | 0.567 |
| SMOTE with Oversampling | 0.817 | 0.752 | 0.784 | 0.569 | 0.784 | |
| SMOTE with Undersampling | 0.905 | 0.184 | 0.544 | 0.089 | 0.545 | |
| Selected Features | Original Dataset | 0.429 | 0.837 | 0.633 | 0.266 | 0.632 |
| SMOTE with Oversampling | 0.812 | 0.779 | 0.796 | 0.592 | 0.796 | |
| SMOTE with Undersampling | 0.406 | 0.831 | 0.618 | 0.237 | 0.619 | |
| Comorbidity Features | Original Dataset | 0.458 | 0.858 | 0.658 | 0.317 | 0.658 |
| SMOTE with Oversampling | 0.793 | 0.706 | 0.749 | 0.499 | 0.749 | |
| SMOTE with Undersampling | 0.444 | 0.864 | 0.654 | 0.309 | 0.654 |
Table A2.
Case 2—Decision Tree (Multiclass, No_Ventilator:0, NIV:1, MV:2).
Table A2.
Case 2—Decision Tree (Multiclass, No_Ventilator:0, NIV:1, MV:2).
| Feature Set | Technique | SN | SP | Bal-Acc | YI | AUC |
|---|---|---|---|---|---|---|
| Full Features | Original Dataset | 0.415 | 0.748 | 0.582 | 0.163 | 0.582 |
| SMOTE with Oversampling | 0.747 | 0.874 | 0.811 | 0.622 | 0.811 | |
| SMOTE with Undersampling | 0.404 | 0.749 | 0.577 | 0.153 | 0.577 | |
| Selected Features | Original Dataset | 0.380 | 0.760 | 0.570 | 0.141 | 0.570 |
| SMOTE with Oversampling | 0.769 | 0.885 | 0.827 | 0.655 | 0.827 | |
| SMOTE with Undersampling | 0.426 | 0.744 | 0.585 | 0.171 | 0.586 | |
| Comorbidity Features | Original Dataset | 0.344 | 0.653 | 0.498 | -0.003 | 0.498 |
| SMOTE with Oversampling | 0.737 | 0.868 | 0.802 | 0.605 | 0.803 | |
| SMOTE with Undersampling | 0.397 | 0.721 | 0.558 | 0.117 | 0.558 |
Table A3.
Case 3—Decision Tree (Multiclass, No_Ventilator:0, NIV:1, MV:1).
Table A3.
Case 3—Decision Tree (Multiclass, No_Ventilator:0, NIV:1, MV:1).
| Feature Set | Technique | SN | SP | Bal-Acc | YI | AUC |
|---|---|---|---|---|---|---|
| Full Features | Original Dataset | 0.402 | 0.863 | 0.633 | 0.266 | 0.632 |
| SMOTE with Oversampling | 0.758 | 0.784 | 0.771 | 0.543 | 0.772 | |
| SMOTE with Undersampling | 0.542 | 0.833 | 0.687 | 0.375 | 0.688 | |
| Selected Features | Original Dataset | 0.333 | 0.846 | 0.590 | 0.180 | 0.591 |
| SMOTE with Oversampling | 0.774 | 0.748 | 0.761 | 0.522 | 0.763 | |
| SMOTE with Undersampling | 0.581 | 0.843 | 0.712 | 0.423 | 0.713 | |
| Comorbidity Features | Original Dataset | 0.458 | 0.779 | 0.618 | 0.237 | 0.619 |
| SMOTE with Oversampling | 0.731 | 0.744 | 0.738 | 0.476 | 0.738 | |
| SMOTE with Undersampling | 0.357 | 0.792 | 0.574 | 0.149 | 0.575 |
References
- Worldometer-COVID-19. Available online: https://www.worldometers.info/coronavirus/#countries (accessed on 7 January 2022).
- Li, X.; Liao, H.; Wen, Z. A consensus model to manage the non-cooperative behaviors of individuals in uncertain group decision making problems during the COVID-19 outbreak. Appl. Soft Comput. 2021, 99, 106789. [Google Scholar] [CrossRef]
- Khan, I.U.; Aslam, N. A deep-learning-based framework for automated diagnosis of COVID-19 using X-ray images. Information 2020, 11, 419. [Google Scholar] [CrossRef]
- Jin, C.; Chen, W.; Cao, Y.; Xu, Z.; Tan, Z.; Zhang, X.; Deng, L.; Zheng, C.; Zhou, J.; Shi, H.; et al. Development and evaluation of an artificial intelligence system for COVID-19 diagnosis. Nat. Commun. 2020, 11, 5088. [Google Scholar] [CrossRef] [PubMed]
- Khan, I.U.; Aslam, N.; Anwar, T.; Alsaif, H.S.; Chrouf, S.M.; Alzahrani, N.A.; Alamoudi, F.A.; Kamaleldin, M.M.; Awary, K.B. Using a Deep Learning Model to Explore the Impact of Clinical Data on COVID-19 Diagnosis Using Chest X-ray. Sensors 2022, 22, 669. [Google Scholar] [CrossRef]
- El-Rashidy, N.; Abdelrazik, S.; Abuhmed, T.; Amer, E.; Ali, F.; Hu, J.W.; El-Sappagh, S. Comprehensive Survey of Using Machine Learning in the COVID-19 Pandemic. Diagnostics 2021, 11, 1155. [Google Scholar] [CrossRef]
- Xu, Z.; Su, C.; Xiao, Y.; Wang, F. Artificial intelligence for COVID-19: Battling the pandemic with computational intelligence. Intell. Med. 2021, 2, 13–29. [Google Scholar] [CrossRef]
- Doran, D.; Schulz, S.; Besold, T.R. What does explainable AI really mean? A new conceptualization of perspectives. arXiv 2017, arXiv:1710.00794. [Google Scholar]
- Bologna, G.; Hayashi, Y. Characterization of symbolic rules embedded in deep dimlp networks: A challenge to transparency of deep learning. J. Artif. Intell. Soft Comput. Res. 2017, 7, 265–286. [Google Scholar] [CrossRef] [Green Version]
- Carvalho, D.V.; Pereira, E.M.; Cardoso, J.S. Machine Learning Interpretability: A Survey on Methods and Metrics. Electronics 2019, 8, 832. [Google Scholar] [CrossRef] [Green Version]
- Goebel, R.; Chander, A.; Holzinger, K.; Lecue, F.; Akata, Z.; Stumpf, S.; Kieseberg, P.; Holzinger, A. Explainable AI: The New 42? In Machine Learning and Knowledge Extraction; Springer: Cham, Switzerland, 2018; pp. 295–303. [Google Scholar] [CrossRef] [Green Version]
- Holzinger, A.; Kieseberg, P.; Weippl, E.; Tjoa, A.M. Current Advances, Trends and Challenges of Machine Learning and Knowledge Extraction: From Machine Learning to Explainable AI. In Machine Learning and Knowledge Extraction; Springer: Cham, Switzerland, 2018; pp. 1–8. [Google Scholar] [CrossRef]
- Lötsch, J.; Kringel, D. Explainable Artificial Intelligence (XAI) in Biomedicine: Making AI Decisions Trustworthy for Physicians and Patients. Biomedinformatics 2022, 2, 1–17. [Google Scholar] [CrossRef]
- Pham, Q.V.; Nguyen, D.C.; Huynh-The, T.; Hwang, W.J.; Pathirana, P.N. Artificial Intelligence (AI) and Big Data for Coronavirus (COVID-19) Pandemic: A Survey on the State-of-the-Arts. IEEE Access 2020, 8, 130820–130839. [Google Scholar] [CrossRef] [PubMed]
- Varzaneh, Z.A.; Orooji, A.; Erfannia, L.; Shanbehzadeh, M. A new COVID-19 intubation prediction strategy using an intelligent feature selection and K-NN method. Inform. Med. Unlocked 2022, 28, 100825. [Google Scholar] [CrossRef] [PubMed]
- Zhang, K.; Jiang, X.; Madadi, M.; Chen, L.; Savitz, S.; Shams, S. DBNet: A novel deep learning framework for mechanical ventilation prediction using electronic health records. In Proceedings of the 12th ACM Conference on Bioinformatics, Computational Biology, and Health Informatics, Gainesville, FL, USA, 1–4 August 2021. [Google Scholar]
- Aljouie, A.F.; Almazroa, A.; Bokhari, Y.; Alawad, M.; Mahmoud, E.; Alawad, E.; Alsehawi, A.; Rashid, M.; Alomair, L.; Almozaai, S.; et al. Early Prediction of COVID-19 Ventilation Requirement and Mortality from Routinely Collected Baseline Chest Radiographs, Laboratory, and Clinical Data with Machine Learning. J. Multidiscip. Healthc. 2021, 14, 2017–2033. [Google Scholar] [CrossRef] [PubMed]
- Bae, J.; Kapse, S.; Singh, G.; Gattu, R.; Ali, S.; Shah, N.; Marshall, C.; Pierce, J.; Phatak, T.; Gupta, A.; et al. Predicting Mechanical Ventilation and Mortality in COVID-19 Using Radiomics and Deep Learning on Chest Radiographs: A Multi-Institutional Study. Diagnostics 2021, 11, 1812. [Google Scholar] [CrossRef]
- Balbi, M.; Caroli, A.; Corsi, A.; Milanese, G.; Surace, A.; Di Marco, F.; Novelli, L.; Silva, M.; Lorini, F.L.; Duca, A.; et al. Chest X-ray for predicting mortality and the need for ventilatory support in COVID-19 patients presenting to the emergency department. Eur. Radiol. 2021, 31, 1999–2012. [Google Scholar] [CrossRef]
- Kulkarni, A.R.; Athavale, A.M.; Sahni, A.; Sukhal, S.; Saini, A.; Itteera, M.; Zhukovsky, S.; Vernik, J.; Abraham, M.; Joshi, A.; et al. Deep learning model to predict the need for mechanical ventilation using chest X ray images in hospitalised patients with COVID-19. BMJ Innov. 2021, 7, 261–270. [Google Scholar] [CrossRef]
- Pourhomayoun, M.; Shakibi, M. Predicting mortality risk in patients with COVID-19 using machine learning to help medical decision-making. Smart Health 2021, 20, 100178. [Google Scholar] [CrossRef]
- Khan, I.U.; Aslam, N.; Aljabri, M.; Aljameel, S.S.; Kamaleldin, M.M.; Alshamrani, F.M.; Chrouf, S.M. Computational Intelligence-Based Model for Mortality Rate Prediction in COVID-19 Patients. Int. J. Environ. Res. Public Health 2021, 18, 6429. [Google Scholar] [CrossRef]
- Timpau, A.S.; Miftode, R.S.; Petris, A.O.; Costache, I.I.; Miftode, I.L.; Rosu, F.M.; Anton-Paduraru, D.T.; Leca, D.; Miftode, E.G. Mortality Predictors in Severe COVID-19 Patients from an East European Tertiary Center: A Never-Ending Challenge for a No Happy Ending Pandemic. J. Clin. Med. 2022, 11, 58. [Google Scholar] [CrossRef]
- Pezoulas, V.C.; Kourou, K.D.; Papaloukas, C.; Triantafyllia, V.; Lampropoulou, V.; Siouti, E.; Papadaki, M.; Salagianni, M.; Koukaki, E.; Rovina, N.; et al. A Multimodal Approach for the Risk Prediction of Intensive Care and Mortality in Patients with COVID-19. Diagnostics 2022, 12, 56. [Google Scholar] [CrossRef]
- Moulaei, K.; Shanbehzadeh, M.; Mohammadi-Taghiabad, Z.; Kazemi-Arpanahi, H. Comparing machine learning algorithms for predicting COVID-19 mortality. BMC Med. Inform. Decis. Mak. 2022, 22, 2. [Google Scholar] [CrossRef] [PubMed]
- Kingma, D.P.; Ba, J. Adam: A method for stochastic optimization. In Proceedings of the 3rd International Conference for Learning Representations, San Diego, CA, USA, 7–9 May 2015. [Google Scholar]
- Sewwandi, R.H. Local Model-Agnostic Explanations for Machine Learning and Time-Series Forecasting Models. Ph.D. Thesis, Monash University, Subang Jaya, Malysia, 2022. [Google Scholar]
- Tharwat, A. Classification assessment methods. Appl. Comput. Inform. 2021, 17, 168–192. [Google Scholar] [CrossRef]
Publisher’s Note: MDPI stays neutral with regard to jurisdictional claims in published maps and institutional affiliations. |
© 2022 by the author. Licensee MDPI, Basel, Switzerland. This article is an open access article distributed under the terms and conditions of the Creative Commons Attribution (CC BY) license (https://creativecommons.org/licenses/by/4.0/).