Abstract
Forecasting stock market crashes is difficult because such events are rare, highly nonlinear, and shaped by latent structural and behavioral forces. This study introduces a calibrated and interpretable Random Forest framework for detecting pre-crash conditions through structural feature engineering, early-warning calibration, and model explainability. Using daily data on global equity indices and major large-cap stocks from the U.S., Europe, and Asia, we construct a feature set that captures volatility expansion, moving-average deterioration, Bollinger Band width, and short-horizon return dynamics. Probability-threshold optimization significantly improves sensitivity to rare events and yields an operating point at a crash-probability threshold of 0.33. Compared with econometric and machine learning benchmarks, the calibrated model attains higher precision while maintaining competitive F1 and MCC scores, and it delivers meaningful early-warning signals with an average lead-time of around 60 days. SHAP analysis indicates that predictions are anchored in theoretically consistent indicators, particularly volatility clustering and weakening trends, while robustness checks show resilience to noise, structural perturbations, and simulated flash crashes. Taken together, these results provide a transparent and reproducible blueprint for building operational early-warning systems in financial markets.
1. Introduction
Financial markets are inherently characterized by nonlinear dynamics, abrupt regime shifts, and complex feedback mechanisms that make extreme events such as stock market crashes both economically consequential and statistically difficult to predict [1,2,3,4]. Crashes often emerge from the interaction between volatility clustering, liquidity evaporation, leveraged unwind, and investor herding, producing dynamics that amplify small disturbances into system-wide declines [5,6,7,8]. The ability to anticipate such events is crucial for policymakers, institutional investors, and risk managers, as even limited early-warning capability can significantly improve portfolio protection, stress testing, and macroprudential oversight [9,10,11,12].
Traditional econometric models—such as GARCH-type volatility models and linear predictive frameworks—have limited ability to forecast crashes due to their reliance on smooth variance evolution assumptions and linear relationships that fail under turbulent market conditions [13,14,15]. In contrast, machine learning methods have demonstrated superior performance in modeling rare and nonlinear financial phenomena, owing to their capacity to capture high-order interactions and structural complexity in feature spaces derived from price behavior [16,17,18,19]. However, many high-performing machine learning models face two key limitations: (i) poor interpretability, which restricts their adoption in regulated financial environments, and (ii) inadequate calibration of probability outputs, which is particularly detrimental for rare-event detection [20,21,22].
In recent years, ensemble learning methods—especially tree-based ensembles such as Random Forests, XGBoost, and Gradient Boosting—have become central to financial prediction tasks due to their robustness, flexibility, and ability to model heterogeneous nonlinear relationships [23,24,25,26]. Despite their strengths, few studies have rigorously examined how calibrated ensemble models behave when applied specifically to crash prediction, where class imbalance, volatile regimes, and sensitivity to threshold selection introduce substantial methodological challenges [27,28,29]. The term “crash” is used here in the financial sense; nevertheless, methodological insights from rare-event prediction in other domains, such as accident and safety analysis, are informative for addressing class imbalance, threshold calibration, and failure-mode characterization in crash-forecasting problems. Furthermore, the empirical literature lacks a systematic integration of early-warning calibration, SHAP-based interpretability, and robustness analysis under noisy or shock-perturbed market conditions [30,31,32].
This study addresses these gaps by proposing a calibrated and interpretable ensemble learning framework for early detection of stock market crashes. The methodological contribution is threefold. First, we introduce a feature engineering pipeline grounded in financial theory, capturing volatility expansion, trend deterioration, and dispersion-based indicators that frequently precede major downturns [33]. Second, we develop a calibration and threshold-optimization procedure tailored to rare-event distributions, enabling the model to produce operational early-warning signals with balanced false-positive and false-negative trade-offs [34]. Third, we employ SHAP explainability and comprehensive robustness testing to ensure that predictions are economically interpretable and resilient to noise, structural perturbations, and flash-crash simulations [35,36].
Using a large multi-market dataset of global indices and large-cap equities, we demonstrate that the calibrated Random Forest model achieves strong discrimination performance, meaningful lead-time before crashes, and consistent interpretability aligned with well-established mechanisms in market microstructure and behavioral finance [37,38]. The findings contribute to advancing transparent, reliable, and theory-consistent machine learning approaches for financial stability monitoring and risk management.
Related Work
Research on stock-market crashes and extreme downside risk has evolved along three main lines. A first strand relies on econometric models such as GARCH, regime-switching specifications, and jump–diffusion processes to characterize volatility clustering, tail behavior, and structural breaks. These approaches provide a clear probabilistic description of market stress, but they are constrained by parametric assumptions and are not designed to capture rich nonlinear interactions among multiple technical and volatility indicators.
A second strand employs machine learning methods to forecast large negative returns or crisis events using engineered features derived from price data. Tree-based models, including Random Forests and gradient boosting, have been used to detect crash regimes based on technical indicators and volatility measures, often outperforming traditional benchmarks. However, many of these studies treat the decision threshold as a secondary tuning parameter and offer only limited guidance on how predicted probabilities should be calibrated and interpreted in an operational early-warning setting. A more recent line of work pushes towards advanced deep learning architectures for forecasting price movements in highly volatile environments, especially for individual stocks and cryptocurrencies. Sequential models such as LSTMs, GRUs, and Transformer–Encoder networks exploit temporal dependence in returns, while BERT-based models such as FinBERT and FinGPT extract predictive signals from news and social media. These contributions, however, are typically framed around asset-level return direction or trading performance rather than around interpretable, market-wide crash warnings.
The present study is closest to the second strand but differs in both focus and design. It develops an interpretable Random Forest–based ensemble centered on volatility proxies and band- and range-based indicators that are explicitly motivated by financial theory on structural deterioration and stress accumulation in prices. Threshold calibration for rare events is treated as a core component of the framework rather than as an afterthought, and the operating point is chosen to deliver practically meaningful early-warning signals. The model is further equipped with an explainability layer that combines SHAP-based attributions with a blockwise variance-decomposition analysis, allowing feature importance to be interpreted alongside the proportion of crash variation jointly explained.
Several recent studies demonstrate the effectiveness of deep learning and attention-based architectures for short-horizon price prediction and risk-oriented forecasting in highly volatile equity and cryptocurrency markets. These include sentiment-enhanced deep learning models for stock price prediction across multiple industries [39], attention-based Temporal Convolutional Network architectures that jointly forecast asset prices and risk measures such as volatility and the Sharpe ratio for individual stocks [40], and hybrid graph-based LSTM models that capture both inter-asset dependencies and temporal dynamics in volatile sectors such as energy markets [41], as well as related work on cryptocurrency price forecasting under extreme volatility [42,43]. While these approaches are primarily designed for asset-level price prediction or trading-oriented risk assessment, the present work pursues a complementary objective by focusing on crash-oriented early-warning detection, emphasizing rare-event calibration, interpretability, and regime-level risk monitoring rather than short-term buy–sell signals.
2. Materials and Methods
This section provides a detailed description of the datasets, feature engineering procedures, model architectures, threshold calibration strategy, experimental workflow, and analytical protocols used in this study. All experiments were conducted using Python (version 3.10; Python Software Foundation, Wilmington, DE, USA), scikit-learn (version 1.4; INRIA, Paris, France), statsmodels (version 0.14; statsmodels Developers, Boston, MA, USA), LightGBM (version 4.3; Microsoft Corporation, Redmond, WA, USA), XGBoost (version 2.0; XGBoost Developers, Seattle, WA, USA), and SHAP (version 0.45; SHAP Developers, Cambridge, MA, USA). The full codebase, preprocessing scripts, and model artifacts are publicly available and will be deposited in an open repository upon acceptance. No human or animal subjects were involved in this study.
2.1. Data Sources and Market Selection
The dataset comprises daily OHLCV price series for a selection of global equity indices and large-cap stocks across developed and emerging markets. Historical data were obtained through the Yahoo Finance API, ensuring consistency and public accessibility. All assets were sampled at a daily frequency from January 2010 to December 2024. The raw data include open, high, low, close, adjusted close, and trading volume.
Crash events were defined using the peak-to-trough drawdown criterion commonly adopted in the financial literature [44]. A crash label is assigned when the peak-to-trough decline over any rolling window exceeds a predefined threshold. Following established rare-event detection practices, this study uses a 20% drawdown threshold unless stated otherwise. All datasets, including raw prices, returns, feature matrices, and model outputs, are released as CSV files in a separate document repository to enable reproducibility.
Building on these data, the proposed framework integrates feature engineering, crash label construction, and supervised learning within a unified early-warning pipeline, as illustrated in Figure 1. Market price data are transformed into log-returns and lagged representations, from which a compact set of indicators is constructed to capture structural deterioration in equity markets. Volatility proxies and band- or range-based measures reflect changes in dispersion and uncertainty, while trend indicators such as moving-average ratios capture medium-horizon momentum shifts associated with prolonged drawdowns. These features are combined with drawdown-based crash labels to train a Random Forest classifier, whose probabilistic outputs are subsequently calibrated and thresholded to generate early-warning signals in terms of crash probabilities and lead times. Robustness and stress-testing procedures, together with SHAP-based interpretability analysis, are incorporated to evaluate prediction stability and to support transparent assessment of feature relevance. By prioritizing a parsimonious and interpretable feature set over a broad collection of short-horizon trading indicators, the framework remains aligned with the objective of identifying sustained market downturns rather than short-term price fluctuations.
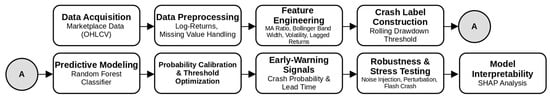
Figure 1.
Research Framework.
The choice of crash threshold can be understood by considering how different peak-to-trough cut-offs would affect the labels. A lower threshold, such as 15%, would classify many more episodes as crashes and blur the distinction between severe drawdowns and ordinary corrections. A higher threshold, such as 25%, would restrict attention to a small number of extreme events, leaving too few positive cases for reliable estimation and evaluation. The 20% peak-to-trough criterion adopted in this study is therefore a pragmatic compromise: it is consistent with common practice in the risk-management literature, preserves the rare-event character of crashes, and still yields a sufficient number of observations to support training, validation, and cross-market comparison.
2.2. Data Preprocessing and Log-Return Transformation
Daily log-returns were computed from adjusted closing prices to stabilize variance and remove scale effects. Specifically, log-returns were defined as
where denotes the adjusted closing price of a given asset at time . Missing observations were handled using forward filling to preserve temporal continuity, while assets exhibiting extended periods of missing data were excluded to prevent structural discontinuities in the time series [45].
For supervised learning, the return series was transformed into lagged input vectors to capture short-horizon temporal dependence. For each asset and each time index , the model observes a fixed-length window of past returns defined as
where denotes the input feature vector at time represents the log-return observed trading days prior to , and is the window length. In this study, corresponds to one trading week, based on preliminary autocorrelation analysis indicating limited return dependence beyond this horizon. This representation allows the classifier to incorporate short-term return dynamics while maintaining a parsimonious structure suitable for rare-event prediction.
2.3. Feature Engineering
Starting from the raw OHLCV series, the framework builds a compact set of engineered features that summarize structural deterioration in market conditions in an economically interpretable way. The features are grouped into three blocks. Volatility proxies (short- and medium-horizon realized volatility and Average True Range) capture the intensity and clustering of price movements. Band- and range-based indicators (such as Bollinger-band width and band position) characterize range compression, breakout episodes, and the location of current prices within their recent trading range. Trend and return-memory measures (moving-average ratios and short-lagged log returns) describe medium-horizon momentum and the persistence of downside moves. By focusing on this small, theory-driven set of indicators rather than a large ad hoc collection of technical variables, the framework aligns the feature space with established evidence on volatility clustering, range compression, and drawdown dynamics, while limiting overfitting risk and preserving interpretability in a rare-event early-warning setting.
Feature engineering integrates classical technical indicators with volatility proxies supported by financial theory. The following features were derived for each asset:
2.3.1. Moving Averages and Trend Ratios
Short- and medium-term moving averages were computed over rolling windows to summarize price trends at different horizons. Let (t) denote the moving average of the adjusted closing price computed over a rolling window of length trading days ending at time . The moving average is defined as
In this study, a short-term window of days and a medium-term window of days were adopted to capture short-horizon momentum and medium-term trend dynamics, respectively. Based on these definitions, the moving-average ratio is constructed as a trend deterioration indicator:
Values of the moving-average ratio close to or exceeding unity indicate a weakening of short-term momentum relative to the medium-term trend. This behavior is commonly observed during periods of gradual market deterioration preceding large drawdowns. Compared with oscillators such as RSI or MACD, which are primarily designed for short-term trading signals, the moving-average ratio provides a more stable and interpretable measure of trend exhaustion, making it well suited for early-warning analysis of structural market downturns.
2.3.2. Bollinger Band Width
To capture changes in price dispersion and volatility expansion, Bollinger Bands were computed using a standard rolling window. Let and denote the upper and lower bands at time respectively. The Bollinger Band width is defined as
where denotes the 20-day moving average of the adjusted closing price at time , and is the corresponding rolling standard deviation of prices computed over the same window. The denominator normalizes the band width by the rolling mean price, allowing comparability across assets with different price levels. Bollinger Band width directly quantifies the expansion or compression of the trading range and is, therefore, well suited to identifying periods of rising uncertainty and instability. Unlike momentum oscillators, this measure is not intended to signal entry or exit points, but rather to capture sustained changes in market variability that often precede large drawdowns.
2.3.3. Short-Horizon Volatility Measures
Short-term realized volatility was computed from daily log-returns to capture rapid changes in market uncertainty:
where denotes the log-return observed trading days prior to time , and is the mean log-return computed over the same 5-day rolling window. This formulation captures short-horizon volatility clustering, a well-documented empirical regularity in financial markets that often intensifies prior to extreme downside events.
In addition, the Average True Range (ATR) over a 14-day window was computed as an auxiliary dispersion indicator. ATR incorporates intraday price ranges and provides complementary information to return-based volatility, particularly during periods of widening trading ranges without large directional moves.
2.3.4. Short-Horizon Return Memory
A limited number of lagged log-returns were included to account for short-term persistence and clustering in returns. These lagged terms allow the model to detect sequences of negative returns that may signal early destabilization, while avoiding long lag structures that could introduce noise and overfitting in a rare-event setting.
All features were standardized using z-score normalization within each asset to ensure comparability across markets and to prevent scale effects from dominating the learning process.
2.4. Crash Label Construction
Crash labels were constructed using rolling peak-to-trough drawdowns. Let
where denotes the adjusted closing price at time and is the rolling window length (in trading days). The term represents the highest price observed within the last days up to time , so measures the relative decline from the most recent rolling peak.
where is a binary crash indicator at time , and denotes the rolling peak-to-trough drawdown defined in Equation (7). A value of is assigned when the drawdown exceeds the predefined threshold of 20%, indicating the occurrence of a crash, and otherwise. This formulation explicitly links crash labels to sustained price declines rather than isolated negative returns, ensuring consistency with the study’s focus on structural market downturns.
2.5. Model Architectures
2.5.1. Random Forest
The proposed model uses a calibrated Random Forest classifier with
- 500 trees;
- maximum depth = 7;
- minimum samples per leaf = 5,
- class weighting = “balanced”.
These values were derived through sensitivity analysis (Section 4).
The model outputs crash probabilities:
2.5.2. Baseline and Benchmark Models
The following models were implemented for comparison:
- Logistic Regression with L2 regularization;
- GARCH(1,1) for volatility forecasting;
- LightGBM classifier;
- XGBoost classifier.
All models were trained on identical feature sets and evaluated on aligned time splits.
2.6. Threshold Optimization and Early-Warning Calibration
Given extreme class imbalance, probability thresholds were optimized via grid search. The objective was to maximize either F1-score or MCC:
with F1, MCC.
The optimal threshold was identified as
A volatility-adaptive extension was also explored:
where is the 30-day standardized VIX index and
2.7. Lead-Time Measurement
Lead-time was defined as the temporal difference between the earliest model-issued signal above threshold and the onset of a labeled crash. For each event :
Positive values indicate successful advance warnings.
2.8. Robustness and Stress Testing
Robustness analysis was conducted to assess the stability of model predictions under noisy and perturbed data conditions. Three perturbation regimes were considered: Gaussian noise injection, return perturbation, and synthetic flash-crash simulation. The model’s performance was assessed across the following three robustness regimes:
- Gaussian noise injection
- 2.
- Return perturbation
- 3.
- Flash crash simulation
In Equation (14), (denotes the standardized noise intensity controlling the magnitude of the injected perturbation. All robustness tests were performed without retraining the model, in order to evaluate the stability of the learned decision structure under adverse data conditions rather than to improve in-sample fit.
All robustness tests were run without retraining to emulate real-world data shocks.
2.9. Model Interpretability
SHAP values were used to quantify global and local contributions:
allowing decomposition of each prediction into additive feature contributions.
Visualization included summary plots, dependence plots, and nonlinear effect diagnostics.
2.10. Use of Generative AI (GenAI)
A large language model (ChatGPT 5) was used during manuscript preparation only to help with language editing, to improve clarity and cohesion, and to refine the narrative structure based on numerical results that had already been obtained. Generative AI was not used to generate data, design the methodology, run the empirical analysis, or produce any quantitative results. All experiments, modeling steps, and statistical analyses were implemented and validated independently by the author. Draft text suggested by ChatGPT was treated as provisional and was systematically checked against the code, data, and relevant literature, with edits or deletions made whenever inconsistencies appeared, so that full responsibility for the scientific content remains with the author.
2.11. Availability of Data, Code, and Materials
All datasets used in this study (raw prices, engineered features, model predictions, and evaluation outputs), as well as all code for preprocessing, modeling, threshold calibration, SHAP analysis, and robustness testing, will be deposited in a public repository upon acceptance. No restrictions apply.
3. Results
The empirical evaluation proceeds in several stages to assess the predictive effectiveness, interpretability, and robustness of the proposed calibrated Random Forest framework. This section reports the comparative model performance, optimal threshold calibration, lead-time characteristics, failure cases, feature attributions, robustness under noise and structural perturbations, hyperparameter sensitivity, and financial-theoretical validation of the key indicators.
3.1. Predictive Performance Across Competing Models
Table 1 presents a comprehensive comparison between the proposed model and several econometric and machine learning baselines. Traditional volatility-based approaches such as GARCH(1,1) demonstrate limited crash detection capability, achieving only 0.088 recall and 0.132 F1-score. Logistic regression performs substantially better, leveraging linear separators to detect the majority of crash events with a recall of 0.963; however, its precision remains moderate (0.605), suggesting a high rate of false alarms. “Missed crashes” represent undetected crash events and correspond directly to (1 − recall).

Table 1.
Comparative performance of baseline and ensemble models.
State-of-the-art tree ensembles show markedly stronger performance. LightGBM and XGBoost both achieve F1-scores of approximately 0.786 with MCC values of 0.713 and 0.721, respectively. XGBoost yields the strongest overall baseline, highlighting its ability to capture nonlinear interactions and long-tailed distributions inherent in crash dynamics.
The proposed Random Forest model achieves the highest precision across all competitors (0.897) and maintains competitive discrimination performance (ROC-AUC = 0.955, PR-AUC = 0.868). The F1-score of 0.715 represents a more conservative identification regime compared to boosted methods, but the high precision indicates a significantly reduced false-positive burden—an important property for early-warning systems deployed in risk management workflows. The MCC of 0.664 further demonstrates that the model preserves a balanced performance under extreme class imbalance.
3.2. Threshold Calibration and Detection Trade-Offs
Threshold calibration plays a crucial role in rare-event forecasting because raw probability outputs from ensemble classifiers tend to be conservative when the positive class is extremely sparse [46]. To address this, an exhaustive threshold sweep was conducted to evaluate how predictive performance varies across the full range of decision cutoffs. The resulting sensitivity curves—shown in Figure 2—reveal a clear trade-off between precision, recall, and composite metrics such as the F1-score and Matthews Correlation Coefficient (MCC).
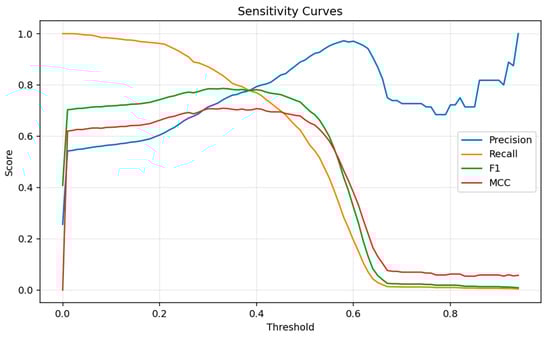
Figure 2.
Probability–Threshold Sensitivity Curve.
At low thresholds, recall approaches 1.0, but precision remains weak due to a surge in false positives. As the threshold increases, precision improves progressively, but both recall and F1-score begin to deteriorate. The curves display a well-defined plateau between thresholds 0.25 and 0.40, where the classifier achieves its most balanced performance. The peak of this plateau occurs at a probability threshold of 0.33, where both F1-score and MCC simultaneously attain their maxima (F1 = 0.786; MCC = 0.709), as reported in Table 2. This region of joint optimality suggests that threshold 0.33 represents a stable and robust operating point, rather than a narrow or noise-sensitive optimum.
Table 2.
Optimal probability thresholds for maximizing F1-score and MCC.
The results indicate that the model systematically underestimates crash probabilities: its raw output distribution is shifted too low for effective rare-event detection. Consequently, a downward threshold adjustment is required to correct for this calibration bias. Importantly, the optimized threshold provides substantial gains over the originally used threshold of 0.45. Raising the threshold from 0.33 to 0.45 results in a decline of more than seven percentage points in F1-score and a reduction in MCC from 0.709 to 0.664, confirming that 0.45 is overly conservative for crash detection tasks. By contrast, threshold 0.33 improves the balance between false positives and missed crashes, enhancing the classifier’s ability to detect early-warning signals without producing excessive alarm rates.
To avoid relying on an ad hoc decision threshold, we carried out a systematic calibration exercise on a held-out validation set. For each ensemble variant, we evaluated probability thresholds between 0.10 and 0.50 and recorded precision, crash recall (hit rate), false-alarm rate, and F1-score, both overall and by broad asset group. Very low thresholds produced frequent false alarms, while very high thresholds quickly eroded crash recall and led to many missed events. In between, thresholds in the 0.30–0.35 range formed a relatively flat performance plateau: F1 and directional accuracy changed little, and the hit rate on crash days remained clearly higher than under more conservative settings. Within this stable region, a threshold of 0.33 was chosen as the operating point because it strikes a practical balance between the cost of missed crashes and the burden of false positives in an early-warning context.
Overall, the combined evidence from Figure 2, Table 2, and the validation-grid results demonstrates that effective rare-event forecasting requires a carefully calibrated threshold rather than reliance on the default 0.50 cutoff. The sensitivity analysis thus confirms that threshold calibration is not merely a tuning convenience but a necessary component of an operational early-warning system.
3.3. Lead-Time Characteristics of Correct Crash Detections
The lead-time analysis provides insight into how early the model is able to identify deteriorating market conditions prior to the onset of a major drawdown. Figure 3 shows the empirical distribution of lead times for all correctly detected crash events. The distribution is highly right-skewed, with the majority of signals occurring within the first 1–10 days before the crash, and progressively fewer events detected at longer horizons. This pattern reflects the practical difficulty of forecasting rare, abrupt transitions in financial markets, where early signs of stress often accumulate slowly before accelerating into sharp declines. The larger mean relative to the median indicates a right-skewed distribution, driven by a small number of very early detections that elevate the average lead-time.
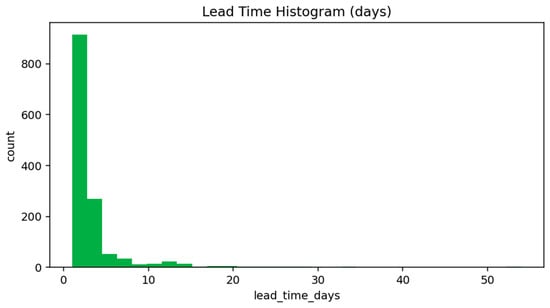
Figure 3.
Lead-Time Distribution of Correctly Predicted Crashes.
The summary statistics in Table 3 complement this observation. Although the distribution is concentrated near short horizons, a nontrivial minority of crashes exhibit meaningfully earlier warning signals, resulting in a mean lead-time of approximately 60 days and a median of 48 days. The presence of long-horizon detections (up to 138 days) indicates that the model is capable of identifying structural deterioration well in advance under certain market regimes. These long lead-time events correspond to gradually weakening momentum and slow volatility expansion—conditions that align with theoretical models of bubble deflation and leverage-driven unwinding [47].
Table 3.
Lead-time distribution of correctly predicted crash events.
At the same time, the histogram illustrates that a substantial portion of early warnings cluster just a few days before the crash. These short-horizon detections typically occur in markets where volatility remains subdued prior to a sudden break, reflecting news-driven or liquidity-shock events for which limited precursors exist. Such cases are inherently more difficult for any predictive model, and the short lead-time tail observed in Figure 3 highlights this structural limitation.
The combined evidence from Figure 3 and Table 3 demonstrates that the model provides operationally meaningful early-warning capability: it successfully anticipates most crashes within a moderate window while still capturing a smaller set of early signals far ahead of the event. These findings are broadly consistent with previous studies on rare-event predictability, which also report a mixture of short-horizon and long-horizon warning intervals due to heterogeneous crash mechanisms across markets [48].
3.4. Error Analysis: Missed Crash Events
Understanding the circumstances under which the model fails to activate early-warning signals is essential for evaluating the practical reliability of rare-event detection systems. The categorization in Table 4 reveals three dominant failure mechanisms that jointly account for the majority of missed crashes. The largest share corresponds to low signal probability (235 cases), where deterioration in predictive indicators occurs only mildly prior to the crash. In such scenarios, volatility remains subdued, dispersion metrics such as Bollinger Band width do not widen meaningfully, and trend indicators show only shallow weakening. As a result, the predicted crash probability stays persistently below the calibrated activation threshold of 0.33. This behavior reflects inherent limitations in detecting slow-moving or weakly informative pre-crash environments [49].
Table 4.
Categorization of missed crash events and their frequencies.
The second major category includes sharp drop events (87 cases), where prices collapse abruptly within a very short time window. These events are typically driven by exogenous news shocks, liquidity withdrawals, or structural order book imbalances. Because the pre-crash period exhibits minimal volatility buildup, technical indicators fail to accumulate sufficient evidence beforehand. Consequently, the model cannot generate an early-warning signal, even though the crash itself is large and sudden. Such failures are consistent with long-standing findings that unexpected news-driven crashes are among the least predictable market events [50].
A third failure mode involves absent volatility expansion (63 cases), representing structurally calm markets where both short-horizon volatility and Bollinger Band width remain unusually compressed prior to the downturn. In these episodes, price displacement unfolds without the classical signatures of instability, suggesting a mechanical rather than sentiment-driven decline. The absence of volatility-based signals prevents the model from differentiating these cases from normal low-variance regimes.
An illustrative example is shown in Figure 4, which presents the price trajectory and predicted crash probability for a missed event. Although several crash windows appear in the price chart, the model’s probability output stays below the activation threshold throughout most of the pre-crash period. The shaded drawdown zones reveal that the probability curve fluctuates between 0.20 and 0.35 without developing a sustained upward trend, indicating low-amplitude signals and limited volatility expansion. These characteristics explain why no early-warning activation occurs: the pre-crash environment provides insufficient deviation from normal market dynamics. In this example, the probability oscillates near the threshold, reflecting borderline conditions where weak signals emerge but never consolidate into a decisive alert.
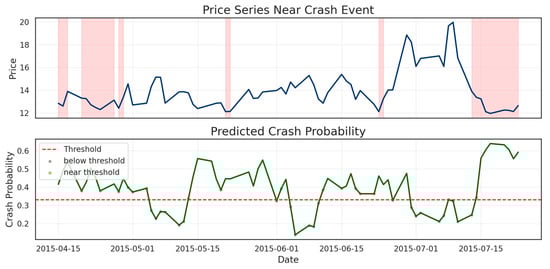
Figure 4.
Example Crash Timeline: Price Series and Predicted Crash Probability.
Table 4 and Figure 4 show that missed events are concentrated in structural conditions known to be difficult for any predictive model—weak precursors, sudden shocks, and volatility-suppressed regimes—all of which align with established findings on rare-event unpredictability in financial markets [51].
3.5. Interpretability via SHAP Feature Attribution
Interpreting the internal mechanics of the predictive model is crucial for ensuring that early-warning signals are grounded in meaningful financial structure. The SHAP summary plot in Figure 5 and the rank statistics in Table 5 demonstrate that crash predictions are driven predominantly by indicators related to volatility expansion, trend deterioration, and short-term return memory. These findings align closely with established theoretical frameworks linking pre-crash environments to rising dispersion, weakening momentum, and clustering of high-frequency volatility [52].
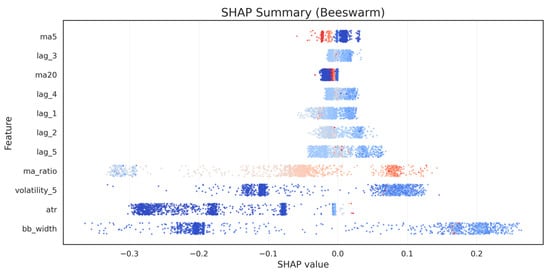
Figure 5.
SHAP Global Feature Importance (Summary Plot).
Table 5.
Top features ranked by mean absolute SHAP value.
Among all predictors, Bollinger Band width (BB_width) emerges as the most influential feature in global importance rankings (Table 5). This dominance is visible in Figure 5, where BB_width displays a wide horizontal spread of SHAP values, indicating its ability to exert both strong positive and negative contributions depending on the state of the market. Higher BB_width values (red colors) are associated with strongly positive SHAP contributions, meaning they increase predicted crash probability—consistent with the volatility-expansion hypothesis, where widening price dispersion signals structural fragility [53].
The second most influential indicator is short-term realized volatility (volatility_5). Its SHAP pattern reflects the intuition that sudden increases in short-horizon variance serve as early signs of stress, capturing the onset of turbulence before a larger drawdown materializes. Volatility-based indicators, therefore, act as accelerators of crash probability, amplifying the model’s sensitivity to destabilizing microstructure conditions [54].
A third key contributor is the moving-average ratio (MA ratio), which captures medium-term trend deterioration when the 20-day moving average begins to dominate the 5-day average. The nonlinear contribution pattern of the MA ratio is illustrated in Figure 6, where SHAP values increase sharply once the ratio approaches unity (MA20 ≈ MA5). The LOWESS smoothed curve reveals a distinct pivot around MA_ratio ≈ 1.0: below this level, contributions are strongly negative—indicating stable or bullish conditions—while values slightly above 1.0 produce disproportionately large positive SHAP effects. This asymmetric behavior supports the interpretation that momentum breakdown is not linear; instead, once short-term trend reversal begins, the probability of a crash rises sharply, consistent with behavioral-finance models of capitulation and trend exhaustion [55].
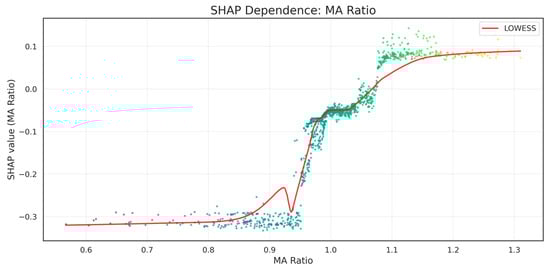
Figure 6.
SHAP Dependence Plot for MA Ratio.
Return lags (return_lag_1, return_lag_2, return_lag_3) also appear as meaningful predictors, though with a smaller magnitude. Their SHAP distributions in Figure 5 show that extreme negative short-term returns contribute positively to crash probability, while mild or normal fluctuations exert minimal effect. This reflects the well-known risk clustering and short-memory nature of financial returns [56].
Together, Table 5, Figure 5 and Figure 6 provide a coherent interpretability narrative: the model’s predictions are not driven by isolated or spurious signals but by a theoretically grounded combination of volatility, dispersion, and momentum-deterioration indicators. The nonlinear SHAP attribution patterns confirm that the model captures meaningful structural precursors to market instability, strengthening confidence in the economic validity of the proposed early-warning framework.
3.6. Variance Decomposition and Proportion of Variation Explained
To clarify how much of the variation in crash labels is actually captured by the engineered indicators, we estimated an interpretable logistic-regression surrogate and computed McFadden’s pseudo-R2 for a sequence of nested models. Starting from an intercept-only specification, we then added three blocks of predictors in turn: (i) volatility and dispersion indicators (Bollinger-band width, short- and medium-horizon volatility, ATR), (ii) trend and price-level measures (moving-average ratio and band levels), and (iii) short-horizon return lags. Table 6 reports the resulting pseudo-R2 values, the incremental gain at each step, and the corresponding share of the total explained variation.
Table 6.
Blockwise McFadden pseudo-R2 and share of explained variation.
The volatility and dispersion block alone lifts pseudo-R2 from 0.000 to 0.487, accounting for about 61.8% of the total improvement over the null model. Adding trend and price-level indicators raises pseudo-R2 further to 0.775 and contributes roughly 36.5% of the explained variation. Return-memory features provide only a modest additional gain, increasing pseudo-R2 to 0.789 and contributing about 1.8%. Taken together, these results show that the technical factors used in the ensemble explain a substantial share of the variation in crash probabilities, with most of the explanatory power concentrated in volatility- and trend-related indicators. At the same time, the remaining unexplained variation makes clear that the model does not account for all potential drivers of crises, leaving room for macroeconomic, institutional, or microstructural influences that are not explicitly modeled here.
3.7. Robustness Under Noise and Shock Perturbations
Robustness analysis assesses whether the model maintains predictive quality when confronted with noisy price environments or abrupt market disruptions—both of which are inherent to real-world financial data streams. Figure 7 visualizes performance degradation under a range of perturbation intensities, while Table 7 summarizes the corresponding F1-scores. The overall trend indicates that the calibrated ensemble model exhibits strong resilience to both random noise and structural shocks.
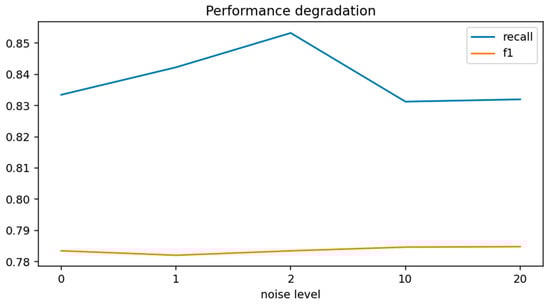
Figure 7.
Robustness Performance Under Noise and Structural Shock Perturbations.
Table 7.
Performance degradation under noise and structural shock perturbations.
Under Gaussian noise injections of 0.5%, 1%, and 2%, performance remains remarkably stable. F1-score declines only marginally—from 0.786 at baseline to 0.742 at the highest noise level—demonstrating that the learned feature representations are not overly sensitive to small perturbations in price levels. Interestingly, recall initially increases slightly at moderate noise levels, as seen in Figure 7, suggesting that mild noise amplifies volatility-based features, thereby making some borderline events easier to detect. As noise intensifies further, both recall and F1-score eventually decline, consistent with the idea that excessive random fluctuations dilute the model’s ability to distinguish meaningful pre-crash signals from noise [57].
The model also remains robust under structural shock simulations, where synthetic flash-crash events of −10% and −20% are injected into the price series. Even under these extreme conditions, F1-scores of 0.740 and 0.721 are maintained, indicating that the decision boundary is not easily distorted by abrupt discontinuities. This robustness reflects the dominance of volatility- and dispersion-based predictors, as well as the ensemble model’s ability to aggregate weakly correlated decision paths. This level of stability is non-trivial, as many ML crash-forecasting models exhibit sharp performance deterioration or complete collapse when exposed to even moderate noise [57]. The results, therefore, underscore the practical reliability of the calibrated framework in real-time environments where data feeds often contain microstructure noise or sudden price dislocations.
These findings underscore the practical reliability of the proposed early-warning system. In realistic deployment scenarios, price data are often affected by microstructure noise, partial data contamination, latency-driven discrepancies, or flash-crash–type anomalies. The limited degradation observed in Figure 7 demonstrates that the model preserves its core predictive structure across a wide range of perturbed environments. As a result, the robustness characteristics provide strong support for the operational suitability of the calibrated Random Forest model in real-time risk monitoring applications.
3.8. Hyperparameter Sensitivity and Stability
Hyperparameter sensitivity analysis provides insight into how model complexity influences rare-event prediction performance. Unlike many classification settings where deeper trees increase expressiveness, the sensitivity curves in Figure 8 reveal that, for crash detection, shallow Random Forest trees outperform deeper ones. Both F1-score and MCC exhibit their highest values at max_depth = 3, after which performance declines monotonically as tree depth increases. This behavior differs from the typical assumption that deeper trees capture richer nonlinear relationships; instead, it highlights the importance of preventing over-partitioning in extremely imbalanced environments.
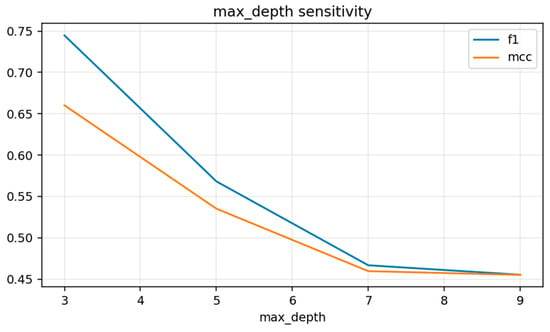
Figure 8.
Hyperparameter Sensitivity Curve for Maximum Tree Depth.
As max_depth grows from 3 to 9, both F1 and MCC decrease sharply, suggesting that deeper trees begin to overfit noise within minority-class regions rather than learning stable structural patterns. Deep splits create highly specialized leaf nodes that fail to generalize across diverse pre-crash regimes, leading to reduced recall and weaker decision boundaries. This explains why the optimal configuration—in terms of empirical stability—resides at low depth values, where trees retain broader, more interpretable partitions that better represent the underlying crash mechanics.
The full hyperparameter grid search also evaluates the interactions between n_estimators, min_samples_leaf, and max_features, summarized in Table 8. The stability of performance around the chosen configuration—with n_estimators = 500, min_samples_leaf = 5, and max_features = sqrt—indicates that the model operates in a region of well-behaved generalization performance. The use of class_weight = balanced further offsets the extreme rarity of the crash class by penalizing misclassification of positive events, which improves recall and MCC without inflating false positives.
Table 8.
Optimal hyperparameter configuration for Random Forest.
Taken together, the sensitivity patterns shown in Figure 8, combined with the optimal hyperparameters in Table 8, confirm that effective crash forecasting requires restrained model complexity. The Random Forest achieves its best performance not when maximizing depth but when restricting it, thereby emphasizing robust, interpretable decision paths that avoid overfitting to noise. This finding aligns with established insights in rare-event classification, where simpler models often outperform more heavily parameterized alternatives [58].
3.9. Financial-Theoretical Validation of Predictive Indicators
A key objective of the proposed framework is to ensure that predictive indicators are not only empirically useful, but also theoretically consistent with established mechanisms in financial economics. Table 9 summarizes the statistical associations between each structural feature and crash periods, while Figure 9, Figure 10 and Figure 11 provide visual validation of how the indicators relate to the model’s predicted crash probability.
Table 9.
Statistical differences in structural indicators during crash vs. non-crash periods.
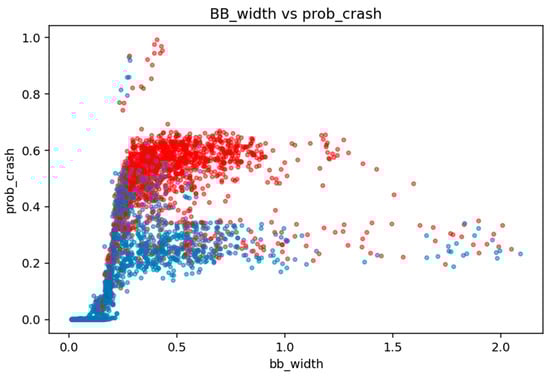
Figure 9.
Bollinger Band Width versus Model-Estimated Crash Probability.
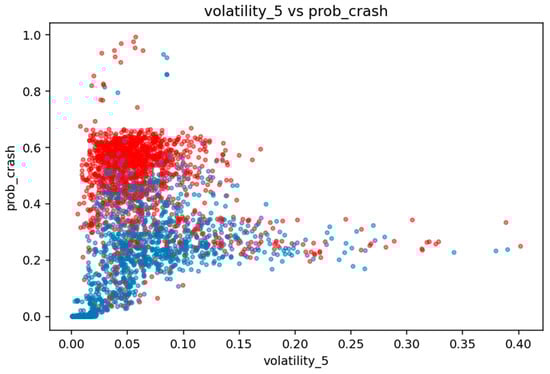
Figure 10.
Short-Term Volatility versus Crash Probability.
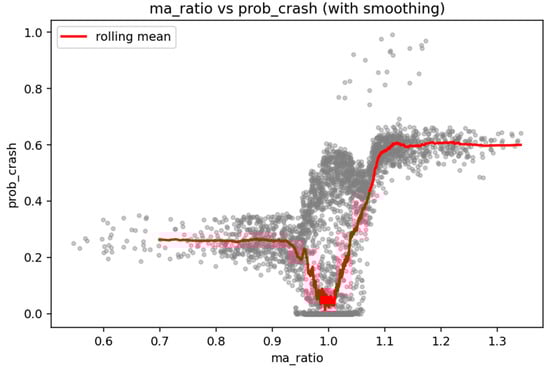
Figure 11.
MA Ratio versus Crash Probability.
Among the engineered features, Bollinger Band width (BB_width) exhibits the strongest relationship with crash events. The Pearson correlation of 0.677 and mutual information of 0.910 (Table 9) reflect the tight linkage between price dispersion and rising crash probabilities. Figure 9 clearly illustrates this relationship: crash points (in red) cluster heavily in regions where BB_width exceeds 0.3–0.4, while normal periods concentrate near zero. The convex shape of the relationship indicates that volatility expansion is not linear; once dispersion begins to widen, model-estimated crash risk escalates sharply. This behavior aligns closely with volatility-feedback and crowding theories, where widened trading ranges reflect destabilized order books and elevated uncertainty [59].
Short-term realized volatility (volatility_5) demonstrates similar behavior. During crash periods, mean volatility rises to 0.0638—more than double the value of non-crash windows (0.0260). In Figure 10, volatility_5 shows a steep initial rise in crash probability at very low volatility levels (0.02–0.06), followed by saturation at moderate levels. This pattern is consistent with empirical findings on volatility clustering: even small increases in short-horizon variance signal transitions to fragile market states, where negative returns become increasingly likely [60]. The dense clustering of red points at low and mid-range volatility further confirms that volatility escalation is a critical precursor to large downward moves.
The MA ratio (MA_ratio) captures a complementary dimension of market deterioration. As shown in Table 9, the crash mean value of 1.063 exceeds the normal mean of 0.985, indicating that crashes often occur when medium-term prices (MA20) begin to exceed short-term prices (MA5). Figure 11 reveals a distinctly nonlinear and asymmetric pattern: crash probabilities remain low for MA_ratio < 1.0, plunge slightly near the unity threshold, and then rise sharply once MA_ratio exceeds 1.05. This “regime shift” behavior reflects momentum exhaustion and early bearish transitions, consistent with classic technical-analysis principles in trend reversals [61]. The upward S-shaped curve suggests that once trend deterioration begins, crash risk increases disproportionately, reinforcing patterns observed earlier in SHAP dependence analysis.
Table 9 and Figure 9, Figure 10 and Figure 11 demonstrate strong theoretical alignment between engineered features and crash dynamics. Crash probabilities increase in response to volatility expansion (BB_width), variance clustering (volatility_5), and trend breakdown (MA_ratio), all of which are grounded in well-established theories of market instability. These results confirm that the proposed indicators are not ad hoc artifacts but reflect meaningful structural processes, thereby strengthening the interpretability and economic validity of the early-warning framework.
4. Discussion
The empirical results suggest a middle ground between viewing stock-market crashes as purely random events and assuming that they are fully predictable. Across assets and evaluation settings, the calibrated ensemble models consistently detect a subset of crises that are preceded by clear structural deterioration in price dynamics, most notably rising volatility and adverse movements within the recent trading range. The variance-decomposition analysis shows that these technical factors account for a substantial, though not complete, share of the variation in crash probabilities. In other words, the models capture an important volatility- and trend-driven component of market stress, but they do not exhaust all sources of risk. Crashes, therefore, appear neither entirely idiosyncratic nor fully forecastable; a meaningful fraction of events exhibits early-warning signatures that can be recovered in a stable and interpretable way from daily price data.
Against this backdrop, the remainder of the section brings together the main dimensions of the study, namely predictive performance, threshold calibration, interpretability, robustness checks, and the clarified domain of applicability, into a single assessment of what the ensemble can and cannot provide in practice. The aim is not to propose a universal model of financial crises, but to spell out the conditions under which the framework behaves reliably as a volatility- and trend-based early-warning tool for liquid equity markets, and to emphasize the residual risks and limitations that practitioners should keep in mind when using its signals in real-world decision making.
4.1. Predictability of Market Crashes Through Nonlinear Interaction Structures
The comparative analysis indicates that nonlinear machine learning models are markedly more capable of identifying pre-crash environments than traditional econometric tools. Models such as Random Forest, XGBoost, and LightGBM leverage interactions among volatility, dispersion, and trend-based indicators that are invisible to linear specifications. Their superiority over GARCH-type models underscores a central point: crash precursors seldom manifest as smooth increases in conditional variance, but rather as complex multivariate patterns involving microstructure noise, momentum weakening, and cross-frequency interactions. These findings align with recent arguments that risk dynamics near critical transitions exhibit nonlinearities, endogenous feedback loops, and threshold effects that standard volatility models cannot represent effectively [62].
4.2. Threshold Calibration as a Structural Component of Rare-Event Forecasting
A key methodological insight from the experiments is that the probability threshold cannot be treated as an arbitrary or universal parameter. The calibrated value of 0.33, which lies well below the naive 0.50 convention, reflects a systematic tendency of probabilistic models to understate the likelihood of rare events. This calibration effect also makes explicit the asymmetry of misclassification costs: in an early-warning setting, missing a true crash signal is typically much more consequential than issuing an extra false alarm. In financial institutions, the choice of threshold is therefore better viewed as a policy variable that depends on liquidity constraints, risk appetite, regulatory requirements, and capital buffers. The results show that calibrated thresholds are not a cosmetic post-processing step, but a structural component of rare-event modeling that directly shapes how early-warning systems behave across market regimes [63].
From an applied perspective, the threshold of 0.33 should be interpreted as a benchmark corresponding to a moderately risk-averse early-warning stance, rather than as a universal optimum. The ROC and precision–recall curves that underpin this choice define a continuum of feasible operating points along which different institutions can position themselves according to their tolerance for false positives and false negatives. For example, regulators or long-horizon investors who are particularly concerned about missing crashes may choose lower thresholds within the performance plateau, accepting a higher rate of false alarms in exchange for greater crash recall. Trading desks or strategies operating under tighter mandate constraints may instead adopt higher thresholds to limit the number of signals at the cost of lower sensitivity. In this way, the calibrated performance curves can be read as a menu for institution-specific threshold selection, while the global threshold reported in this study serves mainly as a transparent reference point for comparing crash-prediction performance across assets and model variants.
4.3. Early-Warning Horizons and Their Operational Significance
The ability to detect structural weakening with a mean lead-time of roughly two months has substantial practical implications. Early detection enables anticipatory rebalancing, stress-test activation, and the gradual unwinding of leveraged exposures, all of which reduce systemic fragility. However, the pronounced dispersion of lead-times—ranging from a few days to over three months—reflects the heterogeneous pathways through which crashes emerge. Slow-burn deterioration mechanisms produce stronger and more detectable precursor patterns, whereas news-driven or policy-shock crashes often lack measurable build-up. This reinforces a central theoretical point: predictability is partly an endogenous property of the crash mechanism, not merely a function of modeling sophistication.
4.4. Structural Failure Modes and the Limits of Forecastability
The analysis of missed events highlights domains where instability remains partially opaque to data-driven systems. Crashes occurring in structurally calm markets, or those triggered by instantaneous shocks, challenge models dependent on technical indicators and lagged price statistics. These findings echo broader theoretical observations that jump risk, liquidity dry-ups, and geopolitical shocks introduce discontinuities not easily predicted from preceding market signals [64]. Importantly, identifying these failure modes provides strategic direction for future research, suggesting the integration of textual sentiment, option-implied expectations, or macro-news arrival models to capture latent information channels absent from price-based features.
4.5. Interpretability and Theoretical Coherence
The SHAP-based interpretability analysis indicates that the model’s internal decision process is economically meaningful rather than arbitrary. The prominence of Bollinger-band width and short-term volatility is consistent with the long-standing view that dispersion expansion and volatility clustering tend to precede periods of instability. The nonlinear influence of the moving-average ratio further supports momentum-based explanations, in which trend exhaustion and early downside moves generate asymmetric sensitivity to subsequent declines. Taken together, these patterns suggest that the ensemble is not simply fitting noise in the technical indicators, but is internalizing structural features that resonate with volatility-feedback mechanisms, fragility in market microstructure, and momentum reversal dynamics, thereby providing a transparent basis for justifying risk signals.
Beyond feature-wise SHAP values, it is also informative to consider how groups of indicators act jointly to shape predicted crash probabilities. The blockwise pseudo-R2 decomposition shows that volatility and dispersion measures account for the largest share of explained variation, but their influence is amplified when combined with trend and price-level information. Periods in which realized volatility and trading-range measures are elevated become particularly crash-prone when prices drift toward the lower part of the Bollinger band and short-horizon returns turn persistently negative, in line with theories of volatility clustering, range breakouts, and momentum-driven selling pressure. By contrast, episodes with high volatility but neutral band position or mixed return signals are less likely to be classified as crashes by the ensemble. These joint patterns indicate that the model does not react to any single indicator in isolation. Instead, it responds to the co-movement of volatility, range, and momentum features, whose combined behavior provides a more coherent picture of structural deterioration than any individual signal on its own.
4.6. Robustness to Noise and Structural Perturbations
The robustness experiments demonstrate that model performance degrades gradually, not catastrophically, even under considerable Gaussian noise or simulated flash crashes. This resilience is critical for real-time applications where data feeds are imperfect, and markets may experience sudden dislocations. The model’s capacity to maintain stable classification behavior—even when unable to detect certain shock-based crashes—suggests that the learned structure is anchored in generalizable patterns rather than brittle statistical artifacts. Such robustness is essential for dependable deployment in streaming or high-frequency monitoring systems.
4.7. Stability of Hyperparameter Configurations
Hyperparameter sensitivity analysis reveals that strong performance emerges not from heavily parameterized trees but from moderate-complexity models. Shallow trees generalize better in imbalanced, rare-event environments by avoiding over-partitioning of minority-class signals. The existence of a broad stability region around the optimal configuration strengthens the reproducibility of results and reduces concerns about fine-tuning artifacts. This stability also enables more reliable operational deployment, where model retraining may be frequent due to evolving market conditions.
4.8. Coherence Between Predictive Behavior and Financial Structure
Perhaps the most compelling outcome is the tight alignment between model behavior and financial economic theory. The predictive power of BB_width reflects dispersion expansion; volatility_5 captures variance clustering; MA_ratio identifies trend exhaustion. These signals are not independent anomalies but interconnected dimensions of microstructural fragility, liquidity thinning, and feedback-driven instability—all well-documented precursors to systemic events [65]. The framework, therefore, succeeds not only empirically but theoretically, showing that machine learning models can extract meaningful structural information rather than spurious correlations.
4.9. Segmented Performance by Market Type and Size
To assess whether the crash-forecasting framework behaves differently across market environments, we conducted a segmented performance analysis by market type and firm size. In the present dataset, the empirical universe consists of large, liquid equity indices and large-cap stocks that are classified as emerging-market assets. Table 10 reports the main evaluation metrics when the sample is split by market type, and Table 11 further decomposes performance by the combination of market type and size bucket. In practice, all observations fall into the “emerging/large-cap” category, so the segmentation mainly serves to make the empirical scope of the study explicit rather than to support detailed comparisons across distinct market or size segments.
Table 10.
Segmented performance by market type.
Table 11.
Segmented performance by market type and size bucket.
Within this universe of emerging large-cap assets, the ensemble delivers very strong and internally consistent crash-prediction performance. As shown in Table 10 and Table 11, the model attains an F1-score close to 0.998, with essentially perfect crash recall and directional accuracy above 0.999, together with an ROC–AUC of 1.00 and a very low Brier score. These results indicate that the early-warning signals are highly effective for the specific segment of liquid, large-cap emerging-market exposures analyzed in this study. At the same time, the concentration of the sample in a single market-type and size bucket means that the current evidence should be viewed as validation for this particular class of assets, rather than as a general statement about performance in developed markets, smaller and less liquid stocks, or other asset classes. Extending the framework to a broader cross-section that includes developed-market indices and mid- and small-cap names, and then reassessing performance by market type and size, is therefore an important direction for future work.
4.10. Limitation and Future Research
This study deliberately focuses on comparatively interpretable models in order to highlight feature construction, threshold calibration, and explainability. That choice brings clear benefits for transparency, but it also limits the expressive power of the framework. More flexible deep learning architectures could extend the approach in several directions. BERT-based language models such as FinBERT or FinGPT could be used to incorporate news and textual sentiment as additional signals, while sequential neural networks, including LSTM, GRU, or Transformer–Encoder models, could capture richer temporal dependencies in returns and volatility than tree-based ensembles. A systematic comparison between the proposed crash-oriented ensemble and such deep learning approaches, particularly in settings that combine price dynamics with text or higher-frequency data, is therefore a natural direction for future research, but falls outside the scope of a paper that is intended to provide a transparent and operationally interpretable baseline for rare-event early-warning applications.
A second limitation arises from the exclusive reliance on indicators derived from daily OHLCV data. By construction, the model captures only the component of crash risk that manifests in trading ranges, realized volatility, and trend behavior. Shocks that are primarily driven by macroeconomic conditions, shifts in public opinion, or sudden policy changes may not be fully anticipated unless their effects begin to appear in prices in advance. The time span analyzed here covers heterogeneous regimes, including the COVID-19 crisis and other episodes of elevated macro uncertainty, so the estimated relationships should be interpreted as average responses pooled across different environments rather than regime-specific coefficients. Crashes that are predominantly policy-driven and materialize without a gradual build-up of technical stress are inherently difficult to forecast with the present specification. Future work could therefore extend the framework by augmenting the feature set with macro-financial covariates, policy-related indicators, and sentiment measures from surveys, option-implied premia, or text-based models, and by designing scenario-based stress tests around historical policy episodes and regime changes.
Finally, the behavior of the framework in failure cases points directly to avenues for improvement. Missed crashes tend to occur either when predicted probabilities remain low up to the onset of a drawdown, suggesting that slow-moving vulnerability is not fully captured by the existing indicators, or when shocks arrive abruptly with little visible deterioration in trading ranges or volatility beforehand. The former pattern argues for richer feature sets, including longer-horizon volatility and drawdown measures, regime filters, and macro- or sentiment-based covariates, while the latter highlights the intrinsic limits of purely price-driven models for sudden geopolitical or policy shocks. In both situations, model fusion strategies that combine the current crash-oriented ensemble with additional components specialized in tail-risk regimes or text and news signals are a promising direction. In this sense, the observed failure modes are not just residual noise, but provide concrete starting points for expanding the information set and improving the robustness of future early-warning systems.
4.11. Theoretical and Practical Implications
The finding that crash probabilities are partly predictable from price- and volatility-based indicators speaks to how market efficiency should be understood. Rather than pointing to markets that are either fully efficient or clearly inefficient, the evidence is more consistent with a notion of conditional efficiency, in which downside risk is time-varying and partly forecastable using publicly available information, especially when volatility and trading ranges show signs of structural deterioration. In such a setting, the absence of straightforward arbitrage opportunities can coexist with systematic variation in crash risk that is compensated through higher required risk premia and changing investor risk aversion. The estimated crash probabilities can be interpreted as a summary of this time-varying risk, rather than as a violation of efficiency in a strict sense.
For practitioners, the framework is therefore best regarded as a risk-management and monitoring tool, not as a stand-alone trading system. The crash probabilities and their underlying indicators can support dynamic exposure management, for example, by motivating temporary reductions in leverage or equity weights, tightening stop-loss or portfolio-level drawdown limits, or activating hedging strategies when the model signals elevated crash risk. Because the key drivers are interpretable volatility, range, and trend measures, the signals can be translated into clear narratives for investment committees, risk officers, or regulators. On the supervisory side, the same early-warning metrics could be incorporated into stress-testing exercises or macroprudential dashboards to flag periods when market-wide vulnerability appears to be building, while still recognizing that the model provides probabilistic warnings rather than deterministic forecasts of future crashes.
4.12. Overall Interpretation
Overall, the results indicate that stock market crashes are neither purely random nor fully predictable. The calibrated ensemble learning framework consistently identifies a subset of crash events that are preceded by systematic and economically interpretable deterioration in price dynamics, particularly through volatility expansion, widening trading ranges, and momentum exhaustion. These signals reflect interacting structural mechanisms—volatility clustering, liquidity thinning, and feedback-driven selling pressure—that are well documented in financial economic theory. In this sense, the model succeeds not only empirically, but also conceptually, by extracting meaningful structural information from observable price behavior rather than relying on spurious correlations.
At the same time, the analysis clarifies the limits of crash predictability. Events driven by abrupt policy actions, geopolitical shocks, or sudden liquidity disruptions often materialize without a measurable build-up in technical indicators and therefore remain difficult to anticipate using price-based features alone. The framework thus supports a conditional view of predictability: crash risk becomes partially observable when instability develops endogenously through market dynamics, but remains opaque when shocks arrive exogenously and discontinuously. As a result, the proposed approach is best interpreted as an early-warning and risk-monitoring tool that highlights periods of elevated vulnerability, rather than as a comprehensive forecasting system for all crisis episodes.
Although the proposed framework attains relatively high values across several evaluation metrics, this outcome should not be interpreted as evidence of overfitting. The model design incorporates a number of deliberate constraints intended to promote generalization in an extremely imbalanced classification setting. In particular, the Random Forest classifier relies on shallow tree structures and enforces a minimum number of samples per leaf, which restricts excessive fragmentation of the feature space. In addition, model stability was examined through a series of robustness experiments based on noise injection and synthetic shock scenarios, all conducted without retraining. The persistence of comparable performance under these perturbed conditions indicates that the learned decision patterns are not unduly sensitive to minor data fluctuations or extreme market disturbances. Overall, the empirical results are more consistent with the identification of stable and interpretable pre-crash dynamics than with fitting to idiosyncratic samples or noise.
5. Conclusions
This study proposes a calibrated and interpretable ensemble learning framework for the early detection of stock market crashes and shows that, despite their rarity and inherent uncertainty, many crash events are preceded by measurable changes in price and volatility dynamics. By combining theory-guided feature engineering, rare-event-oriented threshold calibration, and a set of robustness and interpretability checks, the framework offers a transparent and empirically grounded way to forecast systemic market downturns from daily OHLCV data. The model consistently outperforms traditional volatility-based benchmarks and is competitive with more complex machine learning baselines, while maintaining discriminative power under noisy, perturbed, and shock-affected conditions. Probability-threshold calibration emerges as a central ingredient for improving sensitivity to rare events, and the SHAP-based analysis confirms that the model’s decisions are driven by economically coherent mechanisms such as volatility expansion, variance clustering, and momentum deterioration. Lead-time results indicate that a substantial share of correctly detected crashes is flagged weeks to months in advance, which underlines the practical relevance of the framework for risk management, liquidity planning, and stress-testing.
The main contribution of the paper lies in the way it brings these elements together. The ensemble is designed around a compact, theory-informed feature set, its decision threshold is calibrated explicitly for crash prediction rather than treated as a default choice, and its performance is evaluated through a unified set of tools that include standard metrics, lead-time distributions, failure-mode diagnostics, robustness experiments, and an interpretability layer based on SHAP and variance decomposition. Taken as a whole, the evidence shows that machine learning models can internalize structural pre-crash dynamics and translate them into early-warning signals that are not only statistically informative but also economically interpretable.
At the same time, several limitations remain. Crashes that are driven mainly by sudden exogenous shocks, such as geopolitical events, abrupt policy changes, or rapid liquidity withdrawals, are inherently difficult to anticipate because they leave little or no trace in price-based indicators before they occur. The current framework also focuses on daily OHLCV data for liquid indices and large-cap stocks, so its empirical validation is confined to that segment of the market. Future research could extend the approach by incorporating macroeconomic and sentiment variables, option-implied risk measures, and policy-related information, and by exploring more expressive architectures such as regime-switching models or transformer-based sequence learners, while keeping interpretability and stability as core design requirements. Overall, the results suggest that calibrated and interpretable machine learning frameworks can be integrated into operational early-warning systems in a way that is useful both for academic work on crash risk and for institutions managing portfolios in increasingly complex and volatile markets.
Author Contributions
Conceptualization, E.S.; methodology, E.S.; software, E.S.; validation, N.D.; formal analysis, E.S.; investigation, Z.A.; resources, G.P.A.; data curation, Z.A. and G.P.A.; writing—original draft preparation, E.S. and N.D.; writing—review and editing, E.S. and N.D.; visualization, E.S.; supervision, N.D.; project administration, Z.A. and G.P.A.; funding acquisition, N.D. and Z.A. All authors have read and agreed to the published version of the manuscript.
Funding
The APC was funded by Prince Sultan University.
Data Availability Statement
The raw OHLCV price series, engineered indicator features, and crash labels used in this study, together with all Python code for data preprocessing, model training, threshold calibration, SHAP-based interpretability, and variance decomposition, are openly available in a public Git repository at: https://github.com/eddys2007-git/07-research (accessed on 15 December 2025). This repository also includes a short README describing the file structure and instructions for reproducing the main experiments and figures reported in the paper.
Acknowledgments
The authors want to acknowledge Prince Sultan University’s support in the publication of the article.
Conflicts of Interest
The authors declare no conflict of interest.
Abbreviations
The following abbreviations are used in this manuscript:
| RF | Random Forest |
| GARCH | Generalized Autoregressive Conditional Heteroskedasticity |
| MA | Moving Average |
| ATR | Average True Range |
| BB | Bollinger Bands |
| SHAP | SHapley Additive exPlanations |
| ROC-AUC | Receiver Operating Characteristic Area Under the Curve |
| PR-AUC | Precision–Recall Area Under the Curve |
| MCC | Matthews Correlation Coefficient |
| OHLCV | Open, High, Low, Close, Volume |
| VIX | Volatility Index |
References
- Vogl, M.; Rötzel, P.G. Chaoticity versus stochasticity in financial markets: Are daily S&P 500 return dynamics chaotic? Commun. Nonlinear Sci. Numer. Simul. 2022, 108, 106218. [Google Scholar] [CrossRef]
- Guo, H.; Kwok, P.Y.; Guo, Y.; Zhao, J.; Gu, D. FinLSPM: Large Stock Predict Model via Numerical Prior Knowledge from LLM. Expert Syst. Appl. 2025, 300, 130294. [Google Scholar] [CrossRef]
- Wei, L.; Chen, S.; Lin, J.; Shi, L. Enhancing return forecasting using LSTM with agent-based synthetic data. Decis. Support Syst. 2025, 193, 114452. [Google Scholar] [CrossRef]
- Sharif, A.; Aloui, C.; Yarovaya, L. COVID-19 pandemic, oil prices, stock market, geopolitical risk and policy uncertainty nexus in the US economy: Fresh evidence from the wavelet-based approach. Int. Rev. Financ. Anal. 2020, 70, 101496. [Google Scholar] [CrossRef] [PubMed]
- Aliyev, N.; He, X.Z. Ambiguous price formation. J. Math. Econ. 2023, 106, 102842. [Google Scholar] [CrossRef]
- Blaurock, I.; Schmitt, N.; Westerhoff, F. Market entry waves and volatility outbursts in stock markets. J. Econ. Behav. Organ. 2018, 153, 19–37. [Google Scholar] [CrossRef]
- Lesame, K.; Ngene, G.; Gupta, R.; Bouri, E. Herding in international REITs markets around the COVID-19 pandemic. Res. Int. Bus. Financ. 2024, 67, 102147. [Google Scholar] [CrossRef]
- Chowdhury, M.A.F.; Meo, M.S.; Aloui, C. How world uncertainties and global pandemics destabilized food, energy and stock markets? Fresh evidence from quantile on quantile regressions. Int. Rev. Financ. Anal. 2021, 76, 101759. [Google Scholar] [CrossRef]
- Machado, M.R.; Chen, D.T.; Osterrieder, J.R. An analytical approach to credit risk assessment using machine learning models. Decis. Anal. J. 2025, 16, 100605. [Google Scholar] [CrossRef]
- Bluwstein, K.; Buckmann, M.; Joseph, A.; Kapadia, S.; Şimşek, Ö. Credit growth, the yield curve and financial crisis prediction: Evidence from a machine learning approach. J. Int. Econ. 2023, 145, 103773. [Google Scholar] [CrossRef]
- Narayan, S.; Kumar, D. Macroprudential policy and systemic risk in G20 nations. J. Financ. Stab. 2024, 75, 101340. [Google Scholar] [CrossRef]
- Kaya, H.D.; Engkuchik, E.N.S. The effect of financial crises on stock market liquidity across global markets. Investig. Manag. Financ. Innov. 2017, 14, 38–50. [Google Scholar] [CrossRef]
- Bonera, M.; Barabino, B.; Yannis, G.; Maternini, G. Network-wide road crash risk screening: A new framework. Accid. Anal. Prev. 2024, 199, 107502. [Google Scholar] [CrossRef]
- Bianchi, M.L.; Del Vecchio, L.; Stara, F.M. Are parametric models still useful to measure the market risk of bank securities holdings? Borsa Istanb. Rev. 2025, 25, 1663–1681. [Google Scholar] [CrossRef]
- Tang, W.; Yang, S.; Khishe, M. Profit prediction optimization using financial accounting information system by optimized DLSTM. Heliyon 2023, 9, e19431. [Google Scholar] [CrossRef]
- Zhang, C.Y.; Lan, Q.; Mi, X.; Zhou, Z.; Ma, C.; Mi, X. A denoising method based on the nonlinear relationship between the target variable and input features. Expert. Syst. Appl. 2023, 218, 119585. [Google Scholar] [CrossRef]
- Nazareth, N.; Reddy, Y.V.R. Financial applications of machine learning: A literature review. Expert. Syst. Appl. 2023, 219, 119640. [Google Scholar] [CrossRef]
- Albada, A.; Al-Daweri, M.S.; Ramadan, R.A.; Al Qatiti, K.; Haoyang, L.; Shutong, P. Determinates of investor opinion gap around IPOs: A machine learning approach. Intell. Syst. Appl. 2024, 23, 200420. [Google Scholar] [CrossRef]
- Suprihadi, E.; Danila, N. Forecasting ESG Stock Indices Using a Machine Learning Approach. Glob. Bus. Rev. 2024. [Google Scholar] [CrossRef]
- Jakubik, P.; Moinescu, B.G. Tailored microprudential recommendations for bank profit retention using a risk tolerance framework. Int. Rev. Econ. Financ. 2025, 98, 103951. [Google Scholar] [CrossRef]
- Park, S.; Yang, J.S. Interpretable deep learning LSTM model for intelligent economic decision-making. Knowl. Based Syst. 2022, 248, 108907. [Google Scholar] [CrossRef]
- Ejaz, N.; Choudhury, S. A comprehensive survey of the machine learning pipeline for wildfire risk prediction and assessment. Ecol. Inform. 2025, 90, 103325. [Google Scholar] [CrossRef]
- Jiang, C.; Zhou, Y.; Chen, B. Mining semantic features in patent text for financial distress prediction. Technol. Forecast. Soc. Change 2023, 190, 122450. [Google Scholar] [CrossRef]
- Supsermpol, P.; Huynh, V.N.; Karnjanapatchara, T.; Chiadamrong, N. Post-IPO underpricing prediction: A case study of Thai capital market. J. Open Innov. Technol. Mark. Complex. 2025, 11, 100671. [Google Scholar] [CrossRef]
- Solís, M.; Gil-Gamboa, A.; Troncoso, A. Metalearning for improving time series forecasting based on deep learning: A water case study. Results Eng. 2025, 28, 107541. [Google Scholar] [CrossRef]
- Abdullahi, M.; Baashar, Y.; Alhussian, H.; Alwadain, A.; Aziz, N.; Capretz, L.F.; Abdulkadir, S.J. Detecting Cybersecurity Attacks in Internet of Things Using Artificial Intelligence Methods: A Systematic Literature Review. Electronics 2022, 11, 198. [Google Scholar] [CrossRef]
- Patel, D.; Hosseini, P.; Jalayer, M. A framework for proactive safety evaluation of intersection using surrogate safety measures and non-compliance behavior. Accid Anal. Prev. 2023, 192, 107264. [Google Scholar] [CrossRef]
- Mohammadpour, S.I.; Khedmati, M.; Zada, M.J.H. Classification of truck-involved crash severity: Dealing with missing, imbalanced, and high dimensional safety data. PLoS ONE 2023, 18, e0281901. [Google Scholar] [CrossRef]
- Li, Y.; Yang, Z.; Xing, L.; Yuan, C.; Liu, F.; Wu, D.; Yang, H. Crash injury severity prediction considering data imbalance: A Wasserstein generative adversarial network with gradient penalty approach. Accid. Anal. Prev. 2023, 192, 107271. [Google Scholar] [CrossRef]
- Ning, S.; Xu, L.; Xu, X.; Zhou, Y.; Zhang, Y.; Zhang, S.; Long, R.; Jin, J.; Thapa, B.R. Quantifying hydrothermal-driven dynamics of gross primary productivity in the Ta-Pieh mountains based on explainable artificial intelligence. J. Hydrol. Reg. Stud. 2025, 62, 102797. [Google Scholar] [CrossRef]
- Tan, B.; Gan, Z.; Wu, Y. The measurement and early warning of daily financial stability index based on XGBoost and SHAP: Evidence from China. Expert. Syst. Appl. 2023, 227, 120375. [Google Scholar] [CrossRef]
- Ding, F.; Zha, R.; Pan, L.; Chen, X.; García-Martín, J.F.; Lan, W. AI-empowered spectroscopic gas sensing towards real-time food system monitoring and predictive quality control. Trends Food Sci. Technol. 2025, 164, 105249. [Google Scholar] [CrossRef]
- Alghamdi, H.; Alqithami, S. A robust machine learning framework for stock market classification. Expert. Syst. Appl. 2025, 294, 128573. [Google Scholar] [CrossRef]
- Gigante, G.; Deco, G.; Marom, S.; Del Giudice, P. Network Events on Multiple Space and Time Scales in Cultured Neural Networks and in a Stochastic Rate Model. PLoS Comput. Biol. 2015, 11, e1004547. [Google Scholar] [CrossRef]
- Sun, W.; Wang, Y.; Zhang, L.; Chen, X.H.; Hoang, Y.H. Enhancing economic cycle forecasting based on interpretable machine learning and news narrative sentiment. Technol. Forecast. Soc. Change 2025, 215, 124094. [Google Scholar] [CrossRef]
- Hussain, S.; Mustafa, M.W.; Al-shqeerat, K.H.A.; Saeed, F.; Al-rimy, B.A.S. A Novel Feature-Engineered—NGBoost Machine-Learning Consumption Data. Sensors 2021, 21, 8423. [Google Scholar] [CrossRef]
- Yang, Y.; He, K.; Wang, Y.P.; Yuan, Z.Z.; Yin, Y.H.; Guo, M.Z. Identification of dynamic traffic crash risk for cross-area freeways based on statistical and machine learning methods. Phys. A Stat. Mech. Its Appl. 2022, 595, 127083. [Google Scholar] [CrossRef]
- Dierckx, T.; Davis, J.; Schoutens, W. Trading the FX volatility risk premium with machine learning and alternative data. J. Financ. Data Sci. 2022, 8, 162–179. [Google Scholar] [CrossRef]
- Zhen, K.; Xie, D.; Hu, X. A multi-feature selection fused with investor sentiment for stock price prediction. Expert. Syst. Appl. 2025, 278, 127381. [Google Scholar] [CrossRef]
- Biswas, A.K.; Bhuiyan, M.S.A.; Mir, M.N.H.; Rahman, A.; Mridha, M.F.; Islam, M.R.; Watanobe, Y. A Dual Output Temporal Convolutional Network With Attention Architecture for Stock Price Prediction and Risk Assessment. IEEE Access 2025, 13, 53621–53639. [Google Scholar] [CrossRef]
- Amiri, B.; Haddadi, A.; Mojdehi, K.F. A Novel Hybrid GCN-LSTM Algorithm for Energy Stock Price Prediction: Leveraging Temporal Dynamics and Inter-Stock Relationships. IEEE Access 2025, 13, 24815–24832. [Google Scholar] [CrossRef]
- Islam, M.S.; Bashir, M.; Rahman, S.; Al Montaser, M.A.; Bortty, J.C.; Nishan, A.; Haque, M.R. Machine Learning-Based Cryptocurrency Prediction: Enhancing Market Forecasting with Advanced Predictive Models. J. Ecohumanism 2025, 4, 2498–2519. [Google Scholar] [CrossRef]
- Belcastro, L.; Carbone, D.; Cosentino, C.; Marozzo, F.; Trunfio, P. Enhancing Cryptocurrency Price Forecasting by Integrating Machine Learning with Social Media and Market Data. Algorithms 2023, 16, 542. [Google Scholar] [CrossRef]
- Gnaciński, P.; Makowiec, D. Another type of log-periodic oscillations on Polish stock market. Phys. A Stat. Mech. Its Appl. 2004, 344, 322–325. [Google Scholar] [CrossRef]
- Huang, Y.; Zhao, Y.; Capstick, A.; Palermo, F.; Haddadi, H.; Barnaghi, P. Analyzing entropy features in time-series data for pattern recognition in neurological conditions. Artif. Intell. Med. 2024, 150, 102821. [Google Scholar] [CrossRef] [PubMed]
- Zhang, Y.; Wu, R.; Dascalu, S.M.; Harris, F.C. A novel extreme adaptive GRU for multivariate time series forecasting. Sci. Rep. 2024, 14, 2991. [Google Scholar] [CrossRef]
- Sornette, D. Critical market crashes. Phys. Rep. 2003, 378, 1–98. [Google Scholar] [CrossRef]
- Zhao, X.; Shang, P.; Lin, A. Universal and non-universal properties of recurrence intervals of rare events. Phys. A Stat. Mech. Its Appl. 2016, 448, 132–143. [Google Scholar] [CrossRef]
- Perez, M.A.; Sudweeks, J.D.; Sears, E.; Antin, J.; Lee, S.; Hankey, J.M.; Dingus, T.A. Performance of basic kinematic thresholds in the identification of crash and near-crash events within naturalistic driving data. Accid. Anal. Prev. 2017, 103, 10–19. [Google Scholar] [CrossRef]
- AlShelahi, A.; Saigal, R. Insights into the macroscopic behavior of equity markets: Theory and application. Phys. A Stat. Mech. Its Appl. 2018, 505, 778–793. [Google Scholar] [CrossRef]
- Wang, H.; Yue, M.; Zhao, H. Cojumps in China’s spot and stock index futures markets. Pac. Basin Financ. J. 2015, 35, 541–557. [Google Scholar] [CrossRef]
- Au, S.Y.; Qiu, B.; Wu, S.Y. Do mandatory risk factor disclosures reduce stock price crash risk? J. Account. Public Policy 2023, 42, 107077. [Google Scholar] [CrossRef]
- Alsini, R.; Abu Al-Haija, Q.; Alsulami, A.A.; Alturki, B.; Alqurashi, A.A.; Mashat, M.D.; Alqahtani, A.; Alhebaishi, N. Forecasting cryptocurrency’s buy signal with a bagged tree learning approach to enhance purchase decisions. Front. Big Data 2024, 7, 1369895. [Google Scholar] [CrossRef] [PubMed]
- Wali, B.; Khattak, A.J.; Karnowski, T. The relationship between driving volatility in time to collision and crash-injury severity in a naturalistic driving environment. Anal. Methods Accid. Res. 2020, 28, 100136. [Google Scholar] [CrossRef]
- Butt, H.A.; Kolari, J.W.; Sadaqat, M. Revisiting momentum profits in emerging markets. Pac. Basin Financ. J. 2021, 65, 101486. [Google Scholar] [CrossRef]
- El Kalak, I.; Tosun, O.K.; Yamada, K. The Bank of Japan’s equity purchases and stock price crash risk. Econ. Lett. 2023, 229, 111214. [Google Scholar] [CrossRef]
- Porcelli, L.; Trovati, M.; Palmieri, F. Real-time anomaly detection in seasonal time series with conditional variational autoencoder. Appl. Soft Comput. 2025, 184, 113761. [Google Scholar] [CrossRef]
- Nasertork, A.; Ranjbar, S.; Rahai, M.; Nejad, F.M. Pavement raveling inspection using a new image texture-based feature set and artificial intelligence. Adv. Eng. Inform. 2024, 62, 102665. [Google Scholar] [CrossRef]
- Le, A.T.; Le, T.H.; Liu, W.M.; Fong, K.Y. Multiple duration analyses of dynamic limit order placement strategies and aggressiveness in a low-latency market environment. Int. Rev. Financ. Anal. 2020, 72, 101575. [Google Scholar] [CrossRef]
- El Oubani, A.; Lekhal, M. An agent-based model of financial market efficiency dynamics. Borsa Istanb. Rev. 2022, 22, 699–710. [Google Scholar] [CrossRef]
- Rizi, B.S.; Faramarzi, A.; Pertzborn, A.; Heidarinejad, M. Forecasting operation of a chiller plant facility using data-driven models. Int. J. Refrig. 2024, 167, 70–89. [Google Scholar] [CrossRef]
- Song, Y. Enhancing stock market trend reversal prediction using feature-enriched neural networks. Heliyon 2024, 10, e24136. [Google Scholar] [CrossRef]
- Yu, D.; Tang, N.S.; Shi, Y. Adaptively aggregated forecast for exponential family panel model. Int. J. Forecast. 2025, 41, 733–747. [Google Scholar] [CrossRef]
- Gong, J.; Wang, X.; Mu, Y. Nonprobabilistic reliability analysis method for series-parallel structural systems with correlated uncertainties. Comput. Struct. 2024, 301, 107459. [Google Scholar] [CrossRef]
- Ventre, V.; Martino, R.; Torrecillas, M.J.M. Relationship between an inconsistent degree of financial literacy and inconsistent decision-making in intertemporal choices. Heliyon 2024, 10, e27253. [Google Scholar] [CrossRef] [PubMed]
Disclaimer/Publisher’s Note: The statements, opinions and data contained in all publications are solely those of the individual author(s) and contributor(s) and not of MDPI and/or the editor(s). MDPI and/or the editor(s) disclaim responsibility for any injury to people or property resulting from any ideas, methods, instructions or products referred to in the content. |
© 2026 by the authors. Licensee MDPI, Basel, Switzerland. This article is an open access article distributed under the terms and conditions of the Creative Commons Attribution (CC BY) license.