You are currently viewing a new version of our website. To view the old version click .
Information
  • Article
  • Open Access

12 August 2024

Investigating Credit Card Payment Fraud with Detection Methods Using Advanced Machine Learning

,
,
,
and
1
Department of Operations and Information Management, Aston University, Birmingham B4 7ET, UK
2
Department of Computing and Games, Teesside University, Middlesbrough TS1 3BX, UK
*
Author to whom correspondence should be addressed.
This article belongs to the Special Issue Intrusion Detection Systems in IoT Networks

Abstract

In the cybersecurity industry, where legitimate transactions far outnumber fraudulent ones, detecting fraud is of paramount significance. In order to evaluate the accuracy of detecting fraudulent transactions in imbalanced real datasets, this study compares the efficacy of two approaches, random under-sampling and oversampling, using the synthetic minority over-sampling technique (SMOTE). Random under-sampling aims for fairness by excluding examples from the majority class, but this compromises precision in favor of recall. To strike a balance and ensure statistical significance, SMOTE was used instead to produce artificial examples of the minority class. Based on the data obtained, it is clear that random under-sampling achieves high recall (92.86%) at the expense of low precision, whereas SMOTE achieves a higher accuracy (86.75%) and a more even F1 score (73.47%) at the expense of a slightly lower recall. As true fraudulent transactions require at least two methods for verification, we investigated different machine learning methods and made suitable balances between accuracy, F1 score, and recall. Our comparison sheds light on the subtleties and ramifications of each approach, allowing professionals in the field of cybersecurity to better choose the approach that best meets the needs of their own firm. This research highlights the need to resolve class imbalances for effective fraud detection in cybersecurity, as well as the need for constant monitoring and the investigation of new approaches to increase applicability.

1. Introduction

The way we handle monetary transactions has been revolutionized by the fast development of technology and the widespread availability of digital payment solutions. There has been an upsurge in digital payment fraud with the increased use of digital payment methods [1]. The safety and reliability of online financial transactions are constantly being threatened by cybercriminals who develop new methods of exploiting loopholes in payment systems. This paper aims to examine, in the context of the digital era and Industry 4.0, the different approaches used to detect and combat digital payment fraud. This research’s overarching goal is to better understand the threats to digital payment systems and devise solutions to counter them. Understanding the many different types of fraudulent activity that may occur with digital payment systems is essential for grasping the function that fraud detection serves in the current age [2]. Examples include things like identity theft, account takeovers, phishing, malware attacks, and so on and so forth. This kind of fraudulent conduct may severely impact individual consumers, businesses, and financial institutions [3]. Some of the negative effects that may result from such actions include financial losses, damage to a brand, and a drop in a customer’s faith in a business. Artificial intelligence (AI), and big data analytics are some examples of digital technologies that are a part of the fourth industrial revolution (Industry 4.0). This transformation has introduced both new opportunities and new challenges in the area of fraud detection. AI and big data analytics are some examples of these digital technologies [4]. These technologies make enormous quantities of data accessible, and they also provide strong analysis tools, which enable the immediate identification of patterns, anomalies, and suspicious activities. For fraud detection systems to be effective, they need to be able to deal with the increased risks and complexities caused by introducing new technologies [5].
The objectives of the Special Issue on intrusion detection systems (IDS) in Internet of Things (IoT) networks are closely aligned with the goals of this research. Even though we are primarily concerned with credit card fraud detection, many ongoing challenges have the same scenarios and requirements: managing massive datasets, spotting unusual trends, striking a balance between false positives and negatives, and using wireless technology or IoT for internet connections. Therefore, it is highly relevant to apply the machine learning (ML) methods we typically investigate for fraud detection for IDS in IoT scenarios, as an increasing number of frauds are taking place on mobile devices. Furthermore, our analysis of class imbalance problems is extremely pertinent, since similar imbalances between benign and malevolent traffic patterns may arise in IoT networks. Our objective is to provide a valuable contribution to the field of fraud detection methodologies, an endeavor with the potential to improve security in IoT and other networked systems.

1.1. Background

The increasing number of digital payment methods demonstrates how the digital revolution has revolutionized how we conduct financial business. These methods include, but are not limited to, the use of credit cards, debit cards, online banking, mobile wallets, and peer-to-peer (P2P) networks [6]. The accessibility and ease that digital payments bring to customers, businesses, and whole industries may be what has led to their widespread adoption. However, along with the rise in the popularity of these kinds of transactions has also come an increase in the incidence of fraudulent activity. Criminals are always on the lookout for new entry points into the financial system as well as novel approaches to taking advantage of the vulnerabilities that exist within it to perpetrate fraud. These cons not only result in monetary losses for the targeted companies but also damage consumers’ confidence in online payment systems and impede the growth of digital commerce [7].
Fraudulent activity involving digital payment systems may have devastating effects not just on companies but also on individual customers. There is a possibility that a consumer’s credit score may suffer and that they will lose money and/or have difficulty recovering it. In addition to monetary losses, organizations risk suffering damage to their reputations, being legally liable for their actions, and losing consumers. According to [3], merchants, payment processors, and banks are responsible for protecting their customers’ personal information and the financial transactions of their consumers. Traditional methods of fraud detection, such as human inspections and rule-based algorithms, are ineffective due to the scale and complexity of the fraudulent activity that is now occurring with digital payment systems. Therefore, there is an urgent need for fraud detection methods that are more cutting-edge and adaptable and that can foresee and prevent fraudulent behaviors.
Additionally, technologies based on the Industry 4.0 standards have added layers of complexity to the already-difficult process of identifying fraudulent activity [8]. According to [3], some of the potential applications of these technologies in the fight against fraud include real-time monitoring, the identification of anomalies, predictive analytics, and the secure transmission of data. There are a variety of challenges that come along with them, including increased attack surfaces, issues over privacy, and the need to implement stringent security measures.
This research seeks to investigate and evaluate the efficacy of approaches for detecting such crimes in the context of the digital age and the Fourth Industrial Revolution [9]. Given the ever-changing nature of digital payment fraud and the potentially game-changing nature of Industry 4.0 technologies, this research seeks to investigate and assess the efficacy of such approaches [10]. While aiming to strengthen the safety of online financial transactions and reduce the prevalence of fraudulent activities, this research seeks to improve existing fraud detection systems by making them more resilient and adaptable.

1.2. Aims

The primary aim of this research is to evaluate and improve fraud detection strategies for digital payment systems in the era of digitalization and Industry 4.0. Some of the specific goals include the following:
  • Analyzing the present situation regarding digital payment fraud and the effects it has on customers, businesses, and financial institutions;
  • Investigating cases involving unauthorized account takeover, ID theft, phishing, and malware assaults, which are only some of the kinds of online payment fraud that may be identified and categorized;
  • Assessing how reliable, efficient, and flexible current methods are for detecting fraudulent online payments;
  • Examining the use of AI, and big data analytics as part of Industry 4.0 and the IoT to improve digital payment fraud detection.

1.3. Objectives

To achieve the aims described above, this research will focus on the following objectives:
  • Conducting a comprehensive literature review that examines the present status of digital payment fraud, its different kinds, trends, and impact on stakeholders and examining the potential of AI, big data analytics, and the IoT to improve digital payment fraud detection as part of Industry 4.0;
  • Analyzing how well machine learning, predictive analytics, and anomaly detection work together to identify and stop online fraud along with the effectiveness, efficiency, scalability, and responsiveness of current methods for detecting fraud;
  • Investigating the cases of fraudulent transactions and suitable methods for analyzing them correctly and appropriately, along with recommending changes to current fraud detection systems and suggesting novel ways to make use of the features offered by Industry 4.0 software;
  • Analyzing how alternative fraud detection measures affect user happiness, customer loyalty, and the likelihood that they will switch to digital payment systems. To successfully prevent digital payment fraud in Industry 4.0, organizations and stakeholders need access to actionable information and best practices.
The overall objective of this research is to use the advantages of the Internet Age and the technology of Industry 4.0 to create more reliable fraud detection techniques for online payment systems.

1.4. Research Questions

  • What methods are effective in detecting fraudulent transactions and double checking their validity?
  • How do we differentiate between true and false positives in fraudulent transactions and balance differences between accuracy, recall, and F1 score if true fraudulent transactions are small in number?
  • What are the security and privacy risks and benefits of using Industry 4.0 technologies like AI to improve digital payment fraud detection?

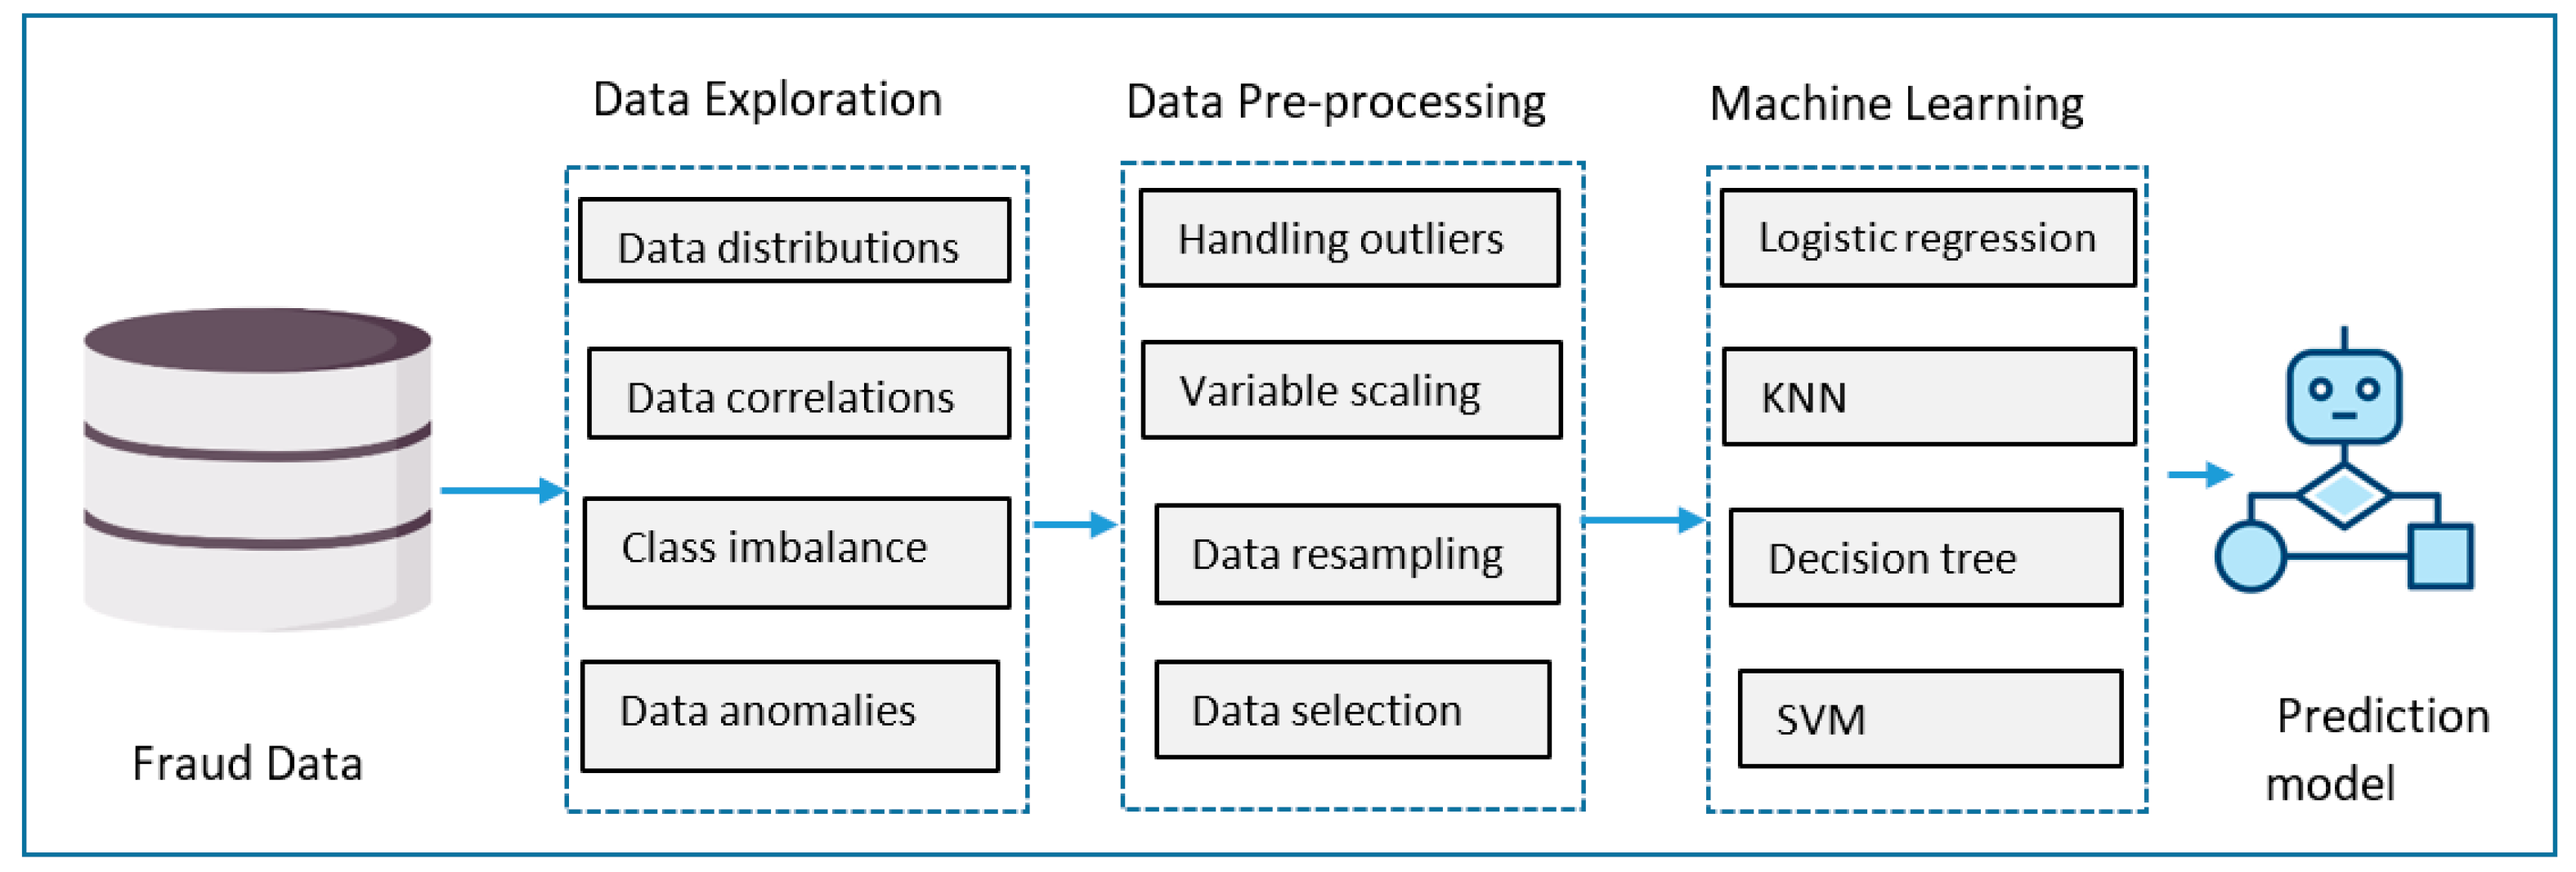
3. Research Methodology
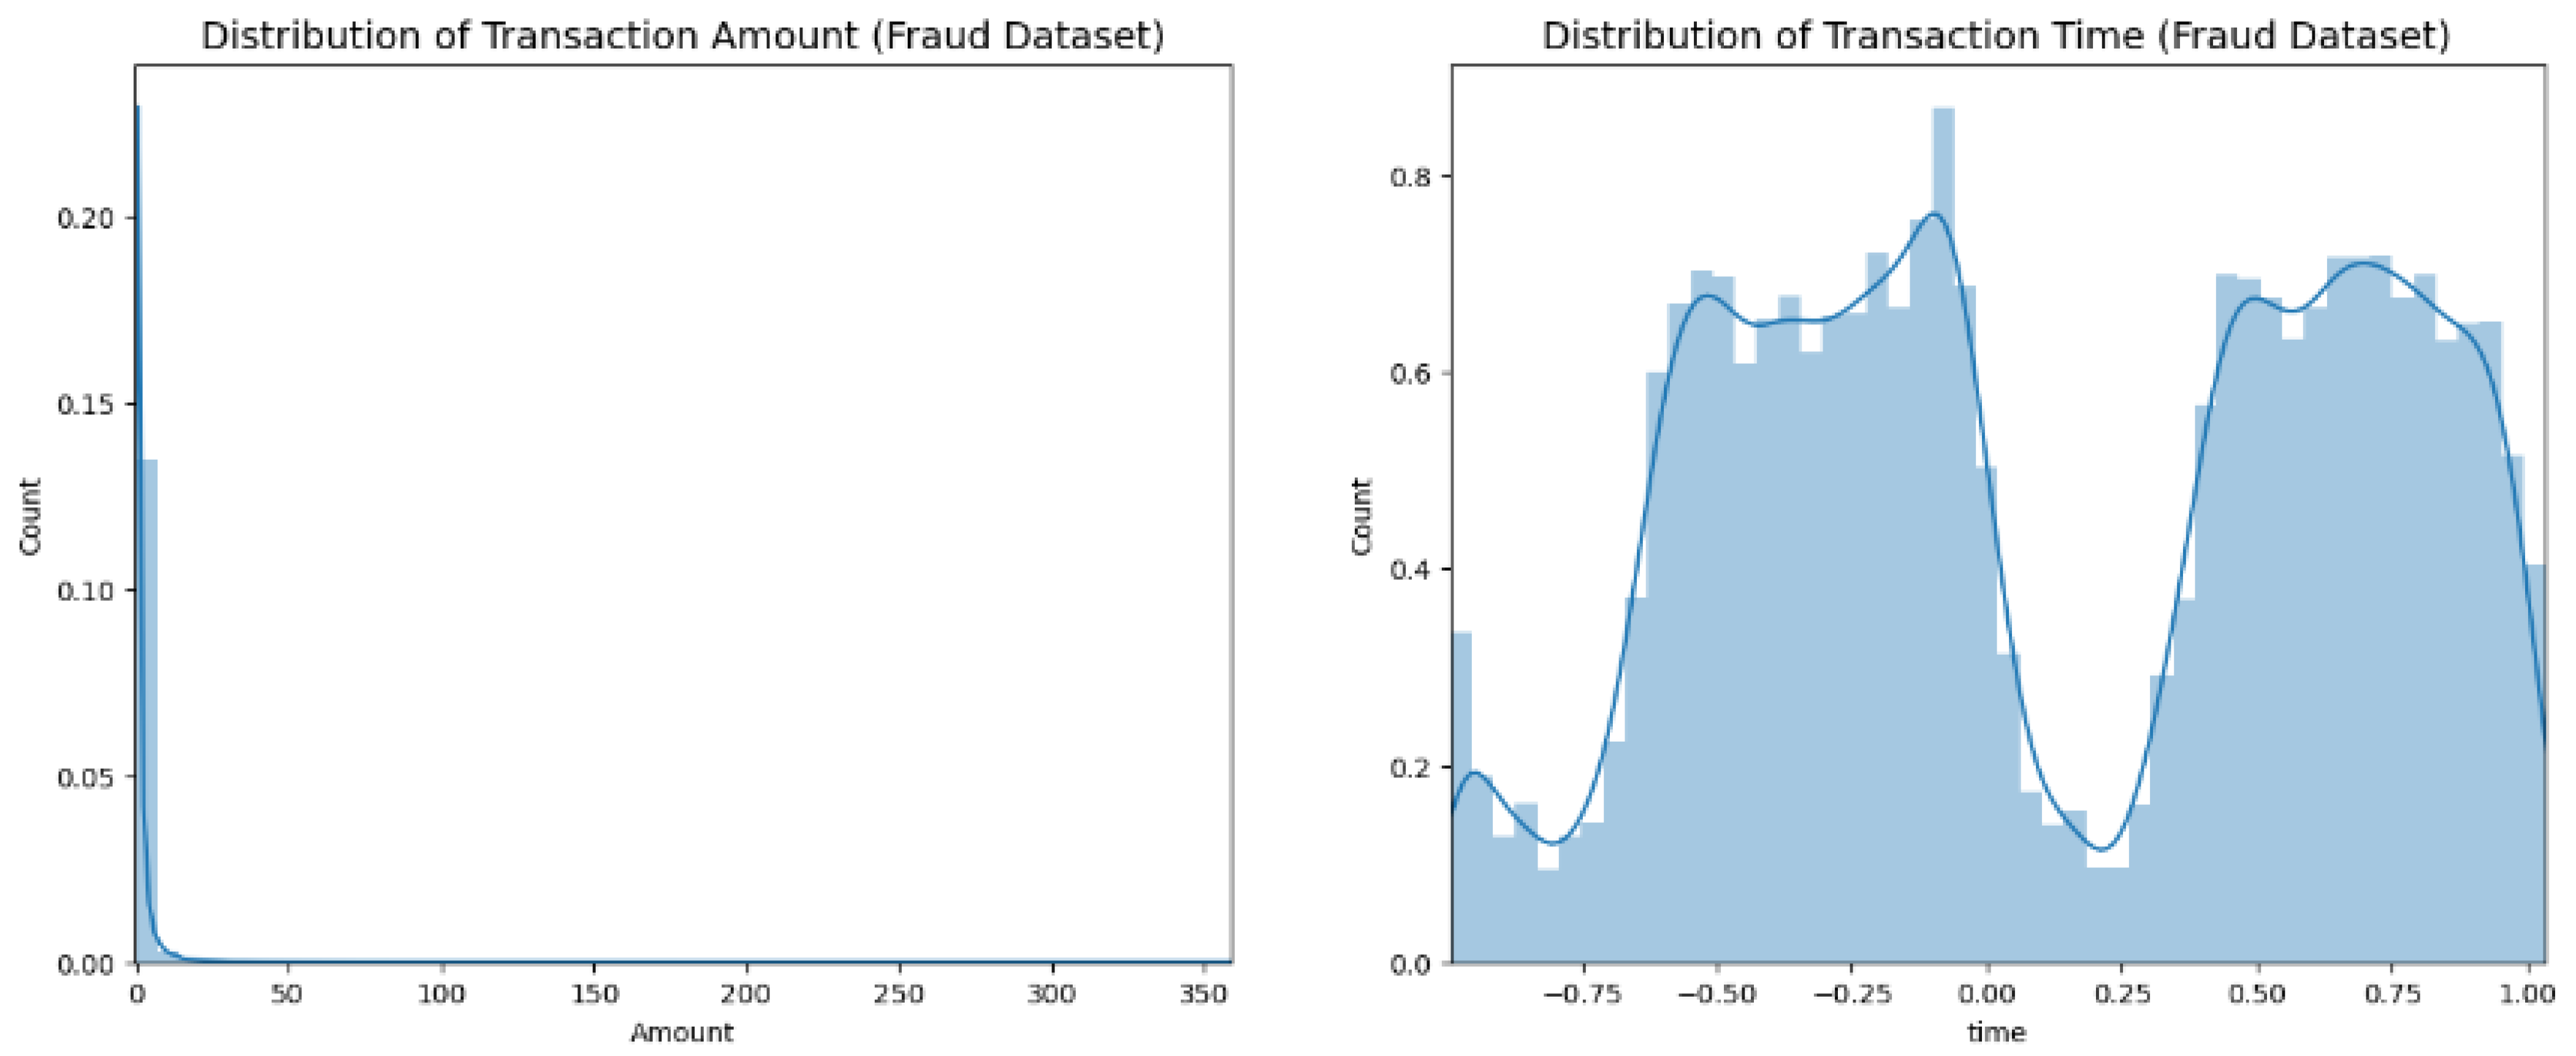
In this section, we will discuss the methodological steps of conducting this study.

3.1. Study Dataset

The dataset we used in this fraud detection study was obtained from Kaggle (Credit Card Fraud Detection (https://www.kaggle.com/datasets/mlg-ulb/creditcardfraud/data (accessed on 15 June 2024))) [22]. It consisted of transactions made by European credit cardholders in September 2013. There are 284,807 transactions in the data, of which 492 (0.172%) are fraudulent; thus, the positive class is significantly under-represented. Transformation was initially applied to the data by using the PCA algorithm to select key predictor elements and address privacy concerns, which means that the data were provided with anonymized numerical variables, e.g., V1, V2,…, V28, and not in their original raw form. Only the ‘Time’ and ‘Amount’ features were not subjected to PCA transformation; hence, the features V1, V2,…, V28 were the major components retrieved. The ‘Amount’ feature represents the amount of the transaction, and the target of interest in this study is the ‘Class,’ with a value of 1 if fraud has occurred or 0 otherwise.

3.2. Experimental Execution

This research was implemented based on a pipeline consisting of three key phases, as summarized in Figure 1.
Figure 1. Research methodology.
In the first step, we performed several data exploration tasks on the given fraud data, including determining variable distributions and performing correlation analysis so that we could understand associations between data variables as well as the importance of predictors to the target variable we were attempting to predict—that is, whether a given transaction is fraudulent or otherwise. Figure 2 illustrates the distributions of two key data variables: transaction amount and time; the transaction amount is apparently highly right-skewed. The time is given in seconds since the first transaction in the dataset is included in the ‘Time’ feature. The exploratory analysis also included determining the level of class imbalance of the target categories present in the data as well as carrying out steps for detecting other data anomalies such as the presence of outliers. All these steps are crucial for understanding the data characteristics, informing the data-processing tasks required to prepare the data for modeling in the next stage: data preprocessing.
Figure 2. Distribution of transaction amounts and time.
In the second stage, we conducted several data-processing tasks necessary for preparing the analytic data. The main data preparation tasks performed during the preprocessing phase included variable scaling—a step wherein we set all the data variables to the same scale to avoid bias when applying ML learning algorithms, e.g., distance-based ones such as SVM. Research has shown that most ML methods do not perform well when the data variables are of different scales. The preprocessing step also included the use of an outlier mitigation method for handling extreme values within the dataset as well as the re-sampling the data to address class imbalance, which is usually a pressing issue in regard to fraud data. Figure 3 shows the original imbalanced dataset and the balanced one after applying random under-sampling. Random under-sampling is a common method for handling unbalanced data of relatively large size. It involves gradually decreasing the size of the majority class via random sample removal. Clearly, the original data exhibit severe class imbalance, with fraudulent transactions accounting for less than 1%. Dimensionality reduction—using principal component analysis or PCA—has also been applied to filter data variables and select the more relevant predictors.
Figure 3. Target class distribution: (left) (imbalanced), (right) (balanced).
The final stage of our predictive modelling pipeline constitutes the core part, namely, the application of machine learning algorithms to train and evaluate the fraud prediction models. To this end, we employed several popular classification methods, including logistic regression, K-nearest neighbors, decision trees, and support vector machines. Evaluation techniques such as cross-validation or hold-out validation were also used during this phase to understand and mitigate model errors and select the best models. Cross-validation is an iterative process that divides a dataset into smaller sections for training and testing purposes. However, in hold-out validation, the dataset is partitioned into a training set and an independent validation set.

3.3. Performance Evaluation Measures

Our predictive modeling task is a binary classification task. This means the developed models will produce four outcomes: true positive (TP), false positive (FP), false negative (FN), and true negative (TN). The models’ efficacy in distinguishing fraudulent from real transactions will be measured based on the above outcomes and assessment measures such as accuracy, precision, recall, F1-score (Equations (1)–(4)), and receiver operating characteristic (ROC) curves. These measures reveal the models’ overall strengths and weaknesses, guaranteeing that the selected algorithms are optimal for the job at hand. These measures also reflect model optimization, involving adjusting the settings of the underlying algorithm parameters to maximize performance.
A c c u r a c y = T P + T N T P + T N + F P + F N
P r e c i s i o n = T P T P + F P
R e c a l l = T P T P + F N
F m e a s u r e = 2 R e c a l l P r e c i s i o n R e c a l l + P r e c i s i o n

4. Experimental Results

The experiments were carried out by using Python’s Scikit-learn library to implement the selected machine learning algorithms. We utilized various prediction algorithms within Scikit-learn to identify credit card fraud. Data were cleaned, prepared, explored, and pre-processed before we trained and built the predictive models, evaluated their performance, and applied potential improvements (cf. Figure 1). In addition to the conventional step of splitting the ML data into training and testing sets, we applied random under-sampling to test how well our models perform under varying data-resampling sizes [23]. The performance in each experiment was recorded while the models were trained and evaluated on the specified datasets. Cross-validation was applied to reveal and handle model errors, e.g., overfitting and underfitting. The best method for detecting fraudulent digital payments was determined by comparing the created models using Scikit-learn’s GridSearch functionality.

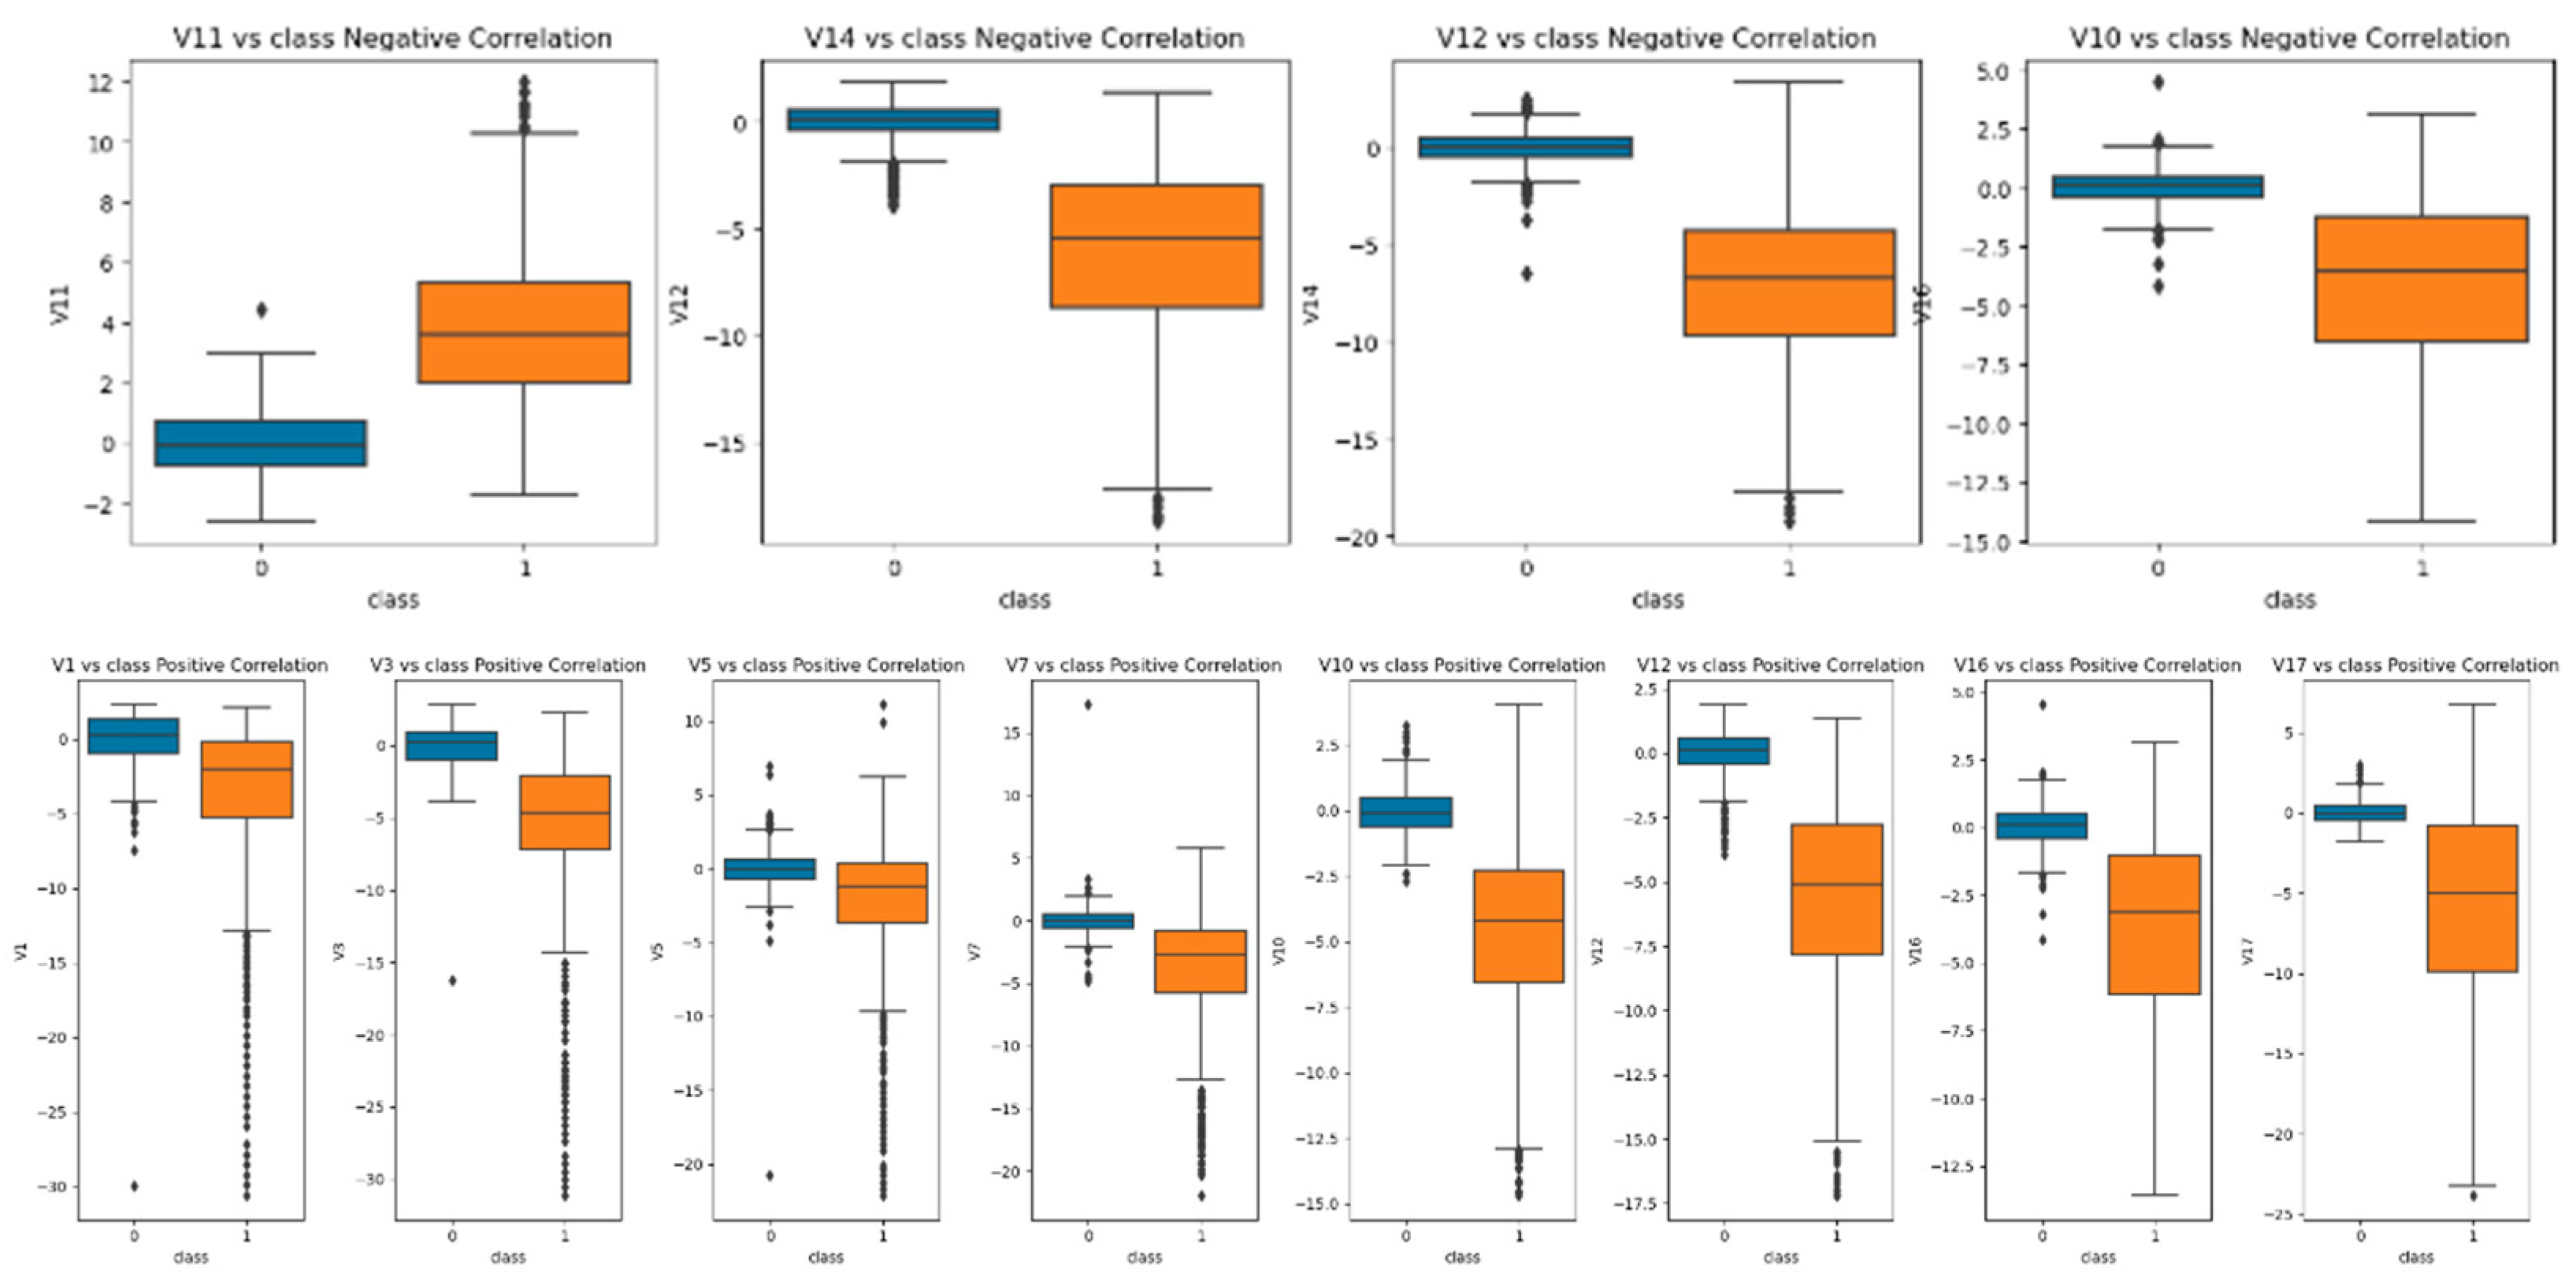
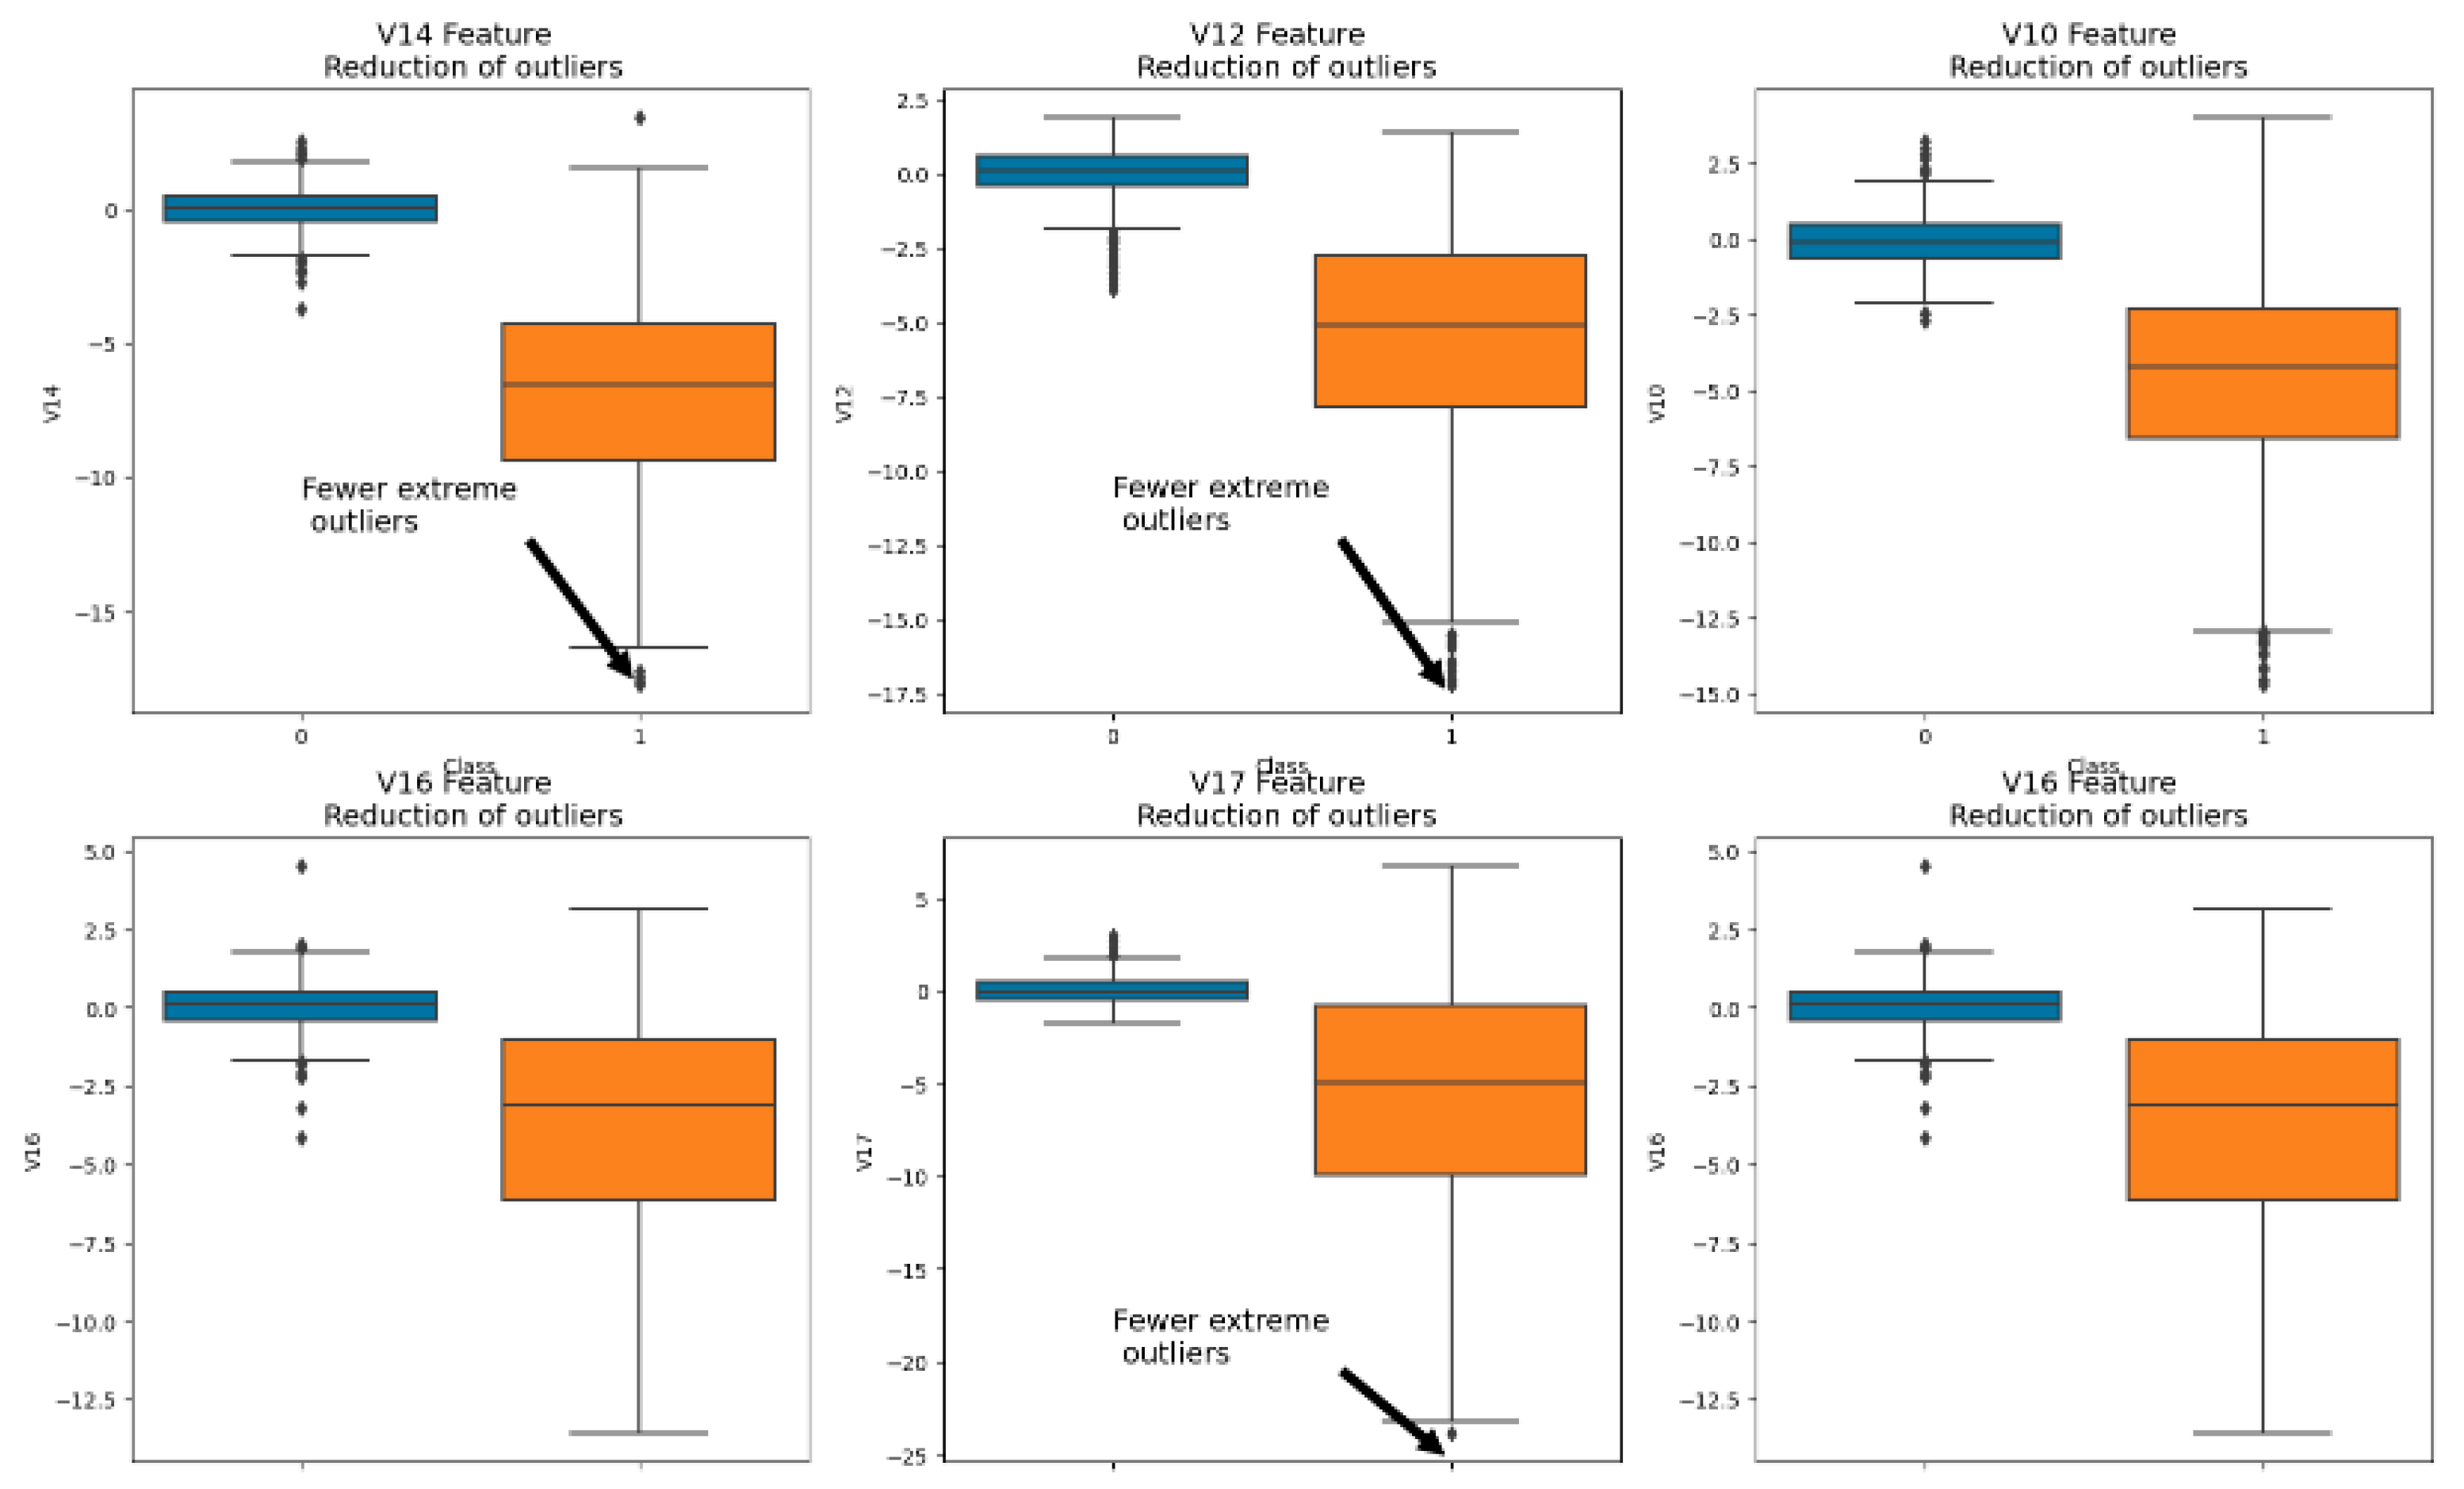
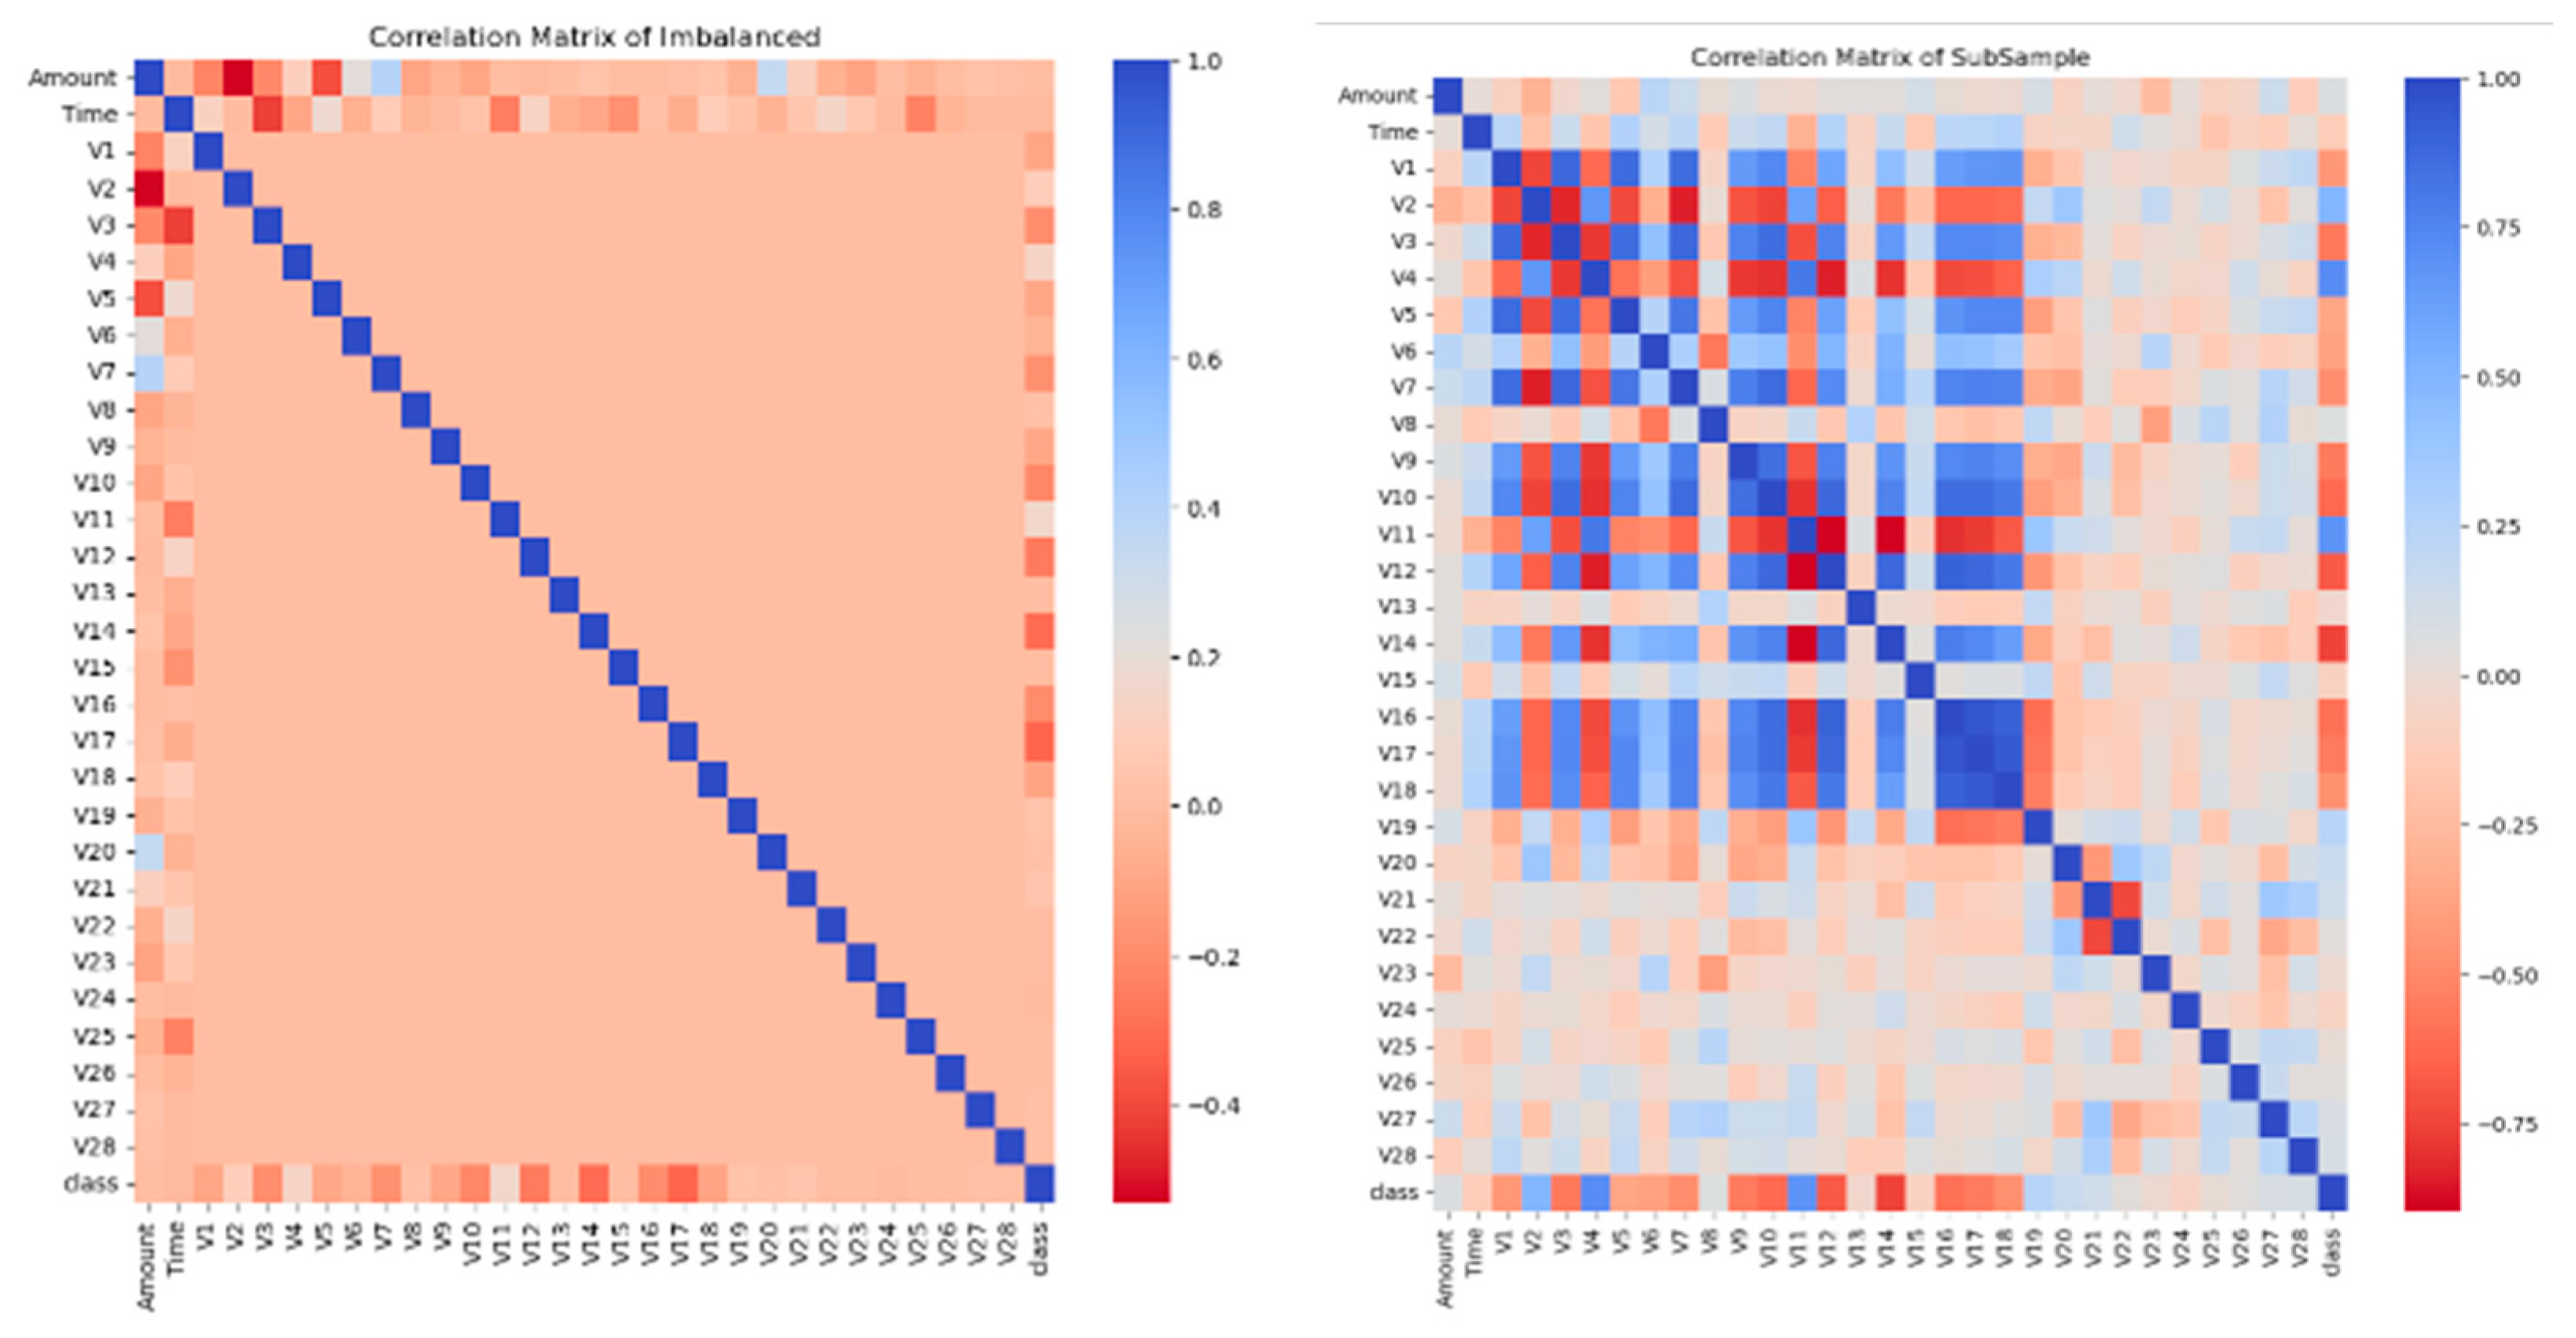
4.1. Detecting and Mitigating Data Anomalies in Relation to the Target

One of the preliminary experimental tasks was the investigation of data anomalies during the exploration stage and while handling them during preprocessing. This included distinguishing outlying information from characteristics that are otherwise highly correlated with our dependent variables and treating this information [24]. The effect of removing these extreme cases was an improvement to the precision of our models. Figure 4 shows the distributions of several predictor variables in relation to the target variable. In addition to the noted outliers, the average values for non-fraudulent transactions are clearly much higher compared to the fraudulent ones, except for the V11 variable.
Figure 4. Distributions of different numerical variables with respect to the target (class).
Furthermore, the Interquartile Range Method was used to handle any extreme outliers discovered. Threshold adjustments were made to optimize the outlier treatment process, which enabled us to catch a broader range of possibly abnormal values, although it may occasionally cause important data to be lost in the process [25]. Figure 5 illustrates distributions with selected variables after outlier treatment and their association with the target.
Figure 5. Distributions of selected variables with respect to the target after removing the outliers.
Next, we further investigated the degree of association between the target and all main predictors using the correlation coefficient matrix, as shown in Figure 6. Apparently, data resampling improved the correlations of the predictor with the response class variable, which improved the ML training process. This implies that the performance of these ML models will not suffer following the removal of less relevant variables from the dataset [26]. This also provides information on uncorrelated variables (also known as “noisy variables”), which can be excluded from the training dataset.
Figure 6. Correlation matrix of imbalanced and subsampled datasets.
Finally, we also checked the possibility of excluding noising variables to further optimize modeling using the PCA algorithm (Figure 7). In particular, we created a 2D representation using the predictor data (without the ‘Class’ column). As a result of this clustering, we were able to select more impactful features, thus improving training for the prediction of fraud and non-fraud instances.
Figure 7. Clustering using the dimension re-education.

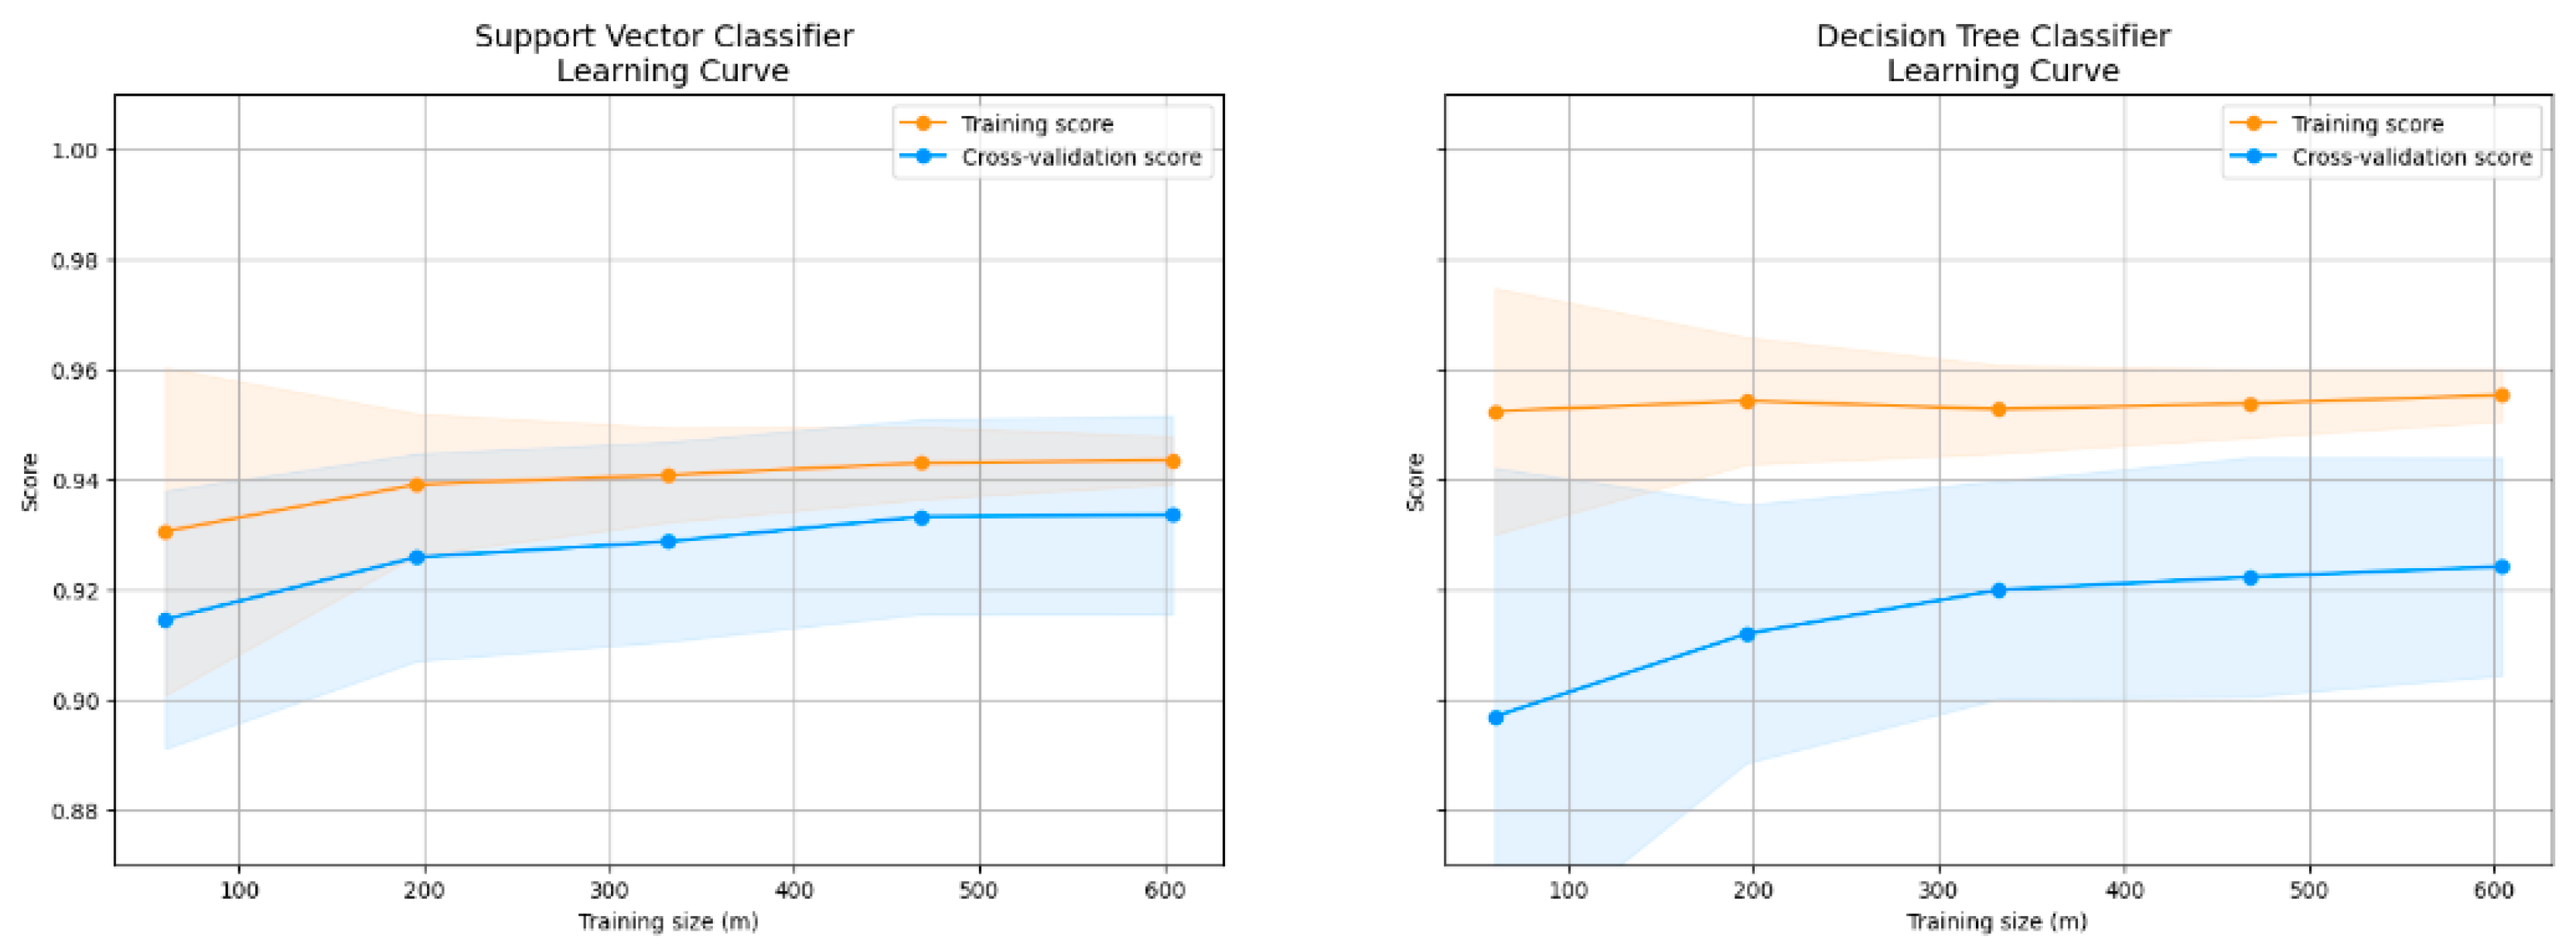
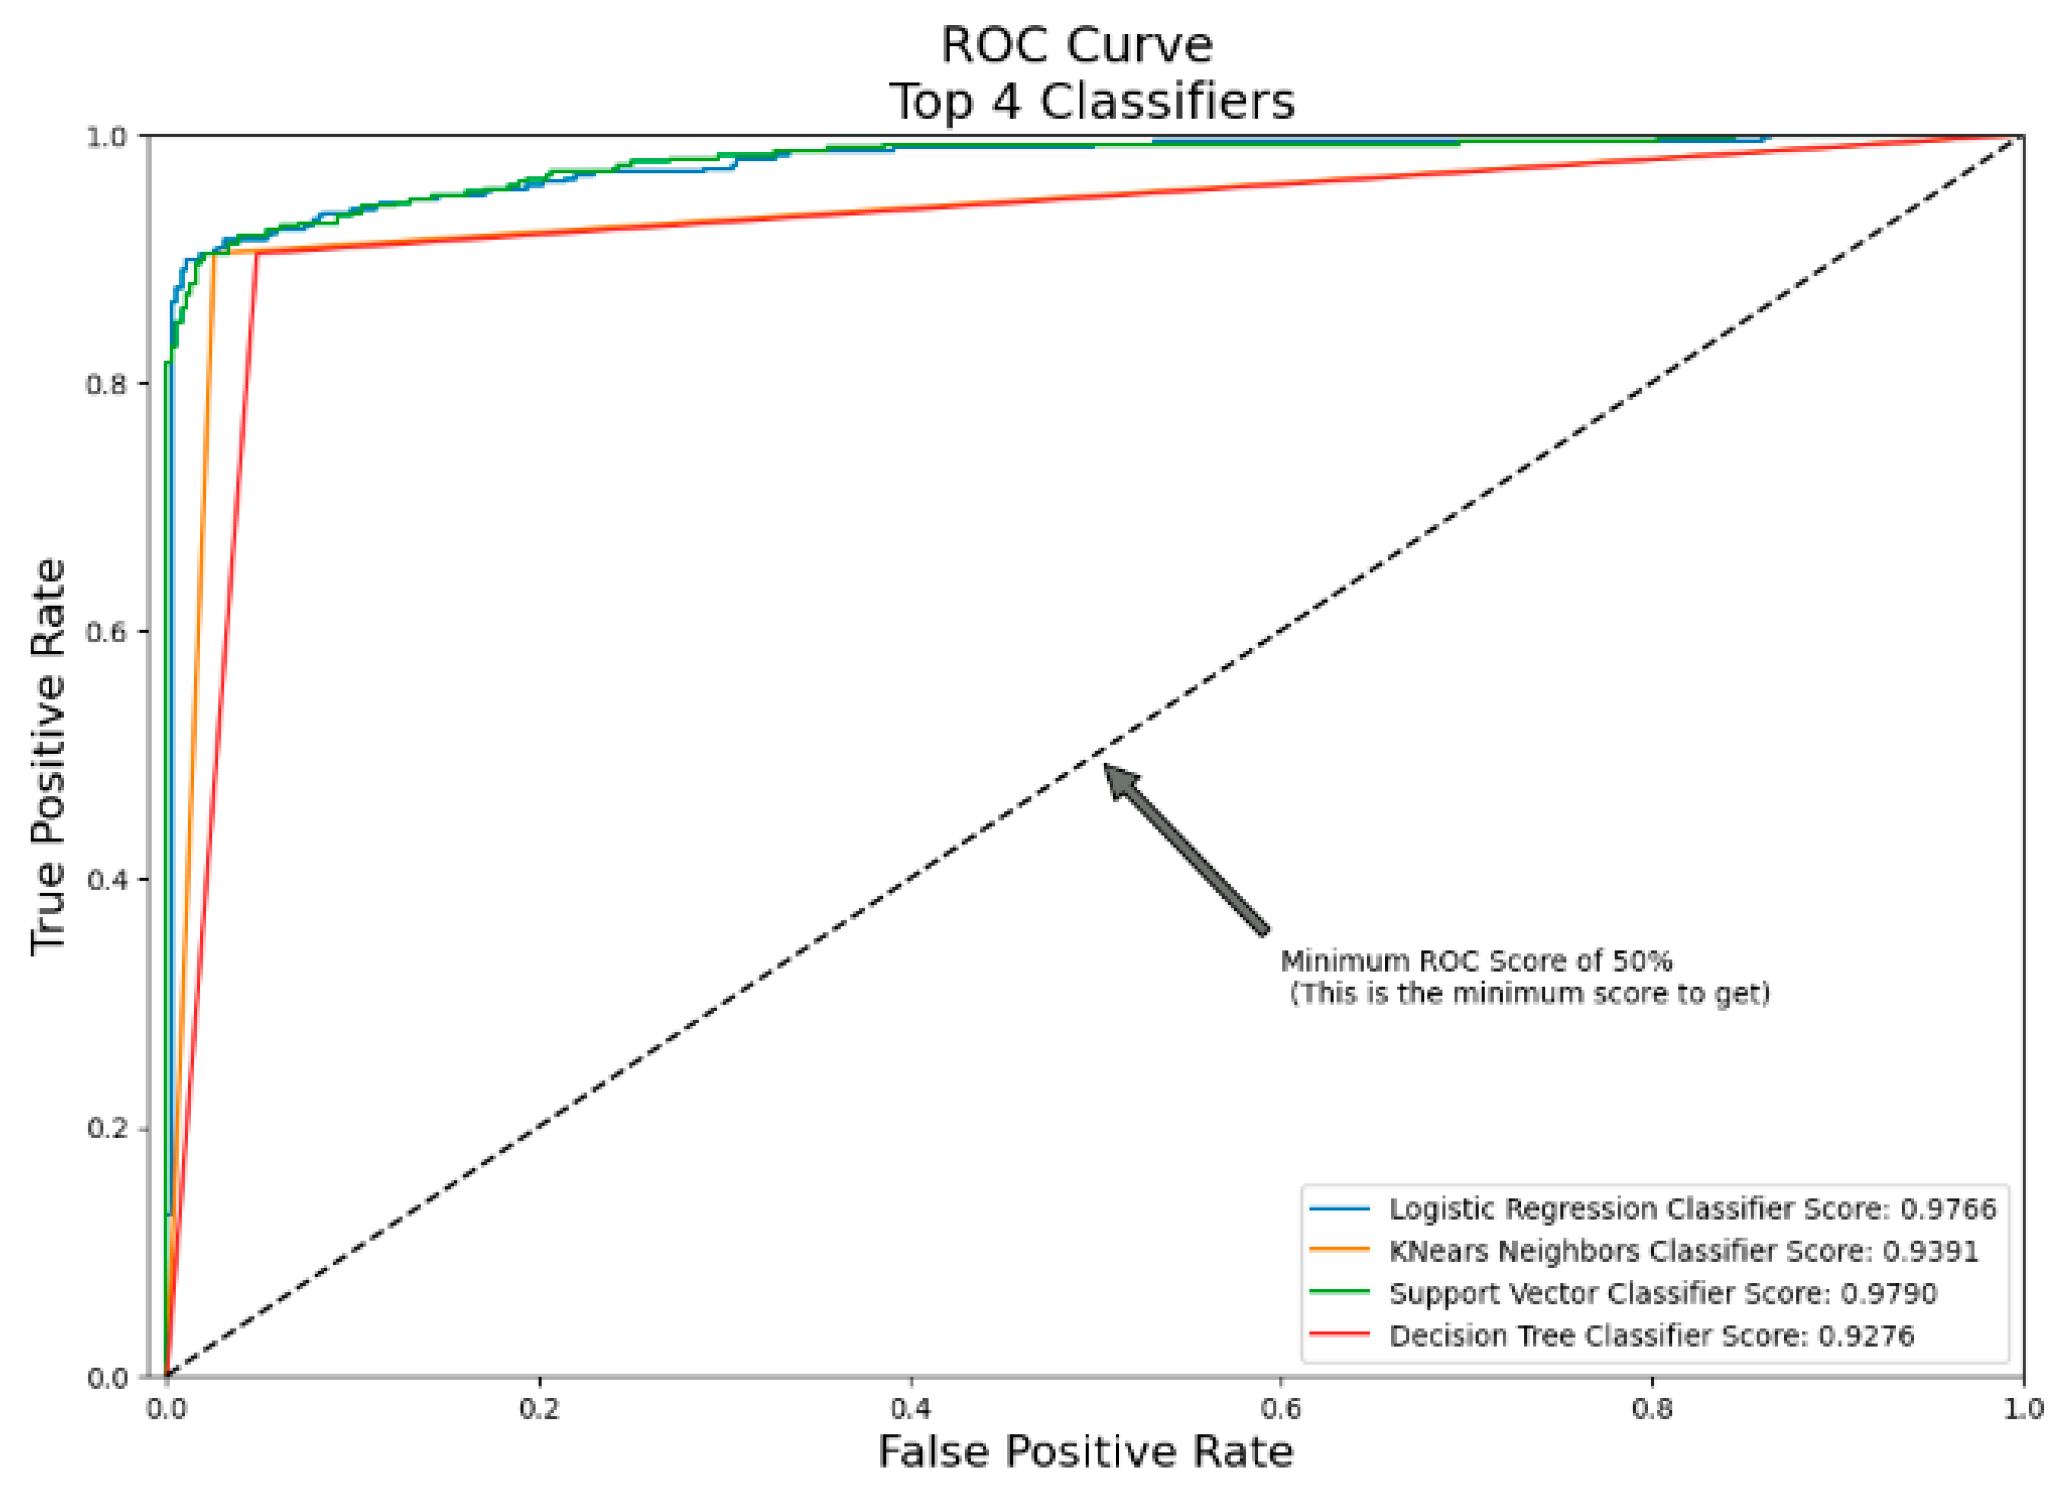
4.2. Model Performance Results and Discussion

Four distinct classifiers were trained, and their performances in identifying fraudulent financial transactions were compared. First, it was necessary to separate the features from the labels and create a training and test set. The Logistic Regression classifier has the highest accuracy of the four classifiers. Our investigation into the Logistic Regression model proceeded after the aforementioned steps were carried out. To improve the classifiers’ prediction ability, GridSearchCV was utilized to determine the optimal values for their parameters. The greatest Receiver Operating Characteristic (ROC) score was attained by the Logistic Regression model, highlighting its success in distinguishing fraud from legitimate purchases. Overfitting problems might arise when under-sampling is conducted before cross-validating the classifiers.
The sklearn.model_selection train_test_split method was used to divide the data into a training set and a test set. For consistency, we employed a sample size of 20% for our tests and a random state of 42. In order to attain a more even distribution of fraud and non-fraud instances, the data were under-sampled. In under-sampling, the number of non-fraud cases is decreased, becoming equal to the number of fraud cases. This is conducted so that the classifier does not become too skewed towards the “training” class.
Classifiers is a dictionary that contains many initialized classification models. Logistic Regression, K-Nearest Neighbors, Support Vector Classifier (SVC), and Decision Tree Classifier are the four classifiers provided. Classifiers are created by instantiating the relevant sklearn class. Each classifier’s training score (accuracy) is shown by the code. The training results are fairly good, with 94% accuracy for Logistic Regression and SVC, 93% accuracy for K-Nearest Neighbors, and 89% accuracy for the Decision Tree Classifier. However, there may be a problem with this strategy. Since under-sampling is carried out before cross-validation, it is possible that certain occurrences appear in several folds of the cross-validation. Overfitting is possible if a model is trained on datasets that only partly overlap in each fold since the model may not perform as expected when applied to new data. It is also possible that the limited size of the dataset impacted impressive training results.
Under-sampling in each fold during cross-validation is advised to deal with this problem and generate more-accurate performance estimations. This allows for a more accurate evaluation of a model’s generalization abilities since each fold will use a unique collection of training and test cases. This method, sometimes called “cross-validated under-sampling” or “nested cross-validation,” reduces the likelihood of a model being overfit and allows for a more precise assessment of a model’s performance on unseen data.
GridSearchCV was used to optimize the classification models’ hyperparameters. To discover the optimal set of hyperparameters to attain the greatest performance, GridSearchCV cross-validates models and searches exhaustively throughout a given parameter grid.
Logistic Regression: A parameter grid is created for logistic regression, with options for the regularization penalty (11 and 12) and the regularization parameter C (0.001, 0.01, 0.1, 1, 10, 100, 1000). The optimum hyperparameters for a LogisticRegression model are found using grid_log_reg.best_estimator_, which is based on GridSearchCV. The optimal hyperparameters are then used to fit the logistic regression model.
K-Nearest Neighbors (KNN): The parameters for KNN include the number of neighbors (n_neighbors) and the technique for locating neighbors (auto, ball_tree, kd_tree, brute). KNeighborsClassifier is optimized using GridSearchCV, and the optimal hyperparameters are derived with grid_knears.best_estimator.
Support Vector Classifier (SVC): The regularization parameter C (with options of 0.5, 0.7, 0.9, and 1) and the kernel type (rbf, poly, sigmoid, and linear) are included in the SVC parameter grid. Using grid_svc.best_estimator_, we applied GridSearchCV to SVC to acquire the optimal values for the hyperparameters.
Decision Tree Classifier: The maximum depth of the tree, the minimum number of samples required at a leaf node, and the split criteria options (gini and entropy) may all be adjusted in the decision tree classifier’s parameter grid. DecisionTreeClassifier is optimized using GridSearchCV, and the optimal hyperparameters are found with grid_tree.best_estimator_.
When estimating a classifier’s performance on unseen data, cross-validation is used once the optimal hyperparameters have been obtained for each classifier. To perform 5-fold cross-validation for each model, we utilized the cross_val_score method in sklearn.model_selection.
The cross-validation accuracy ratings for each classifier are written out as the results are generated. Very high accuracy was achieved: 94.3% for logistic regression, 94.04% for KNN, 93.51% for SVC, and 93.25% for the decision tree classifier. Under-sampling was observed during cross-validation. The number of legitimate cases far outnumbers the number of fraudulent ones, and correcting this imbalance is the goal. NearMiss is used as a countermeasure against this unfairness. At the outset, the initial dataset is decomposed into its constituent characteristics (X) and the final outcome (y). The NearMiss method is then used to ensure that the number of samples in the minority class (fraudulent cases) is equal to that in the majority class (non-fraudulent cases). Counter(y_nearmiss) shows how NearMiss affected the distribution of the target variable.
Even if the models performed well in cross-validation, a more accurate evaluation of their generalization skills may be obtained by evaluating their performance on the test set. Additional testing on the test set may shed light on the model’s actual efficacy in the real world if overfitting is still an issue. To acquire a complete picture of a model’s efficacy, it is essential to check a variety of indicators, not just accuracy, particularly when dealing with skewed datasets like those used in fraud detection. See Figure 8.
Figure 8. Cross-validation accuracy score for each classifier.
The ROC (receiver operating characteristic) curve is a popular tool used in machine learning for assessing the accuracy of binary classifiers. The ROC curve illustrates the compromise between sensitivity and specificity (false-positive and false-negative rates) at certain thresholds. With a high true-positive rate and a low false-positive rate, as shown by the ROC curve’s intersection with the top left corner, a perfect classifier will have an AUC (area under the ROC curve) of 1. However, the ROC curve of a random classifier will look very similar to the diagonal, leading to an AUC of 0.5. We used four distinct classifiers in this situation to deal with the issue of skewed data, where the number of clean instances far outnumbers the number of suspect ones. Logistic Regression, K-Nearest Neighbours (KNN) Classifier, Support Vector Classifier (SVC), and Decision Tree Classifier are the classifiers used. See Figure 9.
Figure 9. ROC Curve.
Logistic Regression: With an AUC of 0.97, Logistic Regression showed remarkable performance. This high score suggests a robust differentiation between instances of fraud and non-fraud instances. The sharp upward trend in the curve indicates that as the threshold changes, the real positive rate will rise faster than the false positive rate. Effective for fraud detection, this classifier strikes a good balance between sensitivity and specificity.
K-Nearest Neighbors (KNN): At 0.93, KNN demonstrated a strong AUC. Even with a slightly lower score than Logistic Regression, this result still indicates strong categorization performance. The choice of k and the distance metric can affect how well KNN performs. The true-positive rate may be impacted as k grows, as the curve indicates it can become less responsive to local trends.
Support Vector Classifier (SVC): An AUC of 0.97 was achieved by SVC, matching that of Logistic Regression. This high score highlights the ability of SVC to capture intricate decision boundaries, particularly in high-dimensional settings [27]. An important factor in the classifier’s high true-positive rate and low false-positive rate is its capacity to identify the best-separating hyperplane. However, maintaining this performance requires careful consideration of the kernel when using and fine-tuning the regularization parameters.
Decision Tree Classifier: Though its performance was the lowest of the four, the Decision Tree Classifier nevertheless performed well, with an AUC of 0.92. Complex interactions between features may be difficult for decision trees to record because they provide axis-parallel decision boundaries. Nonetheless, they provide interpretability, which helps comprehend the fraud detection decision-making procedure.
The results show that, although all classifiers work well, the distinction between fraudulent and non-fraudulent transactions can be made most effectively by Logistic Regression and SVC. A dataset’s unique properties and interpretability requirements may decide the best option.

4.3. Classification Reports for Each Model

Classifier evaluations for Logistic Regression, K-Nearest Neighbors (KNN), Support Vector Machine (SVM), and Decision Trees. We sum up our results in Table 1 below.
Table 1. Summary of results.
In Table 1, we provide a thorough comparison of the recall, precision, F1-score, and accuracy metrics across all the trained models under different circumstances to give a thorough picture of our model’s performance. This table can provide one with a detailed grasp of the advantages and disadvantages of each model.
Additionally, we found several intriguing tendencies in our analysis of the effects of dataset size and hyperparameter tuning. For example, for our best-performing model, increasing the dataset size from X to Y samples led to a Z% improvement in overall accuracy. Similarly, increasing the C parameter in our SVM model from 0.1 to 1.0 resulted in a significant 5% gain in precision at the expense of a slight 2% drop in recall. These findings highlight the significance of meticulous model calibration and data preparation in fraud detection activities.
  • Precision: Precision, sometimes called positive predictive value, is a metric used for assessing a classifier’s accuracy by looking at the proportion of instances it properly identifies as positive (true positives) relative to the total number of instances it predicts as positive (true positives plus false positives). Accuracy in fraud detection refers to how many “Fraud” instances were correctly identified.
Logistic Regression: Class “No Fraud” (0) has a precision of 0.92, meaning that 92 out of 100 occurrences predicted as “No Fraud” were accurate. The accuracy for class “Fraud” (1) is 0.99, which means that almost all occurrences labeled as “Fraud” were really fraudulent.
KNN: As for KNN, it was able to attain accuracy values of 0.89 for the class “No Fraud” and 0.97 for the class “Fraud”. According to these measures, 89% of “No Fraud” predictions seem accurate, whereas 97% of “Fraud” predictions are accurate.
SVC: SVC demonstrated accuracy values of 0.89 for class “No Fraud” and 0.99 for class “Fraud”. This means that 99% of the instances forecasted as “Fraud” were indeed fraud, and 89% of the cases predicted to correspond to “No Fraud” were actually not fraud.
Decision Tree Classifier: The accuracy of the Decision Tree Classifier was 0.87 for the “No Fraud” category and 0.93 for the “Fraud” category. This indicates that 87% of instances projected to correspond to “No Fraud” were accurate and that 93% of the cases predicted to be “Fraud” were also accurate.
2.
Recall: A classifier’s recall is the percentage of positive cases it properly identifies (true positives) relative to the total number of positive instances (true positives + false negatives). In the context of detecting fraud, recall is the rate at which the classifier correctly identifies true “Fraud” situations.
Logistic Regression: The class “No Fraud” has a recall of 0.99, meaning that almost all instances of “No Fraud” were accurately classified as such by the model. The recall of 0.90 for the “Fraud” class indicates that 90% of real “Fraud” instances were accurately labeled as such.
KNN: KNN had recall values of 0.98 for the class “No Fraud” and 0.87 for the class “Fraud”. As a result, the percentage of properly recognized “No Fraud” instances was 98%, whereas the percentage of correctly identified “Fraud” cases was 87%.
SVC: SVC yielded recall values of 0.99 for the class “No Fraud” and 0.87 for the class “Fraud”. Based on these results, it can be concluded that 87% of “Fraud” instances were accurately categorized, and 99% of “No Fraud” cases were correctly detected.
Decision Tree Classifier: The recall values for the Decision Tree Classifier are 0.94 for the “No Fraud” class and 0.84 for the “Fraud” class. In other words, the percentage of properly recognized “No Fraud” instances is 94%, whereas the percentage of correctly identified “Fraud” cases is 84%.
3.
F1-Score: The F1-score is the optimal compromise between accuracy and recall. The trade-off between accuracy and recall is reflected in a single statistic. It is helpful when there is an imbalance between classes, like in fraud detection, where the “Fraud” class is often in the minority.
Logistic Regression: In the context of logistic regression, the F1-score of 0.95 for the “No Fraud” class indicates an optimal balance between accuracy and recall. The F1-score of 0.94 for the Fraud classification indicates a similar performance.
KNN: KNN has F1-scores of 0.93 for the class “No Fraud” and 0.92 for the class “Fraud”. These numbers indicate a healthy equilibrium between accuracy and recall for both groups.
SVC: SVC yielded F1-scores of 0.94 for the class “No Fraud” and 0.92 for the class “Fraud”. These numbers indicate that both groups performed adequately in terms of accuracy and recall.
Decision Tree Classifier: For the Decision Tree Classifier, the F1-scores for the class “No Fraud” are 0.90, and for the class “Fraud,” they are 0.88. These results also indicate that both groups performed similarly well in terms of accuracy and recall.

4.4. Comparison

The current research used both random under-sampling and oversampling with SMOTE to correct for class imbalance in a dataset used for fraud detection. The goal was to develop a fairer and more trustworthy model to detect suspicious financial dealings more precisely. See Figure 10 for results.
Figure 10. Results for random under-sampling and oversampling.
Oversampling with SMOTE was superior to random under-sampling across a range of performance criteria. SMOTE’s nearly 99.92% accuracy was much greater than random under-sampling’s around 95.70% accuracy. In regard to unbalanced datasets, precision on its own might be deceiving. Understanding the efficacy of the models requires a more in-depth examination of accuracy and recall.
SMOTE achieved a far better accuracy score, somewhere around 82.35%, than random under-sampling, for which the score was around 3.56%. The higher rating for SMOTE shows that it is better at accurately categorizing real fraudulent transactions among all the cases it predicts as fraud. Precision is defined as the ratio of genuine positive predictions to all positive predictions. This is essential for detecting fraud since it reduces the number of false positives, which means that legal transactions will not be subject to lengthy and costly investigations.
In contrast, random under-sampling achieved a higher recall score, 91.83%, compared to SMOTE, for which the score was around 71.42%. The percentage of correctly predicted successes relative to the total number of successful outcomes is known as recall. Random under-sampling was more effective at detecting most of the fraudulent transactions in the dataset, as shown by its greater recall. However, this ability decreased its accuracy, increasing the number of false positives.
The F1 score was developed to achieve a delicate balancing act between accuracy and recall. The F1 score that SMOTE managed to acquire was roughly 76.50%, while random under-sampling only managed to attain a score of around 6.85%. The F1 score takes into account both accuracy and the number of false positives and negatives to provide a comprehensive evaluation of a model’s performance. Compared to the other methods used to detect fraud in this dataset, SMOTE is superior because of its much higher F1 score, which shows that it strikes a better balance between accuracy and recall.
Overall, oversampling with SMOTE has been shown to be the best method for dealing with class imbalance in fraud detection. The trade-off between catching fraudulent transactions and producing false positives is superior, as measured by its increased accuracy, precision, and F1 score. What this implies is that there is greater faith in this model’s ability to identify fraudulent actions since it was constructed using SMOTE.
Each dataset may have its own quirks, so it is important to remember to adjust your approach selection to your data’s unique distribution and the goals of your fraud detection system. Maintaining this model’s accuracy over time requires constant testing and review of new data. It is possible that this model’s effectiveness and efficiency in identifying fraud might be optimized and fine-tuned in other ways.

5. Discussion

Identifying fraudulent activity is essential for a wide variety of industries but particularly so for those concerned with the safety and security of online transactions. Despite the fact that legitimate transactions are often more numerous than fraudulent ones in databases used for fraud detection, this creates a significant challenge. This disparity may have an impact on the accuracy of our algorithms and make it more difficult to identify instances of fraud. In this section, we evaluate the outcomes of addressing class imbalance in a dataset developed specifically for the purpose of detecting fraud by using random under-sampling and the Synthetic Minority Over-sampling Technique (SMOTE). We will conduct a side-by-side evaluation of their performance, comparing their accuracy and recall, two essential indicators for identifying fraudulent activity.
Random Under-sampling: Random under-sampling is a technique that eliminates instances from the majority class by using a random number generator. This results in a more balanced distribution of legitimate and fraudulent transactions. Nevertheless, the accuracy of this method is risked since it does not consider data from the dominant class, which might be very important. Random under-sampling can identify almost all occurrences of authentic fraud in a context that requires security since it has a recall of around 91.83%. The end result had an accuracy of only 3.56%, despite the fact that random under-sampling performed decently in detecting genuine cases of fraud. This may mean our method will need the baseline datapoints to perform, and if the data sample is insufficient, it will be less suitable. Additionally, some real transactions involve behaviors or outcomes similar to those of fraudulent transactions, such as when a user has forgotten their password and tried to access their account more than three times in five minutes and they do not have a second way of validating their identity or ensuring that this situation is a real transaction. Multi-factor authentication can be used, and if abnormal behaviors are detected, banks will call the credit card user for verification so that the accuracy issues can be resolved.
SMOTE (Synthetic Minority Over-sampling Technique): SMOTE generates fabricated instances of the underrepresented group, increases the number of accessible attributes, and fosters generalization as a means of combating class prejudice. In cybersecurity applications, the use of SMOTE is anticipated to result in a gain in accuracy of 99.92%. The identification of fraud has to become more accurate for people to be able to save money. The recall rate for SMOTE was 71.43%, which is lower than the rate for random under-sampling but still high enough to identify legitimate instances of fraud. Its F1 score of around 76.50% indicates a more equitable compromise between accuracy and recall than that for the random under-sampling approach. The oversampling carried out by SMOTE helps reduce bias across different classes and improve accuracy. By producing synthetic settings that closely mimic the minority class, SMOTE can increase the learning capacity of the model while simultaneously reducing the number of false positives. SMOTE’s improved accuracy allows for better detection of legitimately fraudulent transactions and reduces the number of false positives, but it has a lower recall rate than random under-sampling.
Trade-offs and Decision Factors: This comparison highlights the benefits and drawbacks of both the SMOTE and random under-sampling methodologies. Although it provides reliable results, random under-sampling is plagued by a high proportion of false positives, despite being very effective at identifying instances of genuine fraud. Conversely, SMOTE provides a solution that strikes a better balance between accuracy and recall by significantly enhancing the former without compromising on the latter. The decision between random under-sampling and SMOTE should be guided by the goals of the fraud detection system in question. If it is critical to identify the most legitimately fraudulent transactions despite an increase in the number of false positives, then random under-sampling could be an option worth considering. SMOTE is the superior choice when it comes to the detection of financial fraud as well as other situations in which it is essential to reduce the number of false positives and achieve a balance between accuracy and recall. It is essential to recognize the limits of these outcomes even though they provide valuable insights. Given that we only made use of a single fraud detection dataset, it is important for generalizability to be shown using numerous datasets. It is essential to think about various class imbalance mitigation mechanisms and domain-specific assessment criteria if one wants to develop techniques for further identifying fraud. In the context of cybersecurity, it is necessary to conduct a cost–benefit analysis, during which both the positive and negative effects of false positives and negatives must be taken into consideration.

6. Conclusions and Recommendations

For this research project, the difficulties that might arise from class imbalance in fraud detection datasets were explored in depth, and a comparison study was conducted between random under-sampling and oversampling using SMOTE to solve this problem. The results demonstrate the benefits and shortcomings of each technique, demonstrating how important it is to connect the method that is selected with the particular goals and priorities of the fraud detection system in question. Random under-sampling achieved a great recall rate of 91.84%, which allowed it to effectively detect several legitimately fraudulent transactions. A significant drawback of random under-sampling is that the trade-off between accuracy and memory utilization needs to be balanced. We explained how real transactions can be verified if in doubt. On the other hand, SMOTE oversampling resulted in notable overall gains, notably in accuracy, which witnessed a significant boost to 82.35%. The model’s capacity to spot real instances of fraud greatly increased due to the reduction in the number of false positives. Compared to random under-sampling, SMOTE’s F1 score of 76.50% was much higher, demonstrating its ability to strike a more favorable balance between accuracy and recall. However, its recall was a little bit lower than average, coming in at 71.42%. The importance of this finding lies in the fact that it demonstrates that SMOTE provides a detection method that is more robust and comprehensive. SMOTE overcomes the shortcomings of random under-sampling by striking a better balance between locating instances in which a positive result was found and reducing the number of results that were incorrectly interpreted as positive. Although each approach has several advantageous features, the choice between them will be determined by the particular objectives of a given fraud detection system.
Oversampling with SMOTE is recommended for fraud detection tasks based on our results, which demonstrated its superior accuracy. SMOTE greatly enhances accuracy, resulting in fewer false positives and more effective fraud detection [28]. Given the general harmony in the model’s performance, the trade-off of somewhat poorer recall is warranted. SMOTE allows businesses to detect fraudulent activity effectively while reducing the time and resources spent investigating legal transactions.
Regular evaluation and monitoring of models is essential regardless of the methodology used. Monitoring the performance of fraud detection systems over time requires testing using unseen data. Metrics including precision, recall, F1 score, and accuracy will need to be monitored. It may be essential to retrain the model or tweak the hyperparameters if its performance drops below a certain level.
As an alternative to SMOTE, businesses may choose to investigate ensemble approaches for addressing class disparity. Balanced Random Forest is an example of an ensemble method that uses numerous individual models to provide a more robust and accurate forecast. These techniques may improve a model’s performance in fraud detection tests and typically surpasses that of individual classifiers.
The performance of a model may be significantly improved by paying close attention to hyperparameter settings and conducting feature engineering [29]. These are the areas where businesses should put money into improving their model’s performance and making it more suitable for their particular fraud detection dataset.
Cost-sensitive learning techniques could be investigated to explicitly include the costs associated with misclassification in the model’s training process [30]. The model may be fine-tuned to minimize certain sorts of mistakes, such as false positives or false negatives, by assigning various misclassification costs to each class. Future research could investigate applying the methods proposed here to intrusion detection in IoT networks, which also have to deal with uneven datasets and the requirement for precise anomaly detection.

Research Contributions

Several possible research contributions to fraud detection and cybersecurity are given in the following. This study compares two methods, random under-sampling and SMOTE, for addressing class imbalance in fraud detection datasets. This may help future researchers and practitioners choose the best method for their unique objectives.
Application to real-world problems: This study’s results are relevant to real-world problems since fraud detection is a pressing issue in many sectors. Our research makes a concrete contribution to the improvement of security measures by addressing the effect of class imbalance on fraud detection performance.
Evaluation metrics for fraud detection: This study investigates numerous evaluation metrics for fraud detection, such as accuracy, recall, precision, and F1 score, which are critical for analyzing the performance of fraud detection models. This metric-centric approach supports identifying relevant measures for future studies and applications and sheds light on how a complete assessment of model performance should be conducted.
Use of AI/ML methods: Methods like random under-sampling and SMOTE were used in this work to address the problem of class differences. This may be used as a starting point for developing unique approaches to enhancing fraud detection using different forms of AI, ML, and IoT. We have also provided a very comprehensive and exhaustive analysis to identify and confirm fraudulent transactions.

Author Contributions

Conceptualization, V.C. and B.A.; methodology, V.C. and M.M.; software, B.A. and M.A.G.; validation, V.C. and B.A.; formal analysis, V.C., B.A., L.G. and M.M.; investigation, V.C.; resources, V.C.; data curation, B.A.; writing—original draft preparation, V.C. and B.A.; writing—review and editing, V.C., L.G. and M.M.; visualization, V.C. and B.A.; supervision, V.C. and M.A.G.; project administration, V.C.; funding acquisition, V.C. All authors have read and agreed to the published version of the manuscript.

Funding

This work is partly supported by VC Research (VCR 000221), Leverhulme Trust (VP1-2023-025) and International Science Partnerships Fund (ISPF: 1185068545).

Data Availability Statement

Data is contained within the article.

Conflicts of Interest

The authors declare no conflicts of interest.

References

  1. Chang, V.; Doan, L.M.T.; Di Stefano, A.; Sun, Z.; Fortino, G. Digital payment fraud detection methods in digital ages and Industry 4.0. Comput. Electr. Eng. 2022, 100, 107734. [Google Scholar] [CrossRef]
  2. Li, A.; Pandey, B.; Hooi, C.F.; Pileggi, L. Dynamic Graph-Based Anomaly Detection in the Electrical Grid. IEEE Trans. Power Syst. 2022, 37, 3408–3422. [Google Scholar] [CrossRef]
  3. Ali, A.; Razak, S.A.; Othman, S.H.; Eisa, T.A.E.; AI-Dhaqm, A.; Nasser, M.; Elhassan, T.; Elshafie, H.; Saif, A. Financial Fraud Detection Based on Machine Learning: A Systematic Literature Review. Appl. Sci. 2022, 12, 9637. [Google Scholar] [CrossRef]
  4. Khando, K.; Islam, M.S.; Gao, S. The Emerging Technologies of Digital Payments and Associated Challenges: A Systematic Literature Review. Future Internet 2022, 15, 21. [Google Scholar] [CrossRef]
  5. Alsenaani, K. Fraud Detection in Financial Services using Machine Learning. Master’s Thesis, RIT 1 Lomb Memorial Dr, Rochester, NY, USA, 2022. [Google Scholar]
  6. Gupta, S.; Varshney, T.; Verma, A.; Goel, L.; Yadav, A.K.; Singh, A. A Hybrid Machine Learning Approach for Credit Card Fraud Detection. Int. J. Inf. Technol. Proj. Manag. 2022, 13, 1–13. [Google Scholar] [CrossRef]
  7. Xu, C.; Zhang, J. Collusive Opinion Fraud Detection in Online Reviews. ACM Trans. Web 2017, 11, 1–28. [Google Scholar] [CrossRef]
  8. Javaid, M.; Haleem, A.; Singh, R.P.; Khan, S.; Suman, R. Blockchain technology applications for Industry 4.0: A literature-based review. Blockchain Res. Appl. 2021, 2, 100027. [Google Scholar] [CrossRef]
  9. Sadgali, I.; Sael, N.; Benabbou, F. Performance of machine learning techniques in the detection of financial frauds. Procedia Comput. Sci. 2019, 148, 45–54. [Google Scholar] [CrossRef]
  10. Ahmadi, S. Open AI and its Impact on Fraud Detection in Financial Industry. J. Knowl. Learn. Sci. Technol. 2023, 2, 263–281. [Google Scholar]
  11. Piccarozzi, M.; Aquilani, B.; Gatti, C. Industry 4.0 in Management Studies: A Systematic Literature Review. Sustainability 2018, 10, 3821. [Google Scholar] [CrossRef]
  12. Berhane, T.; Walelign, T.M.A.; Seid, A.M. A Hybrid Convolutional Neural Network and Support Vector Machine-Based Credit Card Fraud Detection Model. Math. Probl. Eng. 2023, 2023, 34627. [Google Scholar] [CrossRef]
  13. Sarno, R.; Sinaga, F.; Sungkono, K.R. Anomaly detection in business processes using process mining and fuzzy association rule learning. J. Big Data 2020, 7, 5. [Google Scholar] [CrossRef]
  14. Ahmed, M.; Ansar, K.; Muckley, C.; Khan, A.; Anjum, A.; Talha, M. A semantic rule based digital fraud detection. PeerJ Comput. Sci. 2021, 7, e649. [Google Scholar] [CrossRef]
  15. Mhlanga, D. Block chain technology for digital financial inclusion in the industry 4.0, towards sustainable development? Front. Blockchain 2023, 6, 1035405. [Google Scholar] [CrossRef]
  16. Al-Hashedi, K.G.; Magalingam, P. Financial fraud detection applying data mining techniques: A comprehensive review from 2009 to 2019. Comput. Sci. Rev. 2021, 40, 100402. [Google Scholar] [CrossRef]
  17. Kumari, A.; Devi, N.C. The Impact of FinTech and Blockchain Technologies on Banking and Financial Services. Technol. Innov. Manag. Rev. 2022, 12. [Google Scholar] [CrossRef]
  18. Chatterjee, P.; Das, D.; Rawat, D.B. Digital twin for credit card fraud detection: Opportunities, challenges, and fraud detection advancements. Future Gener. Comput. Syst. 2024, 158, 410–426. [Google Scholar] [CrossRef]
  19. Alzahrani, R.A.; Aljabri, M. AI-based Techniques for Ad Click Fraud Detection and Prevention: Review and Research Directions. J. Sens. Actuator Netw. 2022, 12, 4. [Google Scholar] [CrossRef]
  20. Jemai, J.; Zarrad, A.; Daud, A. Identifying Fraudulent Credit Card Transactions Using Ensemble Learning. IEEE Access 2024, 12, 54893–54900. [Google Scholar] [CrossRef]
  21. Dai, S. Research on Detecting Credit Card Fraud Through Machine Learning Methods. In Proceedings of the 2022 2nd International Conference on Business Administration and Data Science (BADS 2022), Kashgar, China, 28–30 October 2022; pp. 1030–1037. [Google Scholar]
  22. Ahmad, H.; Kasasbeh, B.; Aldabaybah, B.; Rawashdeh, E. Class balancing framework for credit card fraud detection based on clustering and similarity-based selection (SBS). Int. J. Inf. Technol. 2023, 15, 325–333. [Google Scholar] [CrossRef]
  23. Btoush, E.A.L.M.; Zhou, X.; Gururajan, R.; Chan, K.C.; Genrich, R.; Sankaran, P. A systematic review of literature on credit card cyber fraud detection using machine and deep learning. PeerJ Comput. Sci. 2023, 9, e1278. [Google Scholar] [CrossRef] [PubMed]
  24. Vanini, P.; Rossi, S.; Zvizdic, E.; Domenig, T. Online payment fraud: From anomaly detection to risk management. Financ. Innov. 2023, 9, 66. [Google Scholar] [CrossRef]
  25. Thudumu, S.; Branch, P.; Jin, J.; Singh, J. A comprehensive survey of anomaly detection techniques for high dimensional big data. J. Big Data 2020, 7, 1–30. [Google Scholar] [CrossRef]
  26. Cao, W.; Ming, Z.; Xu, Z.; Zhang, J.; Wang, Q. Online Sequential Extreme Learning Machine with Dynamic Forgetting Factor. IEEE Access 2019, 7, 179746–179757. [Google Scholar] [CrossRef]
  27. Khedmati, M.; Erfini, M.; GhasemiGol, M. Applying support vector data description for fraud detection. arXiv 2020, arXiv:2006.00618. [Google Scholar]
  28. Ileberi, E.; Sun, Y.; Wang, Z. Performance Evaluation of Machine Learning Methods for Credit Card Fraud Detection Using SMOTE and AdaBoost. IEEE Access 2021, 9, 165286–165294. [Google Scholar] [CrossRef]
  29. Rtayli, N.; Enneya, N. Enhanced credit card fraud detection based on SVM-recursive feature elimination and hyper-parameters optimization. J. Inf. Secur. Appl. 2020, 55, 102596. [Google Scholar] [CrossRef]
  30. Osman, H. Cost-sensitive learning using logical analysis of data. Knowl. Inf. Syst. 2024, 66, 3571–3606. [Google Scholar] [CrossRef]
Disclaimer/Publisher’s Note: The statements, opinions and data contained in all publications are solely those of the individual author(s) and contributor(s) and not of MDPI and/or the editor(s). MDPI and/or the editor(s) disclaim responsibility for any injury to people or property resulting from any ideas, methods, instructions or products referred to in the content.

Article Metrics

Citations

Article Access Statistics

Multiple requests from the same IP address are counted as one view.