You are currently viewing a new version of our website. To view the old version click .
Information
  • Article
  • Open Access

2 May 2020

TwiFly: A Data Analysis Framework for Twitter

,
,
,
,
,
,
,
,
and
1
Department of Electrical and Computer Engineering, Hellenic Mediterranean University, GR70013 Heraklion, Greece
2
Department of Agriculture, Hellenic Mediterranean University, GR70013 Heraklion, Greece
3
FORTH-ICS, GR70013 Heraklion, Greece
*
Author to whom correspondence should be addressed.
This article belongs to the Special Issue 10th Anniversary of Information—Emerging Research Challenges

Abstract

Over the last decade, there have been many changes in the field of political analysis at a global level. Through social networking platforms, millions of people have the opportunity to express their opinion and capture their thoughts at any time, leaving their digital footprint. As such, massive datasets are now available, which can be used by analysts to gain useful insights on the current political climate and identify political tendencies. In this paper, we present TwiFly, a framework built for analyzing Twitter data. TwiFly accepts a number of accounts to be monitored for a specific time-frame and visualizes in real time useful extracted information. As a proof of concept, we present the application of our platform to the most recent elections of Greece, gaining useful insights on the election results.

1. Introduction

Nowadays, social media plays an important role in everyday life [] and has tremendously changed the way people interact and carry on with their daily activities. Among many others, it is used for keeping in touch with friends, finding partners, publishing and reading news, advertising, campaign management, and requesting political change. Over the last years, social media users spend a considerable amount of time daily on their platform of choice, whereas this exceptional growth is a phenomenon that affects our societies and thus is a subject of study among many scientific disciplines.
Facebook, Twitter, LinkedIn, and Instagram are currently widely used, and each one has its own characteristics and usages.
Facebook, for example, is considered as a social network where everyone in the network has a reciprocated relationship with the others in the same network. The relationship in this case is undirected. It has more than 2.23 billion monthly active users. Instagram is a social sharing app all around pictures and 60-s videos, used widely for brand promoting, with one billion monthly active users. LinkedIn is a business oriented social networking site, giving potential and current corporate associate a place to network and connect with more than 260 million active users. Twitter is a micro-blogging social site that limits posts to 280 characters. Twitter was created in March 2006 by Jack Dorsey, Noah Glass, Biz Stone, and Evan Williams and launched in July of that year []. The service rapidly gained worldwide popularity. In 2012, more than 100 million users posted 340 million tweets a day, and the service handled an average of 1.6 billion search queries per day. In 2013, it was one of the ten most-visited websites and has been described as “the SMS of the Internet”. As of 2018, Twitter had more than 321 million monthly active users. Since 2015, Twitter has been the center of debates and news covering politics of the United States. During the 2016 U.S. presidential election, Twitter was the largest source of breaking news on the day, with 40 million election-related tweets sent that day. Twitter provides an Application Programming Interface (API), enabling researchers and companies to collect relevant data that can then be analyzed using various methods and algorithms.
We used the aforementioned API in order to deliver TwiFly. TwiFly is a data analysis framework for Twitter, including modules for data collection, storage, and analysis, offering multiple visuals and analytics for the monitored accounts. More specifically, a user can provide a set of Twitter accounts to be monitored for a specific time frame, and the framework automatically collects and processes at real-time relevant data. Multiple visuals can present side-by-side information, out of those accounts activity, enabling the extraction of useful insights based on the collected data. In addition, we can detect potential bot accounts using a simple, yet effective algorithm. We applied our framework to the 2019 elections in Greece and we discuss interesting observations. The simplicity and extensibility of our approach make it useful for other domains as well.
The rest of this paper is structured as follows. In Section 2, we present related work. In Section 3, we describe in detail the architecture of the implemented framework. In Section 4, we show the results from the application of our framework in the latest elections in Greece. Finally, Section 5 concludes this paper and presents directions for future work.

3. High-Level Architecture

The high-level architecture of the implemented framework is shown in Figure 1. It consists of four modules, the data collection module, the storage module, the analysis module, and the graphical user interface. In the sequel, we describe each of them in detail.
Figure 1. The high-level architecture of the implemented framework.

3.1. Data Collection Module

This module is responsible for collecting the input tweets to be further processed by other modules. To collect the tweets, we exploited the Twitter Developer API. The API provides access to the information available on the Twitter network, and requires a registered developer account. Using the API, the following information can be accessed.
  • Accounts and Users: Management of users and accounts.
  • Tweets and Replies: Access to public tweets and replies; ability to post and search for tweets.
  • Direct Messages: Access to direct messaging dialogues provided that the users have allowed it; creation of dialogues for use by physical persons or chat-bots
  • Ads: Creation of advertising campaign that focuses on topics that have been identified with the use of API.
  • Publisher tools and SDKs: Capability of embedding information and Twitter’s function in web pages.
The basic, free version of the API that we used, has several limitations on the amount of data that can be requested as it restricts the number of tweets returned each time. To exploit the available API we used Twitter4j (http://twitter4j.org/), a free open source Java library, which uses the Twitter API and returns data in JavaScript Object Notation (JSON) format. By decoding JSON data, we can extract specific data items such as the author, the raw message, a unique tweet ID, a time-stamp, etc. A sample of JSON data returned by the API is shown below.
{
"created_at": "Thu May 10 17:41:57 +0000 2018",
"id_str": "994633657141813248",
"text": "Just another Extended Tweet, showing that …",
"display_text_range": [0, 140],
"truncated": true,
"user": {
"id_str": "944480690",
"screen_name": "FloodSocial"
}

3.2. Storage Module

To efficiently process the collected data, apart from saving the returned data in files, we also store them in a MySQL database for further processing. Figure 2 shows the enhanced entity relationship model (ERD) of the created database. As shown, all relevant information is saved into four interrelated tables, which we can use then for further analysis.
Figure 2. The entity relationship model of the generated database.

3.3. Analysis Module

To process the collected data, a set of REST services was developed using the Spring Framework. REST services enable easy implementation, and are also known for the scalability they offer due to the separation between the client and server. The clients do not need to know routing information, so different clients can use this service just by using the URIs that the service provides and get the requested information in JSON format. As such, among others, the following REST services were implemented, accepting the appropriate parameters as input and returning the corresponding JSON results.
  • Calculate the number of tweets based on several filters and criteria: We can calculate the number of tweets available in our database, belonging to or mentioning specific users, containing specific hashtags or text, from a specific location etc.
  • Calculate the number of retweets based on several filters and criteria: The same criteria and filters that are applied for tweets can also be applied for retweets.
  • Calculate the number of favorites in each tweet.
  • Calculate the number of followers for a specific politician.
  • Identify the most frequent hashtags used.
  • Return the top-k politicians based on several criteria, for example based on their popularity, number of retweets, number of followers, favorites, etc.
  • Return the most common hashtags used by each politician.
  • Calculate the rate of growth of politician followers for a specific period.
  • Identify potential bot accounts: To this direction, we implemented an effective algorithm for identifying machine accounts that are designed to mimic human users, for promoting specific political accounts. Numerous methods for detecting such accounts are already available (see [] for an overview), however recent findings suggest that the retweeting activity of such automated accounts [] can be exploited for their identification. Our algorithm, shown in Algorithm 1, is based on the simple idea that bot accounts will retweet a large percentage of the the tweets within a specific amount of time. As such the algorithms initially calculates for all tweets made by a specific twitter account the number of retweets by other accounts, which are performed within a time limit (Lines 5–12). Then, for each individual retweeter, the algorithm calculates the percentage of retweeted tweets (Line 14) and if it exceeds the percentage set by the algorithm it includes the specific account to the list of the potential bots (Line 15). Both the percentage and the time are configurable and can be set by the user. Within our experiments, the percentage was set to 90% and the time was set to 12 h. We manually verified the results of four obvious bots, identifying the high quality of the proposed approach.
Algorithm 1 Bot detection.
 1: procedure detectBot( T w i t t e r A c c o u n t , P e r c e n t a g e , T i m e )
 2:     T w e e t s N u m b e r = 0
 3:     P o t e n t i a l B o t s =
 4:     R e T w e e t s =
 5:    for each T w e e t in T w i t t e r A c c o u n t do
 6:         T w e e t s N u m b e r + +
 7:        for each R e T w e e t for a T w e e t do
 8:           if R e T w e e t is made within T i m e then
 9:                R e T w e e t s [ R e T w e e t O w n e r ] + +
10:           end if
11:        end for
12:    end for
13:    for each R e T w e e t O w n e r in R e T w e e t s do
14:        if R e T w e e t s [ R e T w e e t O w n e r ] / T w e e t s N u m b e r > P e r c e n t a g e then
15:            P o t e n t i a l B o t s [ R e T w e e t O w n e r ] = 1
16:        else
17:            P o t e n t i a l B o t s [ R e T w e e t O w n e r ] = 0
18:        end if
19:    end for
20:    return P o t e n t i a l B o t s
end procedure
For all textual filtering, our implemented services support regular expressions, i.e., sequence of characters that define specific search patterns (https://en.wikipedia.org/wiki/Regular_expression). As an example, we are able to extract and identify hashtags using expressions such as the following:
\B(\#[a-zA-Z]+\b)(?!;)
The specific regular expressions denotes that there is not a word boundary (\B) and captures effectively the group beginning with # followed by any number of a–z or A–Z with a word boundary at the end. Then, the (?!;) denotes that it might not followed by a “;”. We also have to note that, in our approach, we assume that the identified hashtags reveal also the topics mentioned in each individual tweet.

3.4. Gui

This module includes a web page where all data are visualized using various graphs. The web page is available online (http://twifly.grekos.com) and a screen-shot is shown in Figure 3, enabling the user to visualize interesting information on the collected tweets. The GUI automatically calls the appropriate REST services to dynamically visualize the results after processing the collected data.
Figure 3. A screenshot of our framework.
The GUI includes multiple visuals and graphs such as graph charts, line and bar charts that are interactive, enhancing user experience. Some examples of these graphs are also shown in Section 4.

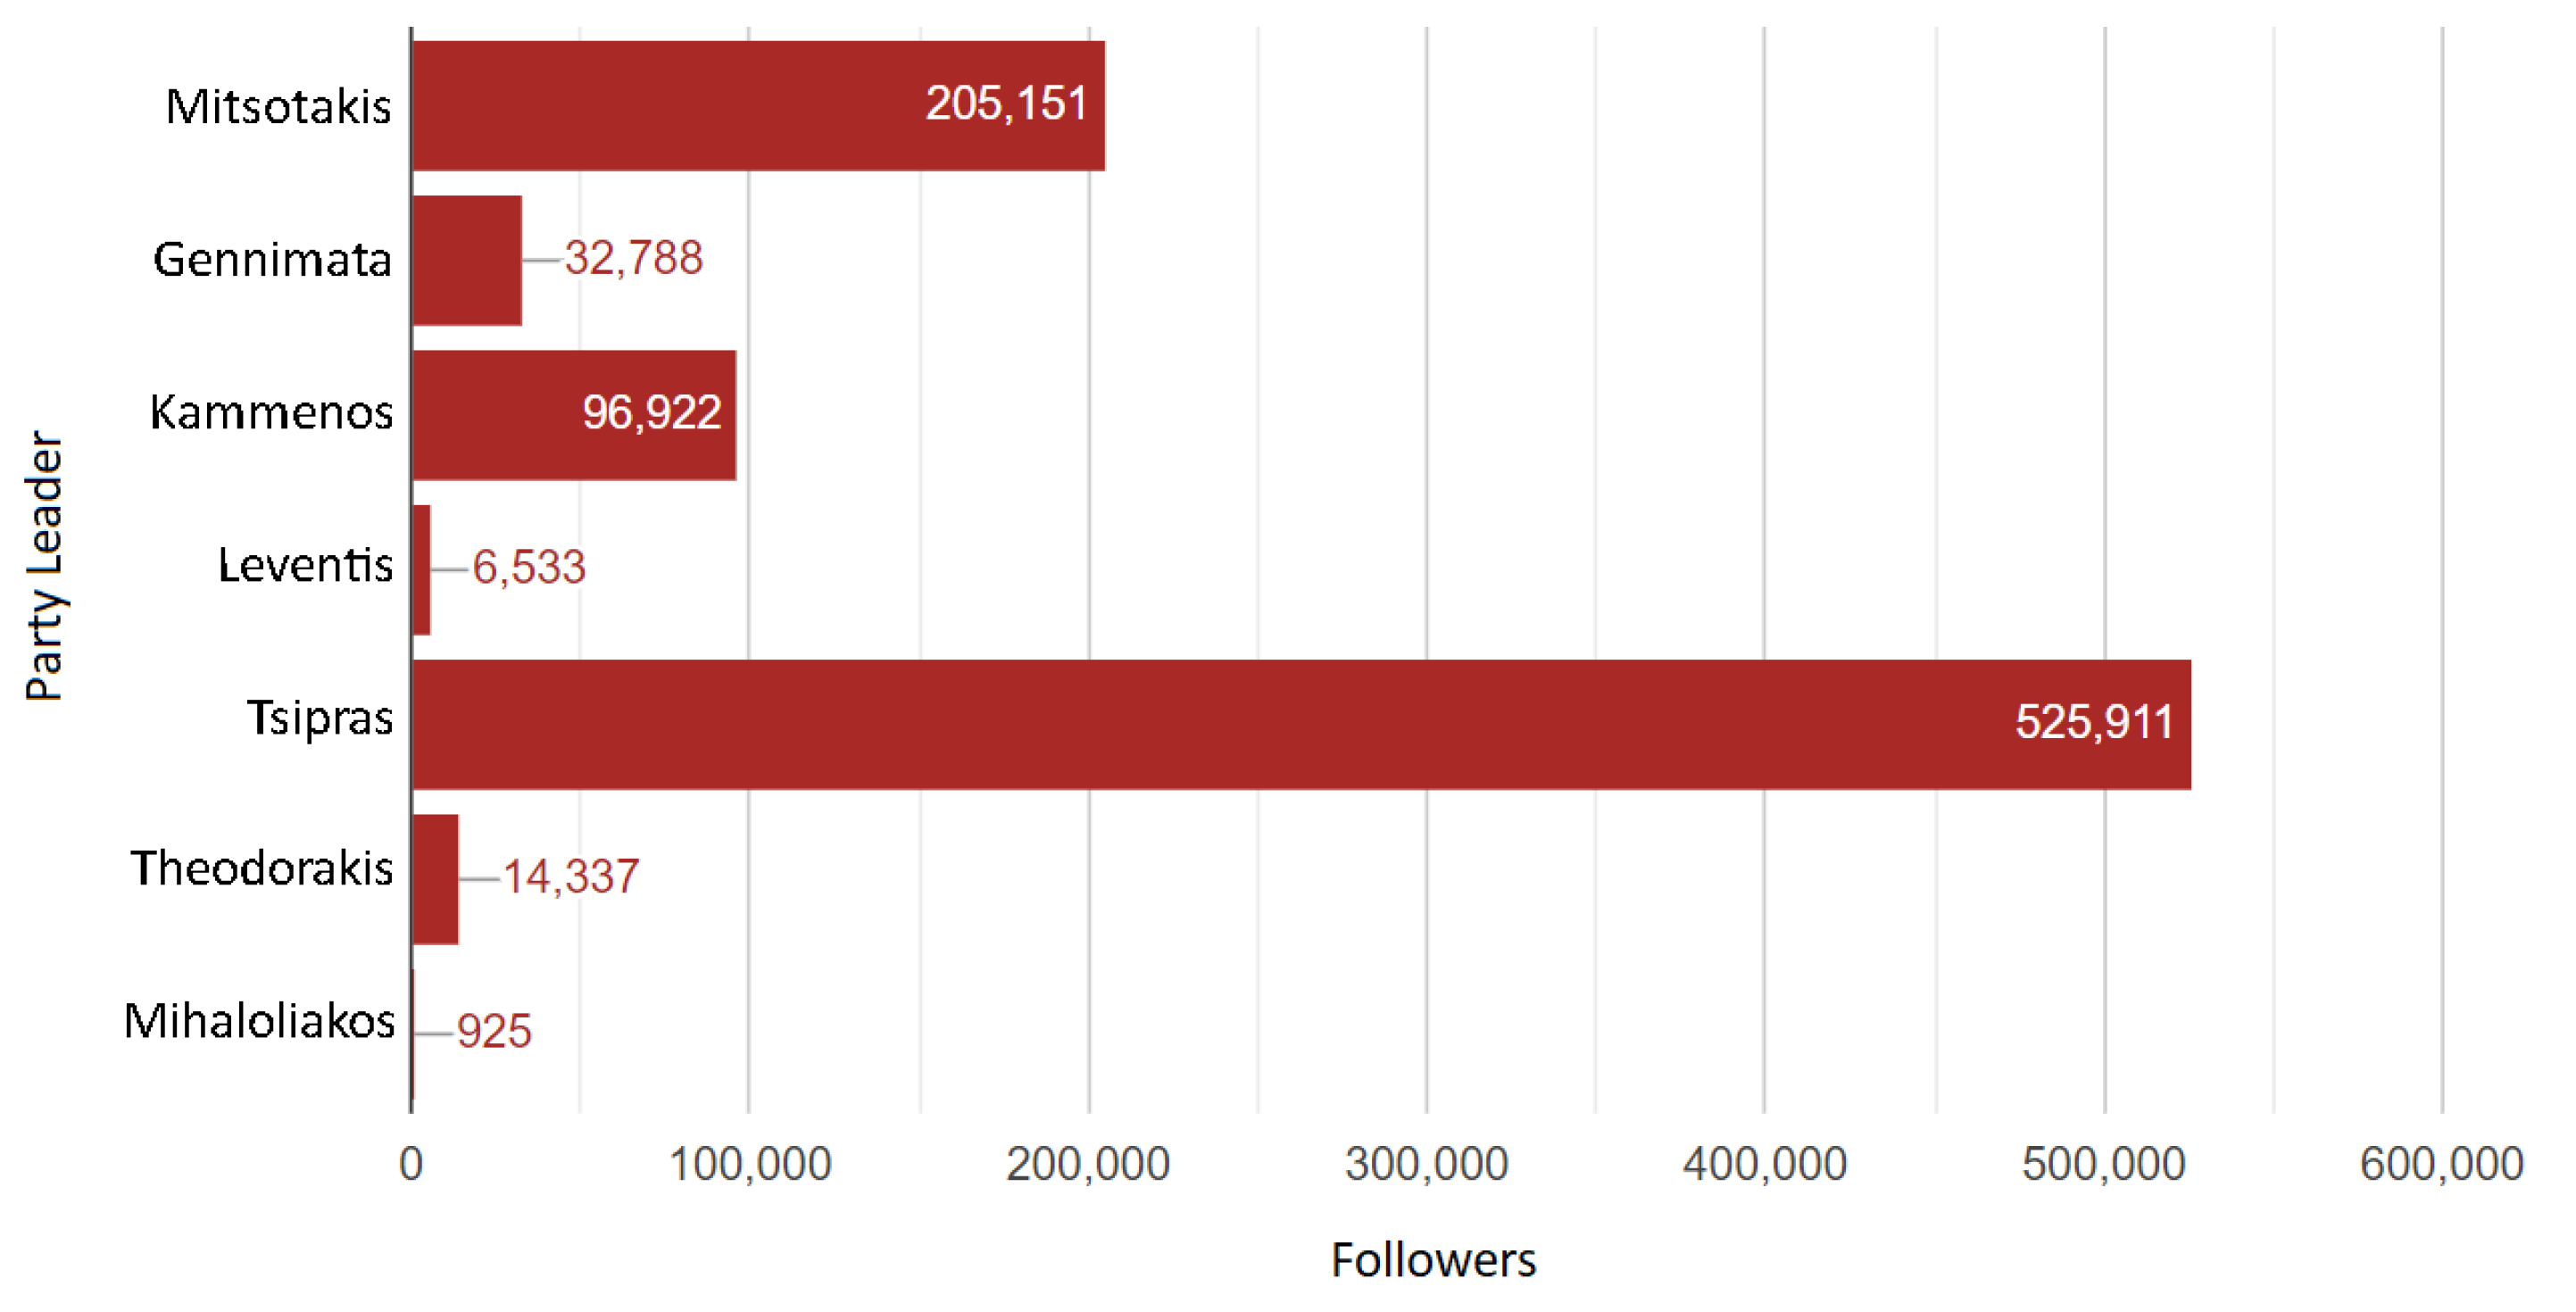
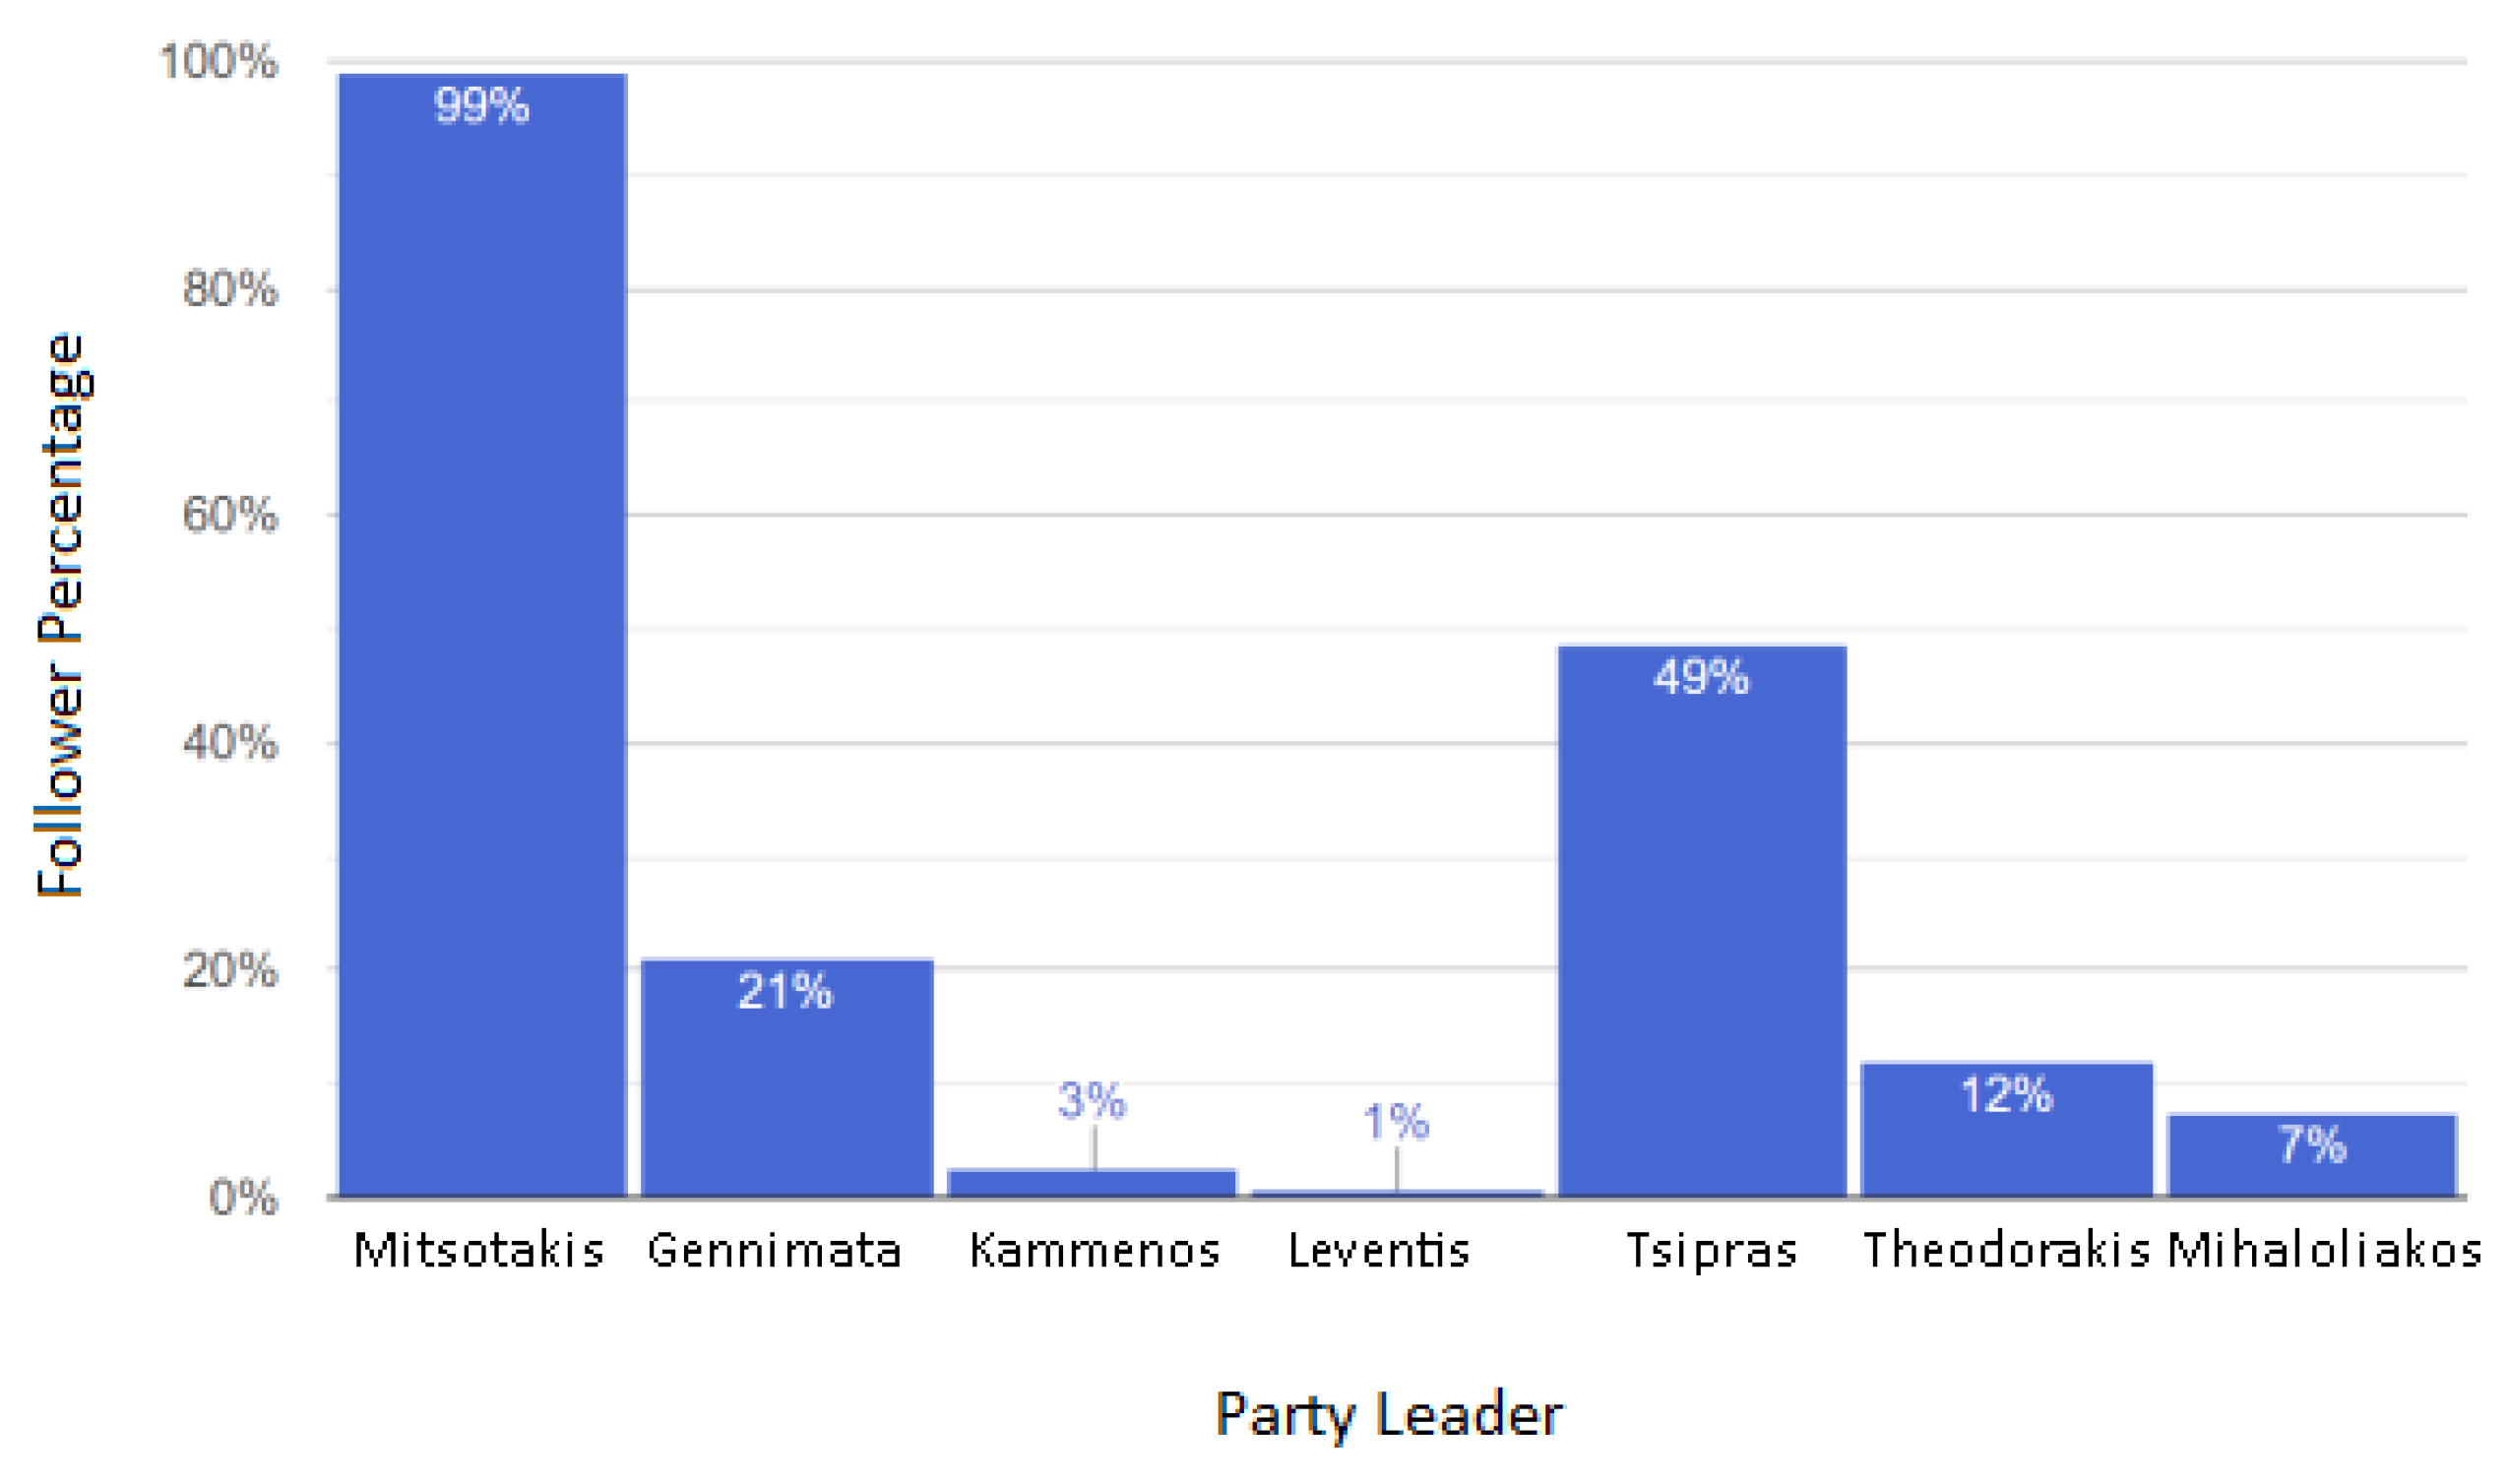
4. Framework Application to the Latest Elections in Greece

In the sequel, we present the application of our framework during the latest elections of Greece of 2019. For collecting the data, we set the accounts to be monitored through our platform and the duration of the monitoring period. The twitter accounts monitored were the ones of the leaders of all political parties of the Greek Parliament: atsipras, kmitsotakis, FofiGennimata, PanosKammenos, St_Theodorakis, ProedrosEK, and michaloliakosn. At that time, Alexis Tsipras was the prime minister. Data collection was scheduled for thirty days before the Greek elections collecting 100 tweets daily from each political leader along with relevant meta-data. During the collection period, the relevant graphs were updated at runtime. However, in this paper, we present the information as presented at the end of the monitoring period.
Figure 4 displays the number of tweets on a daily basis for the one month observed. More specifically, the x-axis shows the days (1–30), while the y-axis indicates the number of tweets. As we can observe, all political leaders were using Twitter daily, publishing on average 3–5 tweets per day, with a relative stability on their number of posts, publishing slightly more tweets at the end.
Figure 4. Number of tweets for each day of the month.
Figure 5 displays in a bar chart the number of tweets published by each political leader, as well as the average number of favorites for his/her tweets in a line format. An interesting observation is that the leaders of the two most popular parties (i.e., Mitsotakis and Tsipras) had the biggest number of favorites, which is reasonable as they had more supporters than the other parties. In addition, we can see that the small parties have a small amount of favorites per tweet (e.g., Leventis has only 0.5 favorites per tweet).
Figure 5. Total tweets and average favorites.
Figure 6 depicts the number of followers, for each political leader. In particular, the x-axis shows the number of followers, while the y-axis indicates the name of the political leader. Furthermore, the exact number of followers for each political leader is displayed in the corresponding bar of the chart. Again, the leaders of the two most popular parties have the most followers, whereas the prime minister (i.e., Tsipras) at that time had more than double the followers as his main competitor (i.e., Mitsotakis). We can also see that, besides the leaders of the two popular parties, the other parties have a really small number of followers, even though they were also quite active in posting tweets (refer to Figure 5).
Figure 6. Followers per political leader.
Figure 7 visualizes the increase, in terms of followers, for each political leader over the last 24 h before the elections. In particular, the x-axis shows the name of the political leader, while the y-axis indicates the rate of increase. As shown, the first political leader (i.e., Mitsotakis) almost doubled his followers in the 24 h before the election. Eventually, he won the elections, and as such the rate of increase might be used as a predictor for the elections outcome. Regarding the other political leaders, Tsipras had an increase of 50% followed by the other political parties. In fact, the order of the follower’s increase is the same as the order of the parties in the election results, which is rather interesting.
Figure 7. Follower increase percentage over the last 24 h.
Figure 8 displays the 10 most popular hashtags of all political leaders. Specifically, the pie chart contains the top 10 most popular Twitter hashtags collectively by all political leaders, showing in essence the campaign strategy of each political leader. This can be directly correlated with the top hashtag used by each political leader shown in Figure 9. As shown, some political leaders were constantly using their campaign hashtag, whereas others were not.
Figure 8. The 10 most popular hashtags for all political leaders.
Figure 9. The top hashtag of each political leader.
Figure 10 displays the users that are more likely to be a bot. Specifically, the graph illustrates how many times these accounts retweeted a political leader’s tweet, up to 40 s after its publication. Both the number of tweets in total and the time from original tweet are configurable and offer valuable insight on which accounts are bots. In fact, we manually examined the top four accounts and it was apparent that those were bots promoting the tweets of four individual political leaders. In fact, all bots identified were promoting tweets from the leaders of the two most prominent parties, showing that they considered it important to promote their political messages through the social media.
Figure 10. The top 10 Twitter users that may be bots.

Discussion

After examining the aforementioned graphs, we can see that the political leaders of the two most popular parties, Mitsotakis and Tsipras, were pretty active on Twitter, choosing Twitter for promoting their political campaign. Nevertheless, we can also see that the other political leaders also actively and steadily used twitter for their campaigns. Actually, Theodorakis and Leventis were the most active political leaders, both with more than 260 tweets within the thirty days preceding elections (refer to Figure 6). However, Mitsotakis and Tsipras were the most popular ones, Tsipras with 289 favorites on average and Mitsotakis with 507 favorites on average (refer to Figure 6) per day.This happened despite the fact that Tsipras had around 500k followers, whereas Mitsotakis had around 200k followers (refer to Figure 7). In addition, although Tsipras had most of the followers, Mitsotakis had the highest rate of growth—the increase percentage of the Mitsotakis’ followers was 99%, whereas for Tsipras 49% (refer to Figure 8) during the last 24 h.
Eventually, voters in Greece gave to Kyriakos Mitsotakis’ center-right New Democracy Party a mandate to form a new government after it won by a landslide over the incumbent left-wing Syriza party (led by Tsipras), which has been in power since 2015. Correlating the result with the number of favorites and the increase percentage of followers, it seems that they can effectively predict to some extent the outcome of the elections. Further, we can identify that all political leaders based their campaign on a specific political message that eventually became a hashtag, constantly used in their tweets.
Given the aforementioned results, we can see that the use of the Twitter platform drives the hybridization of political actors’ communicative strategies, as also identified by Alonso-Munoz et al. []. The studied political parties bypassed traditional means of campaign management and tried to exploit new forums through social sites, for promoting their campaign and eventually acquire more followers. This is in line with the observations of Gainous and Wagner []. Twitter has created a new paradigm for political communication, highly used and appreciated by the political parties. We can even see that there are potential paid accounts for retweeting the posted messages.
As such, given the interesting results quickly obtained by exploiting TwiFly during the last elections in Greece, we demonstrate the usefulness of our platform. Nevertheless, TwiFly can be used for monitoring groups of twitter accounts, nicely visualizing and contrasting tweets, retweets, followers, hashtags, etc., making it easy to discover interesting correlations between those accounts and to understand which account is more popular. We also show that, when used to analyze elections, it can offer a strong indication of the party that will eventually win without running costly exit polls.
Finally, we have to note that a limitation of our work is that we did not included sentiment analysis techniques in our study, in order to identify emotions behind the specific tweets, which could potentially shed light on the strategy of each party, as in the studies of Kusen and Strembeck [] and Caetano et al. [], for example. In addition, another limitation of our work is that we rely on hashtags to identify the topics of each tweet. However, a more elaborate approach using natural language and topic detection techniques could be useful to further detail the various discussion topics. This is the natural next step of our approach.

5. Conclusions

In this paper, we present TwiFly, a framework enabling multidimensional, side-by-side analytics of multiple Twitter accounts. More specifically, a user can provide a set of Twitter accounts to be monitored, for a pre-defined time interval, collecting and visualizing in real-time numerous interesting visuals. Based on those visuals, useful correlations can occur, highlighting tendencies and differences.
We applied our framework on the Greek elections of 2019 and demonstrated the usefulness of our approach, capturing the political climate before the elections. We argue that, in cases where the conventional means of exit polls are not possible, similar analyses can offer a strong indication of the party that will eventually win.
Another direction could be to analyze not only what the specific monitored accounts are publishing but also what other accounts are publishing mentioning them, including also a sentiment analysis of the published text. Another interesting direction would be to employee machine learning for the identification of the bot accounts.

Author Contributions

Conceptualization, D.T. and H.K.; Methodology, I.H. and G.G.; Project administration, P.C.; Software, A.D., S.G., I.L., M.M., M.N., A.P., V.K., N.S., D.T., and G.V.; Supervision, N.P. and H.K.; Writing—original draft, P.C., A.D., S.G., I.L., M.M., M.N., A.P., V.K., N.S., and G.V.; and Writing—review and editing, I.H., G.G., N.P., and H.K. All authors have read and agreed to the published version of the manuscript.

Funding

This research received no external funding.

Conflicts of Interest

The authors declare no conflict of interest.

References

  1. Stefanidis, K.; Ntoutsi, E.; Kondylakis, H.; Velegrakis, Y. Social-Based Collaborative Filtering. In Encyclopedia of Social Network Analysis and Mining, 2nd ed.; Springer: Berlin/Heidelberg, Germany, 2017. [Google Scholar] [CrossRef]
  2. Twitter. Available online: https://en.wikipedia.org/wiki/Twitter (accessed on 1 May 2020).
  3. Saeed, Z.; Abbasi, R.A.; Maqbool, O.; Sadaf, A.; Razzak, I.; Daud, A.; Aljohani, N.R.; Xu, G. What’s Happening Around the World? A Survey and Framework on Event Detection Techniques on Twitter. J. Grid Comput. 2019, 17, 279–312. [Google Scholar] [CrossRef]
  4. Ramachandran, D.; Ramasubramanian, P. Event detection from Twitter—A survey. IJWIS 2018, 14, 262–280. [Google Scholar] [CrossRef]
  5. Gavhane, S.A.; Bhadave, S.B.; Vengatesan, K. Review on Latest Trending Topic Detection in Twitter With Stream Processing (Using Fission Pattern). IJAEC 2019, 10, 43–47. [Google Scholar] [CrossRef]
  6. Rathan, M.; Hulipalled, V.R.; Venugopal, K.R.; Patnaik, L.M. Consumer insight mining: Aspect based Twitter opinion mining of mobile phone reviews. Appl. Soft Comput. 2018, 68, 765–773. [Google Scholar]
  7. Sotiriadis, M.D.; van Zyl, C. Electronic word-of-mouth and online reviews in tourism services: The use of twitter by tourists. Electron. Commer. Res. 2013, 13, 103–124. [Google Scholar] [CrossRef]
  8. Martínez-Rojas, M.; del Carmen Pardo-Ferreira, M.; Rubio-Romero, J.C. Twitter as a tool for the management and analysis of emergency situations: A systematic literature review. Int. J. Inf. Manag. 2018, 43, 196–208. [Google Scholar] [CrossRef]
  9. Doan, S.; Yang, E.W.; Tilak, S.S.; Li, P.W.; Zisook, D.S.; Torii, M. Extracting health-related causality from twitter messages using natural language processing. BMC Med. Inf. Decision Making 2019, 19-S, 71–77. [Google Scholar] [CrossRef] [PubMed]
  10. Weerasinghe, J.; Morales, K.; Greenstadt, R. “Because… I was told… so much”: Linguistic Indicators of Mental Health Status on Twitter. PoPETs 2019, 2019, 152–171. [Google Scholar] [CrossRef]
  11. Sarma, K.V.; Spiegel, B.M.R.; Reid, W.M.; Chen, S.; Merchant, R.M.; Seltzer, E.; Arnold, C.W. Estimating the Health-Related Quality of Life of Twitter Users Using Semantic Processing. In Proceedings of the MEDINFO 2019: Health and Wellbeing e-Networks for All— Proceedings of the 17th World Congress on Medical and Health Informatics, Lyon, France, 25–30 August 2019; pp. 1065–1069. [Google Scholar]
  12. Alonso-Muñoz, L.; Marcos-García, S.; Casero-Ripollés, A. Political leaders in (inter)action: Twitter as a strategic communication tool in electoral campaigns. Trípodos 2017, 39, 71–90. [Google Scholar]
  13. Boynton, G.R.; Cook, J.; Daniels, K.; Dawkins, M.; Kopish, J.; Makar, M.; McDavid, W.; Murphy, M.; Osmundson, J.; Steenblock, T.; et al. The Political Domain Goes to Twitter: Hashtags, Retweets and URLs. Open J. Polit. Sci. 2014, 4, 8–15. [Google Scholar] [CrossRef][Green Version]
  14. Cram, L.; Llewellyn, C.; Hill, R.L.; Magdy, W. UK General Election 2017: A Twitter Analysis. arXiv 2017, arXiv:1706.02271. [Google Scholar]
  15. Budiharto, W.; Meiliana, M. Prediction and analysis of Indonesia Presidential election from Twitter using sentiment analysis. J. Big Data 2018, 5, 51. [Google Scholar] [CrossRef]
  16. Kusen, E.; Strembeck, M. Politics, sentiments, and misinformation: An analysis of the Twitter discussion on the 2016 Austrian Presidential Elections. Online Soc. Netw. Media 2018, 5, 37–50. [Google Scholar] [CrossRef]
  17. Caetano, J.A.; Lima, H.S.; Santos, M.F.; Marques-Neto, H.T. Using sentiment analysis to define twitter political users’ classes and their homophily during the 2016 American presidential election. J. Internet Serv. Appl. 2018, 9, 18:1–18:15. [Google Scholar] [CrossRef]
  18. Evans, H.K.; Brown, K.J.; Wimberly, T. “Delete Your Account”: The 2016 Presidential Race on Twitter. Soc. Sci. Comput. Rev. 2018, 36, 500–508. [Google Scholar] [CrossRef]
  19. Gervais, B.T.; Evans, H.K.; Russell, A. Fear and Loathing on Twitter: Exploring Negative Rhetoric in Tweets During the 2018 Midterm Election. In The Roads to Congress 2018: American Elections in the Trump Era; Foreman, S.D., Godwin, M.L., Wilson, W.C., Eds.; Springer International Publishing: Cham, Switzerland, 2020; pp. 31–52. [Google Scholar] [CrossRef]
  20. Christine, B.; Williams, B.I.N. Social Media, Political Marketing and the 2016 US Election. J. Polit. Mark. 2017, 16, 207–211. [Google Scholar]
  21. Gainous, J.; Wagner, K.M. Tweeting to Power: The Social Media Revolution in American Politics; Oxford University Press: Oxford, UK, 2013. [Google Scholar]
  22. Wang, L.; Gan, J.Q. Prediction of the 2017 French Election Based on Twitter Data Analysis Using Term Weighting. In Proceedings of the 2018 10th Computer Science and Electronic Engineering Conference, CEEC 2018, University of Essex, Colchester, UK, 19–21 September 2018; pp. 231–235. [Google Scholar]
  23. Praciano, B.J.G.; da Costa, J.P.C.L.; Maranhao, J.P.A.; de Mendonca, F.L.L.; de Sousa Júnior, R.T.; Prettz, J.B. Spatio-Temporal Trend Analysis of the Brazilian Elections Based on Twitter Data. In Proceedings of the 2018 IEEE International Conference on Data Mining Workshops, ICDM Workshops, Singapore, 17–20 November 2018; pp. 1355–1360. [Google Scholar]
  24. Heredia, B.; Prusa, J.D.; Khoshgoftaar, T.M. Location-Based Twitter Sentiment Analysis for Predicting the U.S. 2016 Presidential Election. In Proceedings of the Thirty-First International Florida Artificial Intelligence Research Society Conference, FLAIRS 2018, Melbourne, FL, USA, 21–23 May 2018; pp. 265–270. [Google Scholar]
  25. Martin-Gutierrez, S.; Losada, J.C.; Benito, R.M. Recurrent Patterns of User Behavior in Different Electoral Campaigns: A Twitter Analysis of the Spanish General Elections of 2015 and 2016. Complexity 2018, 2018, 2413481:1–2413481:15. [Google Scholar] [CrossRef]
  26. Yoshida, M.; Toriumi, F. Analysis of Political Party Twitter Accounts’ Retweeters during Japan’s 2017 Election. In Proceedings of the 2018 IEEE/WIC/ACM International Conference on Web Intelligence, WI 2018, Santiago, Chile, 3–6 December 2018; pp. 736–739. [Google Scholar]
  27. Andriotis, P.; Takasu, A. Emotional Bots: Content-based Spammer Detection on Social Media. In Proceedings of the 2018 IEEE International Workshop on Information Forensics and Security, WIFS 2018, Hong Kong, China, 11–13 December 2018; pp. 1–8. [Google Scholar]
  28. Chavoshi, N.; Mueen, A. Model Bots, not Humans on Social Media. In Proceedings of the IEEE/ACM 2018 International Conference on Advances in Social Networks Analysis and Mining, ASONAM 2018, Barcelona, Spain, 28–31 August 2018; pp. 178–185. [Google Scholar]
  29. Alothali, E.; Zaki, N.; Mohamed, E.A.; Ashwal, H.A. Detecting Social Bots on Twitter: A Literature Review. In Proceedings of the 2018 International Conference on Innovations in Information Technology (IIT), Al Ain, UAE, 18–19 November 2018; pp. 175–180. [Google Scholar]
  30. Caldarelli, G.; De Nicola, R.; Vigna, F.D.; Petrocchi, M.; Saracco, F. The role of bot squads in the political propaganda on Twitter. arXiv 2019, arXiv:1905.12687. [Google Scholar]

Article Metrics

Citations

Article Access Statistics

Multiple requests from the same IP address are counted as one view.