Abstract
The silty seabed in the Yellow River Delta (YRD) is exposed to deposition, liquefaction, and reconsolidation repeatedly, during which seepage flows are crucial to the seabed strength. In extreme cases, seepage flows could cause seepage failure (SF) in the seabed, endangering the offshore structures. A critical condition exists for the occurrence of SF, i.e., the critical hydraulic gradient (). Compared with cohesionless sands, the of cohesive sediments is more complex, and no universal evaluation theory is available yet. The present work first improved a self-designed annular flume to avoid SF along the sidewall, then simulated the SF process of the seabed with different consolidation times in order to explore the of newly deposited silty seabed in the YRD. It is found that the theoretical formula for of cohesionless soil grossly underestimated the of cohesive soil. The range of silty seabed in the YRD was 8–16, which was significantly affected by the cohesion and was inversely proportional to the seabed fluidization degree. SF could “pump” the sediments vertically from the interior of the seabed with a contribution to sediment resuspension of up to 93.2–96.8%. The higher the consolidation degree, the smaller the contribution will be.
1. Introduction
The high-concentrated sediments from the middle and lower reaches of the Yellow River deposited rapidly at the estuary, forming an underwater delta with high excess pore water pressure (i.e., under consolidated) [1]. About 30–40% of these sediments deposited near the river mouth [2], forming a very active sedimentary area near the mouth, i.e., the tidal sensitive zone. In this zone, a large amount of sediment is intercepted to form a plastic seabed at high tides and is eroded and transported into the sea at low tides [3]. In this way, the nearshore seabed of the Yellow River Delta (YRD) is repeatedly redeposited. Consequently, accumulation of excess pore water pressure [4], upward seepage, and even diapiric structures appear in the newly deposited seabed [5]; on the other hand, the YRD is dominated by cyclic wave actions that will also generate excess pore water pressure, and thus seepage flows in the seabed. Upward seepage may lead to seepage failure in extreme cases [6,7], which is a phenomenon of soil particle loss and seabed instability under the action of seepage [8]. It occurs when the hydraulic gradient in the soil () is greater than the critical hydraulic gradient (). As seepage failure is often accompanied by the loss of fine particles and eventually leads to unstable landforms such as collapse and landslide [9,10], it seriously affects the stability and safety of engineering construction, such as ports, oil pipelines, and submarine cables in the YRD [11]. Therefore, it is of great significance to determine the critical hydraulic gradient for seepage failure for maintaining the safety of offshore engineering and structures.
At present, the research on the critical hydraulic gradient of soil is mainly focused on cohesionless soil. Terzaghi proposed the famous formula of the critical hydraulic gradient for seepage failure of cohesionless soil on the basis of the effective stress principle and the force balance analysis of vertical seepage direction in soil [12]:
where is the critical hydraulic gradient, is the specific gravity of soil particles, and is the porosity.
On the basis of the work of Terzaghi, Sha further considered the influence of soil particle shape resistance. Through the force analysis of a single soil particle, he deduced the critical hydraulic gradient formula for vertical seepage failure [13]:
where is the shape coefficient of soil particles, = 1.16–1.17.
Liu (2006) simplified the heterogeneous soil as the equivalent homogeneous soil, whose equivalent particle size was . In accordance with the limit equilibrium principle of a single soil particle, the author proposed the critical hydraulic gradient calculation formula [14]:
where is the particle size accounting for 5% of the total weight of soil (cm), and is the particle size accounting for 20% of the total weight of soil (cm).
The above works for deducing the critical hydraulic gradient for seepage failure are based on the mechanical balance principle. However, for cohesive soil, it is complicated to deduce the critical criterion for seepage failure theoretically due to the existence of cohesion. Davidenkoff theoretically explored the relationship between various factors of cohesive soil and critical hydraulic gradient and found that seepage direction and cohesion can affect the critical hydraulic gradient [15]. Liu and Miao explored the influence of soil properties, dry bulk density, saturation, initial water content, and other factors on the critical hydraulic gradient of cohesive soil through laboratory experiments, and found that the dry bulk density of soil has a significant influence on the critical hydraulic gradient, showing a hyperbolic function relationship with the critical hydraulic gradient [16]. Besides, Liu gave the critical hydraulic gradient formula of cohesive soil based on a large number of experimental data [17]. Song and Qian proposed a formula for calculating the critical hydraulic gradient of cohesive soil on the basis of the properties of cohesive soil and the mechanism of seepage failure, in accordance with the mechanical balance principle and considering the influence of cohesion [18]:
where is the cohesion of saturated clay per unit length (kPa/m), and is the bulk density of water (kN/m3).
Liu obtained that the critical hydraulic gradient of cohesive soil was directly proportional to the compaction degree and clay content [19]. Jiang equated the pores of cohesive soil to a certain diameter pipe, and deduced the critical hydraulic gradient formula of cohesive soil based on the pipe flow [20]. Therefore, the judgment of cohesive sediment depends more on experimental measurement at the present stage.
The sediment in the YRD is mainly silty soil, of which the properties are between cohesionless and cohesive soil. Due to its special physical and mechanical properties, it is easy to generate pore water pressure response under the action of wave cyclic load [21,22], resulting in excess pore water pressure and forming a seepage hydraulic gradient from the inside of the bed to the bed surface [23]. When it reaches a certain critical value, the seabed will cause seepage failure and even liquefaction [24,25,26], resulting in the migration of fine particles [27,28]. This paper did not simulate waves to induce seabed seepage, but directly simulated the effect of wave-induced seepage, as the effect of wave-induced cumulative seepage is similar to that of water head-difference seepage [29], and thus it can be simulated more controllably by applying head difference in order to ensure the controllability of wave-induced seepage intensity.
To study the critical condition for seepage failure of newly deposited seabed in the YRD, we used a self-designed laboratory annular flume to simulate the seepage failure process of the seabed with different consolidation times, wherein the contribution of seepage failure to sediment resuspension is also discussed in the present paper.
2. Materials and Methods
2.1. Experimental Instruments
The experiments were carried out in a self-designed annular flume system (Zhang et al., 2017, China Patent). As shown in Figure 1, the flume was 1.8 m long and 1.1 m wide, including 2 parts: the scouring system and the seepage system. The scouring system consisted of 2 parts: a water flow channel that was 0.3 m wide and 0.2 m high and a soil tank that was located at the end of the flowing route, being 0.4 m long, 0.3 m wide, and 0.3 m high. The flow rate can be increased step by step by engine driving the paddles to rotate, and the range was 0–60 cm/s. The optical backscatter sensor (OBS) was fixed in the water flow channel on the right side of the soil tank to record the change of water turbidity, and the turbidity was converted into suspended sediment concentration (SSC) through the calibration formula. The seepage system was located at the center of the annular flume, including a 2 m high transparent acrylic cylinder and a flow pipe connecting the soil tank and the seepage cylinder. A pressure sensor was placed at the bottom of the cylinder to continuously record the change of the applied water head.
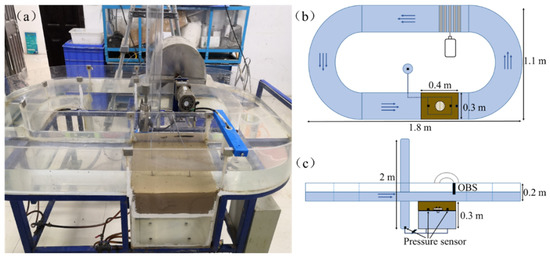
Figure 1.
Annular flume system. (a) Overall view; (b) schematic top view; (c) schematic side view.
Zhang et al. used the annular flume system to carry out a scouring seepage experiment, but the seepage failure in their experiment occurred along the sidewall of the flume [30]. This boundary effect may lead to an inaccurate measurement of and its contribution to resuspension. To avoid the boundary effect, we improved the soil tank before performing the experiments.
A 0.4 m long, 0.3 m wide, and 0.18 m high box was added in the previous soil tank. A 2 cm diameter circular hole was opened in the middle of the box, and a 2 cm high and 10 cm diameter cylinder was added directly above the circular hole. Four 0.5 cm diameter small holes were opened in the upper part of the cylinder (Figure 2). The cylinder was filled with fine sand to balance the water flow. Through the improved flume, the vertical seepage path was smaller than the horizontal seepage path, realizing the seepage failure occurring in the middle of the seabed. Besides, two high-precision pore pressure sensors (Figure 1) were buried at 10 cm away from the seabed surface on both sides of the cylinder (i.e., in the same plane as the cylinder surface), and collected at the frequency of 1 Hz to obtain the pore pressure curve of the sediment, and inferred the seabed consolidation degree and the influence of seepage on pore water pressure in the seabed.
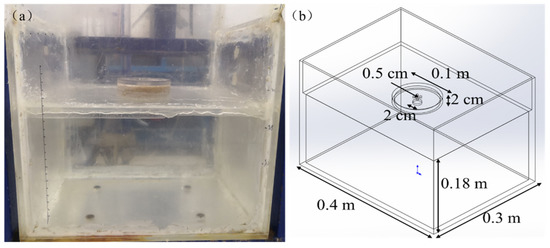
Figure 2.
Improved soil tank. (a) Entity diagram; (b) schematic diagram.
2.2. Experimental Methods
The experiments involved in this paper included 2 parts: the sediment consolidation experiment and the seepage scouring experiment. In the sediment consolidation experiment, the seabed was consolidated under hydrostatic pressure for 24 h to obtain the internal pore pressure dissipation curve of the seabed; according to the pore pressure dissipation curve, we set different consolidation times of the seabed. In the seepage scouring experiment, after the seabed completed static water consolidation for different times, water flow was created on the seabed surface and seepage was applied in the seabed until the seepage failure occurred.
The sediments used in the experiments were taken from the intertidal flat of an abandoned Diaokou lobe of the YRD. The sediments were clayey silts that were composed of fine sand (31.7%), silt (53.5%), and clay (14.8%) by densimeter method and liquid limit plastic limit combined method, with a median particle size of 0.033 mm and a plasticity index of 8.4. The sediments were air-dried, pulverized, sieved, and mixed with fresh water at a weight ratio of 3.3:1 in order to prepare a slurry with a water content of about 30%, and backfilled into the soil tank to form a homogeneous seabed with a thickness slightly greater than 0.1 m [31].
Then, water was added to the annular flume to a depth of 10 cm, and water was added to the seepage cylinder to a head height of 40 cm, making it flush with the water surface in the flume, and then we carried out static water consolidation for different times (1, 3, 5, 8, 12, 15 h). After the consolidation was completed, we first scoured the seabed with a constant flow rate of 40 cm/s for 10 min, and then opened the seepage cylinder, and gradually increased the seepage pressure by adding water to the seepage cylinder, with each seepage gradient acting for 5 min. The instruments were used to simultaneously measure the suspended sediment concentration in water, the pore water pressure in the seabed, and the water pressure in the seepage cylinder.
3. Results
3.1. Sediment Consolidation Experiment
Before the formal experiment, the sediment consolidation experiment was carried out to understand the pore pressure dissipation law of the sediment. Excess pore pressure was the key index to characterize the seabed consolidation degree, which was calculated by removing the overlying static water pressure from the total pressure measured [32]:
where is the excess pore pressure, is the total pressure, and is the overlying static water pressure.
When the seabed was only backfilled, the excess pore water pressure in the soil reached the maximum value, which basically was equal to the overlying effective stress at this depth—the excess pore water pressure at 10 cm was 1.0 kPa. After that, the seabed experienced a significant pore pressure dissipation process in the first 12 h, the excess pore pressure decreased from 1.0 kPa to 0.11 kPa, and then remained basically unchanged, as shown in Figure 3. It can be found that the sediment completed the drainage consolidation process in a short period of time, which was consistent with the results of laboratory experiments carried out before using this flume [33], and the rapid consolidation process of the sediment observed in the Yellow River Estuary. According to the results of sediment consolidation experiment, the seabed consolidation time was set as 1, 3, 5, 8, 12, and 15 h to characterize the seabed with different consolidation degrees in order to study the critical hydraulic gradient for seepage failure of silty seabed under different consolidation degrees and its contribution to resuspension.
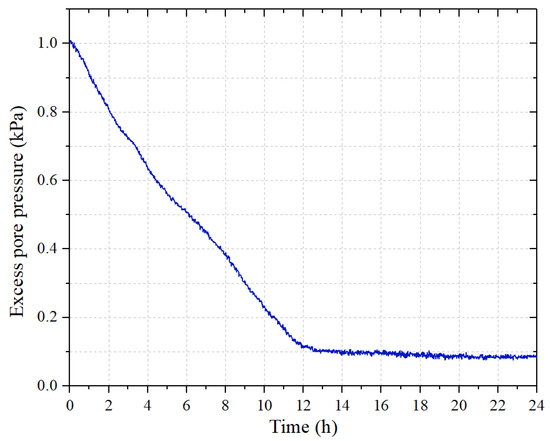
Figure 3.
Dissipation curve of excess pore water pressure in sediments.
Six rounds of experiments were carried out in the present study, and the experimental parameters are shown in Table 1.

Table 1.
Experimental parameters.
3.2. Typical Experimental Phenomenon
When the water flow scoured the seabed surface, the fine particles entrained and the overlying water became slightly muddy. When the seepage pressure increased step by step, the excess pore pressure in the soil increased, and the cracks appeared on the seabed surface (Figure 4a). When the seepage pressure increased to a certain value (i.e., critical seepage pressure), the seabed seepage failure occurred to form a seepage channel, and a seepage outlet appeared on the seabed surface (Figure 4b). A large amount of sediment was vertically eroded from the seabed and discharged into the water, resulting in a sharp increase of suspended sediment concentration (SSC). After the experiments, a collapse pit was formed at the seepage outlet on the seabed surface. This was similar to the experimental results of Zhang et al. [30]. However, due to the improvement of the device design, the seepage failure point was in the center of the seabed rather than the boundary of the soil tank.
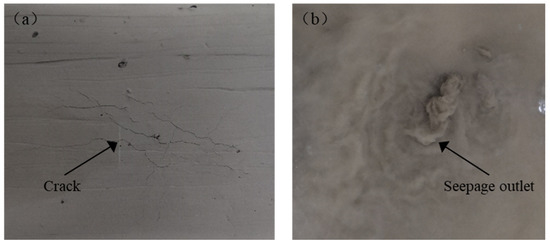
Figure 4.
Typical experimental phenomenon. (a) Before seepage failure: crack; (b) after seepage failure: seepage outlet.
3.3. Time Evolution of Seepage Pressure, Excess Pore Pressure, and SSC in the Seabed under Different Consolidation Times
After the seabed was consolidated under static water to a default time (i.e., 1, 3, 5, 8, 12, and 15 h for experimental rounds 1–6, respectively), the scouring stage started. It can be found that the excess pore pressure in the seabed still tended to dissipate (Figure 5); this was because the scouring of water flow generated an additional water seepage from the overlying water into the seabed, thus accelerating the consolidation of the seabed, leading to the rapid dissipation rate of excess pore pressure. Due to scour, the fine particles on the seabed surface were eroded, and the SSC in the overlying water increased.
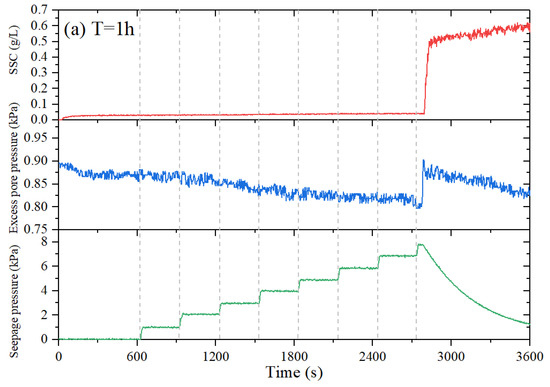


Figure 5.
Time evolution of seepage pressure, excess pore pressure, and suspended sediment concentration (SSC) in the seabed in each set of experiments. Consolidation times are (a) 1 h; (b) 3 h; (c) 5 h; (d) 8 h; (e) 12 h; (f) 15 h.
The seepage stage: except for the first round of the highest fluidization degree, the failure of the seabed always occurred under a relatively large seepage gradient; therefore, the initially applied seepage pressure was set as 5 kPa (in rounds 2–6), which made the excess pore pressure in the seabed increased rapidly. Because the accumulation of excess pore pressure in the field is from 0 to effective stress, the seepage gradient was increased step by step in this range. At this time, the excess pore pressure in the seabed changed slightly, but it showed a downward trend. In accordance with the effective stress principle, we believed that it could be because the applied seepage pressure was mainly transformed into effective stress between soil particles, which made the structure of soil particles more compact and led to the decrease of pore water pressure.
When the seepage pressure increased to a certain value, seepage failure occurred and a large amount of sediment was discharged, the excess pore pressure in the seabed increased rapidly, and the SSC in the overlying water also increased rapidly, which indicated that the seepage failure had a significant effect on the resuspension of sediments. With the discharge of fine particles from the seabed, the seepage pressure gradually decreased, the excess pore pressure in the seabed also decreased accordingly, but the SSC in the overlying water tended to be stable and maintained for quite a while. The changes of seepage pressure, excess pore pressure, and SSC in each experimental round are shown in Figure 5 and Table 2.

Table 2.
Key parameters before and after seepage failure of the seabed with different consolidation times.
4. Discussion
On the basis of the experimental results, we discuss three issues in this section: (1) the critical hydraulic gradient for seepage failure of silty seabed; (2) the mechanisms for different critical hydraulic gradients for seepage failure of silty seabed with different consolidation times; (3) the contribution of silty seabed seepage failure to resuspension.
4.1. Critical Hydraulic Gradient of Silts
In the present experiments, the critical hydraulic gradient () of silts was calculated as
where is the head difference, i.e., the height difference from the stable water level of the seepage cylinder to the water surface of the flume under each hydraulic gradient (cm), and L is the seepage path, i.e., the height of the seabed—in this paper, = 10 cm.
The results are shown in Figure 6. The of newly deposited silty seabed in the YRD was 8–16 in the range of the present experimental study (i.e., the consolidation time was 1–15 h). The sediment consolidation experiment shows that the dissipation of pore pressure tended to be stable after 12 h, after then, the main consolidation stage of the seabed was almost completed. However, before the completion of the main consolidation stage, the of the seabed with different consolidation times (i.e., 1, 3, 5, 8, 12 h) increased significantly from 8 to 16 with the consolidation time. After the completion of the main consolidation stage (i.e., 15 h), the remained unchanged as 16. The results show that the effect of consolidation time on of under-consolidated silts was significant and proportional.
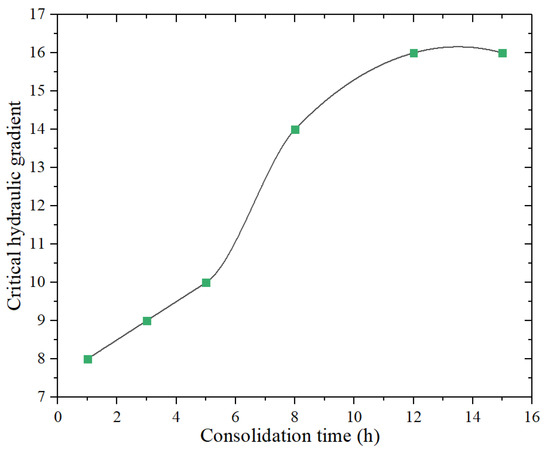
Figure 6.
The relationship between critical hydraulic gradient and consolidation time.
The Equations (1)–(3) were used to calculate the of silts, and the results are shown in Table 3. It was found that the theoretical formula of cohesionless soil was far from the experimental results, which indicates that the above theoretical formula was not suitable for the calculation of the of silts. To study the of silts for seepage failure, we performed the force analysis of soil element. In addition to the downward gravity and the upward seepage force of soil element, due to the cohesion between the silt particles, cohesive soil failure needs to overcome the cohesion between particles, thus increasing the hydraulic gradient by an additional [34]. In accordance with the limit equilibrium principle, we show the force of soil element in the limit equilibrium state in Figure 7. This indicates that the of silts was affected by the cohesion of the seabed [18]. Feng et al. measured the of silts in the YRD as 9.5–16.5 [35], which was consistent with the of silts measured in this paper as 8–16. However, the measurement method of the present study was much more simple, convenient, and intuitive than that of Feng et al.

Table 3.
Calculation results of the theoretical formula for cohesionless soil.
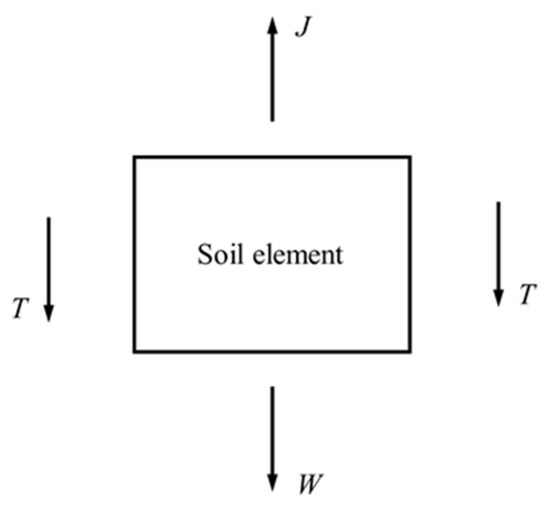
Figure 7.
The force of soil element in the limit equilibrium state (—seepage force; —gravity; cohesion).
4.2. Mechanism Explanation of Silt Seepage Failure
The difference of critical hydraulic gradients for seepage failure of the seabed with different consolidation times is highly related to the dissipation of pore pressure. The dissipation of excess pore pressure is related to the seabed fluidization degree [29], and the seabed fluidization degree is
where is the fluidization degree; is the effective stress of normal consolidation (kPa); is the effective bulk density, = 10 kN/m3; and is the burial depth of pore pressure probe, = 10 cm.
The results are shown in Table 1. It can be found that the seabed consolidation time was inversely proportional to the fluidization degree. When the consolidation time was short, the seabed fluidization degree was high, i.e., the excess pore pressure in the seabed had not been completely dissipated, and thus the effective stress between soil particles was low, and the strength of the seabed was low as well; therefore, it was easy for the seabed to fail under low hydraulic gradient ( = 8–14). As the consolidation time increased, the fluidization degree decreased, the excess pore pressure in the seabed dissipated, and the effective stress and the strength of the seabed increased. Therefore, a larger hydraulic gradient ( = 16) was required for seepage failure. When the fluidization degree was unchanged after 12 h, the dissipation of excess pore pressure tended to be stable, and the strength of the seabed was unchanged as well, and thus the seabed that had been consolidated for 12 h and 15 h occurred seepage failure under the same hydraulic gradient (Figure 6). In summary, the for seabed failure was inversely proportional to the seabed fluidization degree. As the fluidization degree increased, the strength of the seabed decreased [36], and the decreased, as shown in Figure 8.
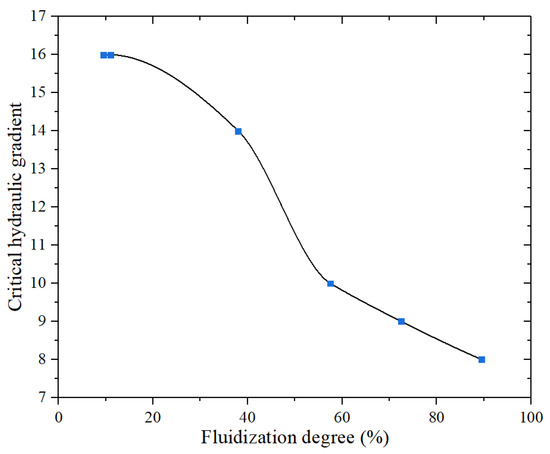
Figure 8.
The relationship between critical hydraulic gradient and fluidization degree.
The essence of soil fluidization and seepage failure is the limit equilibrium of seepage force and effective weight in the vertical direction. However, fluidization is a kind of overall failure, in which the whole soil transforms from solid to liquid; while seepage failure is a kind of partial failure, where unstable seepage only develops along the weak zone (Figure 9) [37].
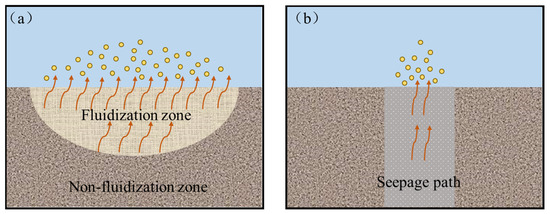
Figure 9.
Schematic diagram of fluidization and seepage failure. (a) Fluidization; (b) seepage failure.
The occurrence of seepage in cohesive soil was determined by the interaction between water and soil [38]. It can be inferred from the microstructure that at the initial stage of seepage, due to the binding effect of clay particles, soil particles were aggregated, the pore channels were filled with bound water, the pore diameter was small, and thus it was difficult for the seepage to occur; with the increase of hydraulic gradient, the bound water turned into free water and participated in the seepage, the soil particles were dispersed, and the pore diameter increased. When the hydraulic gradient increased to the maximum shear strength of the bound water, most of the bound water turned into free water, the pore diameter further increased, the soil particles migrated, and local seepage failure occurred. The transformation process of the structure between soil particles and pore water is shown in Figure 10. The shear strength of the seabed with different fluidization degrees was different, which led to the different critical hydraulic gradients.

Figure 10.
The transformation process of the structure between soil particles and pore water. (a) At the initial stage of seepage; (b) when locally seepage failure.
4.3. The Contribution of Seepage Failure to Resuspension
The influence of seepage flows on sediment entrainment has attracted extensive attention in recent years [30,39,40,41,42]. Under the scouring action of water flows, the surface erosion of the seabed with upward seepage will be intensified [43]. However, few works have focused on the extreme scenario, i.e., seepage failure. In the present work, after seepage failure, the internal fine particles were eroded and “pumped” upwards (Figure 11) [23,44], and thus the SSC in the overlying water increased rapidly. Under the scouring effect of water flow, the erosion of the seabed was further intensified, and the amount of resuspension was increased.
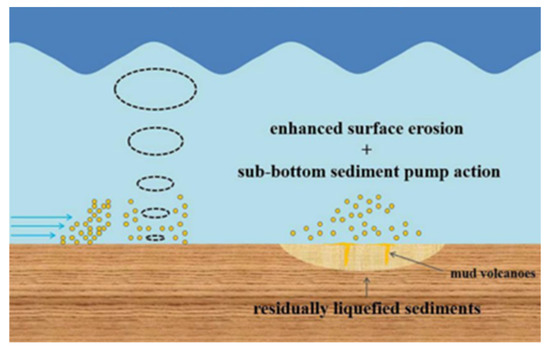
Figure 11.
Sub-bottom sediment pump action [44].
Before seepage failure, the SSC in the overlying water was 0.022–0.041 g/L; after failure, the SSC increased to 0.538–0.692 g/L, which was about 14.7–31.5 times of that before failure. The contribution of seepage failure to sediment resuspension was estimated at up to 93.2–96.8%. This is even larger than the contribution (64%) measured by Zhang et al. with the same flume [30]. The reasons are as follows: on the one hand, Zhang et al. exerted a larger scouring velocity, which led to a greater contribution of horizontal erosion to total resuspension; on the other hand, in their experiments, seepage failure occurred along the sidewall of the soil tank, which may have made the measured contribution results inaccurate.
Based on the analysis of the SSC in the overlying water after the seabed failure with different consolidation times, it is concluded that the SSC decreased with the increase of the consolidation time (Figure 12), indicating that the effect of seepage failure on the sediment resuspension decreased with the increase of consolidation time, i.e., the higher the consolidation degree of the seabed, the smaller the contribution of pumping caused by seepage failure to resuspension will be. This is because as the consolidation time increases, the seabed strength increases, thus the area of seepage failure decreases, resulting in the decrease of fine particle transport and SSC.
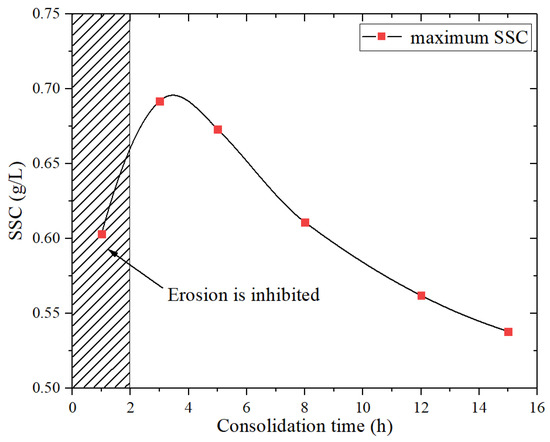
Figure 12.
The relationship between the maximum SSC after failure and consolidation time.
However, it was found that the maximum SSC after failure in the first round (consolidation time was 1 h) was lower than that in the second round (consolidation time was 3 h). It seemed that the vertical erosion of the seabed was inhibited in the round with the lowest consolidation degree. This was because the water in the overlying water kept seeping into the seabed in the first experimental round by overwhelming the upward seepage, thereby inhibiting the erosion.
5. Conclusions
The newly deposited seabed in the Yellow River Delta (YRD) was vulnerable to seepage failure, endangering the safety of offshore structures. To study the critical hydraulic gradient () for seepage failure of newly deposited seabed in the YRD, we carried out comparative experiments with an improved annular flume by simulating the seepage failure process of the seabed with different consolidation times. Three issues were analyzed and discussed on the basis of the experimental results: (1) the critical hydraulic gradient for seepage failure of silty seabed; (2) the mechanisms for different critical hydraulic gradients for seepage failure of silty seabed with different consolidation times; (3) the contribution of silty seabed seepage failure to resuspension. Specific conclusions can be summarized as
(1) Making the vertical seepage path smaller than the horizontal seepage path successfully realized the seepage failure occurring in the middle of the seabed, thus avoiding the boundary effect (i.e., seepage failure occurs along the sidewall of the flume).
(2) The effect of consolidation time on the critical hydraulic gradient () of under-consolidated silts was significant and proportional. The of newly deposited silty seabed in the YRD was 8-16, which was far from the theoretical formula calculation results of the cohesionless soil, indicating that the formula of cohesionless soil was not suitable for silts, and the of silts was greatly affected by the cohesion of the seabed.
(3) The for seepage failure was different with different consolidation times, which was highly related to the seabed fluidization degree. The when the seepage failure occurred was inversely proportional to the seabed fluidization degree, because the fluidization degree affected the shear strength of the seabed.
(4) Seepage failure had an important impact on the erosion and resuspension of sediments, that is, the vertical resuspension of sediments was caused by “pumping”, and the contribution can reach up to 93.2–96.8%. The higher the consolidation degree of the seabed, the smaller the contribution will be, because as the consolidation time increases, the seabed strength increases, and thus the area of seepage failure decreases, resulting in the decrease of fine particle transport and suspended sediment concentration.
Author Contributions
Conceptualization, Y.J. and S.Z.; methodology, M.T.; validation, M.T. and C.W.; data curation, M.T.; writing—original draft preparation, M.T.; writing—review and editing, Y.J., S.Z., and H.L.; supervision, Y.J. and S.Z.; project administration, Y.J. and S.Z.; funding acquisition, Y.J. and S.Z. All authors have read and agreed to the published version of the manuscript.
Funding
This research was funded by the Youth Project of the Natural Science Foundation of China (grant number 41807229), the Postdoctoral Research Foundation of China (grant number 2018M640656), the Natural Science Foundation of Shandong Province (grant number ZR2019BD009), Shandong Provincial Postdoctoral Program for Innovative Talents (S. Zhang), the NSFC major instrument development project [grant number 41427803], the National Natural Science Foundation of China-Shandong Joint Fund for Marine Science Research Centers [grant number U1606401], and the Funding for Study Abroad Program by the Government of Shandong Province (grant number 201801026).
Institutional Review Board Statement
Not applicable.
Informed Consent Statement
Not applicable.
Acknowledgments
We sincerely thank Editors and the anonymous reviewers for their constructive comments. The authors appreciate the assistance of China Patent ZL201710061388.X (Zhang, S.; Jia, Y.; Zhang, Y.; Liu, X.; Xiong, C.; Shen, Z.; Shan, H. An annular flume for inves-tigating sediment resuspension process under the influence of seepage flows. China Patent ZL201710061388.X, 2017) in the experiments.
Conflicts of Interest
The authors declare no conflict of interest.
References
- Jia, Y.; Liu, X.; Zhang, S.; Shan, H.; Zheng, J. Wave-Forced Sediment Erosion and Resuspension in the Modern Yellow River Delta; Springer: Berlin/Heidelberg, Germany, 2020. [Google Scholar]
- Li, G.; Wei, H.; Yue, S.; Cheng, Y.; Han, Y. Sedimentation in the Yellow River delta, part II: Suspended sediment dispersal and deposition on the subaqueous delta. Mar. Geol. 1998, 149, 113–131. [Google Scholar] [CrossRef]
- Li, G.; Wei, H.; Han, Y.; Chen, Y. Sedimentation in the Yellow River delta, part I: Flow and suspended sediment structure in the upper distributary and the estuary. Mar. Geol. 1998, 149, 93–111. [Google Scholar] [CrossRef]
- Jia, Y.; Zhang, L.; Zheng, J.; Liu, X.; Jeng, D.-S.; Shan, H. Effects of wave-induced seabed liquefaction on sediment re-suspension in the Yellow River Delta. Ocean Eng. 2014, 89, 146–156. [Google Scholar] [CrossRef]
- Li, G.; Zhuang, K.; Wei, H. Sedimentation in the Yellow River delta. Part III. Seabed erosion and diapirism in the abandoned subaqueous delta lobe. Mar. Geol. 2000, 168, 129–144. [Google Scholar] [CrossRef]
- Nichols, R.J.; Sparks, R.S.J.; Wilson, C.J.N. Experimental studies of the fluidization of layered sediments and the formation of fluid escape structures. Sedimentology 1994, 41, 233–253. [Google Scholar] [CrossRef]
- Wang, H.; Liu, H.; Zhang, M. Pore pressure response of seabed in standing waves and its mechanism. Coast. Eng. 2014, 91, 213–219. [Google Scholar] [CrossRef]
- Chen, Z.; Zhou, J.; Wang, H. Soil Mechanics, 1st ed.; Tsinghua University Press: Beijing, China, 1994; pp. 56–64. [Google Scholar]
- Prior, D.B.; Suhayda, J.N.; Lu, N.Z.; Bornhold, B.D.; Keller, G.H.; Wiseman, W.J.; Wright, L.D.; Yang, Z.S. Storm wave reactivation of a submarine landslide. Nature 1989, 341, 47–50. [Google Scholar] [CrossRef]
- Xu, G.; Sun, Y.; Wang, X.; Hu, G.; Song, Y. Wave-induced shallow slides and their features on the subaqueous Yellow River delta. Can. Geotech. J. 2009, 46, 1406–1417. [Google Scholar] [CrossRef]
- Jeng, D.-S.; Zhang, J.; Kirca, Ö. Coastal Geohazard and Offshore Geotechnics. J. Mar. Sci. Eng. 2020, 8, 1011. [Google Scholar] [CrossRef]
- Terzaghi, K. Der Grundbruch an Stauwerken und Seine Verhutung. Wasserkraft 1922, 17, 445–449. [Google Scholar]
- Sha, J. Research on piping in porous media. Hydro-Sci. Eng. 1981, 89–93. (In Chinese) [Google Scholar] [CrossRef]
- Liu, J. Seepage Control of Earth-Rock Dams Theoretical Basis, Engineering Experiences and Lessons, 1st ed.; China WaterPower Press: Beijing, China, 2006; pp. 30–45. [Google Scholar]
- Davidenkoff, R.; Chang, K. Application of soil filter in hydraulic structures. Hydro-Sci. Eng. 1977, 86–105, (Translated into Chinese). [Google Scholar]
- Liu, J.; Miao, L. Research on influencing factors of impermeability strength of general cohesive soil. J. Hydraul. Eng. 1984, 11–19. (In Chinese) [Google Scholar]
- Liu, J. Seepage Stability and Seepage Control of Soil, 1st ed.; China WaterPower Press: Beijing, China, 1992; pp. 60–84. [Google Scholar]
- Song, X.; Qian, C. Analysis of hydraulic gradient of cohesive soil in water seepage. South-to-North Water Transf. Water Sci. Technol. 2010, 8, 65–67. (In Chinese) [Google Scholar] [CrossRef]
- Liu, J. Study on seepage failure test and numerical simulation of cohesive soil. Master’s Thesis, Hefei University of Tech-nology, Hefei, China, 23 April 2015. [Google Scholar]
- Jiang, F. Discussion on Formula Derivation and Test of Critical Hydraulic Condition of Cohesive Soil. Chin. J. of Undergr. Space and Eng. 2017, 13, 1472–1476+1498. (In Chinese) [Google Scholar]
- Jeng, D.-S. Wave-induced sea floor dynamics. Appl. Mech. Rev. 2003, 56, 407–429. [Google Scholar] [CrossRef]
- Jeng, D.-S. Porous Models for Wave-Seabed Interactions, 1st ed.; Springer: Berlin/Heidelberg, Germany, 2012; pp. 251–270. [Google Scholar] [CrossRef]
- Zhang, S.; Jia, Y.; Wen, M.; Wang, Z.; Zhang, Y.; Zhu, C.; Li, B.; Liu, X. Vertical migration of fine-grained sediments from interior to surface of seabed driven by seepage flows–‘sub-bottom sediment pump action’. J. Ocean Univ. China 2017, 16, 15–24. [Google Scholar] [CrossRef]
- Lambrechts, J.; Humphrey, C.; McKinna, L.; Gourge, O.; Fabricius, K.E.; Mehta, A.J.; Lewis, S.; Wolanski, E. Importance of wave-induced bed liquefaction in the fine sediment budget of Cleveland Bay, Great Barrier Reef. Estuar. Coast. Shelf Sci. 2010, 89, 154–162. [Google Scholar] [CrossRef]
- Tong, D.; Liao, C.; Chen, J.; Zhang, Q. Numerical Simulation of a Sandy Seabed Response to Water Surface Waves Propagating on Current. J. Mar. Sci. Eng. 2018, 6, 88. [Google Scholar] [CrossRef]
- Zhang, J.; Jiang, Q.; Jeng, D.; Zhang, C.; Chen, X.; Wang, L. Experimental Study on Mechanism of Wave-Induced Liquefaction of Sand-Clay Seabed. J. Mar. Sci. Eng. 2020, 8, 66. [Google Scholar] [CrossRef]
- Fox, G.A.; Wilson, G.V.; Simon, A.; Langendoen, E.J.; Akay, O.; Fuchs, J.W. Measuring streambank erosion due to ground water seepage: Correlation to bank pore water pressure, precipitation and stream stage. Earth Surface Process. Landf. 2007, 32, 1558–1573. [Google Scholar] [CrossRef]
- Liu, X.-L.; Jia, Y.-G.; Zheng, J.-W.; Hou, W.; Zhang, L.; Zhang, L.-P.; Shan, H.-X. Experimental evidence of wave-induced inhomogeneity in the strength of silty seabed sediments: Yellow River Delta, China. Ocean Eng. 2013, 59, 120–128. [Google Scholar] [CrossRef]
- Wang, H.; Liu, H.; Zhang, M.; Wang, X. Wave-induced seepage and its possible contribution to the formation of pockmarks in the Huanghe (Yellow) River delta. Chin. J. Oceanol. Limnol. 2016, 34, 200–211. [Google Scholar] [CrossRef]
- Zhang, S.; Jia, Y.; Lu, F.; Zhang, Y.; Zhang, S.; Peng, Z. Effects of Upward Seepage on the Resuspension of Consolidated Silty Sediments in the Yellow River Delta. J. Coast. Res. 2020, 36, 372–381. [Google Scholar] [CrossRef]
- Dai, X.; Jia, Y.; Zhang, S.; Zhang, S.; Zhang, H.; Shan, H. Influence of salinity on sediment erosion-resistance: Evidence from annular flume studies. Mar. Geol. Quat. Geol. 2020, 40, 222–230. (In Chinese) [Google Scholar] [CrossRef]
- Zhang, S. Effects of Wave-Induced Silty Seabed Liquefaction on Sediment Erosion and Resuspension. Ph.D. Thesis, Ocean University of China, Qingdao, China, 8 December 2017. [Google Scholar]
- Zhang, S.; Jia, Y.; Zhang, Y.; Shan, H. Influence of Seepage Flows on the Erodibility of Fluidized Silty Sediments: Parameterization and Mechanisms. J. Geophys. Res. Ocean. 2018, 123, 3307–3321. [Google Scholar] [CrossRef]
- Yang, Y.; Gong, X.; Zhou, C.; Jin, X. Experimental study of seepage failure of Qiantang River alluvial silts. Rock Soil Mech. 2016, 37, 243–249. (In Chinese) [Google Scholar] [CrossRef]
- Feng, X.; Ma, Y.; Lin, L.; Xu, C. Discuss of silt critical hydraulic gradient in modern Huanghe subaqueous delta. Mar. Sci. 2002, 26, 54–57. (In Chinese) [Google Scholar] [CrossRef]
- Green, M.O.; Coco, G. Review of wave-driven sediment resuspension and transport in estuaries. Rev. Geophys. 2014, 52, 77–117. [Google Scholar] [CrossRef]
- Wang, H. Mechanism and quantitative evaluation of wave-induced seabed instability in the Yellow River delta. Ph.D. Thesis, Ocean University of China, Qingdao, China, 8 June 2015. [Google Scholar]
- Wang, X.; Liu, C. New Understanding of the Regularity of Water Seepage in Cohesive Soil. Acta Geosci. Sin. 2003, 24, 91–95. (In Chinese) [Google Scholar] [CrossRef]
- Guo, Z.; Jeng, D.S.; Zhao, H.; Guo, W.; Wang, L. Effect of seepage flow on sediment incipient motion around a free spanning pipeline. Coast. Eng. 2019, 143, 50–62. [Google Scholar] [CrossRef]
- Li, K.; Guo, Z.; Wang, L.; Jiang, H. Effect of seepage flow on shields number around a fixed and sagging pipeline. Ocean Eng. 2019, 172, 487–500. [Google Scholar] [CrossRef]
- Li, Y.; Ong, M.C.; Fuhrman, D.R. CFD investigations of scour beneath a submarine pipeline with the effect of upward seepage. Coast. Eng. 2020, 156, 103624. [Google Scholar] [CrossRef]
- Zhai, H.; Jeng, D.S.; Guo, Z.; Liang, Z. Impact of two-dimensional seepage flow on sediment incipient motion under waves. Appl. Ocean Res. 2021, 108, 102510. [Google Scholar] [CrossRef]
- Zheng, J.; Jia, Y.; Liu, X.; Shan, H.; Zhang, M. Experimental study of the variation of sediment erodibility under wave-loading conditions. Ocean Eng. 2013, 68, 14–26. [Google Scholar] [CrossRef]
- Zhang, S.; Jia, Y.; Zhang, Y.; Liu, X.; Shan, H. In situ observations of wave pumping of sediments in the Yellow River Delta with a newly developed benthic chamber. Mar. Geophys. Res. 2018, 39, 463–474. [Google Scholar] [CrossRef]
Publisher’s Note: MDPI stays neutral with regard to jurisdictional claims in published maps and institutional affiliations. |
© 2021 by the authors. Licensee MDPI, Basel, Switzerland. This article is an open access article distributed under the terms and conditions of the Creative Commons Attribution (CC BY) license (http://creativecommons.org/licenses/by/4.0/).