Abstract
This paper assesses the impact of a major disruptive event at the port of Gothenburg, Scandinavia’s largest container port. Automatic Identification System (AIS) data is analyzed, in combination with official port statistics on container handling in the four main container ports in Sweden, from 2014–2018. Particular attention is paid to the relationship between container volumes handled and calculated performance metrics at the specific times of the intense labour dispute at the port of Gothenburg during the periods Q2 (2016) and Q4 (2016)–Q2 (2017). The paper concludes that the decline in container volumes handled at Gothenburg over the period is specifically due to fewer ships calling at the port following each of the intense periods of the labour dispute. It is also concluded that the effect on competitor ports in the region were significant in terms of both increased volumes of gateway container traffic and the resulting short-term and medium term impacts on both port user profiles and port efficiency levels.
1. Introduction
The research field of supply chain resilience has grown in prominence over recent years [,,]. This is undoubtedly due to the increasing occurrence of several circumscribed events causing supply chain disruptions, that can be labelled as high-severity/low-probability events []. These can be both natural (such as earthquakes, hurricanes, tsunamis etc.) and man-made (such as terrorism, strikes etc.). Because ports play such a pivotal role in global and regional supply chains, they are particularly vulnerable to the effects of such events, with the adverse consequences of the ensuing disruptions having a significant impact.
Lam and Su [] point out that while natural events result in the greatest severity of impact on ports, it is man-made disruptions (mainly accidents and industrial action) which more commonly exert a negative influence over the normal routine of port operations. Indeed, Loh et al. [] report that a sample of non-port companies ranked the consequences of port conflicts as being worse than any other sort of disruption to port activities. More specifically, any dispute or conflict between port management and labour has the potential to bring about a range of negative consequences, in particular in areas where severe natural disasters are uncommon. Most immediately, industrial action brings about a reduction in both potential capacity and measured productivity [], as well as compromising existing business relationships with different stakeholders, but particularly port customers []. In the medium to longer term, the presence of these immediate effects has the potential to influence port choice and, therefore, to undermine the competitiveness of a port. Ultimately, this leads to a smaller customer base, lower levels of revenue and higher costs for the port [,,], as well as a reduction in the socio-economic welfare that accrues to the region in which the port is located [].
Even though supply chain disruptions are commonly investigated phenomena, research on the effects of disruptions on maritime container traffic is sparse []. At the same time, there exists a significant and unique potential to make use of AIS data, integrated with port statistics on container cargoes handled, in order to develop a more comprehensive vision of the vessel and container traffic to and from a port. The more general advantages of integrating AIS data with port call data lies with supplementing and enhancing the data available, particularly with respect to the time a ship spends in port waiting, manoeuvring and at berth; information which typically is not collected as part of port call data. In this study, this provides the opportunity to assess the impact on port productivity (or efficiency) of changes in port choice. As proved to be very relevant within this study, it also provides the opportunity to validate port call data1 and, to a certain extent, for port call data to validate AIS data that is not automatically generated. Through the ability to track ships using AIS data, there is also the potential to determine speeds, changes in speed and routings, to identify which ships and operators have switched ports and to determine the environmental impacts of changes in port performance and associated changes in port selection.
The more specific purpose of this paper is to combine the use of both AIS data and port statistics to analyse the traffic to and from a port before, during and after a port conflict. The port conflict in Gothenburg during the period 2016–2017 serves as a case study, with the market share of the focal port of Gothenburg representing about 56% of handled containers in Sweden in 2015, but falling to just 41% in 2017. In a country where there are about 20 ports in total which handle containers, three other ports that have been included in the study—Helsingborg, Norrköping and Gävle—since together these three ports handled a further 26% of Sweden’s total container volumes in 2015.
The paper is structured as follows. In the ensuing Section 2, a literature review is undertaken to provide a context for the analysis of port disruptions and to explain the previous use of AIS data in relevant contexts. In Section 3, some background to the dispute at the port of Gothenburg is provided. Section 4 elaborates the methodology for the study, with the results of the analysis presented in Section 5. A discussion of the results and the conclusions to be drawn from them is contained in Section 6.
2. Literature Review
The analysis of disruptions to supply chains has become a well-studied phenomenon in logistics over the past two decades. In particular, several papers have identified different phases of disruptions [,], as well as various mitigation strategies for transport buyers to manage disruptions [,,]. However, the focus in most of these works is on land-based, rather than maritime, supply chains. In addition, the approaches adopted in such analyses are typically from a wider logistics perspective, rather than focusing more specifically on transport and transport efficiency, particularly in terms of evaluating the potential effects on transport buyers.
Maritime traffic and port disruptions have been investigated in a few cases. For example, in terms of general disruption risks and mitigation strategies for ports [,,,,] and the estimation of economic losses [,]. Thus far, however, little is known about how a disruption affects the maritime traffic to and from a port, even though strikes in ports have long been acknowledged as having very large consequences for transport buyers and, ultimately, for the national economies in which they are based [,].
This dearth of analyses is all the more surprising given the possibility of analyzing shipping movements with a high degree of spatial-temporal accuracy through the use of the AIS-system []. In accordance with the SOLAS convention (2002), all ships over 300 GT must be equipped with an AIS transponder. Originally aimed at enhancing maritime safety and navigational operations, AIS-data has been used to study maritime traffic in various applications. For example, Wu et al. [] mapped global shipping movements in terms of vessel and traffic density; Shelmerdine [] used AIS data to map traffic around the Shetland islands in order to identify temporal variations; Jensen et al. [] found that outside San Francisco Bay, traffic varies daily and annually, but is stable seasonally; Coomber et al. [] identified differences between day and night traffic and between the transit speeds of different ship types within the Pelagos Sanctuary and; maritime traffic has been mapped in various straits and channels for a variety of different purposes [,,,]. All these examples, however, are in general not connected to any port or other commercial aspects, but rather focus on ship traffic movements at sea.
In a recent review of the literature, Yang et al. [] point to the development of applications using AIS data which focus more on the commercial aspects of shipping movements, many of which combine AIS data with other statistical sources. For example, a number of papers have analysed the utilization of a vessel’s cargo-carrying capacity using AIS data on draught and, in combination with other sources of data, sought to explain the factors which influence this [,]; with a focus on crude oil movements by ship, Adland, Jia et al. [] showed that AIS data can be used as an alternative to official customs data to derive trade statistics; Adland, Fonnes et al. [] showed that vessel speed did not seem to be affected by the implementation of emission control areas; in order to illustrate the effectiveness of their proposed model for minimising the cost of shipping in the Baltic Sea, Andersson and Ivehammar [] used AIS data as the basis for their cost-benefit analysis; based on AIS data and the development of a regression model, Adland and Jia [] identified the factors influencing the speed of ships.
Maritime traffic has been mapped using AIS data with respect to ports in just a few papers. Seoane et al. [] determined the foreland of container and general cargo ports in Europe; Jia et al. [] investigated Norwegian port connectivity in terms of vessel visits, vessel sizes, and cargo sizes; Yu et al. [] showed the different layers that Chinese ports are linked in and; based on the use of AIS data, Jia et al. [] proposed an algorithm for aggregating, mapping and distributing real-time trade flows between the major ports of the world. There has been even less port-based research using AIS data that has focussed on areas that are more directly relevant to the objectives of this paper. However, Chen et al. [] used ship positions derived from AIS data to analyse ship traffic, container throughput, berth utilisation and the terminal productivity of the largest worldwide container ports. More recently, the US Government has begun to use AIS data to measure the dwell time of ships at different ports in the US and to publish this information to facilitate port choice [].
In only a single paper has AIS data been used to assess the impact on port operations following major disruptive events. In that work, Farhadi et al. [] analysed United States archived AIS data to quantify the level of resilience of coastal navigation systems following two disruptive events affecting port performance; a ship collision within port boundaries and damage to port infrastructure caused by a significant storm. The applied methodology revolved around a comparative analysis of ship movements in two case study ports both before and after the disruptive event, in order to determine, respectively, what constituted normal conditions and how the speed and pattern of port activity evolved during the recovery period. With a focus on a single port in both case studies, the authors have implicitly assumed that each of the ports concerned has the objective of returning to normal conditions as soon as possible following the disruptive event. This is an entirely reasonable assumption to make within the scope of the analysis undertaken. However, the scope of their work does not account for the interactive effects of the disruptive event on other ports within the region. For example, it is feasible that neighbouring ports might aim to take advantage of the disruptive event by seeking to attract new calls at the expense of the port where the disruptive event occurred. By so doing, the ambitions of the two case study ports to return to normal conditions following the disruptive event may be undermined.
In contrast, the analysis presented herein widens the scope to account for the interactions between ports following a disruptive event. It is also different in that the disruptive event in the case of Gothenburg port is not a single one-off event, like a ship collision or storm, where recovery begins almost immediately. Rather, the disruptive event in the Gothenburg case has proved to be long-lasting, with sporadic peaks in adverse impacts and of a duration which was impossible to forecast as it occurred. A further contrast with Farhadi et al. [] and representing a significant contribution of this work is that it uniquely utilises port statistics, in combination with AIS data, to derive greater insights into the impact of the disruptive event on shipping within the geographical scope of analysis.
3. Background to the Case of Gothenburg
APM Terminals (APMT) has operated the 80-hectare container terminal at the port of Gothenburg since January 2012 under a 25-year concession []. With the potential to handle the largest containerships, Gothenburg’s container terminal has a throughput capacity of two million TEUs per annum2 and is the largest and busiest container terminal in Scandinavia []. Relations between APMT and the Swedish Dockworkers Union (SDU), one of the two unions representing dock labour within the port, have been strained since the start. Furthermore, it is often claimed that the origins of this dispute goes as far back as the beginning of the 1970s, with a lot of minor strikes and disagreements since then between the SDU and the previous port operator. In the middle of 2016, however, the dispute escalated significantly. The dispute revolved around the SDU’s demand for a local collective bargaining agreement that was separate from that at national level between ‘Ports of Sweden’ (representing the employers in the Swedish ports sector) and the other major labour union, the Swedish Transport Workers Union (SWTU). As things transpired, this dispute was to last two years and would involve the intervention of not only the National Swedish Mediation Institute, but also even the Swedish Government that, as a direct consequence of the dispute, launched a national inquiry into Sweden’s port labour laws. During the course of the dispute, the SDU took industrial action (mainly strikes and blockades) on numerous occasions, with APMT Gothenburg responding with their own retaliatory measures (e.g., lockouts).
In common with all disruptive events, the dispute between APMT Gothenburg and the SDU effectively led to a reduction in the supply of deliverable capacity at Gothenburg’s container terminal. At various points in the dispute, it was reported that Gothenburg’s container terminal was handling somewhere between 30–40% on average of its maximum capability [], as only the daytime shift was operating. Because of the constraints placed on operations by insufficient availability of labour, the container terminal operator was obliged to renegotiate numerous port calls. This decrease in productivity and the general uncertainty surrounding the potential effects of the dispute on APMT’s customers resulted in many cargoes being re-routed to other ports [,]. For instance, citing poor productivity and disrupted schedules, both Atlantic Container Line and the 2M alliance cancelled all calls at the port by their larger mainline vessels, restricting calls solely to feeders []. It is estimated that around 25% of Swedish businesses have been affected by the dispute and that more than half of these have taken a range of actions to mitigate the adverse consequences, such as rerouting cargoes to other ports in Sweden or abroad and/or using other modes of transport completely. According to a report conducted by Damvad Analytics [], in 2017 alone, this resulted in additional private costs to Swedish businesses of §US 500 million and an increase in carbon dioxide emissions of 70,000 tonnes, corresponding to additional socio-economic costs of §US 8.5 million.
4. Methodology
4.1. Data Collection
The analysis undertaken within this paper makes use of three sources of data.
- AIS data is used to gather data on ship traffic. AIS data contains numerous fields of data items but, for the purposes of this analysis, the primary variable of interest is the position of the ships at different points in time. This is particularly the case in enumerating how long ships spend in port. To this end, an approach based on the specification of a polygon to represent the area of a port is deployed. Using the example of Gothenburg container terminal, this concept is illustrated in Figure 1. In addition to information on ship position, the ‘length overall (LOA)’l of a vessel is also collected from AIS data, as a measure of ship size.
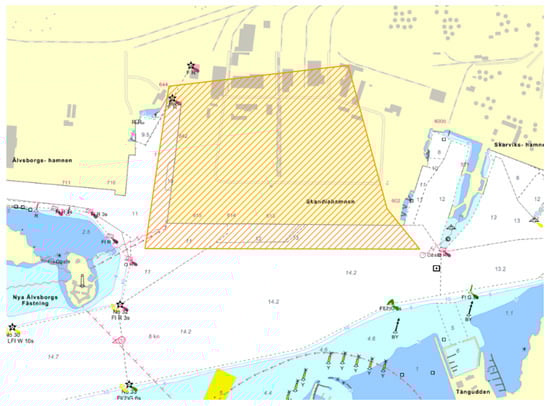 Figure 1. Gothenburg Container Terminal, with a drawn polygon (in orange) defining the relevant port area.
 - In order to obtain historical data on the container volumes handled at each of the ports under study, port statistics have been accessed from []. For each of the ports under study, the data collected relates to total containers and total TEUs handled per quarter.
- Data on the port conflict serves as a lens for analysing the statistical data. The detailed data relating to the timeline of the port conflict can be seen in Table 1, which highlights the fact that the main actions in the port conflict took place in the periods 2016 (Q2) and 2016 (Q4)–2017 (Q2).
 Table 1. Timeline for the port conflict. SDU, Swedish Dockworkers Union; APMT, APM Terminals.
4.2. Method of Analysis
AIS data on container vessel movements are combined with the port statistics on container cargoes handled to produce a number of base data tables for each of the ports under study, covering the period 2014–2018 inclusive. An example for the port of Gothenburg is provided in Table 2, but similar base data tables have also been prepared for the other three ports under study—Helsingborg, Norrköping and Gävle. As can be seen, the base data table presented in Table 2 for the port of Gothenburg relates primarily to the fundamentals of overall port performance over the period of analysis, with quarterly information provided on the total number of cargo units handled and the total tonnage of cargo handled. This provides a wider context for the significance of container operations within each of the ports under study. More specifically, basic data on container terminal operations are also provided in terms of the number of container ship arrivals, the number of containers handled, the number of TEUs this represents and the total tonnage of cargo handled in containers.
Table 2.
Base Statistics for the Port of Gothenburg.
Most critically, the detailed analysis of AIS data provides the time an individual ship is located within a pre-defined port polygon (as illustrated earlier in Figure 1) and is used to derive an approximation for the length of time a ship is at berth within each of the container ports under analysis. This is derived from the AIS message, which for example contains longitude and latitude position at a specific time. These messages need to be filtered by ship type (to focus solely on containerships) and by geographical location (to fall within the coordinates of the predefined port polygons) and then the specific time of entering and exiting the port polygons needs to be identified for each qualifying vessel. These times are aggregated for all container ship calls across the whole quarter to yield the ‘Total Hours’ column in Table 2. The amount of work involved in undertaking this task should not be underestimated. Ships within the area covered by the Swedish Maritime Administration’s (SMA) coastal very high frequency (VHF) stations generate approximately 200 million AIS messages each month. However, most of the AIS messages are discarded at an early stage of the initial processing of the feed, because they are sent from ships when they are laying still, and the filtering process is done on roughly 1 billion AIS messages.
AIS data alone does not give any information on the amount of cargo carried by the ship. However, AIS data does contain information on the current draught of the ship which might give an indication of the amount of cargo, although this information (together with a range of other information) is manually entered by the crew and thus not very reliable. This highlights the importance of appropriate data preparation and the assurance of data quality as an inevitable first stage in any analysis which utilises AIS data. Obviously, this process is greatly complicated by the sheer volume of data to be handled. In the specific case of determining the volume of cargo on board a ship based on the AIS data on draught, port statistics may provide a means of validating the data available through AIS. Therefore, this study combines the filtered AIS data, i.e. which ship and the total time spent at berth for that ship, with cargo handling data from the ports.
5. Results
By applying a few basic formulae to the base data contained in Table 2, a set of calculated performance indicators can be derived. These are shown in Table 3 for the case of Gothenburg but, clearly, this process has been replicated across all the ports under study.
Table 3.
Calculated Performance Indicators for the Port of Gothenburg.
5.1. Container Volumes Handled
The analysis of port statistics reveals how container volumes have changed across the four ports throughout the period of analysis. This is depicted graphically in Figure 2, which should be viewed against a context where total container volumes handled in Sweden have grown from 1.46 m TEU in 2014 to 1.60 m in 2018. As is clearly shown in Figure 2, the smaller ports were growing before the conflict, but have grown even more during the conflict.
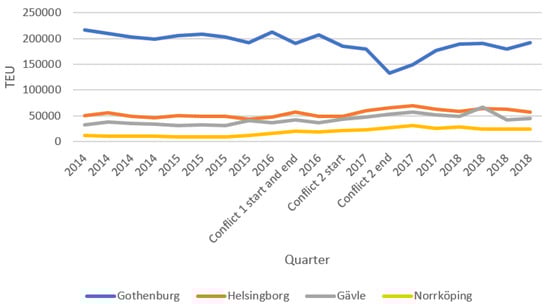
Figure 2.
Number of TEUs Handled in the Four Ports.
From Figure 2, it can be observed that the port of Gothenburg experienced a decline in container volumes during the periods of intense port conflict. A relatively small decline was experienced during the first period of port conflict (2016(Q2)), which the container terminal partly recovered from in Q3 of 2016. However, during the second and longer period of intense port conflict (2016(Q4)–2017(Q2)), the port saw a large decline in container volumes handled. At the end of 2018, more than one and a half years after the conflict had begun, the port of Gothenburg had still not fully recovered the container volumes lost.
It can also be observed from Figure 2, that the three other ports under study were able to increase their volumes slightly during the periods of port conflict within the port of Gothenburg. However, the slight increase in container volumes handled by the three other ports under study only absorbed about 55% of the volumes lost at the port of Gothenburg. Even if all ports in Sweden are included, it can still be observed in the national port statistics that when comparing 2016 (Q1–Q2) with 2017 (Q1–Q2), there was a 4% decrease in the total number of containers handled in Sweden. This compares to no change in the volume of ro-ro traffic for example, as seen in the port statistics. Following the redirection of some container traffic to alternative Swedish ports, they quickly became congested when they tried to handle the extra volume. As a result, many of the redirected container movements between Sweden and mainland Europe were made by truck.
5.2. Ship Arrivals
Official port throughput statistics do not provide sufficient details to explain how the decrease in volumes at the port of Gothenburg actually came about. Instead, through the analysis of AIS data, it is possible to calculate the number of container ships arriving at a port (see Figure 3) and, thereby, in combination with port statistics on throughput, the average amount carried by each ship can also be calculated.
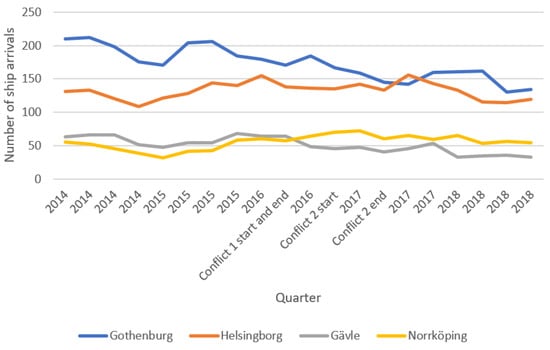
Figure 3.
Number of Ship Arrivals to Each Port.
As can be seen in Figure 3, there was a steady decline in ships arriving at the port of Gothenburg during the periods of intense port conflict. However, to some extent this also follows a general trend that can be observed from the starting year of the dataset in 2014. When analyzing this in more detail, however, by looking at the number of arriving ships within two-week intervals (see Figure 4) during the course of the port conflict, it is easier to observe the presence of some trends. For example, that at the beginning of the second period of intense conflict, the number of ships visiting the port of Gothenburg decreased from between 25–30 per two-week period to below 20 calls over the same period of time shortly after the conflict ended. Interestingly, the same plot of ship arrivals against the same two year period portrays a relatively stable picture for Helsingborg and Norrköping, but a fall in the number of ship arrivals for Gävle during the course of the second period of intense port conflict at the port of Gothenburg.
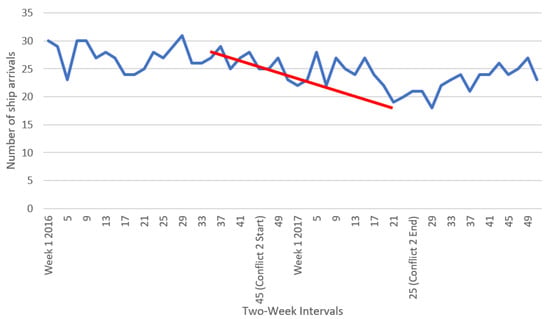
Figure 4.
Number of Ship Arrivals at the Port of Gothenburg in Two-Week Intervals (2016–2017).
5.3. Containers per Ship
The volume of containers handled in a port is also dependent upon the number of containers that are carried onboard the ships that call at the port. As can be observed in Figure 5, the average number of containers handled per ship in Gothenburg stayed roughly the same, except for in the last quarter of the port conflict. It is known that part of the action taken by APMT during the port conflict was to impose restrictions on container moves within the container terminal and this may explain why it was so stable, with every ship served having the same restrictions imposed. In the ports of Norrköping and Helsingborg, there was a small increase in the average number of containers per ship at the beginning of the conflict. Most interestingly, however, there has been a significant increase in Gävle that started around the beginning of the Gothenburg port conflict, when the port was receiving ship calls of around 400 containers per ship and which rose to around 800 containers per ship by the end of 2018. Thus, even though there were fewer ships arriving at the port of Gävle, the port has succeeded in increasing its container throughput overall because of more containers, on average, being handled on each ship that calls.
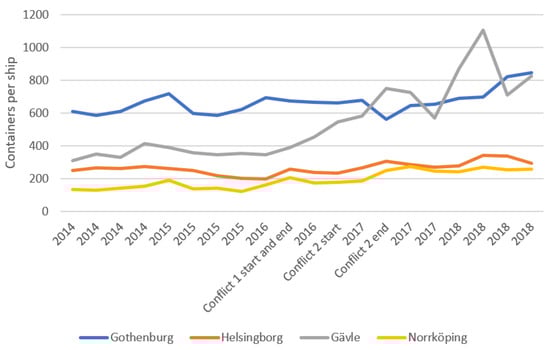
Figure 5.
Containers per ship.
5.4. Ship Size
For obvious reasons, the size of the ships arriving at a port is closely related to the number of containers handled per ship. The most obvious observable occurrence during the port conflict is that the number of very large containerships calling at the port of Gothenburg decreased significantly during Q2 2017, from around 25 to around 12 (see Table 4). To a large extent, this can be explained by the fact that, as a result of the port conflict and the lower productivity and uncertainty it brought about, a few of the major shipping lines altered their mainline routings and cancelled their calls into Gothenburg [].
Table 4.
Number of ships arriving at the port of Gothenburg by size.
Other trends in the size of ships calling at the ports under study can also be observed. For example, as shown in Figure 6, small ships with LOA of less than 150 m have almost completely stopped calling at the port of Gävle. This is a trend that has been evident since around the start of the conflict at the port of Gothenburg. In comparison, the number of small ships has remained very much the same in Norrköping, but the number of large ships has increased steadily (see Figure 7). The trend in Helsingborg falls somewhere between these two (see Figure 8), with both an increasing number of larger ships and a decreasing number of smaller ships. Thereby, all three ports have gone through similar trends in increased volumes, but this has been achieved through different developments in vessel traffic patterns.
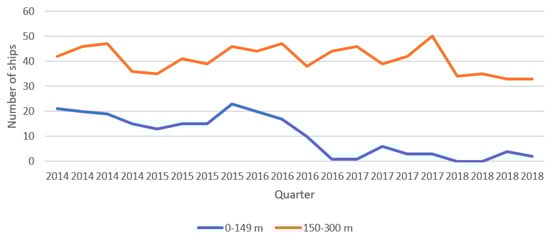
Figure 6.
The sizes of ships arriving at the port of Gävle.
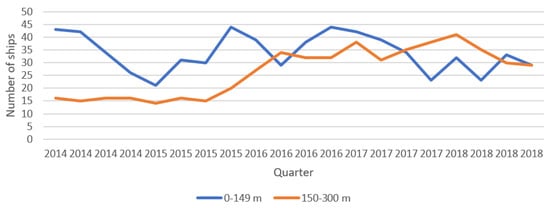
Figure 7.
The sizes of ships arriving at the port of Norrköping.
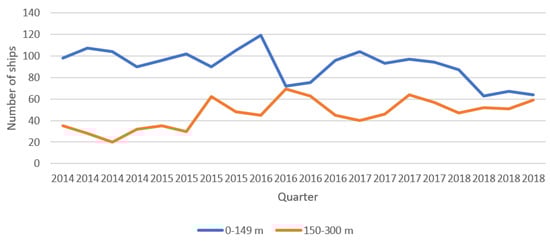
Figure 8.
The sizes of ships arriving at the port of Helsingborg.
5.5. Port Productivity—Time at Berth
From the perspectives of both container shipping companies and the container terminals in the four ports under study, it is interesting to understand how the average time at berth for ships has changed. As shown in Figure 9, one particularly noticeable aspect is that all the ports saw a major increase in time at berth in Q1 (2017), but within a context where the volumes increased in each of the three smaller ports (in the order of between 8% and 22%). Of course, there are other things that cannot be definitely explained, but which can be observed; for example, the large increase in average time at berth of ships calling at Norrköping during 2015 and the definite decrease in average time at berth for ships calling at both Gävle and Norrköping during Q4 2017. Even though it cannot be known with absolutely certainty, perhaps the latter can be attributed to the greater economies of scale achieved at berth because there were generally fewer, but larger, vessels calling at these ports during this period of time. Of course, the general pattern of seasonality in the demand for port services may also be exerting an influence at the same time as the port of Gothenburg reacclimatizes to the ending of the port conflict and the consequent knock-on effect this has on the other three ports under study.
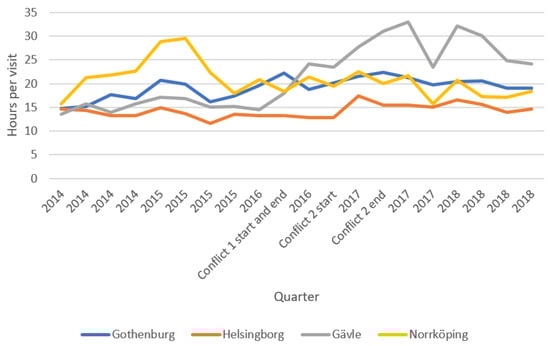
Figure 9.
Average hours per visit of ships calling at the four ports.
5.6. Port Productivity—Container Lifts per Hour
It is also of interest to investigate port productivity in terms of the average number of container lifts per hour at berth, as shown in Figure 10. Two aspects can be observed. First of all, Gothenburg has seen a decrease in productivity since 2014 (when productivity stood at 40 containers per hour), with the lowest amount of containers being handled in the last quarter of the conflict (when it had fallen to just 25 containers per hour). Since then, container lifts per hour has increased quite dramatically at Gothenburg, probably accounted for by new measures using lean systems to reduce waiting times []. This is despite the inevitable fact that Gothenburg’s recovery would have been hampered and elongated by the understandable fear of further disruptions amongst its potential customer base and, ergo, by the time and effort it takes to win back lost customers that had become accustomed to working with other competitor ports.
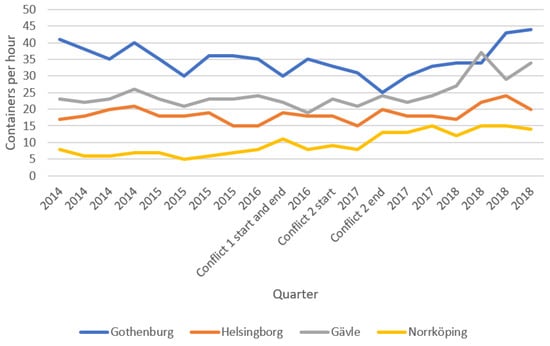
Figure 10.
Containers lifts per hour at the four ports.
Another interesting aspect is that it seems that the three smaller ports had problems with decreasing productivity in their ports in Q1 (2017), but that all increased their productivity in Q2 (2017). This was probably a consequence of the port conflict at Gothenburg whereby the smaller ports became congested, leading to inefficient handling. This may explain the decline and then the increase once they learnt to cope better with these congestion problems. Finally, it can also be observed that all ports have actually increased their productivity over the period from 2014 to 2018.
6. Discussion and Conclusions
This study has explored how the vessel and container traffic to and from the port of Gothenburg, as well as three other major container ports in Sweden, has changed during the period 2014 to 2018. During this period of time, there was a disruptive event in the form of industrial action at the container terminal of the port of Gothenburg. The main disruptive action occurred during Q2 (2016) and in the period Q4 (2016)–Q2 (2017). This study has combined the use of official port statistics and detailed AIS data to show that the decline in container volumes in Gothenburg is mainly due to fewer ships calling at the port of Gothenburg, with the arriving ships maintaining about the same volume of containers per ship. The study has also shown that the port of Gothenburg has had problems with productivity since 2014, and that its lowest level of container handling productivity occurred towards the end of the period of intense conflict.
The study has also shown that the three other major container ports in Sweden have increased throughput in container traffic, which is mainly explained by a large increase in the average volume handled by each ship. As exemplified primarily by Gävle, there are fewer small containerships arriving at these ports and, possibly either as a consequence or a cause of this, all three of the smaller container ports have been able to increase their productivity levels, as evidenced by an increasing number of containers handled per hour.
As with any study of this type, there are a number of limitations which need to be recognized. Firstly, port cargo statistics are available solely on a quarterly basis in Sweden. This constitutes a form of smoothing which makes it quite difficult to directly observe any trends that might manifest themselves in the data or, indeed to account for any sort of seasonality which might be present in the data. For example, the first instance of intense conflict took place only during mid-Q2 (2016) and the second instance of intense conflict started in November of 2016 (in the middle of Q4). It would have been interesting to have had access to monthly statistics to be able to observe the evolution of changes in more detail.
A further limitation of the work arises in relation to determining the time in port of vessels. For the purposes of enhancing the analytical tractability of the work, it has been assumed that all the calculated time that a vessel spends in port is spent at berth and, by implication, therefore, engaged in the handling of containers. This assumption has underpinned the productivity calculations implemented within the work. Clearly, no allowance has been made for any sort of manoeuvring, setting up or waiting within the predefined port limits. Although the level of refinement of AIS data means that it may be used to try and gain some insights into decomposing the total time in port into its constituent parts, the amount of additional work involved is disproportionate to the benefits to be derived. In some cases, the issue of failing to separate out waiting time may be somewhat problematic. However, within the context of the Scandinavian port system, the incidence of vessels having to wait for berths is extremely low. Thus, the approach adopted within this work can be ultimately justified on the basis that the time in port of a vessel will be very closely correlated to the time spent at berth engaged in the container handling process. In further counterbalancing this potential limitation, it is important to recognize that from the perspective of the ship, it is in any case the total time spent in port that is important, rather than the time spent engaged in individual activities within the port limits.
Further challenges arise with respect to analyzing the impacts of specific disruptive events. In particular, there are certain characteristics or trends that emerge irrespective of the potential impact of a specific disruptive event. For example, problems with productivity at the port of Gothenburg had emerged even before the conflict (as early as 2014), even though the largest decrease in productivity occurred during instances of intense port conflict. In theory, this could actually also be explained by factors other than the disruptive event of the port conflict itself. In other words, the analysis of the available data can only show certain trends which occurred during the conflict: it does not establish the presence of a causal relationship per se, nor does it explain why there may be relations between the event and the identified ‘impact’. For example, although it was observed from the data analysis that there were fewer large ships calling at the port of Gothenburg during the last part of the conflict, ancillary sources of information were required in order to (potentially) attribute this to the fact that ACL had cancelled their mainline direct calls at the port, claiming that it was “partly due to the conflict”.
Irrespective of its limitations, this work does make a number of noteworthy contributions to the analysis of supply chain disruptions, particularly with respect to labour disputes in ports. Most critically, this work has expounded a novel method of analysis which jointly utilizes the complementarity of AIS data and official port statistics. This yields several benefits in terms of the mutual validation of the data and facilitates the calculation of time in port for individual ships and the aggregation of this as ‘port efficiency’. With respect to port disputes specifically, the outcomes of the analysis reveal the impact on both container volumes, the nature of ship calls and port efficiency levels, not only at the port where the dispute is taking place, but also at other competitor ports within the region. It also illustrates the time periods involved in terms of market reaction to both the dispute itself and its resolution.
There are a number of different avenues for future research in this arena. For example, the approach adopted in this study could be used to assess productivity in different geographical regions, particularly where port competition may be rife and the waiting times of ships more relevant. For example, in assessing the level of productivity and competitiveness of the major ports in Europe, a more disaggregated decomposition of a ship’s time spent in port may be justified. In addition, this study has not taken into consideration how many cranes are available at a specific quay, nor their technical specifications in terms of speed, capacity, reach etc. If could be of interest to make such comparisons, though there may be a number of challenges to face in identifying how the number of cranes and their specifications have changed over the course of time. Finally, AIS data can be used to assess temporal trends in the sizes of containerships calling at different ports and, as a consequence of this, to gain an insight into the strategic deployment of vessels on liner shipping services. Clearly, all of this information is of value to competitors and other commercial interests, but could also provide input to national or regional policies related to ensuring or enhancing maritime connectivity.
Author Contributions
Conceptualization, M.S., H.H., & K.C.; methodology, M.S., H.H., & K.C.; software, M.S. & H.H.; validation, M.S. & H.H.; formal analysis, M.S., H.H., & K.C.; investigation, M.S., H.H., & K.C.; resources, M.S., H.H., & K.C.; data curation, M.S. & H.H.; writing—original draft preparation, M.S. & K.C.; writing—review and editing, M.S., H.H., & K.C.; visualization, M.S., H.H., & K.C.; supervision, M.S.; project administration, M.S.; funding acquisition, M.S. All authors have read and agreed to the published version of the manuscript.
Funding
This research was funded by combined funding from the Swedish Transport Administration, the Swedish Maritime Administration, Lighthouse, the SFO Transport, the Interreg Öresund-Kattegat-Skagerrak and the European Regional Development Fund.
Institutional Review Board Statement
Not Applicable.
Informed Consent Statement
Not Applicable.
Acknowledgments
The authors are grateful to two anonymous referees for providing valuable feedback on an earlier draft of the paper.
Conflicts of Interest
The authors declare no conflict of interest.
References
- Hohenstein, N.O.; Feisel, E.; Hartmann, E.; Giunipero, L. Research on the phenomenon of supply chain resilience: A systematic review and paths for further investigation. Int. J. Phys. Distrib. Logist. Manag. 2015, 45, 90–117. [Google Scholar] [CrossRef]
- Tukamuhabwa, B.R.; Stevenson, M.; Busby, J.; Zorzini, M. Supply chain resilience: Definition, review and theoretical foundations for further study. Int. J. Prod. Res. 2015, 53, 5592–5623. [Google Scholar] [CrossRef]
- Kamalahmadi, M.; Parast, M.M. A review of the literature on the principles of enterprise and supply chain resilience: Major findings and directions for future research. Int. J. Prod. Econ. 2016, 171, 116–133. [Google Scholar] [CrossRef]
- Chang, W.; Ellinger, A.E.; Blackhurst, J. A contextual approach to supply chain risk mitigation. Int. J. Logist. Manag. 2015, 26, 642–656. [Google Scholar] [CrossRef]
- Lam, J.S.L.; Su, S. Disruption risks and mitigation strategies: An analysis of Asian ports. Marit. Policy Manag. 2015, 42, 415–435. [Google Scholar] [CrossRef]
- Loh, H.S.; Zhou, Q.; Thai, V.V.; Wong, Y.D.; Yuen, K.F. Fuzzy comprehensive evaluation of port-centric supply chain disruption threats. Ocean Coast. Manag. 2017, 148, 53–62. [Google Scholar] [CrossRef]
- Galvao, C.B.; Wang, G.W.; Mileski, J. Public-private interests and conflicts in ports: A content analysis approach. Asian J. Shipp. Logist. 2016, 32, 13–22. [Google Scholar] [CrossRef]
- Porterfield, T.E.; Macdonald, J.R.; Griffis, S.E. An exploration of the relational effects of supply chain disruptions. Transp. J. 2012, 51, 399–427. [Google Scholar] [CrossRef]
- Hall, P.V. “We’d have to sink the ships”: Impact studies and the 2002 west coast port lockout. Econ. Dev. Q. 2004, 18, 354–367. [Google Scholar] [CrossRef]
- Notteboom, T. Concentration and the formation of multi-port Gateway regions in the European container port system: An update. J. Transp. Geogr. 2010, 18, 567–583. [Google Scholar] [CrossRef]
- Lee, C.Y.; Song, D.P. Ocean container transport in global supply chains: Overview and research opportunities. Transp. Res. Part B Methodol. 2017, 95, 442–474. [Google Scholar] [CrossRef]
- Craighead, C.W.; Blackhurst, J.; Rungtusanatham, M.J.; Handfield, R.B. The severity of supply chain disruptions: Design characteristics and mitigation capabilities. Decis. Sci. 2007, 38, 131–156. [Google Scholar] [CrossRef]
- Blackhurst, J.; Craighead, C.W.; Elkins, D.; Handfield, R.B. An empirically derived agenda of critical research issues for managing supply-chain disruptions. Int. J. Prod. Res. 2005, 43, 4067–4081. [Google Scholar] [CrossRef]
- Bode, C.; Macdonald, J.R. Stages of supply chain disruption response: Direct, constraining, and mediating factors for impact mitigation. Decis. Sci. 2017, 48, 836–874. [Google Scholar] [CrossRef]
- Macdonald, J.R.; Corsi, T.M. Supply chain disruption management: Severe events, recovery, and performance. J. Bus. Logist. 2013, 34, 270–288. [Google Scholar] [CrossRef]
- Berle, Ø.; Asbjørnslett, B.E.; Rice, J.B. Formal vulnerability assessment of a maritime transportation system. Reliab. Eng. Syst. Saf. 2011, 96, 696–705. [Google Scholar] [CrossRef]
- Vonck, I.; Notteboom, T. Panarchy within a port setting. J. Transp. Geogr. 2016, 51, 308–315. [Google Scholar] [CrossRef]
- Vonck, I.; Notteboom, T. Quantifying resilience in seaports: An application to ports in the Hamburg-Le Havre range. In Port Management: Cases in Port Geography, Operations and Policy; Pettitt, S., Beresford, A., Eds.; Kogan Page: London, UK, 2017; pp. 139–175. [Google Scholar]
- Chen, H.; Cullinane, K.P.B.; Liu, N. Developing a Model for Measuring the Resilience of a Port-Hinterland Container Transportation Network. Transp. Res. E Logist. Transp. Rev. 2017, 97, 282–301. [Google Scholar] [CrossRef]
- Zhang, Y.; Lam, J.S.L. Estimating the economic losses of port disruption due to extreme wind events. Ocean Coast. Manag. 2015, 116, 300–310. [Google Scholar] [CrossRef]
- Zhang, Y.; Lam, J.S.L. Estimating economic losses of industry clusters due to port disruptions. Transp. Res. Part A Policy Pract. 2016, 91, 17–33. [Google Scholar] [CrossRef]
- Hudson, R. The effects of dock strikes on UK international trade. Appl. Econ. 1981, 13, 67–77. [Google Scholar] [CrossRef]
- Smith, C. Internationalising industrial disputes: The case of the Maritime Union of Australia. Empl. Relat. 2010, 32, 557–573. [Google Scholar] [CrossRef]
- Svanberg, M.; Santén, V.; Hörteborn, A.; Holm, H.; Finnsgård, C. AIS in maritime research. Mar. Policy 2019, 106, 103520. [Google Scholar] [CrossRef]
- Wu, L.; Xu, Y.; Wang, Q.; Wang, F.; Xu, Z. Mapping Global Shipping Density from AIS Data. J. Navig. 2017, 1–15. [Google Scholar] [CrossRef]
- Shelmerdine, R.L. Teasing out the detail: How our understanding of marine AIS data can better inform industries, developments, and planning. Mar. Policy 2015, 54, 17–25. [Google Scholar] [CrossRef]
- Jensen, C.M.; Hines, E.; Holzman, B.A.; Moore, T.J.; Jahncke, J.; Redfern, J.V. Spatial and Temporal Variability in Shipping Traffic Off San Francisco, California. Coast. Manag. 2015, 43, 575–588. [Google Scholar] [CrossRef]
- Coomber, F.G.; D’incà, M.; Rosso, M.; Tepsich, P.; Notarbartolo Di Sciara, G.; Moulins, A. Description of the vessel traffic within the north Pelagos Sanctuary: Inputs for Marine Spatial Planning and management implications within an existing international Marine Protected Area. Mar. Policy 2016, 69, 102–113. [Google Scholar] [CrossRef]
- Meng, Q.; Weng, J.; Li, S. Analysis with automatic identification system data of vessel traffic characteristics in the Singapore strait. Transp. Res. Rec. 2014, 2426, 33–43. [Google Scholar] [CrossRef]
- Xiao, F.; Ligteringen, H.; Van Gulijk, C.; Ale, B. Comparison study on AIS data of ship traffic behavior. Ocean Eng. 2015, 95, 84–93. [Google Scholar] [CrossRef]
- Altan, Y.C.; Otay, E.N. Maritime Traffic Analysis of the Strait of Istanbul based on AIS data. J. Navig. 2017, 70, 1367–1382. [Google Scholar] [CrossRef]
- Zhang, L.; Meng, Q.; Fwa, T.F. Big AIS data based spatial-temporal analyses of ship traffic in Singapore port waters. Transp. Res. Part E Logist. Transp. Rev. 2017, 129, 287–304. [Google Scholar] [CrossRef]
- Yang, D.; Wu, L.; Wang, S.; Jia, H.; Li, K.X. How big data enriches maritime research–a critical review of Automatic Identification System (AIS) data applications. Transp. Rev. 2019, 39, 755–773. [Google Scholar] [CrossRef]
- Adland, R.; Jia, H.; Strandenes, S.P. The determinants of vessel capacity utilization: The case of Brazilian iron ore exports. Transp. Res. Part A Policy Pract. 2018, 110, 191–201. [Google Scholar] [CrossRef]
- Jia, H.; Prakash, V.; Smith, T. Estimating vessel payloads in bulk shipping using AIS data. Int. J. Shipp. Transp. Logist. 2019, 11, 25–40. [Google Scholar] [CrossRef]
- Adland, R.; Jia, H.; Strandenes, S.P. Are AIS-based trade volume estimates reliable? The case of crude oil exports. Marit. Policy Manag. 2017, 44, 657–665. [Google Scholar] [CrossRef]
- Adland, R.; Fonnes, G.; Jia, H.; Lampe, O.D.; Strandenes, S.P. The impact of regional environmental regulations on empirical vessel speeds. Transp. Res. Part D Transp. Environ. 2017, 53, 37–49. [Google Scholar] [CrossRef]
- Andersson, P.; Ivehammar, P. Dynamic route planning in the Baltic Sea Region–A cost-benefit analysis based on AIS data. Marit. Econ. Logist. 2017, 19, 631–649. [Google Scholar] [CrossRef]
- Adland, R.; Jia, H. Dynamic speed choice in bulk shipping. Marit. Econ. Logist. 2018, 20, 253–266. [Google Scholar] [CrossRef]
- Seoane, M.J.F.; Laxe, F.G.; Montes, C.P. Foreland determination for containership and general cargo ports in Europe (2007–2011). J. Transp. Geogr. 2013, 30, 56–67. [Google Scholar] [CrossRef]
- Jia, H.; Lampe, O.; Solteszova, V.; Strandenes, S.P. Norwegian port connectivity and its policy implications. Marit. Policy Manag. 2017, 1–11. [Google Scholar] [CrossRef]
- Yu, H.; Fang, Z.; Peng, G.; Feng, M. Revealing the Linkage Network Dynamic Structures of Chinese Maritime Ports through Automatic Information System Data. Sustainability 2017, 9, 1913. [Google Scholar] [CrossRef]
- Jia, H.; Lampe, O.D.; Solteszova, V.; Strandenes, S.P. An automatic algorithm for generating seaborne transport pattern maps based on AIS. Marit. Econ. Logist. 2017, 19, 619–630. [Google Scholar] [CrossRef]
- Chen, L.; Zhang, D.; Ma, X.; Wang, L.; Li, S.; Wu, Z.; Pan, G. Container port performance measurement and comparison leveraging ship GPS traces and maritime open data. IEEE Trans. Intell. Transp. Syst. 2015, 17, 1227–1242. [Google Scholar] [CrossRef]
- US Bureau of Transportation Statistics. Port Performance Freight Statistics Annual Report to Congress 2018; US Department of Transportation: Washington, DC, USA, 2018. [CrossRef]
- Farhadi, N.; Parr, S.A.; Mitchell, K.N.; Wolshon, B. Use of nationwide automatic identification system data to quantify resiliency of marine transportation systems. Transp. Res. Rec. 2016, 2549, 9–18. [Google Scholar] [CrossRef]
- Gonzalez-Aregall, M. Description of the Gothenburg Container Port Conflict and Its Logistics Consequences; Working Paper No. 2018:1; University of Gothenburg: Gothenburg, Sweden, 2018; Available online: https://gup.ub.gu.se/v1/asset_data/207467 (accessed on 4 June 2020).
- OECD. The Impact of Mega-Ships, The Case of Gothenburg; International Transport Forum: Geneva, Sweden, 2016. [Google Scholar]
- Lloyd’s List. Swedish Authorities to Investigate Port Labour Laws. 24 May 2017. Available online: https://lloydslist.maritimeintelligence.informa.com/LL108387/Swedish-authorities-to-investigate-port-labour-laws (accessed on 4 June 2020).
- Damvad Analytics. Hamnkonflikten i Göteborg—Vilka Kostnader Har Konflikten Gett Upphov Till? Damvad Analytics: Stockholm, Sweden, 2018. [Google Scholar]
- Adamopoulos, A. Lloyd’s List. The Battle for Scandinavia’s Biggest Port. 21 June 2017. Available online: https://lloydslist.maritimeintelligence.informa.com/LL108728/The-battle-for-Scandinavias-biggest-port (accessed on 4 June 2020).
- Ports of Sweden. Statistics. 2019. Available online: https://www.transportforetagen.se/ForbundContainer/Svenska-hamnar/Branschfragor/Hamnstatistik/Hamnstatistik/ (accessed on 4 June 2020).
- Container Management. Quay Crane Waiting Times Down by 90% at APMT Gothenburg; Container Management: Morden, UK, 2019; Available online: https://container-mag.com/2019/07/08/quay-crane-waiting-times-90-apmt-gothenburg/ (accessed on 29 September 2019).
| 1 | The use of AIS data in this analysis revealed quite significant errors in the reporting of port statistics at the port of Gävle in quarter 2 of 2018. The relevant regulatory authorities publishing the statistics were notified. They investigated the statistics and concluded that there was indeed an error with the reporting during that period that had bypassed their in-built quality controls, coinciding with changes in their reporting procedure. Since they were not able to fully correct the statistics, in the paper the official and uncorrected statistics are still used, but we avoid drawing any conclusions from that period (Gävle, quarter 2, 2018). |
| 2 | TEUs (Twenty foot Equivalent Units). |
Publisher’s Note: MDPI stays neutral with regard to jurisdictional claims in published maps and institutional affiliations. |
© 2021 by the authors. Licensee MDPI, Basel, Switzerland. This article is an open access article distributed under the terms and conditions of the Creative Commons Attribution (CC BY) license (http://creativecommons.org/licenses/by/4.0/).