Abstract
The supply of freshwater has become a worldwide interest, due to serious water shortages in many countries. Due to rapid increases in the population, poor water management, and limitations of freshwater resources, Egypt is currently below the water scarcity limit. Since Egypt has approximately 3000 km of coastlines on both the Red Sea and the Mediterranean Sea, seawater desalination powered by marine renewable energy could be a sustainable alternative solution, especially for remote coastal cities which are located far from the national water grid. The objective of this research work is to evaluate the feasibility of a floating desalination plant (FDP) concept powered by marine renewable energy for Egypt. A novel design of the FDP concept is developed as an innovative solution to overcome the freshwater shortage of remote coastal cities in Egypt. A mobile floating platform supported by reverse osmosis (RO) membrane powered by marine renewable power technology is proposed. Based on the abundant solar irradiation and sufficient wind density, Ras Ghareb was selected to be the base site location for the proposed FDP concept. According to the collected data from the selected location, a hybrid solar–wind system was designed to power the FDP concept under a maximum power load condition. A numerical tool, the DNV-GL Sesam software package, was used for static stability, hydrodynamic performance, and dynamic response evaluation. Moreover, WAVE software was used to design and simulate the operation of the RO desalination system and calculate the power consumption for the proposed FDP concept. The results show that the proposed mobile FDP concept is highly suitable for being implemented in remote coastal areas in Egypt, without the need for infrastructure or connection to the national grid for both water and power.
1. Introduction
More than two-thirds of the earth’s surface is covered with water. According to the European Environmental Agency (EEA), approximately 97% of the water is saltwater in the form of oceans, seas, and bays. On the other hand, only 3% of the total of water is freshwater in the form of ice, groundwater, rivers, and lakes, which is not enough for the human demand [1]. Increases in populations and subsequent rises in demands for consumable water have been cited as the biggest problems that humanity will face in the future. The desalination of seawater is considered one of the promising alternatives which can solve the world’s freshwater shortage and help meet the global water demand [2]. These facts drove the global desalination market to accelerate at a rate of 9% from 2018 to 2022, with 74% of the growth coming from Europe, Middle East, and Africa (EMEA) region [3]. Egypt has mainly depended on the Nile River water for a long time, with a share of 55 billion cubic meters per year [4]. Currently, due to the rapid increase in population and poor water management, Egypt is under the water scarcity limit, which has urged the Egyptian Government to initiate programs for the desalination of water to overcome the lack of drinking water, especially in remote areas [5].
Generally, desalination processes can be divided into two main technology types: Thermal distillation and membrane processes. In recent years, membrane technology has taken over 73% of the global desalination installation capacity [6]. Many studies have shown that the renewable energy-powered RO desalination system is more reliable and sustainable than other energy sources, due to its low operation cost and environmental impacts. Omer and Moussa [7] discussed several factors which should be considered before selecting renewable energy, such as the feed and product water salinity, feed pressure, plant location, wind speed and solar radiation at the site, plant size, and cost of product water. These factors play a vital role in estimating the total power consumption. Recently, photovoltaics (PV) panels have been introduced in desalination systems, but they have low efficiency and need a large settlement area. Since Egypt has about 3000 km of shorelines on both the Red Sea and the Mediterranean Sea, desalination can be used as a sustainable water resource for domestic use in many coastal areas [8]. Atallah et al. [9] provided a comparison of a land-based conventional RO desalination plant and an unconventional one powered by a hybrid renewable energy system in Egypt.
Currently, the RO process is widely used to desalinate water in Egypt, especially for touristic coastal areas, since these remote areas are located far from national water and power grids. While RO requires a high amount of energy, energy is mostly generated using fossil fuels, which impacts the environment in this area [10]. Moreover, most of Egypt’s coastal areas have a shortage of land area and/or are expensive in terms of the construction of PV panel systems. For this reason, renewable energy-powered floating desalination plants are emerging as an efficient solution around coastal areas.
Many previous studies have dealt with the design of conventional land-based desalination plants, as well as their power supply and operating systems, whereas few studies have discussed the floating desalination plant (FDP) concept. Floating desalination plants are relatively young technology if compared with land-based desalination solutions, where a number of existing units driven by fossil fuel and nuclear power have been established and successfully tested in commercial projects in different countries. Chouski [11] proposed a floating desalination ship for the western Mediterranean Sea. The proposed plant is powered by liquefied natural gas (LNG) and provided with water storage tanks. Later, he also described the construction and operation of shipboard desalination plants in another study [12]. The same concept was investigated by Fadel et al. [13]. He discussed the concept of FDP and compared the application of such plants with conventional land-based installations. The study presented a fully seagoing desalination vessel called RUMAITH serviced in Abu Dhabi and the vessel carried two 1250 m3/day Multi-stage flash (MSF) distillers and was completed with a power generating plant and full marine and navigation facilities. The power needed for desalination process was generated by the main vessel engine and two diesel generators.
The FDP concept powered by a nuclear power source has been discussed in different research works. The design of two barges comprising two desalination plants was studied by Vasjukov et al. [14]. A nuclear steam supply system, steam turbine plant for the preparation of potable water, and auxiliary and ship support system were presented in his study. Another state-of-the-art of existing design and analytical procedures of floating nuclear plants has been presented by Babu and Reddy [15]. The study suggested that floating barge configurations are much better, due to technical and economic reasons. On the other hand, the FDP concept was offered as an alternative solution for conventional desalination systems in the Middle East and the Arab Gulf by Al-Othman [16]. He concluded that the floating concept offers several safety features, which makes this configuration more suitable and well-prepared for tsunamis and earthquakes. A high-capacity floating desalination island powered by multi renewable resources was proposed by Stuyfzand and KappelhoP [17]. His preliminary calculations indicated that the production costs for freshwater from seawater by desalination on huge floating islands through renewable multi-energy supply are low and close to prices when using fossil fuels, without environmental effects. In another unconventional concept of FDP, Davis developed a novel floating membraneless PV-electrode system for hydrogen and water production [18]. The system was carried on a platform which used sunlight to generate the solar fuel and produce electricity that was sent to durable membraneless electrolyzers that split water into oxygen and hydrogen. The Ydriada MUP platform located in Greece is the perfect prototype of a small unconventional concept of an offshore FPD unit driven by wind turbine-delivered desalination water to a grid via a pipe at a 70 m3/day maximum capacity [19]. The plant contains small vertical cylinder pontoons connected to each other, and the center pontoon supports small desalination unit and wind turbine with 35 kW.
The FDP concept generally consists of a marine floating platform, desalination plant, and power system. Lampe et al. [20] presented a desalination ship example in his study. His proposal concept used RO technology and was capable of storing freshwater in five tanks, each with a capacity of 18,000 m3. Johanson and Clelland [21] also proposed a single mobile floating desalination plant with a ship shape to serve islands and arid coastline communities. His proposed unit supports multistage flash distillation (MFD) for desalination and can have a production capacity of 909 m3/day. Desalination barges have operated since 2008 to meet the high seasonal demand for potable water along the Red Sea coast of Saudi Arabia. In 2010, the largest floating desalination plant in the world, with a production capacity of 25,000 m3/day (9 million m3/year), was launched on a barge in Yanbu [22]. The desalination plant and equipment required, such as pumps, the proportional feeding unit, pipes, chemical tanks, and control units, should be arranged below the main deck inside the hull of the vessel [23].
Based on our understanding of Egypt’s freshwater problem and previous literature, the objective of this research work is to evaluate the feasibility of a novel FDP concept powered by marine renewable energy as an effective solution to help Egypt overcome its water scarcity and develop remote coastal areas. A novel design of a floating RO desalination plant powered by a hybrid solar-offshore wind turbine system is shown in Figure 1. An FDP concept with a capacity of 10,000 m3/day freshwater is numerically designed based on environmental data collected for Ras Ghareb city. The proposed FDP concept has a mobility option in order to provide freshwater for different coastal cities in Egypt, depending on the freshwater demand.
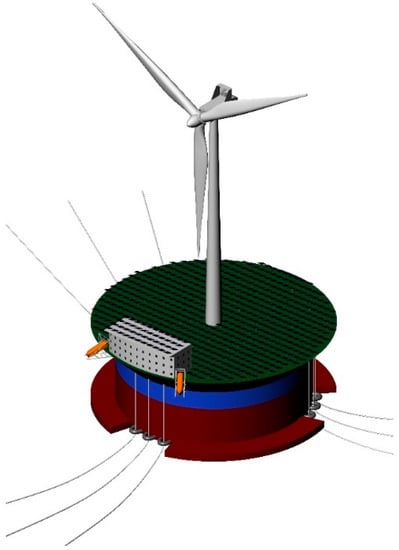
Figure 1.
Proposed floating desalination plant (FDP) concept.
2. Proposed Conceptual Design Procedure for FDP
Based on the literature review discussed in the previous section, a procedure was developed to design a novel FDP concept. The procedure begins with a gap analysis and site selection step in order to determine the most suitable location to locate the FDP concept. There are some factors and constraints that should be determined for the available sites. Each factor should be ranked, and the locations which do not meet the constraints should be extracted. The most important constraints are related to location restrictions, such as the draft or width, or other industrial activities. The next stage is to design the desalination system and its renewable energy-supported power system. Collection of all technical data of the whole system and location restrictions are available to analyse and select a suitable platform for hosting the systems. The following stage is to check the integrity of the whole system and its platform as one unit. Hydrodynamics and structural satisfaction are the first to be checked, followed by economic and environmental satisfaction. The proposed design procedure is shown in Figure 2.
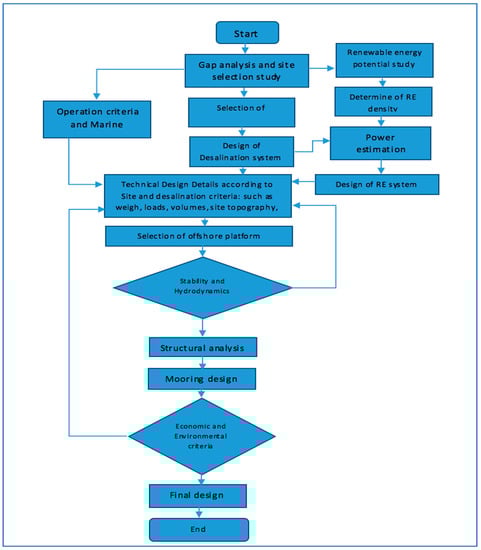
Figure 2.
Design procedure for the FDP concept powered by marine renewable energy.
3. Feasibility of FPD for Egypt
An FPD concept powered by a wind turbine is a rather new and unexplored concept for freshwater and energy production. Due to the unique mass population distribution and availability of marine renewable energy resources in Egypt, the FDP concept is proposed to overcome the freshwater shortage and support the development of remote coastal cities in Egypt. In this section, the conceptual design procedure which was presented in the previous section is applied for Egypt and a novel FPD concept is developed to serve Ras Ghareb city.
3.1. Site
Site selection: Egypt has approximately 3000 km of coastal zones situated on the Mediterranean Sea and the Red Sea. Approximately 1150 km of the coast is located on the Mediterranean Sea, while 1200 km is bordered by the Red Sea, with 650 km of coast located on the Gulf of Suez and Aqaba [24]. The Red Sea region has the best wind resources, with a mean power density at a 50 m height in the range of 300–900 W/m2 [24]. This fact means that wind power can be selected as the main power source for the FPD concept. The Red Sea coastline is considered remote from the Nile River supply, and the Egyptian government has paid attention to developing this area in its 2030 vision plan, due to its important touristic value [25]. In an unpublished study, a separate site selection study was performed. The results have shown that Ras Ghareb city has the highest rank for the FDP concept in Egypt. The city lies at a latitude of 28.33° N, longitude of 33° E, and altitude of 56 m. The height of the anemometer is 24.5 m above the ground [26].
Ras Ghareb is one of the biggest cities in the Gulf of Suez in the Red Sea. The total population of Ras Ghareb is about 60,000 people, according to the Red Sea Governor website. The city has three major characteristics: A high water demand for civil and industrial reasons, a medium shallow water depth, and a very high wind energy potential. The site location is shown in Figure 3. The FDP concept is suitable for operation in Ras Ghareb as a base point and transfer between the Gulf of Suez and Red Sea Zone to serve remote cities in this area, depending on their water demands. The location is an important factor when determining the environmental loads which the platform will face in the selected location.
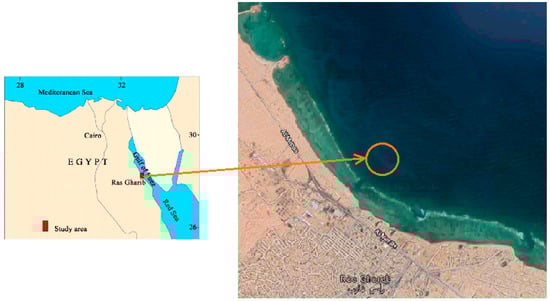
Figure 3.
Ras Ghareb city location
Water depth: The FDP plant will be located near to Ras Ghareb port terminal. The average draft is 50 m in the selected area [26]
Distance from the shore: Maintaining a buffer zone of a 2 km distance from the coastline has been considered far from any anchoring area or oil industry installation, and other activities.
Environmental loads: Based on the database and historical weather information, significant wave height and wave period were determined for a 1-year return period in this area, producing values of 2.15 m for the wave height and 5.08 s for the wave period [27]. Moreover, the maximum wave height and time period for one year are 5.18 m and 6.5 s and for a 100-year return period, are 7.92 m and 8 s, respectively. The tide height for a 1-year return period is 0.91 m and that for a 100-year return period is 1.52 m [28]. The max. current speed is 0.6 m/s, and most of the wind comes from north and northwest directions [29].
The wave spectrum is one of the most important parameters in the hydrodynamic analysis of floating offshore structures. One parameter spectrum was used to calculate Ras Ghareb’s wave spectrum, according to the DNV-GL rule [30], as shown in Equation (1). The results show that the wave spectrum band begins from 0.5 rad/s in this area, as can be seen in Figure 4. The proposed FDP concept should be out of the wave band range to avoid large dynamic responses [31].
where
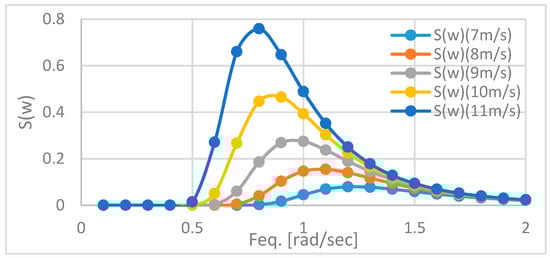
Figure 4.
Wave spectrum of the selected location based on the wind speed.
- ,
- ,
- , and
- is the wind speed in m/s.
Renewable energy density: The available offshore wind potential can be quantitatively expressed through the mean wind velocity 50 m above the mean water level for Egyptian coastal cities. Marine areas with a mean wind velocity smaller than 6 m/s are considered unsuitable for offshore floating wind turbines, according to several studies [32]. According to Egypt’s wind atlas, shown in Figure 5, the average wind speed over the year is 9.8 m/s at a 24.5 m height. The solar radiation atlas of Egypt, which is shown in Figure 6, shows that this area has an annual average direct solar radiation of 7.81–8.3 kWh/m2/day. In his study, Shimy [33] showed that Ras Ghareb city has an average sunshine duration of 12.125 hours and annual average air temperature of 20 °C. A comparative study has shown that Ras Gareb has a high potential for the use of wind turbines compared with other Egyptian cities [34]. The Red Sea region, in general, has the best wind resources in Egypt, with a mean power density at a 50 m height in the range of 300–900 W/m2. Ras Ghareb has the second-highest wind density after GabalElzeet, according to statistical studies [4], with a wind class of 7 and an average wind speed equal to 9.9 m/s [35].
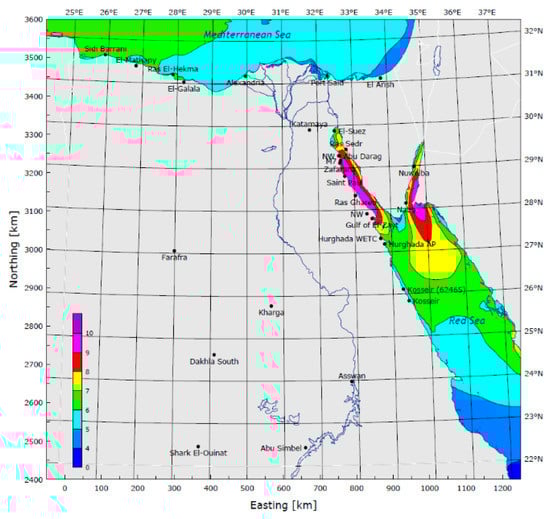
Figure 5.
Average wind speed in the Suez Gulf zone from Wind Atlas of Egypt.
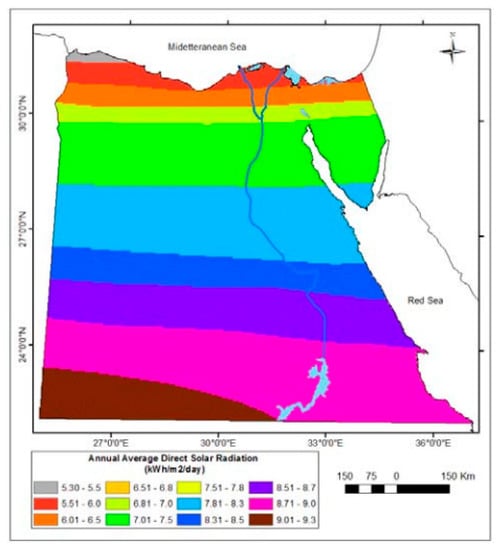
Figure 6.
The schematic of solar radiation from the Atlas of Egypt, 1991.
3.2. Desalination Criteria
Selection of desalination technology: Basically, a complete desalination process includes 3–4 steps: Feed pumping water from the sea; pre-treatment of pumped water (filtration and chemical addition); a desalination process; and finally, a post-treatment, if necessary [36]. There are different ways to produce freshwater with desalination technologies. More common technologies are reverse osmosis (RO), the multi-stage flash process (MFP), and multi-effect distillation (MED). In the FDP concept powered by diesel fuel, MFP is the most common. Many examples have been presented for ship-shaped desalination plants and barge plants in the Mideast area [11,12], and all of them used MFP. Many factors play a vital role in the selection of desalination technology, such as raw water properties, location, and type of power supplier.
Desalination systems employing RO are widely used in Egypt in different sectors. The rapid development in technology, especially in membrane manufacturing, has led to a marked decrease in cost and operating pressure, which has enabled RO to compete with other systems [37]. The Red Sea zone is considered as having high salinity seawater, with a value equal to TDS 45,000, which presents a higher limit for using RO technology.
Desalination system: The FDP concept contains six desalination modules. Each one has a capacity of 2000 cubic meters of desalinated water. Five units can meet the required desalination capacity of the plant (10,000 m3/day), while the sixth one is allocated as a backup unit. The system is designed to operate for 24 h.
The Water Application Value Engine (WAVE) software program, version 12.5, was used to design and model the RO desalination system in this study. The RO module is shown in Figure 7, and the design parameters for each unit of the RO module are given in Table 1.
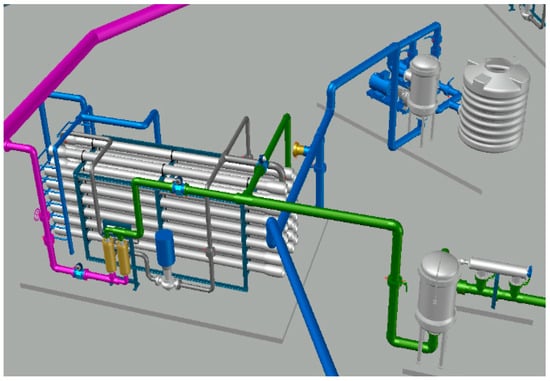
Figure 7.
The reverse osmosis (RO) module CAD design.

Table 1.
Design parameters for each unit of the RO module.
RO desalination technology was selected for the FDP concept, due to its lightweight equipment and its suitability for hybrid renewable energy. A complete desalination process can be summarized in four main steps:
- The first step is to take in seawater by a feed pump through sea-chests at the lower level of the platform and pass it through a specially designed metal screen with a size of 1 mm to store it in the raw water seawater tank. The proposed concept placed this tank at the center of the platform to eliminate pipeline losses and costs. The seawater supply pumps to elevate the pressure of the seawater sufficiently to pass it through the pre-treatment process. The suspended solids, which cause fouling of the RO membranes, are removed by inline coagulation and filtration. The intake inter tank is used as the seawater tank, and can store up to 6000 m3 of feed seawater. The inner sides of the tank should be coated with anti-corrosion paint to prevent corrosion of the surfaces that are in contact with seawater;
- The second step is the pre-treatment of seawater by pumped water using filtration and chemical doses. A coagulant is added to the acidified seawater, which is effectively mixed and then immediately passed through a dual-media filter to remove the microflocs which have formed. Polyelectrolytes can be used in addition to coagulants to support the formation of stable, filterable flocs. A disinfectant is injected into the seawater to prevent microbiological activities in the pipes and filters. Acid is required to prevent carbonate scaling on the RO membranes and is also added upstream of the dual-media filter. The dual-media filters have to be regularly backwashed with filtrate or brine and scour air from the bottom to the top. The rejected water is discharged into the sea. The power consumption of the filter feed pump and discharge pump were estimated to be 40 kWh and 226 m3/h at 5 bar, respectively. A self-cleaning filter, which is responsible for removing suspended particles with a size of more than 20 micron, is added to the system. A cartridge filter with a nominal 5 micron mesh size is also used in the ore-treatment process;
- The third step is the RO desalination process, including high-pressure pumps and a multistage centrifugal pump with a consumption power of 200 kWh and discharge of 86 m3/h at 65 bar. RO skids contain 26 vessels, with each having six membrane modules of the FILMTEC SW30HRLE-440 type. Desalted water is transferred to product water tanks. The plant contains a dosing system, including dosing pumps and chemical tanks for filter aid, antiscalant, post pH adjustment, and post disinfection. Cleaning and flushing systems are also included. Chemical cleaning of the RO membranes is performed regularly in order to re-establish the initial plant performance;
- The fourth step is to discharge the brine far from the plant. Discharge outfalls are located at the aft of the plant to dissipate high salinity rejected brine in the direction of a current stream to a distance 300 m from the plant into surface bodies of sea. Feed water intake is located at the lower point of the bottom of the plant to decrease the effect of discharged brine. FDP has the advantage of discharging brine far from the coastline, which helps to eliminate the environmental impact on marine life compared with the discharging process of land-based plants.
- The last step includes post-treatment and transfers to a shore facility. The filtrate is polished by means of fine filters for the final protection of the RO membranes from suspended particles. A dechlorination agent is injected into the feed water stream to eliminate the residual disinfectant. The feed water is pumped through the membranes with sufficient pressure. In total, 40% of the feed water is converted into permeate, and the concentrate is passed through an energy recovery turbine and then partially transferred to the backwash tank and mainly discharged overboard. By passing the concentrate through the energy recovery turbine, the consumption of electric energy is cut by 35%. The proposed desalination system is presented in Figure 8.
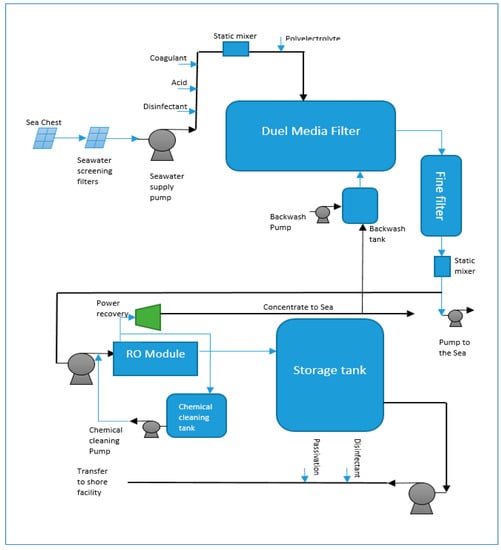 Figure 8. The proposed desalination system.
3.3. Power System
Many studies have shown that a renewable energy-powered RO desalination system is more reliable and sustainable than others, due to different factors, such as its low operation cost; low carbon dioxide emissions; clean energy system; and usage of natural resources, which are permanent [38]. However, many factors should be taken into consideration before choosing renewable energy, such as the feed and product water salinity, feed pressure, plant location, wind speed and solar radiance at the site, plant size, and cost of product water [39,40]. These factors play a vital role in determining the electrical energy required and the rate of proper sources.
The proposed FDP concept powered by a solar–wind integrated system is a stand-alone, mobile, and hybrid off-grid system. Therefore, it is a self-sustainable system. The system consists of two major components or subsystems: A solar-PV system and offshore wind turbine system. These components are integrated into, or interconnected with, the RO desalination system, as shown in Figure 9.
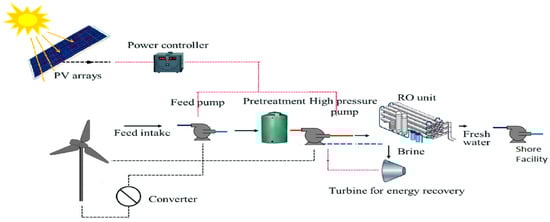
Figure 9.
Block diagram of the integrated solar–wind-driven desalination system used in the FDP.
Control and integration of the solar–wind system are performed by power inverters, and a controlling system governs the solar-PV and wind turbine systems. The hybrid system here is defined as an off-grid energy generation system in the form of electricity and freshwater. Both products are generated by harvesting renewable resources from the sun, wind, and sea. The management of pumping freshwater to a shore facility is accomplished by pressure pumps located at the top of each storage tank.
The total power consumption of each RO module was estimated using the WAVE simulation program. The total power for all RO modules was estimated to be 1591.2 kWh, as shown in Table 2. The peak power of each module without a power recovery system was estimated to be 483.9 kW. For marine operation and the accommodation of power loads, the maximum power consumption was estimated for other operating pumps, lighting, and control and outfitting devices to be 1660 kWh, as shown in Table 3.
Table 2.
Power consumption of each RO module per hour.
Table 3.
Power consumption of marine service units per hour.
The total maximum power load for the proposed FDP concept is 3.2512 MWh (78.029 MW/day). This power will be supplied by a V112-3MW turbine located at the center of the platform and PV panels will be distributed over the sundeck of the platform. The hybrid power system will cover the plant power consumption with a production of 79.2 MW/day.
3.3.1. Offshore Wind turbine
As mentioned earlier, the Ras Ghareb area in Egypt has a very high potential for using offshore wind turbines. The hourly wind speed for the selected site is the first data required for the design of a wind turbine. The data was collected from the Egyptian Metrological Authority of Ras- Ghareb [41]. Ras Ghareb has an average wind speed equal to 9.8 m/s at a 24.5 m height from the ground and 12.5 m/s at a 100 m height [41]. The average monthly wind speed is shown in Figure 10 for both heights of 24.5 and 100 m. The FDP concept should be adapted to the site that it is designed for. The three megawatt Vestas wind turbine was selected for the proposed FDP concept. The turbine rating speed is 12 m, and the height of the rotor center from the sea level is approximately 100 m from the sea level, which makes this turbine suitable for the average wind speed in the Ras Ghareb area. The turbine specifications are presented in Table 4. Equation (3) was used to estimate the maximum thrust force generated by the turbine in order to evaluate the static stability during turbine operation. The thrust force is a function of the wind speed, rotor swept area, air density, and turbine thrust coefficient [42]. The results are shown in Table 5 and Figure 11. The results reveal that the maximum thrust is 483.8 kN and occurs at a wind speed equal to 10 m/s.
where ρ is the air density (1.225 kg/m3), A is the turbine swept area, U is the wind velocity, and Ct is the thrust coefficient.
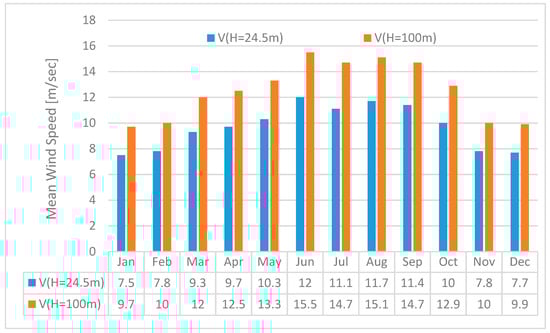
Figure 10.
Measured mean monthly wind speeds of Ras Ghareb station at 24.5 and 100 m.
Table 4.
V112-3MW turbine specification.
Table 5.
V112-3MW turbine thrust force and thrust coefficient calculation.
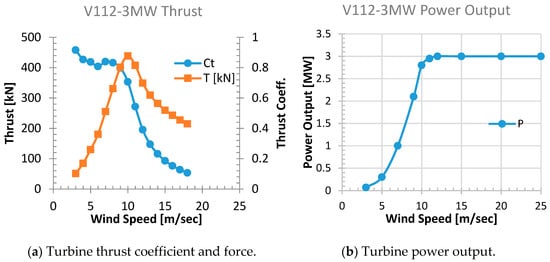
Figure 11.
V112-3MW turbine thrust force, thrust coefficient, and power output.
Based on the wind data and turbine performance curve, shown in Figure 12, the minimum annual average wind speed in Ras Ghareb is 9.8 m/s. The turbine can generate 2.7 MWh at this wind speed, whereas at the maximum annual average wind speed of 15.5 m/s, the turbine can generate its maximum power of 3 MWh. Most of the wind in Ras Ghareb comes from a northwest direction (77%), as shown in the wind rose diagram in Figure 12, and the maximum frequency of occurrence is from the North West sector (330°) [43].
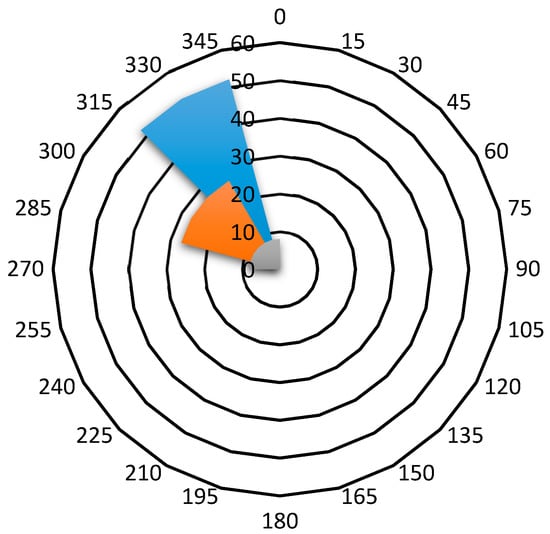
Figure 12.
Wind rose diagram for the Ras Ghareb zone at a 24.5 m height.
3.3.2. Photovoltaic Solar System
The components of any solar system consist of PV panels or collectors, a charger controller, batteries (if the energy needs to be stored), and an inverter to convert DC into AC. The PV output power is affected by many different factors, such as solar PV cell efficiency, solar radiation, ambient temperature, and wind speed [44]. Hofierka and Kuanuk [44] have suggested a formula for estimating the total annual electricity output for a system:
where is the annual electricity in kWh, Ae is the total surface area of solar cells in square meters, . is the annual mean power conversion efficiency coefficient for PV technology, and is the annual total global irradiation (kWh/m2). According to the Solar Atlas of Egypt, the average monthly mean solar energy for the PV system for the Ras Ghareb zone is recorded in Figure 13. The total global irradiation is 2327 kWh/m2 and the average monthly global irradiation over the year is 194 kWh/m2 (8.08 kWh/m2/day). The total area available on the sundeck is 6000 m2. The modern commercial solar cells typically have a 20% peak efficiency. Based on this data, the PV system can produce 2,792,400 kW/year (7650 kW/day). The average number of peak sunlight hours per day is assumed to be 6 hours. Then, the PV system supports the plant power system with 1.275 MW/h for 6 hours per day. According to Jacobson’s database [45], the PV optimal tilt angle for Egypt is 24 degrees. The margin factor (FM) of 20% is considered, due to array spacing, the temperature correction factor, the shadow effect, and the off-peak performance. According to Equation (5),
where the total PV power production is 6.12 MW/day.
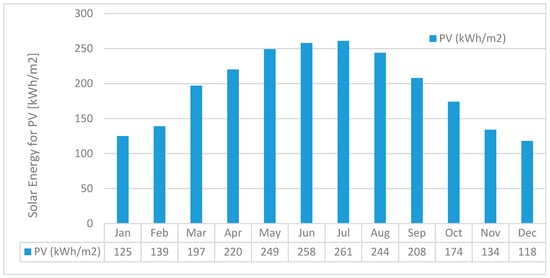
Figure 13.
Monthly mean solar energy for the PV system for the Ras Ghareb zone.
Mono-crystalline silicon PV solar panel modules are used in this study. The PV power rating is 200 W per meter square (20% efficiency), and the dimensions are a 1.64 m length, 0.992 m width, and 0.05 m height. Each PV module has a 19 kg weight and is expected to have a life span time between 20 to 25 years [46]. The panel area is 1.63 m2. The PV arrays are mounted on the sundeck of the platform. In Ras Ghareb, a 24° angle generally leads to an increase of 10% in the area, due to free-standing PV from shading [47]. The total number of PV panels is 3300 panels, and the layout of the PV array is shown in Figure 14, where L is the deck width of 87.5 m, W is the panel length of 1.64 m, d is the distance of the array equal to 1.8 m, β is the tilted angle of 24° [48], and Wcosβ equals 1.5 m.
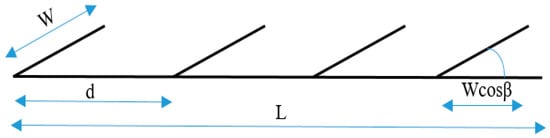
Figure 14.
PV tiled system layout option-based free-standing from shading concept.
3.3.3. Power Management Plan
The hybrid power system should have a power management plan. The system should include a charger controller or regulator to save the system from overcharging and regulate the power output alone to day hours. Moreover, the PV system also needs deep-cycle batteries to control PV usage during the day and night. The wind turbine can support the power system at an annual average minimum wind speed in Ras Ghareb with 64.8 MW/day, while the PV system can produce 7.65 MW/day. The minimum and maximum wind speed scenarios are shown in Figure 15. In the minimum wind speed scenario, the PV system has a share of 9% of the total power system product, while the wind turbine has a share of 91%. In the maximum wind speed scenario, the PV system has a share of 8% only, while the wind turbine has a share of 92% of total power production.
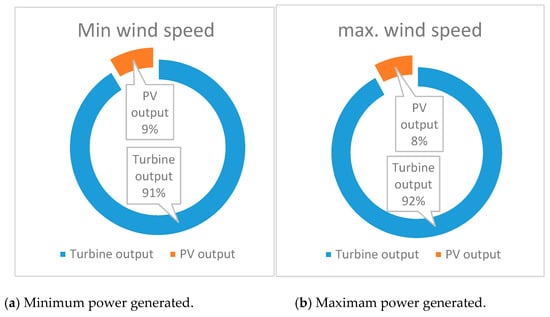
Figure 15.
Minimum and maximum power generated in a hybrid system.
3.4. Platform Criteria
FDP capacity: In the early design stage, it is important to estimate the overall system weight to select a suitable platform for carrying the system. The total desalination, hull steel, auxiliaries and outfitting equipment, storage, and power system weight was calculated to determine the overall platform size and volume. The total weight of the whole FDP concept was estimated to be 86,708 ton (approximately 84,593 m3 volume of displacement), as shown in Table 6.
Table 6.
Weight estimation for the whole system.
Hull Configuration and Dimensions: Based on the design criteria for a floating platform type and configuration, the cylindrical hull barge was selected to meet the Egyptian case condition. The cylindrical barge hull is better than the semisubmersible and spars for technical reasons. Firstly, the tension leg platform (TLP) and Spar configurations do not meet the mobility function for the unit, due to its mooring complexity and large draft, respectively [49,50,51,52]. Moreover, the semisubmersible is less favorable for Egyptian shipyards because of its complex structure [53,54]. In addition, the semisubmersible’s uncertainty in terms of the stability of the structure with a wind turbine in operation and during the towing process was considered a disadvantage [55]. The cylindrical barge has a smaller draught than the other concepts and is, therefore, more versatile in the sense that it can be deployed at a wider range of sites, even at sites with shallow water depth. Because of its shallow draught and stability in the free-floating condition with the turbine installed, this concept is expected to be well-suited for manufacturing at Egyptian shipyards, as well as allowing major repairs and maintenance to be performed off site [56]. Because of its simple mooring system, installation costs of the structure are expected to be small compared to those of other concepts.
To allow the structure to pass through restricted places on the way to the site locations and fit the size of production and lifting facilities, the shallow draft was selected to be a max. of 20 m in a full load condition (Suez Canal and most Egyptian large ports have a 24 m draft). This draft is suitable for most Suez Gulf coastline cities, including shallow areas. Based on the total displacement, maximum allowable draft, and cylindrical hull shape, the hull overall dimensions could be estimated, as shown in Table 7. The deck area is extended over the hull width in order to increase the area available for the PV array.
Table 7.
Main dimensions of the FDP concept.
This novel design is considered to be different in configuration and arrangement when compared with other conventional FDP concepts. The proposed plant is mobile, has a storage capacity, and is completely driven with zero emissions and an off-grid mode. The estimated area required for PV on the deck of a plant is approximately 6000 m2. The layout of the system can be seen in Figure 1.
Arrangement and Storage Tanks: The FPD concept can be considered an offshore marine unit based on its shape and configuration. The platform configuration was inspired by oil and gas industry platforms. The FDP platform can be moored near to the shoreline of any selected coastal city in Egypt. The concept has mobility capability and can be towed between two or more locations if needed. The FDP concept supports the usual desalination equipment, wind turbine, PV panels on the deck, and freshwater storage tanks. The sides of platforms are used as ballast tanks. The inner center tank is used as the seawater intake tank and pre-treatment tank that can store up to 6000 m3 feed water (Intake SWT). There are six freshwater tanks (FWT) inside the platform hull that can store up to 60,000 m3 of desalinated water and six ballast water tanks (BWT), as shown in Figure 16.
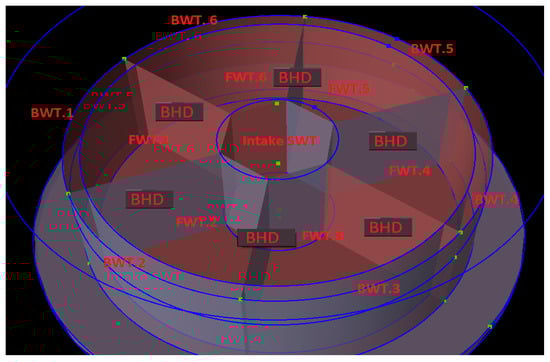
Figure 16.
Tank arrangement.
The plant has large-volume storage tanks for freshwater. This storage capacity can supply freshwater at the same amount for six days in the case of a cut-off of the energy supply from wind or solar resources, due to weather conditions or any other emergency. There are two options for supplying the shore with freshwater. If the plant is close enough to the shore to extend a floating marine hose, the produced water can continually be conveyed to the shore through the hose; otherwise, the water is desalinated before transferring it to shore, and water is stored inside the platform tanks and then conveyed through an aqua-tanker shuttle service. The proposed platform is designed to carry six 2000 m3/day RO desalination systems and is equipped, as shown in Figure 17.
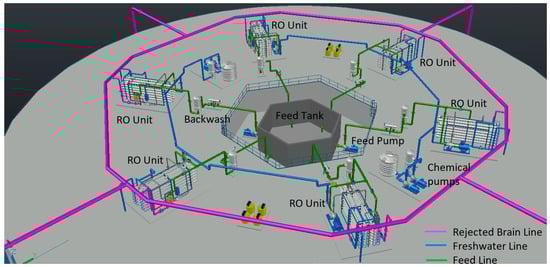
Figure 17.
Desalination system arrangement.
3.5. Stability Criteria
Natural Frequency: The natural periods of the FDP concept represent an important parameter that defines the dynamic behavior among waves. Around natural frequencies, the motion and load responses are augmented. Hence, the FDP concept should be designed to have natural frequencies outside of the wave spectrum band range. Natural frequency is a function of mass inertia, restoring the coefficient and added mass of the structure, as shown in Equation (6). Table 8 presents the natural periods and frequencies of the proposed FDP concept in heave, roll, and pitch modes. This natural period can be considered acceptable as they are outside of the wave spectrum (less than 0.5 rad/s), as is recommended by the Det Norske Veritas (DNV) standard for floating wind turbines DNV-OS-J103 (2013) [30].
where K is the stiffness (K = ρgA), M is the mass, and Madd is the added mass.
Table 8.
Natural periods and frequencies.
Dynamic stability
In this section, the wave-induced motions and internal responses of the FDP concept supported by the wind turbine are investigated. Wave-induced response amplitude operators (RAOs) of motion were calculated at the center of gravity (CoG) of the FDP concept. The presented results were obtained from frequency-domain simulations using DNV-GL Sesam software package, HydroD version 4.9-02. The motion response and hydrodynamic performance at six degrees of freedom were evaluated to ensure that the motion was restricted within the allowable limits for Egyptian environmental loading conditions, and the results are presented in Figure 18.
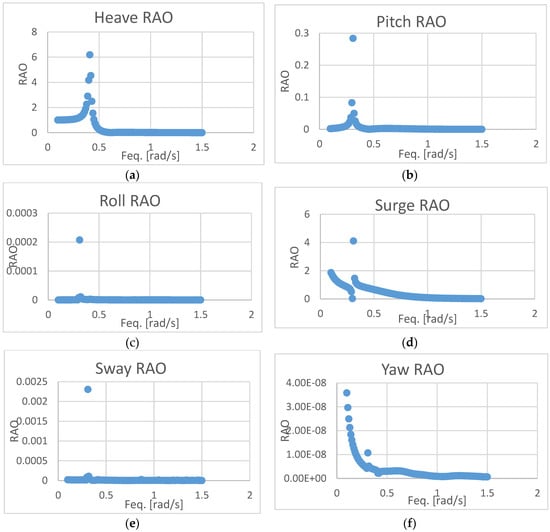
Figure 18.
The motion response at six degrees of freedom for the FDP concept. (a) Heave RAO; (b) Pitch RAO; (c) Roll RAO; (d) Surge RAO; (e) Sway RAO; (f) Yaw RAO.
The motion of the platform is an important concern because it is expected that the platform does not experience large amplitude of motion during operations. The RAOs are dependent on not only the wave frequency, but also the wave direction. In the present case, all wave directions are the same, due to the platform symmetry. Figure 18a–f presents the heave, pitch, roll, surge, sway, and yaw motions of RAOs, respectively. Figure 18a shows that the RAO peak of the heave motion occurs at 0.41 rad/s, verifying the value of the natural frequency of 0.41 rad/s given in Table 7. Figure 18b shows the pitch RAOs of the FDP concept, where the peak of the pitch motion occurs at 0.31 rad/s, verifying the natural pitch frequency in Table 7. All RAO peaks are out of the wave spectrum range of the Ras Ghareb area.
Static Stability
A stability study was performed using the DNV-GL Sesam software package, HydroD version 4.9-02. The maximum thrust force produced by the Vestas V-112 turbine at the rated speed was estimated as the static force acting on the top of the turbine tower. The maximum wind overturning moment was calculated by the product of the maximum thrust and the arm of the moment (from the center of the rotor to the CoG equivalent to 100 m). The total wind overturning moment was calculated as 43.88 MNm, and this value was used in the stability analyses. The maximum thrust load experienced by the V112-3MW turbine at the rated wind speed was equal to 438.8 kN. The heeling moment acting on the FDP concept was plotted with the righting moment arm (GZ), as shown in Figure 19.
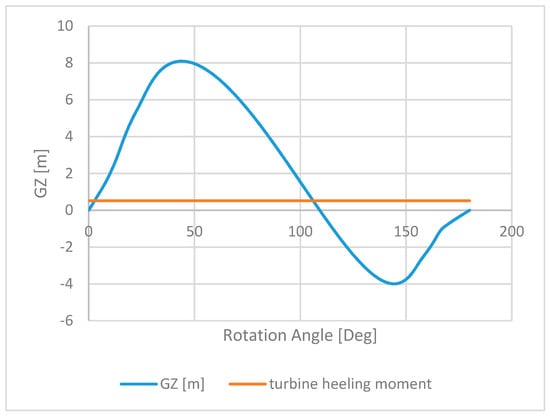
Figure 19.
Righting moment arm (GZ) curve for the FDP concept.
The HydroD software stability wizard was used to perform the stability analysis. The analysis was set up for a range of angles from 0 to 180°, assuming that the FDP was in an intact condition, and the maximum wind overturning moment was calculated to be 43.88 MNm. In stability calculations, the wind force was applied at zero degrees. These calculations were performed in HydroD by defining a wet surface and employing a fine mesh with a rectangular element size of 0.1 m. The interception angles between the righting and the wind overturning moment curves were around 3° for all directions, due to shape symmetry. The inclination during the operation was satisfied as it remained smaller than 6° with wind overturning moment.
Stability analyses fulfil the Offshore Standard DNV-OS-J103 (2013) for floating offshore structures, where the area of the righting moment curve is greater than the wind overturning moment curve by more than 130% for all wind directions. Another standard that is met is the stability curve, which is positive for the entire test angle range. The stability results show that the FDP concept supported by a wind turbine has acceptable restoring capacities against the wind load in all wind directions.
3.6. FDP Mobility Concept
The proposed FDP concept was designed to serve different coastal cities in Egypt. According to the power management plan, shown in Figure 15, wind power provides about 91% of the plant’s overall power consumption. Therefore, it is necessary to give priority to choosing a suitable location according to the wind potential in Egypt. Based on the Wind Atlas of Egypt, shown in Figure 5, the best cities which are suitable are located in the Gulf of Suez and Gulf of Aqba areas in Egypt. The average wind speed of between 8 and 12 m/s shows the high potential for the use of wind power sources in these areas. The mobility option of the platform will help Egypt to respond to variable water demands in these areas, without the need to build new land-based conventional desalination plants. FDP can be towed by towing tugs or lifted aboard a barge or ship lifter to transport it to its new location [56].
4. Conclusions
Water scarcity in Egypt is expected to increase, due to the rapidly increasing population and adverse agricultural policies. The desalination of seawater by renewable energy is an alternative solution for overcoming the freshwater shortage, particularly in remote coastal cities, in Egypt. Although Egypt has a high potential for marine renewable energy, this has not yet been explored. Therefore, the feasibility of the FDP concept powered by offshore renewable energy has been evaluated for Egypt as an innovative solution for coastal cities. A design procedure was developed for the FDP concept. A novel FDP concept powered by a hybrid solar–wind system was numerically evaluated using the DNV-GL Sesam software package for static and dynamic conditions, and the WAVE program was used for RO desalination system design and power consumption prediction. Since the system only utilizes offshore renewable solar and wind energies, Ras Ghareb city was selected for the FDP concept, due to its abundant high solar irradiation and high wind density. The results show that the proposed FDP concept is a feasible design that can meet stability criteria and perform efficiently in Egypt’s environmental conditions. Therefore, the proposed FDP concept can contribute to socio-economic aspects of Egypt and pave the way for developing remote areas. Due to its portability, the concept can also be deployed in different locations, depending on the water demand.
Author Contributions
Conceptualization, I.A., S.B., M.E.A.A., H.S., S.O., and E.O.; methodology, I.A., M.E.A.A., H.S., and E.O.; writing—original draft preparation, I.A.; writing—review and editing, I.A., E.O., M.E.A.A., and H.S.; visualization, I.A.; project administration, E.O. and M.E.A.A. All authors have read and agreed to the published version of the manuscript.
Funding
The authors acknowledge the British Council and Science and Technological Development Fund (STDF) for supporting the project NO. 30707 (Mobile Reverse Osmosis Floating Desalination Platform Powered by Hybrid Renewable Energy).
Acknowledgments
The authors acknowledge the University of Strathclyde’s Department of Naval Architecture, Ocean and Marine Engineering and Desert Research Centre, for the technical expertise and support provided during the period of research.
Conflicts of Interest
The authors declare no conflict of interest.
References
- European Environmental Agency (EEA). Water Is Life; Rosendahls Schultz Grafisk: Copenhagen, Denmark, 2018. [Google Scholar]
- WWAP. The United Nations World Water Development Report 2018: Nature-Based Solutions; UNESCO: Paris, France, 2018. [Google Scholar]
- Ahmed, F.; Hashaikeh, R.; Hilal, N. Solar powered desalination—Technology, energy and future outlook. Desalination 2019, 453, 54–76. [Google Scholar] [CrossRef]
- El-Sadek, A. Water desalination: An imperative measure for water security in Egypt. Desalination 2010, 250, 876–884. [Google Scholar] [CrossRef]
- Damkjaer, S.; Taylor, R. The measurement of water scarcity: Defining a meaningful indicator. Ambio March 2017, 46, 513–531. [Google Scholar] [CrossRef] [PubMed]
- Khana, M.; Rehmanb, S.; Al-Sulaiman, F. A hybrid renewable energy system as a potential energy source for water desalination using reverse osmosis: A review. Renew. Sustain. Energy Rev. 2018, 97, 456–477. [Google Scholar] [CrossRef]
- Omer, M.; Moussa, A. Water management in Egypt for facing the future challenges. J. Adv. Res. 2016, 7, 403–412. [Google Scholar] [CrossRef]
- Renewable Energy Desalination. MENA Development Report, An Emerging Solution to Close the Water Gap in the Middle East and North Africa; The World Bank: Washington, DC, USA, 2010; ISBN 978-0-8213-8838-9. [Google Scholar]
- Atallah, M.; Farahat, M.; Lotfy, M.; Senjyu, T. Operation of conventional and unconventional energy sources to drive a reverse osmosis desalination plant in Sinai Peninsula, Egypt. Renew. Energy 2020, 145, 141–152. [Google Scholar] [CrossRef]
- Hafez, A.; El-Manharawyb, S. Economics of seawater RO desalination in the Red Sea region, Egypt. Part 1. A case study. Desalination 2002, 153, 335–347. [Google Scholar] [CrossRef]
- Chouski, B. AquaTDPB3DP plants and systems: Floating modular dismountable desalination equipment. Desalin. J. 2002, 153, 349–354. [Google Scholar]
- Chouski, B. AquaTDP/S3DP plants and systems. Floating ship-borne modular dismountable seawater desalination plant. Desalination 2004, 165, 369–375. [Google Scholar]
- Fadel, M.; Wangnick, K.; Wada, N. Floating Desalination Plants an Engineering, Operating and Economic Appraisal. Desalin. J. 1983, 45, 49–63. [Google Scholar] [CrossRef]
- Vasjukov, V.; Klyikov, D.; Podbereznyi, V.; Shipilov, V. Floating nuclear desalination plant AFWS-40. Desalination 1992, 89, 21–32. [Google Scholar] [CrossRef]
- Babu, P.T.; Reddy, D.V. Existing Methodologies in the Design and Analysis of Offshore Floating Nuclear Power Plant. Nucl. Eng. Des. 1978, 48, 167–205. [Google Scholar] [CrossRef][Green Version]
- Al-Othmana, A.; Darwishb, N.; Qasima, M.; Tawalbehc, M.; Darwisha, N.; Hilald, N. Nuclear desalination: A state-of-the-art review. Desalination 2019, 457, 39–61. [Google Scholar] [CrossRef]
- Stuyfzand, P.; KappelhoP, J. Floating, high-capacity desalting islands on renewable multi-energy supply. Desalination 2005, 77, 259–266. [Google Scholar] [CrossRef]
- Davis, J.; Qi, J.; Fan, X.; Bui, J.; Esposito, D. Floating membraneless PV-electrolyzer based on buoyancy-driven product separation. Int. J. Hydrogen Energy 2018, 43, 1224–1238. [Google Scholar] [CrossRef]
- Daltona, G.; Bardóczb, T.; Blanchc, M.; Campbelld, D.; Johnsone, K.; Lawrenceb, G.; Lilasf, T.; Friis-Madseng, K.; Neumannh, F.; Nikitasf, N.; et al. Feasibility of investment in Blue Growth multiple-use of space and multi-use platform projects; results of a novel assessment approach and case studies. Renew. Sustain. Energy Rev. 2019, 107, 338–359. [Google Scholar] [CrossRef]
- Lampe, H.; Altmann, T.; Giitjens, H. PCS—Preussag Conversion System Mobile floating seawater desalination plant. Desalination 1997, 114, 145–151. [Google Scholar] [CrossRef]
- Johnson, K.; Clelland, D. Mobile and Floating Flash Desalination Plants. Desalination 1967, 2, 170–174. [Google Scholar] [CrossRef]
- Proskynitopoulou, V.; Katsoyiannis, I. Review of Recent Desalination Developments for more Efficient Drinking Water Production across the World. New Mater. Compd. Appl. 2018, 2, 179–195. [Google Scholar]
- Wangnick, K. Ship-Mounted Seawater 2500 m3/d Flash Evaporation Plant for Abu Dhabi. Economical Drinking Water for Arid Regions. Desalination 1982, 41, 171–180. [Google Scholar] [CrossRef]
- Mahdy, M.; Bahaj, A. Multi criteria decision analysis for offshore wind energy potential in Egypt. Renew. Energy 2018, 118, 278–289. [Google Scholar] [CrossRef]
- AbdeL-Latif, T.; Ramadan, S.; Galal, A. Egyptian coastal regions development through economic diversity for its coastal cities. HBRC J. 2012, 8, 252–262. [Google Scholar] [CrossRef][Green Version]
- Said, S.; Paul, F.; Ashour, A. Meso- and Micro-Scale Flow Modelling in the Gulf of Suez, Arab Republic of Egypt; European Wind Energy Association (EWEA), DUT Library: Brussels, Belgium, 2003. [Google Scholar]
- Reghu, S.; Sruthy, S. A Comparison of Fatigue Life Improvement Methods for an Existing Offshore Jacket Platform Structure. Int. J. Eng. Technol. 2018, 7, 333–340. [Google Scholar] [CrossRef]
- Abdel-Raheem, S.; Aal, E.; Abdel-Shafy, A.; Abdel-Seed, F. Nonlinear Analysis of Offshore Structures under Wave Loadings. In Proceedings of the 15th World Conference on Earthquake Engineering 2012 (15WCEE), Lisbon, Portugal, 24–28 September 2012. [Google Scholar]
- Khalifa, A.; Haggag, S.; Fayed, M. Fatigue Assessment Analysis of Offshore Structures with Application to an Existing Platform in Suez Gulf, Egypt. World Appl. Sci. J. 2014, 30, 1000–1019. [Google Scholar]
- Design of Floating Wind Turbine Structures. DVN-GL Rule, DNV-OS-J103. June 2013. Available online: http://dnvgl.com (accessed on 4 February 2020).
- Offshore Renewable Energy. Proceedings of the 20th International Ship and Offshore Structures Congress; ISSC, ISO Press: Amsterdam, The Netherlands, 2018; Volume II. [Google Scholar] [CrossRef]
- Kim, J.; Kang, K.; Oh, K.; Lee, J.; Ryn, M. A Study on the Site Selection of Offshore Wind Farm around Korean Peninsula. In Proceedings of the 3rd International Conference on Ocean Energy, Bilbao, Spain, 6 October 2010. [Google Scholar]
- EL-Shimy, M. Viability analysis of PV power plants in Egypt. Renew. Energy 2009, 34, 2187–2196. [Google Scholar] [CrossRef]
- EL-Ajmi, S.; Mohamed, Y.; Shoyama, M.; Diab, A. Optimal Design of Wind Energy System Interconnected with Utility Grid-Case Study of Egypt. Int. J. Eng. Res. Technol. 2019, 12, 1575–1583. [Google Scholar]
- Mortensen, N.; Gylling, S.; Badger, J. Wind Atlas for Egypt. In Proceedings of the 3rd Middle East-North Africa Renewable Energy Conference (MENAREC 3), Cairo, Egypt, 12 June 2006. [Google Scholar]
- Compaina, P. Solar Energy for Water desalination. Procedia Eng. 2012, 46, 220–227. [Google Scholar] [CrossRef]
- Batisha, A. Water Desalination Industry in Egypt. In Proceedings of the Eleventh International Water Technology Conference (IWTC11 2007), Sharm El-Sheikh, Egypt, 15–18 March 2007. [Google Scholar]
- Abdelkareem, M.; Assad, M.; Sayed, A.; Soudan, B. Recent progress in the use of renewable energy sources to power water desalination plants. Desalination 2018, 435, 97–113. [Google Scholar] [CrossRef]
- Chafidz, A.; Al-Zahrani, S.; Al-Otaibi, M.; Hoong, C.; Lai, T.; Prabu, M. Portable and integrated solar-driven desalination system using membrane distillation for arid remote areas in Saudi Arabia. Desalination 2014, 345, 36–49. [Google Scholar] [CrossRef]
- Chafidz, A.; Kerme, E.; Wazeer, I.; Khalid, Y.; Ajbar, A.; Al-Zahrani, S. Design and fabrication of a portable and hybrid solar-powered membrane distillation system. J. Clean. Prod. 2016, 133, 631–647. [Google Scholar] [CrossRef]
- Ahmed, A. Electricity generation from the first wind farm situated at RasGhareb, Egypt. Renew. Sustain. Energy Rev. 2012, 16, 1630–1635. [Google Scholar] [CrossRef]
- Chen, Y.; Dong, Z.; Meng, K.; Luo, F.; Yao, W.; Qiu, J. A novel technique for the optimal design of offshore wind farm electrical layout. J. Mod. Power Syst. Clean Energy 2013, 1, 258–263. [Google Scholar]
- Ahmed, A. Investigation of wind characteristics and wind energy potential at RasGhareb, Egypt. Renew. Sustain. Energy Rev. 2011, 15, 2750–2755. [Google Scholar] [CrossRef]
- Kaya, A.; Tok, M.; Koc, M. A Levelized Cost Analysis for Solar-Energy-Powered Sea Water Desalination in the Emirate of Abu Dhabi. Sustainability 2019, 11, 1691. [Google Scholar] [CrossRef]
- Jacobson, M.; Jadhav, V. World estimates of PV optimal tilt angles and ratios of sunlight incident upon tilted and tracked PV panels relative to horizontal panels. Sol. Energy 2018, 169, 55–66. [Google Scholar] [CrossRef]
- Moustafa, M.; El-bokl, E. Solar Energy for River Nile Cruisers. Shipbuilding 2014, 65–73. [Google Scholar]
- Antonios, T. Site Survey and Shading Analysis; Lecture Notes.
- Alsadi, S.; Khatib, T. Photovoltaic Power Systems Optimization Research Status: A Review of Criteria, Constrains, Models, Techniques, and Software Tools. Appl. Sci. 2018, 8, 1761. [Google Scholar] [CrossRef]
- Butterfield, S.; Musial, W.; Jonkman, J.; Sclavounos, P. Engineering Challenges for Floating Offshore Wind Turbines. In Proceedings of the Copenhagen Offshore Wind Conference, Copenhagen, Denmark, 26–28 October 2005. [Google Scholar]
- Matha, D. Model Development and Loads Analysis of an Offshore Wind Turbine on a Tension Leg Platform, with a Comparison to Other Floating Turbine Concepts. Subcontract Report; No. NREL/SR-500-45891; National Renewable Energy Laboratory: Golden, CO, USA, 2010.
- Collu, M.; Maggi, A.; Gualeni, P.; Rizzo, C.; Brennan, F. Stability requirements for floating offshore wind turbine (FOWT) during assembly and temporary phases: Overview and application. Ocean Eng. 2014, 84, 164–175. [Google Scholar] [CrossRef]
- Polo, J. Experimental and Numerical Investigation on the Stability in Waves of a Mono-column Platform. In Proceedings of the 13th International Ship Stability Workshop, Brest, France, 23–26 September 2013. [Google Scholar]
- Castro-Santos, L.; González, S.; Diaz-Casas, V. Mooring for floating offshore renewable energy platforms classification. In Proceedings of the International Conference on Renewable Energies and Power Quality (ICREPQ’13), Bilbao, Spain, 20–22 March 2013, ISSN 2172-038 X. [Google Scholar]
- Jang, H.; Park, S.; Kim, M.; Kim, K.; Hong, K. Effects of heave plates on the global performance of a multi-unit floating offshore wind turbine. Renew. Energy 2019, 134, 526–537. [Google Scholar] [CrossRef]
- Pham, T.; Shin, H. A New Conceptual Design and Dynamic Analysis of a Spar-Type Offshore Wind Turbine Combined with a Moonpool. Energies 2019, 12, 3737. [Google Scholar] [CrossRef]
- Bos, A.; Ligterink, T. Influence of Ocean Transport on the Design of Onshore and Offshore Constructions, Modules, Topside, Jackets and Towage on FPSO Design. In Proceedings of the 32nd International Conference on Ocean, Offshore and Artic Engineering OMAE32, Nantes, France, 9–14 June 2013. [Google Scholar]
© 2020 by the authors. Licensee MDPI, Basel, Switzerland. This article is an open access article distributed under the terms and conditions of the Creative Commons Attribution (CC BY) license (http://creativecommons.org/licenses/by/4.0/).