Abstract
Rivers discharge a substantial amount of nutrients into the bay, which constitutes a key area of research in water pollution and environmental management. However, research on the influence of river input on various nitrogen components in semi-enclosed bays like the Zhanjiang Bay remains limited. This study conducted on-site monitoring and cultivation experiments in Zhanjiang Bay. Consequently, a systematic investigation was conducted on the influence of river inputs on the migration and change in different nitrogen components, primarily dissolved inorganic nitrogen (DIN). The results showed that the DIN flux during the rainy season was the greatest input flux, amounting to 9724 t, which accounted for 45.6% of the annual DIN flux. The fluxes of NO2-N and NO3-N were the highest during the rainy season, accounting for 49% and 52% of the total annual flux, respectively. Based on on-site cultivation under different salinity conditions (5, 15, and 25), the DIN content decreased much faster in lower-salinity waters, with the highest average daily change rate of −16.3 μmol/dm3 in a salinity of 5. This indicated that hydrodynamic mixing and exchange processes have a significant impact on the variations in inorganic nitrogen components. Therefore, the results of this study provide valuable insights into the migration and change in inorganic nitrogen components in estuarine water bodies. It also holds significance for guiding the treatment of environmental pollution in estuaries, such as addressing the sewage discharge from the steel industry.
1. Introduction
Nitrogen is one of the key nutrient elements in the marine environment. It exerts a significant influence on the growth and production of phytoplankton. Phytoplankton, in turn, serves as the foundation of the marine food web [1,2,3]. As a key component of biomolecules such as amino acids, nucleic acids, and proteins, nitrogen is essential for the survival and reproduction of almost all marine organisms. However, human activities have significantly disturbed the natural nitrogen cycle, especially in coastal areas, and excessive nitrogen input has caused a series of environmental problems [4].
In the past few decades, coastal nitrogen pollution has become a significant environmental problem, especially in densely populated and highly industrialized areas [5,6]. Excessive inputs of nitrogen, mainly in the form of nitrate (NO3-N) and ammonium (NH4-N), often leads to the excessive enrichment of nutrients, which is called eutrophication. The eutrophication process promotes harmful algal blooms.
These negative effects have been observed in many coastal areas around the world, for example, the San Francisco Bay, the coastal waters of Qinhuangdao, and the Yangtze River estuary [7,8,9], and so on. The main sources of nitrogen pollution in coastal areas are diverse and complex, including agricultural runoff, industrial emissions, urban wastewater and atmospheric deposition [10]. Agriculture is one of the main contributors to nitrogen pollution, especially due to the widespread use of nitrogen-based fertilizers, which often enter adjacent rivers and coastal waters through surface runoff and underground seepage [11]. In China, these activities lead to a huge nitrogen load in some coastal areas. For example, significant nitrogen enrichment has occurred in the Bohai Sea and the East China Sea, which is largely driven by intensive agricultural activities in surrounding provinces [12,13]. Similarly, the Pearl River Delta river basin is severely affected by industrial wastewater and urban runoff. In addition to the sources of nitrogen pollution mentioned above, in the downwind areas of large cities, the contribution of atmospheric nitrogen deposition to the pollution in these areas cannot be ignored [14]. These areas not only face the challenge of high nitrogen concentrations but also the complex interactions between nitrogen and other pollutants, which further aggravate environmental degradation.
River inputs exert a substantial influence on the composition of dissolved inorganic nitrogen (DIN) in estuaries and bays This is manifested in the Bohai Sea [15] and river estuary waters of Hainan Island [16]. Within the continuous water body between the estuary and the bay, the concentration of nutrients generally decreases as the salinity of the water body increases. It further proves that a considerable proportion of nutrients originate from the land [17,18]. Simultaneously, climate also exerts an influence on the migration and transformation of nitrogen. Drought reduces surface runoff, leading to a decrease in NH4-N. Drought leads to intensified evaporation, a reduction in groundwater, and a decrease in NO2-N and NO3-N. The reduction in DIN also leads to a decrease in N2O emissions [19]. Following a torrential rainstorm, a substantial volume of freshwater is introduced into the bay. The saline front formed within the bay, which is weaker yet more stable compared to that during normal rainy seasons, intensifies the stratification of the water body. This, in turn, stimulates the proliferation of phytoplankton and significantly reduces the concentration of NO3-N. After the typhoon, the instability of the salinity front is sufficient to enhance vertical mixing in the water body and promote nitrification [20]. Although existing research has demonstrated the transformation pathways of nitrogen, there are also driving factors that affect nitrogen transformation. However, in semi-enclosed bays with restricted water exchange, such as Zhanjiang Bay, the changes that occur when nutrients, mainly DIN input by rivers, migrate outside the bay remain unclear.
Zhanjiang Bay, a semi-enclosed bay in southern China, is currently facing serious environmental degradation problems, mainly due to high nutrient loads, especially nitrogen and phosphorus [21,22]. In recent years, due to the aggravation of eutrophication, the water quality of the bay has deteriorated seriously, and harmful algal blooms have occurred frequently, resulting in ecological degradation [14,23]. The outbreaks of harmful algae have exerted negative impacts on fisheries, public health, and the coastal economy, resulting in substantial economic losses [24]. Moreover, harmful algae release toxic substances. When humans consume or come into contact with these toxic substances, it can pose a threat to human health [25,26]. These activities lead to the excessive enrichment of nutrients, aggravating eutrophication and destroying the natural balance of the ecosystem.
This study aims to investigate the factors influencing the variations in various nitrogen forms (primarily DIN) from the estuary to the bay mouth in the waters of Zhanjiang Bay. The main contents of this study are as follows: (1) based on the monitoring of each component of DIN in Zhanjiang Bay, the seasonal variations in the concentration and flux of DIN and its individual components were analyzed. (2) Set up cultivation experiments involving the mixing of seawater and sewage with controlled salinity to simulate the diffusion process of pollutants from the estuary to the coastal area. The mechanism of DIN migration and change is investigated through the simulation of cultivation experiments. (3) Classify the sewage outlets of Zhanjiang Bay according to their types, and quantify the proportion contribution of each type of outlet to the marine DIN. Thus, the study determines which specific sewage outlet primarily affects the DIN levels in Zhanjiang Bay. (4) Through the above research, identify the high-load sections and analyze the fundamental causes of the deterioration in water quality, providing a scientific basis for the implementation of targeted governance measures.
2. Materials and Methods
2.1. Study Areas
Zhanjiang Bay is situated in the southwestern part of Guangdong Province and lies in the northeastern part of the Leizhou Peninsula. The bay is connected to external waters through two passages: the southern bay mouth and the Nansan Waterway to the east. The eastern Nansan Waterway is narrow and shallow; therefore, most interactions between the estuary and the open sea occur through the southern bay mouth [4]. Zhanjiang is located in the tropical and subtropical regions and features a monsoon climate. The average annual temperature in Zhanjiang is 23.4 °C. The annual precipitation exceeds 1700 mm [27]. The Zhanjiang Bay is primarily fed by rivers such as the Suixi River, Nanliu River, and Lvtang River. The Suixi River is the primary freshwater river flowing into the Zhanjiang Bay, with an annual flow volume of 1.4 × 10⁹ m3 [28]. The tidal phenomena in the Zhanjiang Bay area exhibit an irregular semi-diurnal tidal pattern. The average water depth of Zhanjiang Bay is 10 m. The navigation area of Zhanjiang Port has been dredged, and the water depth exceeds 20 m. During neap tides, the lowest tidal levels that may occur in certain areas are approximately 4 cm [4]. After the completion of the Donghai Dam in 1960, the water exchange capacity of the Zhanjiang Bay has weakened [29]. Due to the small width of the bay mouth (only approximately 2 km), water exchange in the bay is difficult, and nutrients and pollutants are not easily exported through the bay mouth [30].
In 2021, four cruise surveys were carried out in January, March, July, and November in Zhanjiang Bay. The source input survey was conducted throughout 2021. The rainy season was from April to September, the normal season was March, October, and November, and the dry season was from December to February (Figure 1). Stations S1 to S3 are adjacent to the open sea, thus they are located at the bay mouth. Stations S4 to S10 are all located in a relatively open sea, so these stations are classified as being in the middle bay. Stations S11 to S18 are distributed in a long yet narrow sea area. Moreover, the stations are located in front of the estuary. Therefore, stations S11 to S18 are classified as the inner bay. Concurrently, this study selected nine sewage outlets within Zhanjiang Bay for measurement. These nine stations are, respectively, L1 (Hongxing Reservoir Outlet), L2 (Donghai Island), L3 (Donghai Island), L4 (Nanliu River), L5 (Lvtang River), L6 (Jinsha Bay), L7 (Binhu Park), L8 (Suixi River), and L9 (Dengta Park). Based on the on-site investigation, we classified the types of pollutant discharge from the discharge outlets. Station L8 is primarily characterized by river inputs, while stations L5, L6, L7, and L9 are dominated by domestic sewage. The L8 station is located at the estuary of the Suixi River, a natural watercourse. The rivers where the L5, L6, L7, and L9 stations are located pass through urban areas. Stations L2 and L3 are mainly composed of mariculture sewage, and station L4 is predominantly industrial sewage. In the vicinity of the L2 and L3 stations, there are primarily fish farms for oyster cultivation, which are visible via satellite imagery. Multiple industrial enterprises, including those in the petrochemical industry, are located along the river where the L4 station is situated.
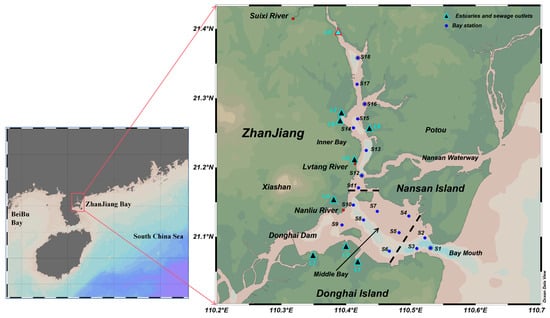
Figure 1.
Schematic diagram of the marine sampling stations (S1–S18) in Zhanjiang Bay and land-based sewage outlets (L1–L9).
2.2. Sampling and Measurement
Water samples are specifically collected using a portable water sample collector. After the water samples are collected, parameters such as water temperature, salinity, pH, and DO are measured on-site using a multi-parameter water quality meter (AP7000, AQUAREAD, Broadstairs, UK). Flow velocities at all sewage outlets are monitored simultaneously using mechanical rotary current meters, in strict compliance with the “River flow test gauge” (GB 50179-93) [31] in China. The collected water samples are transported back to the laboratory for further processing. The water samples are filtered using a glass fiber filter membrane with a pore size of 0.45 μm on the same day. After chlorophyll a is extracted using acetone, the supernatants obtained after extraction are measured using spectrophotometry. Nitrite (NO2-N), nitrate (NO3-N), ammonia (NH4-N), DIN, and dissolved inorganic phosphorus (DIP) contents are determined using the ultraviolet–visible spectrophotometer (UV-2000i, Shimadzu Corporation, Kyoto, Japan). The determination method employed is the standard method stipulated in China’s “Marine Monitoring Specifications” (GB12763.4-2007) [32]. NO2-N is determined using the diazo–azo method, NO3-N via the zinc–cadmium reduction method, NH4-N by sodium hypobromite oxidation, and DIP is determined using the phosphomolybdenum blue method. DIN is the sum of nitrite (NO2-N), nitrate (NO3-N), and ammonium (NH4-N). The detection limits for NO2-N are set to 0.02 μmol/dm3, NO3-N is set to 0.05 μmol/dm3, NH4-N is set to 0.03 μmol/dm3, and DIP is set to 0.02 μmol/dm3. During the nutrient test, ultrapure water is used as a blank control. 10% of the total samples are selected for testing as replicate samples, and the relative standard deviation of the replicate samples is less than 5%. The nutrient concentration in the sewage is relatively high, and dilution is required before testing. If water samples are not tested immediately after collection, they should be stored in a refrigerator at a temperature ranging from 4 °C to 6 °C. For testing purposes, water samples should be thawed 24 h in advance.
2.3. Experiment of Nutrient Transport and Change Under Different Salinities
To investigate the effects of different pollution sources and seawater dilution on Zhanjiang Bay, this study designed ecological enclosure experiments and pollutant dilution and mixing experiments. In addition, this experiment can also study the mechanism of action of pollution sources on Zhanjiang Bay under varying dilution and mixing conditions. The salinity of the river entering the sea is approximately 0, and the salinity of the seawater outside the bay is approximately 30. The seawater is mixed with the river water collected, and the mixed salinity reaches about 5, 15, and 25, respectively, to simulate the mixed state of the river entering the sea and the seawater in different diffusion stages. In the experiment, the river water is from the Suixi River (L8), and the seawater is from the Donghai Island Experimental Base of Guangdong Ocean University (the seawater is clean, the nutrient content is low, and the salinity is close to the open sea). According to the pre-set salinity, the river water and the background seawater were mixed according to formula (1), and then the experimental group was put into the sea to start the ecological enclosure culture. In addition, seawater that is not mixed with sewage is used as a control group. The experiment was divided into three salinity levels: 5, 15, and 25. Under each salinity level, there are four distinct treatment groups: no treatment, light exclusion, algae removal, and bacteria elimination. Under the initial conditions before cultivation, the salinity levels of the four different treatment groups are identical at the same salinity. During subsequent sampling, it is necessary to measure and control the salinity of the samples. The formula for calculating the salinity of the mixture when seawater is mixed with sewage is as follows:
where Vf represents the volume of river water that needs to be added and Vt as the total volume of mixed waters. Sf, Ss, and Smix denote the salinity of the freshwater added, the seawater added, and the resulting salinity after mixing, respectively.
In order to ensure the macroscopic effect of the culture system, an 11 L plastic bucket (20.6 cm long, 20.6 cm wide, 43.5 cm high) was selected as the incubator (Figure 2). The upper end is sealed with a rubber stopper, and a 0.8 cm hole is drilled in the rubber stopper to connect the internal air of the incubator with the external air. All four sets of buckets are horizontally secured with transparent tape. The mouth of each bottle is tied to the boat with a rope to ensure that the incubator can maximize the flow. The floating ball is bundled to increase buoyancy and avoid extrusion collision between the incubators. Plastic barrels from four different treatment groups are floating on the sea surface. Floating balls separate the plastic barrels and provide buoyancy. The presence of the floating ball ensures that the entire experimental apparatus remains afloat on the sea’s surface consistently under the specified conditions. According to the growth period of algae, the experimental group was planned to be continuously sampled within 15 days. The sampling time was 0 h, 24 h (day 1), 48 h (day 2), 72 h (day 3), 96 h (day 4), 120 h (day 5), 168 h (day 7), 216 h (day 9), 264 h (day 11), 312 h (day 13), and 360 h (day 15) to ensure the observation of the biochemical change processes of nutrients in the cultivation system. The samples were collected at 9 a.m. on each sampling date. The analysis and testing of environmental factors were conducted at the data collection site. Then, within 1 h after the samples were transported back to the laboratory, the experimental samples were dispensed, filtered, and frozen for subsequent analysis.
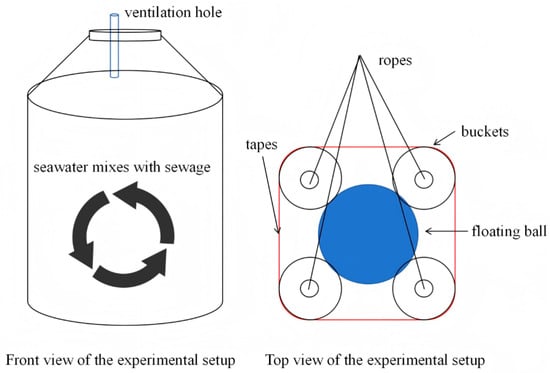
Figure 2.
Schematic diagram of the experimental setup.
2.4. Research Data Processing Methods
2.4.1. The Calculation Method for the Flux of Nitrogen Input from Land to the Ocean
In this study, samples were collected from nine sewage outlets in January, March, July, September, and December 2021. The obtained data are classified and discussed according to the rainy season, normal season, and dry season. The monthly flux from land to sea is calculated using the following formula:
In this formula, F is the land-based nitrogen flux into the sea, the unit is t/d (“t” stands for metric ton); C is the concentration of the land-based nutrient input, the unit is μmol/dm3; M is the molar mass, the unit is g/mol; and Q is the land-based flow flux, the unit is m3/d.
2.4.2. Data Statistics and Analysis Methods
The sampling station map and the plane distribution map are drawn using the Ocean Data View (ODV) software (5.7.0). Other figures in the article are drawn using origin (2018). Data processing and statistical analysis for this article were conducted utilizing Microsoft Excel.
3. Results
3.1. Temporal and Spatial Distribution of Inorganic Nitrogen Components
The spatial distribution and seasonal variation in the DIN concentration in Zhanjiang Bay are clearly shown in Figure 3. The distribution patterns of the DIN concentration in different seasons are significantly different, and the concentration level and spatial distribution have undergone significant changes. The DIN values in the surface water of Zhanjiang Bay ranged from 1.50 to 166 μmol/dm3 (47.0 ± 40.2 μmol/dm3). The highest DIN concentrations were recorded in autumn. The average concentration throughout Zhanjiang Bay was 85.2 ± 32.9 μmol/dm3. Among them, the DIN concentration in the inner bay is higher than that in the middle bay and the bay mouth. Subsequently, the concentration of DIN decreased sharply in winter, and the average concentration in the bay decreased to the lowest value of 3.93 ± 1.29 μmol/dm3 throughout the year. In spring, DIN concentration began to rise, especially in the inner bay area, which showed a significant increase. In summer, the concentration of DIN decreased again, but it was still higher than that in winter, with an average concentration of 12.6 ± 7.14 μmol/dm3 in the entire bay.
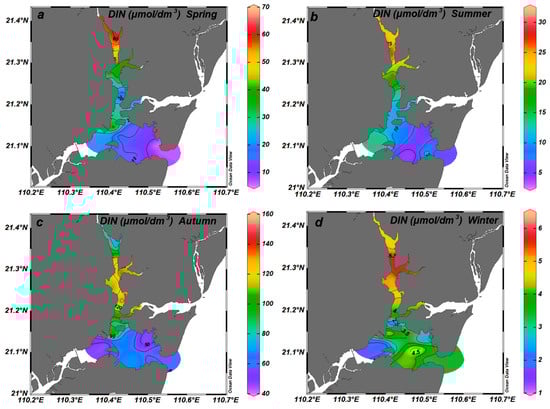
Figure 3.
Distribution of DIN content in the surface waters of Zhanjiang Bay: (a) spring, (b) summer, (c) autumn, and (d) winter.
Figure 4 shows the distribution of nitrate nitrogen (NO2-N), nitrate nitrogen (NO3-N), and ammonium nitrogen (NH4-N) in Zhanjiang Bay during the four seasons. The annual variation range of NO2-N concentration is 0.071–9.43 μmol/dm3, with an average concentration of 1.86 ± 2.50 μmol/dm3. The minimum and maximum values appear in spring and autumn, respectively. In autumn, the concentration of NO2-N is higher in the inner bay. The concentration of NO2-N gradually decreases towards the bay mouth. The annual variation range of NO3-N concentration is 1.07–140 μmol/dm3, with an average concentration of 24.6 ± 33.3 μmol/dm3. The minimum and maximum values appear in winter and autumn, respectively. The spatial distribution trend of NO3-N is similar to that of NO2-N. The annual variation range of NH4-N concentration is 0.071–8.50 μmol/dm3, with an average concentration of 1.86 ± 2.57 μmol/dm3. The minimum and maximum values appear in winter and spring, respectively. The concentration pattern of NH4-N differed from that of NO2-N and NO3-N. In spring, the concentration of NH4-N peaked, then gradually decreased in summer, rose again in autumn, and declined in winter.
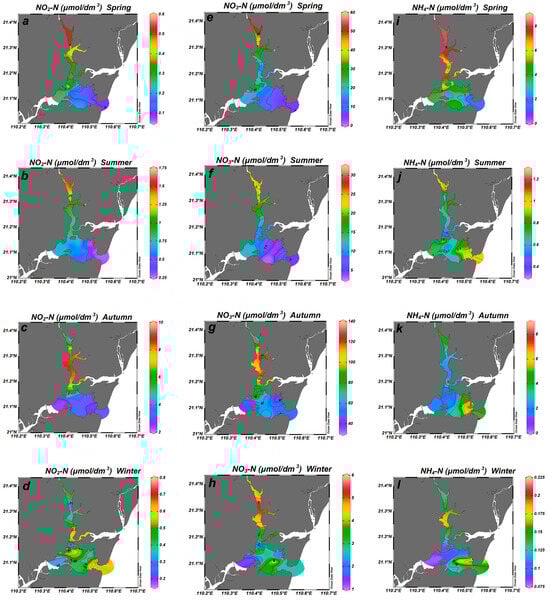
Figure 4.
The concentration distributions of different forms of nitrogen in the surface waters of Zhanjiang Bay during spring, summer, autumn, and winter: (a–d) belong to nitrite (NO2-N), (e–h) belong to nitrate (NO3-N), and (i–l) belong to ammonium salts (NH4-N).
3.2. The Variation in DIN Contents Under Different Salinity Conditions
The DIN concentrations in the three experimental groups with different salinities decreased after 15 days of culture (Figure 5). In the field simulation experiment in a salinity of 5, the initial DIN concentration decreased from 178 μmol/dm3 to 84.3 μmol/dm3. For the 15, it decreased from 30.7 μmol/dm3 to 10.0 μmol/dm3, and for the 25, it decreased from 19.3 μmol/dm3 to 1.43 μmol/dm3. The DIN concentration in the experimental group in a salinity of 5 decreased rapidly in the first four days and then remained relatively stable. The DIN concentration in experimental group 15 showed a relatively stable downward trend, while group 25 exhibited a gradual decline.
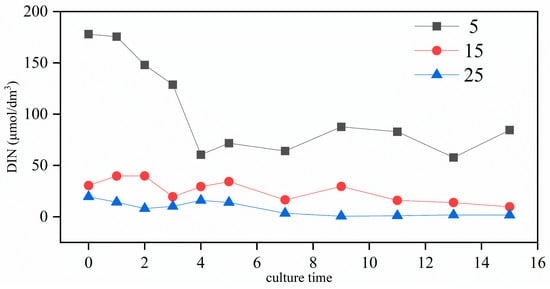
Figure 5.
Concentration changes of DIN under different salinities.
Based on the results of the on-site simulation experiments (Figure 5), the average daily change rate was adopted as an indicator to analyze the changes in each component of inorganic nitrogen with the alteration in seawater salinity. The average daily change rate is calculated by dividing the difference between the concentrations of each component of inorganic nitrogen after a certain number of days of cultivation and the initial concentrations before cultivation by the number of days of cultivation. The absolute value of the average daily change rate generally follows the following trend: 5 > 15 >25 (Table 1). These results indicate that through the hydrodynamic processes such as the mixing of river water and seawater, the contents of most components of DIN input from land-based rivers are mainly reduced in the low-salinity environment.

Table 1.
The average daily change rates of DIN within seven days under different salinities.
3.3. Temporal and Spatial Distribution of Terrestrial Nitrogen Input
The concentration changes in nitrogen nutrients from various sewage outlets in different water periods are shown in Figure 6. The concentration range of NO2-N in the sewage outlet is 0.071 μmol/dm3 to 336 μmol/dm3, and the average concentration is 25.3 ± 63.8 μmol/dm3. The concentration of NO2-N is generally low, not only during normal seasons but also in the rainy season. The concentrations at most of the monitoring points were lower than 0.714 μmol/dm3. During the dry season, the concentration of NO2-N is higher, with an average value of 60.4 μmol/dm3. The highest value of the year appeared at the L7 station. The average concentration range of NO3-N in the sewage outlet is 10.6 μmol/dm3 to 684 μmol/dm3, and the average concentration is 157 ± 189 μmol/dm3. The concentration range of ammonia nitrogen (NH4-N) in the sewage discharge outlet is from 2.00 μmol/dm3 to 396 μmol/dm3. The average concentration of NH4-N was 97.9 ± 117 μmol/dm3. The concentration range of DIN in the sewage outfalls is from 18.6 μmol/dm3 to 1036 μmol/dm3. The average concentration of DIN is 280 ± 274 μmol/dm3. During the rainy season, the concentration of NH4-N at all sites was the lowest among the three seasons. As seen in Figure 6d, except for the L7 and L9 stations, the DIN concentration at all other stations was greater than or equal to that in the dry season during the normal water season, and the DIN concentration at all stations during the rainy season was significantly lower than that in the other two seasons.
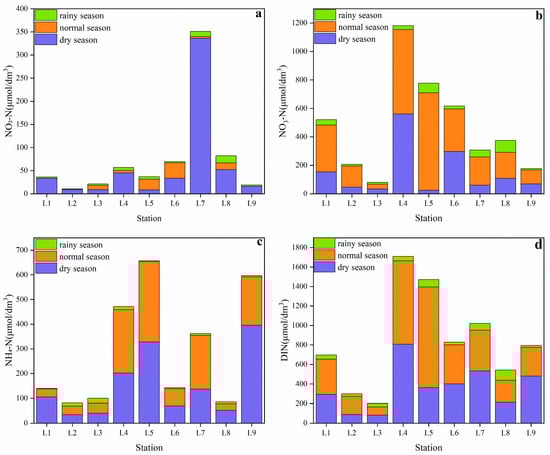
Figure 6.
Variation of nitrogen nutrient concentration in sewage outlets (L1–L9) around Zhanjiang Bay in different water periods: (a) NO2-N concentration of all sewage outlets; (b) NO3-N concentration of all sewage outlets; (c) NH4-N concentration of all sewage outlets; and (d) DIN concentration of all sewage outlets.
To gain a more intuitive understanding of the volume of pollutants discharged into the Zhanjiang Bay through sewage outlets, we calculated the nitrogen flux discharged from the sewage outlets into the Zhanjiang Bay. The flux changes in nitrogen nutrients at Zhanjiang Bay’s sewage outlets in different water periods are shown in Figure 7. The flux was estimated for one year by Equation (2). The total flux of NO2-N pollutants flowing into the sea was 2754 t. The NO2-N flux of the L8 (Suixi River) station was the highest during the three periods, contributing 800 t in the dry season, 436 t in the normal season, and 1409 t in the wet season, accounting for 91.9%, 98.3%, and 97.8% of the total flux, respectively. The lowest NO2-N flux was found in the L9 (Dengta Park) station during the normal season, which contributed 0.0004 t. The total flux of NO3-N was 15,951 t. The NO3-N pollutant flux of the L8 (Suixi River) station was the highest during the three periods, accounting for 88.3%, 89.2%, and 97.7% of the total flux, respectively. The lowest NO3-N fluxes were found in the L9 (Dengta Park) station during the rainy season, which only had 0.12 t. The total flux of NH4-N was 2746 t. The NH4-N pollutant flux of the L8 (Suixi River) station was the highest during the three periods, accounting for 86.9%, 75.2%, and 87.8% of the total flux, respectively. The lowest NH4-N fluxes were found in the L9 (Dengta Park) station during the rainy season, which only had 0.06 t. The total flux of DIN pollutants flowing into the sea in the rainy season, normal season, and dry season were 10,029 t, 7772 t, and 3650 t, respectively. The DIN pollutant flux of the L8 (Suixi River) station, which is located at the top of the bay, was the highest during the three periods, contributing 3242 t in the dry season, 6828 t in the normal season, and 9724 t in rainy season, accounting for 88.8%, 87.9%, and 97% of the total load, respectively. The lowest DIN flux was found in the L9 (Dengta Park) station in rainy season, which had 0.2 t. Except for the L3, L8, and L9 stations, the other stations exhibit the DIN fluxes during the normal season across the three seasons. It is indicated that the Suixi River serves as a major nitrogen emission point in Zhanjiang Bay, and rainfall significantly increases the nitrogen transport from runoff to the ocean.
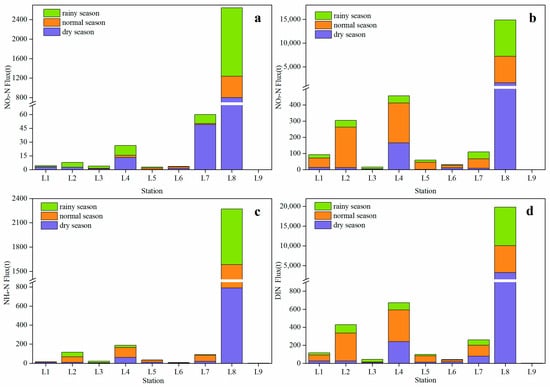
Figure 7.
Flux changes in nitrogen nutrients in the sewage outlets (L1–L9) around Zhanjiang Bay in different water periods: (a) NO2-N flux changes of all sewage outlets; (b) NO3-N flux changes of all sewage outlets; (c) NH4-N flux changes of all sewage outlets; and (d) DIN flux changes of all sewage outlets.
The flux of NH4-N was the highest in the normal season, followed by the dry season, and was the lowest in the rainy season. For NO2-N, its flux is the highest during the rainy season, accounting for 52% of the total flux. The dry season and the normal season account for 32% and 16%, respectively. The flux of NO3-N is highest during the rainy season, accounting for 49%. The dry season and the normal season account for 12% and 39%, respectively. The flux of DIN reaches its peak during the rainy season, accounting for approximately 47% of the total annual flux. Secondly, it accounts for 36% during normal seasons. The lowest proportion is recorded during the dry season, standing at 17% (Figure 8).
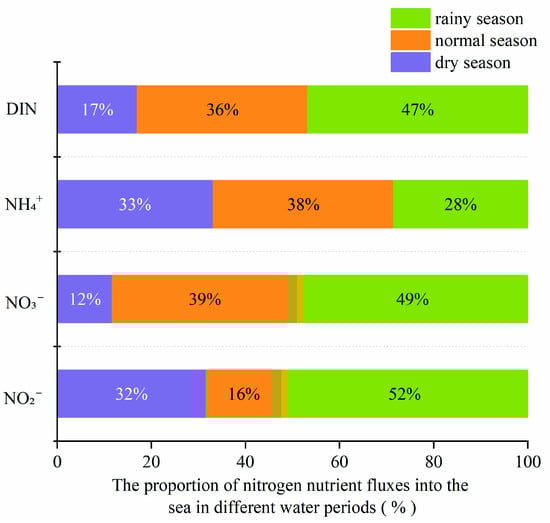
Figure 8.
The distribution of nitrogen nutrient fluxes into the sea in different water periods of Zhanjiang Bay.
The eight sewage outlets were classified according to different types of pollution sources, and the corresponding fluxes were calculated. Among them, L1 (Hongxing Reservoir River Estuary), belonging to the reservoir water, is not included in the calculation. River input was represented by station L8; domestic sewage was calculated using data from stations L5, L6, L7, and L9; mariculture sewage was assessed for stations L2 and L3; and industrial sewage was quantified based on data from station L4. These results highlight the seasonal variability of nitrogen fluxes across sources (Figure 9). NO3-N fluxes peaked in the rainy season, whereas NH4-N fluxes reached their maxima during the normal season, reflecting distinct transport and change mechanisms. Riverine input is the primary contributor of nitrogen, accounting for 92.76% of the DIN flux, which is particularly evident during the rainy season. Industrial sewage is the second-largest contributor to nitrogen sources, accounting for 3.14% of the DIN flux. There is no obvious difference in the contributions of domestic sewage and livestock sewage to nitrogen emissions.
Figure 9.
The flux proportion of nitrogen nutrients into the sea for different pollution sources in Zhanjiang Bay: (a) NO2-N flux proportion of different pollution sources; (b) NO3-N flux proportion of different pollution sources; (c) NH4-N flux proportion of different pollution sources; and (d) DIN flux proportion of different pollution sources.
4. Discussion
4.1. Seasonal Dynamics of DIN and Its Comparison with Other Coastal Waters, Both Domestically and Internationally
In the Zhanjiang Bay region, the seasonal variation in DIN showed significant temporal and spatial differences. The results show that autumn is the peak period of DIN concentration, especially in the inner bay area, and the concentration reaches the highest value throughout the year, which may be related to the higher precipitation in autumn and the increase in terrestrial input. In autumn, the substantial inflow of water from the Suixi River and other surface runoffs may lead to an increase in nitrogen load. The concentration of DIN in the inner bay area also increased accordingly. The geographical characteristics of Zhanjiang Bay lead to the long residence time of terrestrial pollutants in the inner bay, which aggravates the eutrophication of the region [30,33]. During the winter season, the DIN concentration experiences a sharp decline, which may be associated with the reduction in terrestrial inputs. As shown in Figure 8, the DIN flux in winter (dry season) is significantly lower than that in summer (rainy season). The DIN flux in winter is 6379.59 t less than that in summer. Meanwhile, the average water temperature in Zhanjiang Bay during winter is 12.67 °C lower than that in summer. The lower temperatures in winter, the reduced biological activities, the decreased surface runoff, and the lower water temperatures all contribute to the reduction in DIN concentration in Zhanjiang Bay [34]. In spring, as rainfall increases and river and land runoff increases, more nutrients are transported to the bay. This process leads to an increase in the overall DIN concentration in Zhanjiang Bay, especially in the inner bay area, near the Suixi River, where the increase in DIN concentration is particularly significant. In summer, the increase in water temperature will promote the biological activities in coastal waters, especially the growth and metabolism of phytoplankton and microorganisms, and increase the absorption and utilization of DIN [35]. The aforementioned process results in the DIN concentration being lower in summer than in spring. This phenomenon was also observed in Haikou [36]. The DIN speciation concentrations in Zhanjiang Bay were compared with former values reported in coastal waters of other regions at home and abroad (Table 2). The average Zhanjiang Bay DIN concentration (47.0 ± 40.2 μmol/dm3) was higher than that of the Hainan Island, Yellow Sea, Bohai Sea, Maowei Sea, and Qinzhou Port, reflecting human disturbance in the Zhanjiang Bay, but was lower than Changjiang River Estuary, Jiaozhou Bay, Pearl River Estuary, Shenzhen Bay, and Eckernförde Bay. The concentration ranges of DIN in estuaries and bays near urban areas, such as the Pearl River Estuary, Tokyo Bay, and the Gulf of Guayaquil, fluctuate significantly. Zhanjiang Bay is one of them. This indicates that human activities have an impact on the variation in DIN content.
Table 2.
The concentrations of DIN for bays and estuaries worldwide.
4.2. Migration, Change, and Influencing Factors of Nitrogen in Estuary–Bay Systems
The migration and change in DIN in Zhanjiang Bay are influenced by multiple factors, with salinity gradient and terrestrial input playing key roles. Therefore, the nutrient concentration in the sewage is also higher than that in the seawater of Zhanjiang Bay. The results of our cultivation experiment (Figure 5) indicate that the DIN concentration decreased significantly during the 15-day cultivation period. Under 5, the DIN concentrations declined from 178 μmol/dm3 to 84.5 μmol/dm3; at 15, from 30.5 μmol/dm3 to 9.43 μmol/dm3; and at 25, from 19.5 μmol/dm3 to 1.64 μmol/dm3. The removal rates vary under different salinity conditions: 52% at a salinity of 5, 68% at 15, and 92% at 25. The negative correlation between the concentration of DIN and salinity observed during the offshore survey in Zhanjiang Bay further confirms this trend (Figure 10). As water diffuses from the estuary towards the bay, the farther it is from the main discharge outlet of DIN, and the more readily DIN can be removed from the bay [49].
Figure 10.
Correlation heat map of DIN and multiple environmental parameters in Zhanjiang Bay. (* p ≤ 0.05, ** p ≤ 0.01).
It is worth noting that the change in DIN concentration in the five experimental groups was more significant. Specifically, it refers to the hydrodynamic mixing between estuarine water from the estuary and seawater from the open sea. This directly affects the retention time of DIN in the inner bay (a low-salinity area). Insufficient hydrodynamic mixing caused by geomorphic limitations may prolong the residence time of DIN. In contrast, during a relatively long biological reaction cycle, the consumption of DIN may be enhanced. The experimental data clearly indicate that under low-salinity conditions of 5, the average daily change rate of DIN is −16.3 μmol/dm3. In contrast, under high-salinity conditions of 25, the rate of change is considerably lower, with an average daily change rate of −2.29 μmol/dm3 (Table 1). In the vicinity of the estuary in Zhanjiang Bay, there are relatively drastic salinity variations between stations S18 and S17. Between stations S18 and S17, the salinity varies from 13.5 to 23.8, with a change rate of up to 102%. In the salinity front area where salinity changes are relatively drastic, Phytoplankton exhibits relatively high productivity [50]. The cultivation experiment with a salinity of 5 simulates an area relatively close to the salinity front area. Therefore, the concentration of DIN changed rapidly during the first four days before the cultivation experiment at a salinity of 5. Additionally, salinity influences microbial activity and the flocculation of organic matter, which may further accelerate the transformation of DIN [51,52]. Thus, salinity plays a critical role in both the physical and biological processes that control DIN dynamics in coastal environments [53]. DIN exhibits a significant positive correlation with DIP (p ≤ 0.05). This is highly likely to stem from homology. That is, while the Suixi River transports a substantial amount of nutrients into the bay, it also carries a large quantity of DIP [54].
Terrestrial nitrogen input exhibits distinct seasonal variations. The nitrogen input during the rainy season accounts for 47% of the total annual nitrogen input. This proportion is higher than the combined total of the normal season and the dry season. River input was the main source of DIN, accounting for 92.76 % of the total flux, especially in the rainy season. Although the contribution of anthropogenic sources (domestic sewage, mariculture sewage, and industrial sewage) is relatively small, they are continuously input in each season, which may play an important role in maintaining the basic nitrogen level in the bay. This input pattern reflects the complexity of natural processes (such as rainfall and runoff ) and human activities affecting the nitrogen cycle in the bay [55,56].
4.3. Multi-Process Analysis of Nitrogen Migration and Transformation in Zhanjiang Bay
This study reveals the complexity of the nitrogen cycle in Zhanjiang Bay, where the migration and transformation of nitrogen are affected by a variety of natural and human factors [29]. The nitrogen migration and transformation involves multiple processes from atmospheric deposition to river input, to biological uptake and degradation [57,58]. The nitrogen input in Zhanjiang Bay mainly depended on the river, especially the large amount of freshwater input from the estuary of Suixi River, which was consistent with our results, showing that the contribution of river input to DIN flux was the most significant in the rainy season (Figure 7). In addition, the mixing process of freshwater and saltwater can influence the distribution of DIN. Seawater with high salinity contains a relatively small amount of DIN, and its mixing with freshwater dilutes the DIN concentration in estuaries. The inflow of rivers, carrying abundant nutrients, increases the DIN level in the estuarine mixing zone. The variation in DIN concentration is closely associated with the tidal–river mixing process [50]. The results of our experiments indicate that as the salinity increases, the amount of nutrients in the water decreases. (Figure 5). Sediment resuspension and upwelling are also important factors affecting nitrogen cycle in Zhanjiang Bay [59]. Coupled nitrification–denitrification (CND) occurs not only in sediments but also on suspended particulate matter (SPM), which provides critical reactive surfaces [60]. The frequent marine engineering activities in Zhanjiang Bay, such as channel dredging, lead to the resuspension of seabed sediments in the water body, which accelerates the release of nutrients in the sediments and increases the nitrogen load of the bay [4,61,62]. Compared with other DIN sources, groundwater can play an important role in delivering DIN to the Zhanjiang Bay [63]. These natural processes and human activities, such as agricultural emissions and urban wastewater discharge, work together on the migration and change in nitrogen. In terms of the proportion of DIN from terrestrial sources, river input ranks first with a discharge of 19,793.7 t, accounting for 93.8% of the total terrestrial input, which is significantly higher than the inputs from the other three sources. The industrial sewage reached 672 t, accounting for 3.15% of the total land-based inputs, ranking second. Mariculture sewage and domestic sewage ranked third and fourth, with volumes of 471.8 tons and 399.4 tons, respectively. The land-based inputs of mariculture sewage and domestic sewage both account for less than 3% of the total land-based inputs. Overall, river input is the primary source of land-based DIN input into the Zhanjiang Bay. Among human-activity-related inputs, industrial sewage discharge contributes the most. The substantial discharge of sewage generated by human activities within the river basin can bring excessive DIN to the river [64].
4.4. Recommendations for Environmental Governance of the Bay
According to the “Guangdong Province Marine Functional Zoning (2011–2020)” [65] released in 2013, except for several recreational areas and marine protected areas, the vast majority of the waters within Zhanjiang Bay adhere to the Class IV water quality standards. According to the “Seawater Quality Standard (GB/3097-1997)” [66] in China, the average concentration of DIN in 18 stations in the Zhanjiang Bay was 47.0 ± 40.2 μmol/dm3, which was higher than the class IV water quality standard (35.7 μmol/dm3). Moreover, the annual average concentration of DIN in the inner bay area is 68.3 ± 57.2 μmol/dm3, which is higher than the class IV water quality standard (35.7 μmol/dm3), and the average concentration in the dry season in November is 85.0 ± 29.0 μmol/dm3, which is much higher than the class IV water quality standard. In the “14th Five-Year Plan” of marine ecological environment protection in Guangdong Province [67], the primary task is to strengthen the comprehensive management of land-based pollutants. For areas with severe pollution, differentiated emission reduction technologies will be adopted to effectively control pollutant emissions [38,68]. For instance, a long-term monitoring system will be established for monitoring purposes. In addition, the environmental reference value of pollutants should be improved to scientifically guide the formulation and supervision of pollutant emission standards. Zhanjiang Bay, a semi-enclosed subtropical bay in the northwestern South China Sea, spans approximately 2 km in width. Its narrow waterways result in weak hydrodynamic conditions, which hamper water quality regulation and nutrient exchange. This limited capacity to discharge pollutants into the open sea exacerbates eutrophication and ecological degradation [30]. The cultivation of marine organisms such as oysters influences the nitrogen cycle through processes including the ingestion of phytoplankton, the transfer of nitrogen to the sediment in the form of biological deposition, and the excretion of NO3-N [69]. Zhanjiang Bay serves as a crucial aquaculture area. With the escalating pollution in the bay, over the past two decades, the oyster farming areas located in the inner bay have shifted towards the estuaries. Meanwhile, the middle bay has been particularly severely affected by intensive aquaculture, domestic sewage, and non-point source pollution [22]. To improve water quality, it is essential to strengthen the control of land-based input water quality in the inner bay area, promote the optimization of marine industrial structure, accelerate the transformation of aquaculture models, and encourage the development of ecological aquaculture models such as factory circulating water aquaculture and pond industrial aquaculture.
5. Conclusions
Through research on the migration and change in nitrogen in Zhanjiang Bay, this paper reveals the influence of terrestrial inputs and seasonal variations in the nitrogen content in Zhanjiang Bay. Furthermore, salinity not only serves as a crucial indicator for measuring the dilution and mixing process of freshwater and seawater but also plays a vital regulatory role in the distribution pattern of nitrogen components. The concentration of DIN in Zhanjiang Bay showed obvious seasonal variation, with the highest concentration in autumn and the lowest concentration in winter; this change is closely related to seasonal changes in rainfall, river input, and water physical processes. In addition, it may also be related to the consumption during biological growth. River input was the main source of nitrogen load in Zhanjiang Bay, especially the input of the Suxi River, which contributed the most to the DIN flux in the rainy season. Furthermore, according to the on-site simulation experiments, most inorganic nitrogen components decreased significantly in the low-salinity region. Among the land-based inputs caused by human activities, the input flux of industrial sewage (steel industry) is the highest, followed by mariculture sewage, and the least is domestic sewage. Overall, the DIN transported by terrestrial sources, especially riverine inputs into the Zhanjiang Bay during the rainy season, undergoes significant migration and changes in various inorganic nitrogen components through the mixing and exchange processes between river water and offshore seawater in the bay, as well as biological activities.
The insights gained from the findings of this research include that it is recommended to strengthen the integrated management of land pollutants in Zhanjiang Bay, especially in the rainy season. In addition, we need to expedite the improvement of sewage collection and treatment capabilities, address the shortcomings in pollution treatment capacity, and reduce the flux of pollutants into the sea. Finally, efforts should be made to strengthen the protection of the existing mangroves in Zhanjiang Bay and expand the mangrove area, thereby enhancing the self-purification capacity of the water body.
Author Contributions
Conceptualization, G.-H.Y. and J.-B.Z.; methodology, J.-B.Z.; investigation, F.Y., Z.-L.C. and M.-J.F.; validation, G.-H.Y.; project administration, G.-H.Y. and J.-B.Z.; writing—original draft preparation, F.Y. and Z.-L.C.; writing—review and editing, F.Y., J.-B.Z. and P.Z.; visualization, F.Y., Y.-Y.Z. and M.-J.F.; supervision, G.-H.Y. and P.Z.; funding acquisition, G.-H.Y., J.-B.Z. and P.Z.; All authors have read and agreed to the published version of the manuscript.
Funding
This research was funded by the Research and Development Projects in Key Areas of Guangdong Province (2020B1111020004); the Guangdong Basic and Applied Basic Research Foundation (2023A1515012769); and the University Scientific Research Fund for a Ph.D. Start-up of Guangdong Ocean University (060302332501).
Data Availability Statement
Data will be made available on request.
Acknowledgments
The authors are grateful for the anonymous reviewers’ careful review and constructive suggestions to improve the manuscript.
Conflicts of Interest
The authors declare that they have no known competing financial interests or personal relationships that could have appeared to influence the work reported in this paper.
References
- Fang, Z.; Feng, T.; Meng, Y.; Zhao, S.; Yang, G.; Wang, Y.; Wang, L.; Shao, S.; Sun, W. Impacts of Coastal Nutrient Increases on the Marine Ecosystem in the East China Sea During 1982–2012: A Coupled Hydrodynamic-Ecological Modeling Study. J. Geophys. Res. Ocean. 2025, 130, e2024JC021553. [Google Scholar] [CrossRef]
- Hutchins, D.A.; Capone, D.G. The marine nitrogen cycle: New developments and global change. Nat. Rev. Microbiol. 2022, 20, 401–414. [Google Scholar] [CrossRef] [PubMed]
- Chen, Y.; Sun, S.; Hu, Z.; Liang, J.; Zhu, M.; Zhang, Y. In-field nutrient enrichment experiments in Sanggou Bay kelp farming. Oceanol. Limnol. 2025, 1–10. [Google Scholar] [CrossRef]
- Liang, H.; Zhang, J.; Zhang, J.; Zhang, P.; Deng, X.; Chen, J.; Wang, Z.; Long, C.; Lu, C.; Wang, D.; et al. Unveiling the eutrophication crisis: 20 years of nutrient development in Zhanjiang Bay, China. Front. Mar. Sci. 2024, 11, 1373716. [Google Scholar] [CrossRef]
- Zhang, P.; Lai, J.; Peng, D.; Ke, S.; Zhang, J. Spatiotemporal variation, composition, and implications for transport flux of nitrogen in Leizhou Peninsula coastal water, China. Cont. Shelf Res. 2024, 275, 105213. [Google Scholar] [CrossRef]
- Dai, M.; Zhao, Y.; Chai, F.; Chen, M.; Chen, N.; Chen, Y.; Cheng, D.; Gan, J.; Guan, D.; Hong, Y.; et al. Persistent eutrophication and hypoxia in the coastal ocean. Camb. Prism. Coast. Futures 2023, 1, e19. [Google Scholar] [CrossRef]
- Liu, J.; Yao, Q.; Mi, T.; Wei, Q.; Chen, H.; Yu, Z. Change of the Long-Term Nitrogen and Phosphorus in the Changjiang (Yangtze) River Estuary. Front. Mar. Sci. 2022, 9, 885311. [Google Scholar] [CrossRef]
- Czapla, K.M.; Owens, M.S.; Cornwell, J.C.; Senn, D.B.; Francis, C.A.; Chelsky, A. Microbial Nitrogen Removal in South San Francisco Bay: Does It Play a Role in Eutrophication Resistance? Estuaries Coasts 2025, 48, 45. [Google Scholar] [CrossRef]
- Cui, L.; Dong, Y.L.; Zhang, J.L.; Yang, W.D.; Lu, S.H.; Ou, L.J. From human-driven eutrophication to effective management: Controlling brown tides in the coastal waters of Qinhuangdao, China. Harmful Algae. 2025, 150, 102997. [Google Scholar] [CrossRef]
- Yu, L.; Li, R.; Zhang, C.; Sun, H.; Zhang, Z.; Zhao, P.; Zhang, P.; Yang, F. Assessing the atmospheric deposition of inorganic nitrogen and phosphorus over the Yellow Sea. Reg. Stud. Mar. Sci. 2025, 89, 104261. [Google Scholar] [CrossRef]
- Dunn, P.; Elliott, E.; Gilbertson, L.M. Estimating Daily Nitrate Loads in Iowa Streams Using a Partial Least Squares Regression Framework. JAWRA J. Am. Water Resour. Assoc. 2025, 61, e70036. [Google Scholar] [CrossRef]
- Qu, L.; Feng, P.; Cong, P.; Tao, G.; Liu, H.; Duan, W. Spatial-temporal distribution of nitrogen and phosphorus nutrients and potential eutrophication assessment in Bohai Bay, China. Ocean Coast. Manag. 2025, 267, 107741. [Google Scholar] [CrossRef]
- Wen, L.; Song, J.; Dai, J.; Li, X.; Ma, J.; Yuan, H.; Duan, L.; Wang, Q. Nutrient characteristics driven by multiple factors in large estuaries during summer: A case study of the Yangtze River Estuary. Mar. Pollut. Bull. 2024, 201, 116241. [Google Scholar] [CrossRef]
- Xue, Y.; Ma, Y.; Long, G.; He, H.; Li, Z.; Yan, Z.; Wan, J.; Zhang, S.; Zhu, B. Evaluation of water quality pollution and analysis of vertical distribution characteristics of typical Rivers in the Pearl River Delta, South China. J. Sea Res. 2023, 193, 102380. [Google Scholar] [CrossRef]
- Li, Z.; Tian, C.; Sheng, Y. Fluxes of chemical oxygen demand and nutrients in coastal rivers and their influence on water quality evolution in the Bohai Sea. Reg. Stud. Mar. Sci. 2022, 52, 102322. [Google Scholar] [CrossRef]
- Zhang, P.; Ruan, H.; Dai, P.; Zhao, L.; Zhang, J. Spatiotemporal river flux and composition of nutrients affecting adjacent coastal water quality in Hainan Island, China. J. Hydrol. 2020, 591, 125293. [Google Scholar] [CrossRef]
- Murray, R.; Erler, D.V.; Rosentreter, J.; Wells, N.S.; Eyre, B.D. Seasonal and spatial controls on N2O concentrations and emissions in low-nitrogen estuaries: Evidence from three tropical systems. Mar. Chem. 2020, 221, 103779. [Google Scholar] [CrossRef]
- Wang, L.; Lei, X.; Yuehua, G.; Zhou, Y.; Han, J.C.; Huang, Y.; Li, B.; Mao, X.Z.; Tang, Z. A novel method of identifying estuary high-nutrient zones for water quality management. Sci. Total Environ. 2024, 912, 169578. [Google Scholar] [CrossRef]
- Zhang, M.; Yu, D.; Yu, Y.; Yan, R.; Li, Y.; Gong, W.; Xiao, K.; Li, S.; Chen, N. Drought reduces nitrogen supply and N2O emission in coastal bays. Water Res. 2024, 266, 122362. [Google Scholar] [CrossRef]
- Zhou, X.; Zhang, S.; Chen, C.; Lao, Q.; Chen, F. Changes in fronts regulate nitrate cycling in Zhanjiang Bay: A comparative study during the normal wet season, rainstorm, and typhoon periods. Sci. Total Environ. 2024, 931, 172902. [Google Scholar] [CrossRef]
- Xiang-ying, Y.; Wen-bo, Z.; Jin-tao, L.; Jun-yi, T. Spatial and temporal distribution characteristics and influencing factors of nitrogen and phosphorus pollution in Zhanjiang Bay, Guangdong Province. Environ. Ecol. 2024, 6, 33–40. [Google Scholar]
- Lao, Q.; Wu, J.; Chen, F.; Zhou, X.; Li, Z.; Chen, C.; Zhu, Q.; Deng, Z.; Li, J. Increasing intrusion of high salinity water alters the mariculture activities in Zhanjiang Bay during the past two decades identified by dual water isotopes. J. Environ. Manag. 2022, 320, 115815. [Google Scholar] [CrossRef] [PubMed]
- Cai, S.; Lao, Q.; Chen, C.; Zhu, Q.; Chen, F. The impact of algal blooms on promoting in-situ N2O emissions: A case in Zhanjiang bay, China. J. Environ. Manag. 2024, 358, 120935. [Google Scholar] [CrossRef] [PubMed]
- Malone, T.C.; Newton, A. The Globalization of Cultural Eutrophication in the Coastal Ocean: Causes and Consequences. Front. Mar. Sci. 2020, 7, 670. [Google Scholar] [CrossRef]
- Wurtsbaugh, W.A.; Olofsson, M.; Boyer, G.L.; Marcarelli, A.M. Salinity adaption and toxicity of harmful algal blooms in three bays of Great Salt Lake (USA). Harmful Algae. 2025, 150, 102959. [Google Scholar] [CrossRef]
- Zhang, Y.; Whalen, J.K.; Cai, C.; Shan, K.; Zhou, H. Harmful cyanobacteria-diatom/dinoflagellate blooms and their cyanotoxins in freshwaters: A nonnegligible chronic health and ecological hazard. Water Res. 2023, 233, 119807. [Google Scholar] [CrossRef]
- Zhao, L.; Zhao, Z.; Zhang, J.; Zhang, P. Seasonal variation, spatial distribution, and sources of PAHs in surface seawater from Zhanjiang bay influenced by land-based inputs. Mar. Environ. Res. 2023, 188, 106028. [Google Scholar] [CrossRef]
- Yonghao, S.; Liangwen, J.; Heng, Z.; Yitong, L. Environmental capacity calculation and sewage treatment in Inner Zhanjiang Bay. J. Trop. Oceanogr. 2021, 40, 134–142. [Google Scholar] [CrossRef]
- Zhou, X.; Chen, C.; Chen, F.; Song, Z. Changes in net anthropogenic nitrogen input in the watershed region of Zhanjiang Bay in south China from 1978 to 2018. Environ. Dev. Sustain. 2021, 23, 17201–17219. [Google Scholar] [CrossRef]
- Fu, D.; Zhong, Y.; Chen, F.; Yu, G.; Zhang, X. Analysis of Dissolved Oxygen and Nutrients in Zhanjiang Bay and the Adjacent Sea Area in Spring. Sustainability 2020, 12, 889. [Google Scholar] [CrossRef]
- GB 50179-93; River Flow Test Gauge. China Planning Press: Beijing, China, 2005.
- GB/T 12764.4-2-7; Specifications for Oceanographic Surey-Part 4: Survey of Chemical Parameters in Sea Water. AQSIQ: Beijing, China, 2007.
- Shi, Y.; Jia, L.; Zhang, H. Analysis of the water residence time and influencing factors in Zhanjiang Bay. Environ. Sci. Technol. 2020, 43, 17–24. [Google Scholar] [CrossRef]
- Zheng, Q.; Pan, G.; Zhao, H.; Tian, K. Regulation of winter river input on the nutrient structure of typical tropical bays around Leizhou Peninsula, South China. Ocean Coast. Manag. 2024, 256, 107272. [Google Scholar] [CrossRef]
- Wang, J.; Beusen, A.H.W.; Liu, X.; Van Dingenen, R.; Dentener, F.; Yao, Q.; Xu, B.; Ran, X.; Yu, Z.; Bouwman, A.F. Spatially Explicit Inventory of Sources of Nitrogen Inputs to the Yellow Sea, East China Sea, and South China Sea for the Period 1970–2010. Earth’s Future 2020, 8, e2020EF001516. [Google Scholar] [CrossRef]
- Yu, J.; Cai, Y.; Li, Y.; Huang, W.; Luo, L.; Xu, M.; Liu, J.; Kao, S.J.; Zheng, N.; Li, Q.; et al. Decadal nutrient dynamics in a tropical bay: Spatiotemporal variations and drivers in Haikou Bay and adjacent coastal waters (2010–2021). Mar. Pollut. Bull. 2025, 221, 118499. [Google Scholar] [CrossRef]
- Zhang, P.; Chen, Y.; Peng, C.; Dai, P.; Lai, J.; Zhao, L.; Zhang, J. Spatiotemporal variation, composition of DIN and its contribution to eutrophication in coastal waters adjacent to Hainan Island, China. Reg. Stud. Mar. Sci. 2020, 37, 101332. [Google Scholar] [CrossRef]
- Li, K.; He, J.; Li, J.; Guo, Q.; Liang, S.; Li, Y.; Wang, X. Linking water quality with the total pollutant load control management for nitrogen in Jiaozhou Bay, China. Ecol. Indic. 2018, 85, 57–66. [Google Scholar] [CrossRef]
- Kreuzburg, M.; Scholten, J.; Hsu, F.-H.; Liebetrau, V.; Sültenfuß, J.; Rapaglia, J.; Schlüter, M. Submarine Groundwater Discharge-Derived Nutrient Fluxes in Eckernförde Bay (Western Baltic Sea). Estuaries Coasts 2023, 46, 1190–1207. [Google Scholar] [CrossRef]
- Jin, C.; Zhang, C.; Wang, L.; Shi, X.; Han, X.; Tang, H. Spatial-temporal variation of dissolved inorganic nitrogen (DIN) and impacts of water mass on the reserves estimation of the total DIN content in the Yellow Sea. China Environ. Sci. 2021, 41, 1642–1654. [Google Scholar] [CrossRef]
- Wang, Y.; Liu, D.; Xiao, W.; Zhou, P.; Tian, C.; Zhang, C.; Du, J.; Guo, H.; Wang, B. Coastal eutrophication in China: Trend, sources, and ecological effects. Harmful Algae. 2021, 107, 102058. [Google Scholar] [CrossRef]
- Li, J.; Wu, Y.; Jiang, Z.; Liu, S.; Ren, Y.; Yang, J.; Song, X.; Huang, X.; He, D. Terrestrial and Biological Activities Shaped the Fate of Dissolved Organic Nitrogen in a Subtropical River-Dominated Estuary and Adjacent Coastal Area. J. Geophys. Res. Ocean. 2023, 128, e2023JC019911. [Google Scholar] [CrossRef]
- Lu, D.; Zhang, D.; Zhu, W.; Felix Dan, S.; Yang, B.; Kang, Z.; Yu, K. Sources and long-term variation characteristics of dissolved nutrients in Maowei Sea, Beibu Gulf, China. J. Hydrol. 2022, 615, 128576. [Google Scholar] [CrossRef]
- Hashimoto, S.; Mizuno, K. Long-term trends in eutrophication in the inner part of Tokyo Bay, Japan, from 1998 to 2023. Reg. Stud. Mar. Sci. 2025, 85, 104153. [Google Scholar] [CrossRef]
- Damar, A.; Colijn, F.; Hesse, K.-J.; Adrianto, L.; Yonvitner, Y.; Fahrudin, A.; Kurniawan, F.; Prismayanti, A.D.; Rahayu, S.M.; Rudianto, B.Y.; et al. Phytoplankton Biomass Dynamics in Tropical Coastal Waters of Jakarta Bay, Indonesia in the Period between 2001 and 2019. J. Mar. Sci. Eng. 2020, 8, 674. [Google Scholar] [CrossRef]
- Ormaza-González, F.I.; Campi-Alvarez, P.A.; Cárdenas-Condoy, J.W.; Caiza-Quinga, R.J.; Statham, P.J. Further evidence for increasing global near-shore eutrophication from the Estero Salado, Guayaquil, Ecuador. Cont. Shelf Res. 2024, 278, 105271. [Google Scholar] [CrossRef]
- Murgulet, D.; Lopez, C.V.; Douglas, A.R.; Eissa, M.; Das, K. Nitrogen and carbon cycling and relationships to radium behavior in porewater and surface water: Insight from a dry year sampling in a hypersaline estuary. Mar. Chem. 2024, 258, 104351. [Google Scholar] [CrossRef]
- Yan, Q.; Cheng, T.; Song, J.; Zhou, J.; Hung, C.-C.; Cai, Z. Internal nutrient loading is a potential source of eutrophication in Shenzhen Bay, China. Ecol. Indic. 2021, 127, 107736. [Google Scholar] [CrossRef]
- Hong, Y.; Wang, S.; Xu, X.R.; Wu, J.; Liu, L.; Yue, W.; Wu, M.; Wang, Y. Developing a salinity-based approach for the evaluation of DIN removal rate in estuarine ecosystems. Ecotoxicology 2015, 24, 1611–1620. [Google Scholar] [CrossRef]
- Tao, W.; Niu, L.; Dong, Y.; Fu, T.; Lou, Q. Nutrient Pollution and Its Dynamic Source-Sink Pattern in the Pearl River Estuary (South China). Front. Mar. Sci. 2021, 8, 713907. [Google Scholar] [CrossRef]
- Zhou, G.; Xu, S.; Yao, Q.; Yin, C. Influence of Salinity on Microbial Community in Activated Sludge and Its Application in Simulated Dye Wastewater Treatment. Environ. Sci. 2017, 38, 2972–2977. [Google Scholar] [CrossRef]
- Zhang, S.; Yu, C.; Han, Y.; Tang, Y.; Shi, L.; Zhao, W.; Wang, X.; Zhang, X.; Huang, Z.; Hu, L. Research progress in microbial treatment of high-salinity industrial organic wastewater. Microbiol. China 2023, 50, 1720–1733. [Google Scholar] [CrossRef]
- Sui, J.; Ding, D.; Zhang, Y.; Zhu, L.; Cui, Z.; Sun, J.; Wei, Y. River inflow and seawater intrusion shape distinct phytoplankton communities in jinghai bay, a coastal bay of the Yellow Sea. Mar. Environ. Res. 2025, 210, 107309. [Google Scholar] [CrossRef]
- Pan, Y.; Chen, Y.; Zhao, H. Spatial distribution of the summer chlorophyll a and nutrients in the Pearl River Estuary. Mar. Pollut. Bull. 2025, 220, 118479. [Google Scholar] [CrossRef]
- Zhu, Y.; Li, L.; Wang, P.; He, J.; Jia, G. Progress in the study of marine stable nitrogen isotopic changes and its geological records. Adv. Earth Sci. 2020, 35, 167–179. [Google Scholar] [CrossRef]
- Zhou, G.; Zhou, P.; Wang, G.; Li, S.; Feng, Y. Research progress on nitrogen biogeochemical processes in coastal groundwater. Environ. Chem. 2024, 43, 987–998. [Google Scholar] [CrossRef]
- Zhu, G. Novel nitrogen cycles in terrestrial and freshwater ecosystems. Acta Microbiol. Sin. 2020, 60, 1972–1984. [Google Scholar] [CrossRef]
- Zhang, J.; Guo, X.; Zhao, L. Tracing external sources of nutrients in the East China Sea and evaluating their contributions to primary production. Prog. Oceanogr. 2019, 176, 102122. [Google Scholar] [CrossRef]
- Mao, T.; Dong, H.; Chen, F.; Hou, Q.; Zhu, Q.; Yang, W.; Zhang, J.; Ji, Z.; Ling, W. Abundance, Diversity, and Distribution of Denitrifier and Anammox Bacteria in Zhanjiang Bay Sediments. Oceanol. Limnol. Sin. 2020, 51, 59–74. [Google Scholar] [CrossRef]
- Kong, X.; Hu, N.; Wang, W.; Li, Z.; Wang, Z.; Wang, H.; Sheng, Y. Estuarine fine particles enhance nitrogen elevation and nutritional imbalance in coastal and offshore waters. J. Hydrol. 2025, 659, 133179. [Google Scholar] [CrossRef]
- Han, C.; Pu, L.; Wang, S.; Vogt, R.D.; Lu, X. Riverine fluxes of dissolved inorganic nitrogen may be underestimated in gated estuaries: Influence of suspended sediments. J. Oceanol. Limnol. 2025. [Google Scholar] [CrossRef]
- Lin, J.; van Prooijen, B.C.; Zhu, C.; Guo, L.; He, Q.; Wang, Z.B.; Yang, Q. Deepening and narrowing impacts on circulation, stratification, and sediment transport in the Changjiang Estuary. Front. Mar. Sci. 2025, 12, 1598417. [Google Scholar] [CrossRef]
- Wang, Q.; Wang, X.; Xiao, K.; Zhang, Y.; Luo, M.; Zheng, C.; Li, H. Submarine groundwater discharge and associated nutrient fluxes in the Greater Bay Area, China revealed by radium and stable isotopes. Geosci. Front. 2021, 12, 101223. [Google Scholar] [CrossRef]
- Ren, C.; Peng, D.; Shi, X.; Yang, S.; Zhang, P.; Zhang, J. Seasonal Total Nitrogen and Phosphorus Variation, Speciation, and Composition in the Maowei Sea Affected by Riverine Flux Input, South China Sea. Water 2022, 14, 2584. [Google Scholar] [CrossRef]
- Guangdong Province Marine Functional Zoning (2011–2020); Guangdong Provincial People’s Government: Guangzhou, China, 2013.
- GB 3097-1997; Sea Water Quality Standard. China Planning Press: Beijing, China, 1998.
- Department of Ecological Environment in Guangdong Province. 14th Five-Year Plan for Marine Ecological Environment Protection in Guangdong Province; Department of Ecological Environment in Guangdong Province: Guangzhou, China, 2022. [Google Scholar]
- Zhang, P.; Su, Y.; Liang, S.-k.; Li, K.-q.; Li, Y.-b.; Wang, X.-l. Assessment of long-term water quality variation affected by high-intensity land-based inputs and land reclamation in Jiaozhou Bay, China. Ecol. Indic. 2017, 75, 210–219. [Google Scholar] [CrossRef]
- Pan, K.; Lan, W.; Li, T.; Hong, M.; Peng, X.; Xu, Z.; Liu, W.; Jiang, H. Control of phytoplankton by oysters and the consequent impact on nitrogen cycling in a Subtropical Bay. Sci. Total Environ. 2021, 796, 149007. [Google Scholar] [CrossRef] [PubMed]
Disclaimer/Publisher’s Note: The statements, opinions and data contained in all publications are solely those of the individual author(s) and contributor(s) and not of MDPI and/or the editor(s). MDPI and/or the editor(s) disclaim responsibility for any injury to people or property resulting from any ideas, methods, instructions or products referred to in the content. |
© 2025 by the authors. Licensee MDPI, Basel, Switzerland. This article is an open access article distributed under the terms and conditions of the Creative Commons Attribution (CC BY) license (https://creativecommons.org/licenses/by/4.0/).