Abstract
The umbilical cable is an important component of the deep-sea mining system, serving as the sole connection between the surface support vessel and the seabed mining system. The harsh marine environment poses significant challenges to umbilical cable safety. Methods based on traditional time-domain simulation are time-consuming and it is hard for them to meet the needs of real-time prediction. In this paper, a novel forecasting method is proposed, PFLM-PSML, which integrates the theory of potential flow (PF), the lumped mass method (LM), and a parameterised supervised machine learning method (PSML) to forecast the safety of umbilical cables. Six environmental and system parameters—wave height, wave direction, current velocity, current direction, cable length, and the relative position between vehicle and vessel—are used as model inputs, while outputs include cable top tension, curvature, and mining vehicle overturning moments. The model employs Latin hypercube sampling and an active learning approach with hybrid kernel functions to efficiently map input–output relationships. Validation through numerical simulations and a 6000 m deep-sea trial confirms that the proposed method achieves high accuracy and a computational speed thousands of times faster than traditional approaches, enabling real-time mechanical state prediction. Parametric analyses reveal that increases in wave height, current velocity, and water depth lead to higher cable tension and vehicle overturning moments. The PFLM-PSML framework demonstrates strong potential for real-time safety assessment and control of deep-sea mining systems under complex ocean conditions.
1. Introduction
The deep sea is rich in mineral resources, and deep-sea mining has recently become the focus of global scientific research and strategic planning [,,]. The pipeline lifting mining system has become the most promising development solution due to its high mining efficiency and technical feasibility [,]. As shown in Figure 1, the system consists of subsystems such as subsea mining equipment, umbilical cables, vertical ore lifting pipelines, and surface support platforms []. The umbilical cable serves as a key component connecting the subsea mining equipment and the surface support platform, responsible for transmitting power and signals to ensure operational functionality []. In 2019, there was a delay in the release of the Patania II mining vehicle from the Belgian company GSR due to a tether cable break during functional testing. In 2021, the mining vehicle lost contact with the mother ship for 5 days during a 4500 m sea trial for the same reason []. Thus, how to accurately predict the mechanical characteristics of the umbilical cable during deep-sea mining operations will be of great significance.
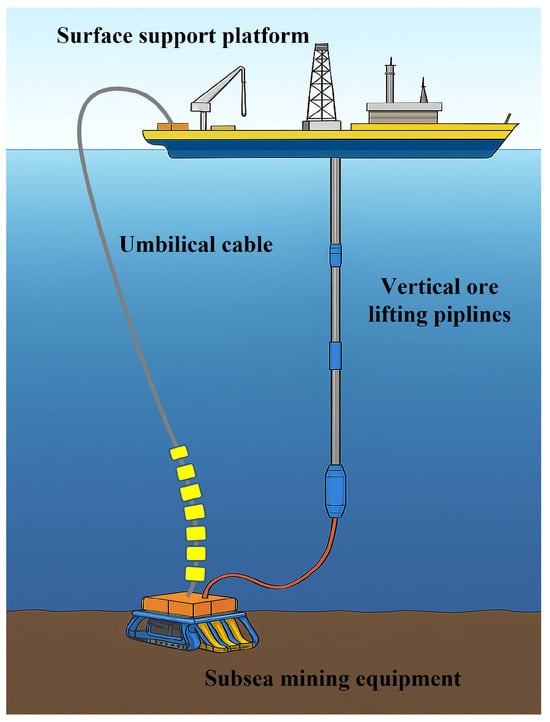
Figure 1.
Pipeline lifting of the mining system.
Conventional monitoring methods, such as physical model experiments and finite element simulations, are widely used for analyzing the dynamic behavior of umbilicals. However, these approaches are often constrained by high computational costs, long simulation times, and limited scalability in complex marine environments. Moreover, their reliance on predefined boundary conditions and idealized assumptions can lead to reduced accuracy when dealing with nonlinear, time-varying, and multi-physics coupling scenarios [,,]. These limitations hinder their applicability in rapid evaluation and real-time operational decision-making.
The frequency domain method needs to linearize the nonlinear terms, which is suitable for the problems with weak nonlinearity. The drag force is usually treated by the equivalent energy method or statistical linearization [,,,]. Wu [] proposed the equivalent linear form of one-dimensional drag force under random sea conditions with current, and extended it to three dimensions. However, Hamilton [] pointed out that the method depends on the reference frame, and Langley [] also found that ignoring the coupling of current direction would lead to underestimation of the drag force. The time-domain motion equations of mooring lines can be solved using explicit or implicit integration schemes. Implicit methods like Newmark- and Wilson- require iteration, while the modified Euler method is simple, efficient, and was shown by Hahn to be stable and accurate [,]. Time-domain analysis also allows consideration of nonlinearities such as geometric effects and hydrodynamic drag.
Extensive model experiments have been conducted on the vortex-induced vibration (VIV) of marine risers. Huse et al. [] and Chaplin et al. [,] focused on the response of cylinders subjected to different external flow conditions. Morse et al. [] explored the role of boundary conditions in cylinder VIV, while Vandiver et al. [] examined the effects of varying cylinder materials and diameters. Costello and Philips [], based on Love’s [] curved beam theory, investigated the structural response of individual helical cables under tensile loading. McConnell and Zemke [], using the theory of mechanics of materials, studied a single helical wire wound around a central cylinder and, through simple superposition, derived the coupling relationship between axial elongation and torsion. Leroy and Estrier [], considering the geometric characteristics of helical structural components and the friction between them, derived equilibrium dynamic equations and further obtained methods for calculating dynamic stress and displacement.
With the development of computer science, machine learning has been increasingly introduced into the research of dynamic response prediction for marine flexible cables and umbilicals by a growing number of researchers [,,,]. Guarize et al. [] proposed a hybrid artificial neural network-finite element method, utilizing the system’s current and historical excitations as inputs to predict subsequent system responses, thereby replacing the finite element simulation process. Yang et al. [] introduced a machine learning model based on reservoir computing for predicting mooring line tension. Yan et al. [] developed an effective method using Long Short-Term Memory (LSTM) neural networks to predict the time series of top tension responses in umbilicals. Xie et al. [] employed Gated Recurrent Unit (GRU) networks to predict mooring line tension. However, these methods share a common limitation: their computational accuracy heavily depends on the construction of training samples. When the number of training samples is small or the sample distribution is suboptimal, prediction errors tend to be significant. Conversely, while increasing the number of training samples can improve accuracy, it often leads to a notable decline in computational efficiency. With the development of artificial intelligence, Gaussian Process Regression (GPR), grounded in rigorous statistical learning theory, is particularly well-suited for handling complex regression problems involving high dimensions, small samples, and nonlinearity, and has been widely applied across various fields [,,,].
In this paper, a hybrid prediction framework, referred to as PFLM-PSML, is proposed. The method integrates Potential Flow Theory (PF), the Lumped Mass Method (LM), and a Parameterized Supervised Machine Learning (PSML) approach based on GPR to forecast the mechanical characteristics of umbilical cables in deep-sea mining. The framework aims to combine the accuracy and interpretability of physics-based models with the efficiency and adaptability of machine learning techniques. The proposed approach is validated through both numerical simulations and a full-scale deep-sea trial. Furthermore, the influence of key environmental and operational parameters on umbilical cable mechanics is systematically analyzed [].
2. Theoretical Background
2.1. Three-Dimensional Potential Flow Theory
Three-dimensional potential flow theory is applicable for calculating the first-order wave loads on large-scale structures in water. Based on the assumptions of an ideal fluid—namely, inviscid, irrotational, and potential—the velocity potential function exists in the fluid domain surrounding the structure. The governing equation of the flow field is simplified to the Laplace equation with Lagrange integration. In addition to satisfying the Laplace equation, the flow field must fulfill initial conditions and various boundary conditions, such as the free surface condition, body surface condition, seabed condition, and radiation condition. According to the fundamental assumptions of potential flow theory, the governing equation and boundary conditions for the first-order velocity potential can be found in the relevant references.
At low velocities, the ocean can be considered incompressible, and the ocean domain can therefore be modeled as a Laplace equation fluid:
Since the ocean surface exhibits small-amplitude wave motion, the free surface condition of seawater is given by
A surface vessel exists within the ocean domain, and its external surface serves as one of the domain boundaries:
The seabed is assumed to be parallel to the horizontal plane, forming another boundary of the domain:
In time-domain analysis, ocean surface motion is treated as a free surface motion, which requires an initial condition:
where t represents time, n is the unit normal vector pointing inward on the wetted surface of the vessel, g denotes gravitational acceleration, is the normal velocity of the vessel, and is the incident velocity potential, which is generated by undisturbed incident waves. is the diffraction velocity potential, which is generated by incident wave diffraction due to the presence of objects in the flow field. is the radiation potential, resulting from the rocking motion of the hull on the free surface.
2.2. Lumped Mass Method
The dynamic response of umbilical cables is calculated using the lumped mass method. As shown in Figure 2, this method discretizes the cable into multiple elements, with each element’s mass and forces distributed equally among its two end nodes. The nodes are connected via massless springs, while axial stiffness, bending stiffness, and material damping parameters of the cable are incorporated through the stiffness and damping properties of these springs.
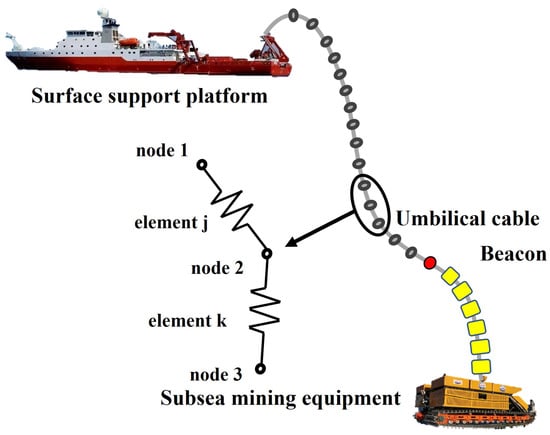
Figure 2.
Diagram of the mining system.
The external loads on a cable element are equivalently converted into nodal forces, and the motion equation for each node is formulated as
where M is the nodal mass matrix, C is the damping coefficient matrix at the node, K is the stiffness matrix—including axial stiffness and bending stiffness (torsional stiffness is neglected in this study), F is the external force acting on the node, X is the displacement vector, is the velocity vector, and is the acceleration vector. By incorporating the boundary conditions, the displacements of the cable’s discrete mass points can be solved, thereby determining the motion of each node.
The hydrodynamic forces acting on the cable are computed using Morison’s equation:
where F is the local action vector per unit length acting normal to the axis of the member; is the vector for the drag action per unit length acting normal to the axis of the member in the plane of the member axis and U; is the vector for the inertia action per unit length acting normal to the axis of the member in the plane of the member axis and ; is the hydrodynamic drag coefficient; is the mass density of water; A is the effective dimension of the cross-sectional area normal to the member axis per unit length ( for circular cylinders); V is the displaced volume of the member per unit length ( for circular cylinders); D is the effective diameter of a member (a circular cylinder), including marine growth; U is a component of the local water particle velocity vector (due to waves and/or current) normal to the axis of the member; is the modulus (the absolute value) of U; is the hydrodynamic inertia coefficient; and is a component of the local water particle acceleration vector normal to the axis of the member.
2.3. Time-Domain Coupled Analysis
Time-domain coupled analysis accounts for the interactions among the surface support vessel, the umbilical cable, and the subsea mining system. It involves solving the system’s equations of motion and dynamic response equations simultaneously. With advancements in ocean engineering technology, research on coupled interactions has become increasingly sophisticated. A standard coupled analysis approach has been established for the surface support vessel and umbilical cable, where the support vessel, umbilical cable, and mining vehicle are analyzed together. At each time step, an iterative method is employed for simultaneous solving, utilizing the generalized implicit integration algorithm embedded in OrcaFlex.
The coupled motion equation of the surface support vessel is given by:
This nonlinear differential equation includes inertia force , damping force , internal structural force , and external force , expressing their coupled interaction with structural displacement and velocity. The inertia force is given by
where M represents the system mass matrix, including the structural mass matrix , the internal fluid mass matrix , and the added mass hydrodynamic matrix associated with the structure’s acceleration.
The damping force is expressed as
where C is the system damping matrix, comprising the specific discrete damping matrix , the internal structural damping matrix , and the hydrodynamic damping matrix , which accounts for diffraction effects. The terms , x, y, z represent the centroidal positions of the structure in the global coordinate system.
During the hydrodynamic analysis, internal structural energy dissipation-induced damping also needs to be considered. The internal structural force is computed instantaneously for each element based on its stress state. The external force includes the gravitational forces of the surface support vessel, umbilical cable, and mining vehicle; the buoyant forces acting on these components; and the forces exerted by the umbilical cable.
3. Methodology
3.1. Gaussian Process Regression
Let be a random process defined over the input space. If for any input set , the corresponding outputs follow a multivariate joint Gaussian distribution, then is called a Gaussian process. A Gaussian process can be expressed as
where and are the mean function and covariance function of and , respectively, defined as
Gaussian Process Regression (GPR) is a probabilistic, non-parametric machine learning method used for regression analysis. GPR is founded on Gaussian processes, which treat functions as random variables and model them through probability distributions defined over function spaces. The derivation of GPR involves combining Gaussian processes with Bayesian inference to obtain predictive distributions for the data. The detailed derivation of GPR in the function space is as follows.
Based on the Bayesian linear regression model, assume a Gaussian process as , where w is a weight function with a prior distribution , , and . The mean and covariance functions of are given as
Thus, for any n inputs , the outputs follow a joint Gaussian distribution:
For observed input values X, the outputs follow
For test set inputs , the outputs follow
The joint Gaussian prior distribution of f and is given as
where
Actual observations include noise , where is the independent Gaussian noise, . Hence, the observations are , with , where I is the identity matrix. The joint Gaussian prior distribution for y and is expressed as
According to Bayes’ theorem, the conditional posterior distribution of is:
where
From Equation (24), the output for test samples can be estimated based on the observed dataset inputs and outputs, as well as the test sample inputs.
In this study, the input parameters are wave height (), wave direction (), current velocity (), current direction (), cable length (L), and the relative position of the vehicle and ship (D). Thus, x and are variables in a 6-dimensional real space. X is the set of input vectors of the initial training set. y is the set of outputs from the initial training set (e.g., top tension and curvature of the umbilical cable and the overturning moment of the mining vehicle). is the input vector of the operating conditions that need to be predicted. is the predicted output value for the target operating conditions. is the variance of the predicted output value for the target operating conditions.
3.2. Training Framework
As shown in Figure 3, the training framework is composed of two parts: PFLM and PSML. PFLM is used to calculate the output, including potential flow theory and the lumped mass method. PSML includes parameter selection and Gaussian Process Regression with active learning. This framework aims to achieve a high-precision surrogate model through iterative optimization. The framework is divided into three parts to introduce: data preparation, training, and iterative optimization.
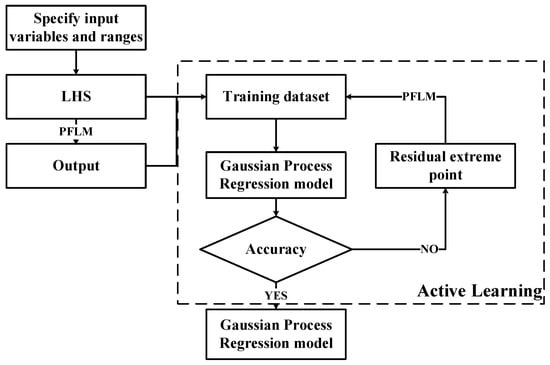
Figure 3.
Training framework.
- Data Preparation: Based on the variables affecting the dynamic response of the umbilical cable, the input parameters are determined as wave height (), wave direction (), current velocity (), current direction (), cable length (L), and the relative position of the vehicle and ship (D). The output parameters are determined as the top tension and curvature of the umbilical cable, longitudinal overturning moment and lateral overturning moment of the mining vehicle. Specify the value ranges for the input parameters and generate all possible operating conditions. Use the Latin hypercube sampling method to select samples from all generated conditions and input them into PFLM to obtain the corresponding output responses, thereby forming the initial training dataset.
- Training: A Gaussian process regression model is built based on the dataset, which uses the spectral mixture kernel function to construct the covariance matrix (the spectral mixture kernel function is defined as follows). The kernel function has six Gaussian spectral components, the Adam optimizer is used as the optimizer, and the maximization of the marginal log-likelihood function is used as the objective function.where is the input difference vector. Here, Q denotes the number of mixture components, and in this study ; P is the input dimension, with . The parameter is the weight of the q-th Gaussian component, is the mean frequency of the q-th component in the p-th input dimension, and is the corresponding variance.
- Iterative Optimization: Randomly select 1000 conditions from all the generated cases, and use the trained Gaussian Process Regression (GPR) model to compute the mean and variance of these 1000 conditions. Extract the residual extreme point and feed the corresponding input parameters back into PFLM to obtain the actual outputs for the point. Add the newly acquired data point to the training dataset and retrain the model. This process continues until the error meets the required accuracy or the number of training samples reaches a specified upper limit. This framework ensures the iterative refinement of the surrogate model, achieving high precision in predicting the dynamic response of the umbilical cable under various operating conditions.
4. Results and Discussion
4.1. Numerical Validation
In the construction of the PFLM-PSML model, the selection of the kernel function is of critical importance. The kernel function not only defines the assumptions regarding the smoothness and correlation of the input space but also directly influences the model’s fitting capability and generalization performance. Different kernel functions are capable of characterizing various types of input–output relationships. Commonly used kernels include the Radial Basis Function (RBF), Matérn kernel, and Spectral Mixture (SM) kernel. To determine the most suitable kernel for this study, the kernel type was treated as a variable, the number of iterations is 300, the number of sample points is 233, and the performance of different kernels is evaluated. As illustrated in Figure 4, the RBF and Matérn kernels exhibit comparatively poorer performance than the Spectral Mixture function. Initially, the losses for the RBF and Matérn kernels are more than 150, while the Spectral Mixture function starts with a loss below 50. After 300 iterations, the loss for the Spectral Mixture function decreases to nearly 1, whereas the losses for the RBF and Matérn kernels remain around 10. Furthermore, when varying the number of mixture components in the Spectral Mixture function, we observe that using 6 components results in the lowest loss after 300 iterations. As shown in Table 1, spectral mixture kernel with components (SM-Q6) achieved the lowest training loss and the most accurate prediction performance. In contrast, the RBF and Matérn kernels required shorter training times but resulted in significantly higher losses. When the number of spectral components was increased to , the training time increased while the loss also became larger. And when the number of spectral components is 3, the loss is higher than SM-Q6. Therefore, the spectral mixture kernel with was selected as the optimal choice, balancing both computational efficiency and predictive accuracy.
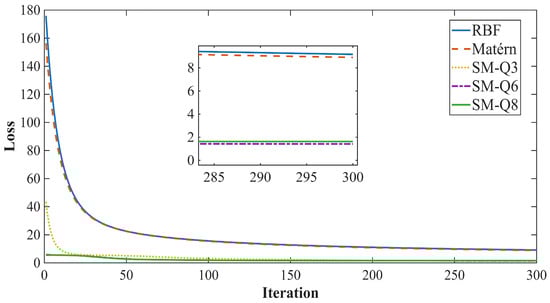
Figure 4.
Loss curves of different kernel functions.

Table 1.
Comparison of training time and loss for different kernel functions.
To verify the accuracy of the proposed PFLM-PSML framework, twenty sets of operating conditions were randomly generated using Python 3.12.4 (Anaconda, MT, USA), and they were input into Orcaflex and the PFLM-PSML model to calculate four output variables, respectively. The four output variables (top tension and curvature of the umbilical cable, lateral overturning moment and longitudinal overturning moment of the mining vehicle) were compared to verify the accuracy of the model. Yan [] employed LSTM to predict the top tension of the umbilical cable, in which the number of datasets was 36,000, the length of the umbilical cable was 237.5 m, and the water depth was 100 m. The total length of the umbilical cable in this paper exceeded 5500 m, the water depth exceeded 5000 m, and the number of training sample points of different PFLM-PSML models is shown in Table 2.
Table 2.
Number of sample points for different PFLM-PSML models.
Figure 5 shows the relationship between the training loss and the number of sample points for the PFLM-PSML model of the top tension of the umbilical cable. It can be seen that as the number of sample points increases, the training loss gradually decreases. When the number of sample points is less than 200, the loss decreases rapidly, and when the number of sample points is more than 200, the loss decreases slowly.
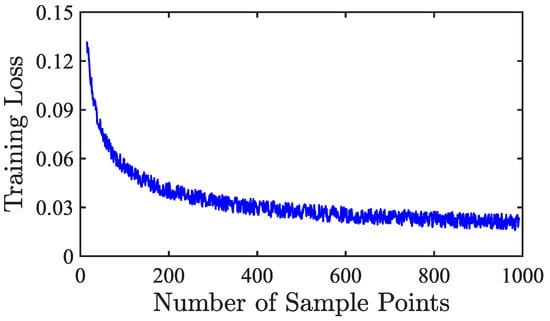
Figure 5.
Training loss vs. number of sample points.
The results calculated by Orcaflex were compared with those obtained using the proposed training framework to verify the feasibility of the method presented in this study. As shown in Figure 6, the maximum error in the top tension of the umbilical cable is less than 2 kN, the maximum errors in the lateral and longitudinal overturning moments of the mining vehicle are both less than 3 kN·m, and the maximum error in the curvature of the umbilical cable is less than 0.25 rad/m. These errors are small, which proves the accuracy of PFLM-PSML.
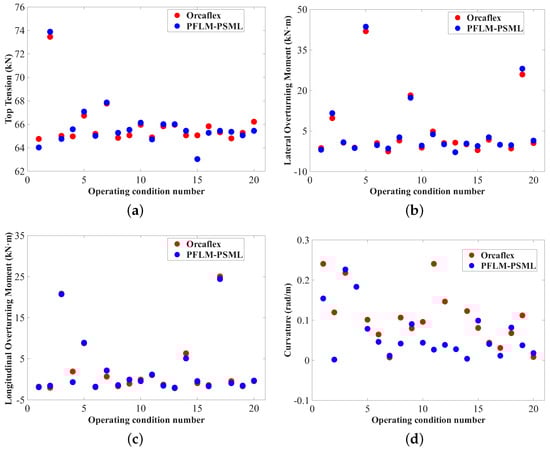
Figure 6.
Comparison of the dynamic response of the umbilical cable under Orcaflex and PFLM-PSML. (a) Top tension, (b) lateral overturning moment, (c) longitudinal overturning moment, (d) curvature.
In terms of computational efficiency, traditional numerical simulation requires approximately 137 s per operating condition, whereas the proposed method requires only 0.3 s for 1000 conditions, as shown in Figure 7. And the time required to perform 5000 groups of cases is doubled, which is also merely 0.6 s, and the simulation time of 20,000 groups of working conditions is approximately 1.7 s. Hence, PFLM-PSML achieves a speed improvement of several orders of magnitude, satisfying the real-time prediction requirement for deep-sea mining operations.
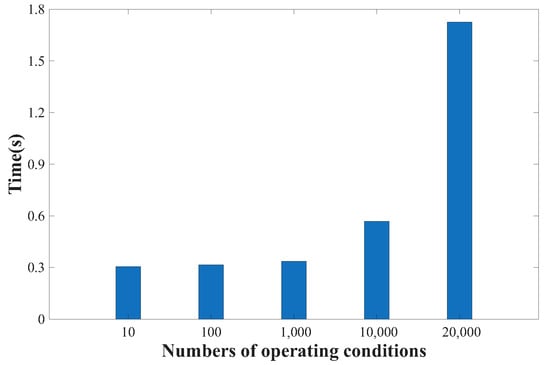
Figure 7.
Performed calculations of PFLM-PSML for multiple operating conditions.
4.2. Sea Trial Validation
In September 2024, a long in situ test mining experiment at a depth of 6000 m in the western Pacific Ocean, costing over CNY ten million was performed. Before the sea trial, a 50-day dock joint debugging test was carried out. The in situ mining system is equipped with dozens of sensors to monitor the marine environment, ship, mining vehicle and umbilical cable.
In Figure 2, a USBL beacon was installed on the umbilical cable to monitor the movement of the umbilical cable at the sensor position. As shown in Figure 8, the starting position is at the bottom left, and the ending position is at the top right. The trajectory of the USBL beacon predicted by the simulation agrees well with the trajectory monitored by the USBL beacon. When the mining vehicle is at (−57.78, −91.89) in the local coordinate system of the mining ship and the wave height is 0.41 m, the distance between the monitored position and the simulation position is the smallest, which is 0.3 m; when the mining vehicle is at (−52.87, −86.22) and the wave height is 0.46 m, the distance between the monitored position and the simulation position is the largest, which is 6.24 m. During the walking process of the mining vehicle on the seabed, the deviation is less than 4 m over the entire range of the umbilical in most cases. Therefore, the reliability and accuracy of the numerical simulation model we built are verified.
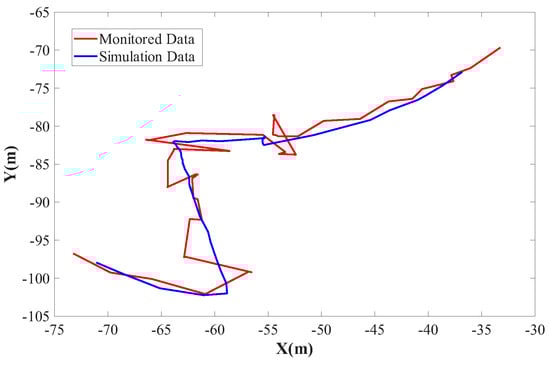
Figure 8.
Comparison of the monitoring position and simulation position of the USBL beacon during sea trial mining operations.
During the 6000 m sea trial, the main sources of error originated from Dynamic Positioning Class 3 (DP3, the ship positioning system), USBL (used for tracking the subsea mining vehicle), ADCP (used for obtaining ocean current profiles), and laser wave radar (LAR, used for measuring wave parameters). The specific measurement accuracies of these instruments are listed in Table 3.
Table 3.
Error sources and accuracy level.
Taking the top tension of the umbilical cable as an example, we discuss the influence of these measurement errors on the results. The actual operating conditions are assumed to be a relative distance of 150 m between the mining vehicle and the vessel, a wave height of 4 m, and a current velocity of 1.5 m/s. The deviations in the results caused by the errors in these three variables are summarized in Table 4. It can be seen that the maximum deviation is approximately 2.6 kN, accounting for about 4% of the total value, indicating that the influence of measurement errors on the results is relatively small.
Table 4.
Effect of errors on top tension.
Figure 9 shows the comparison between the measured data of the top tension of the umbilical cable during sea trial mining operations and the predictions obtained using the PFLM-PSML model. The measured data indicated that during operations, the top tension of the umbilical cable exhibits distinct dynamic fluctuations, with values consistently hovering around 42 kN. This reflects the stochastic and nonlinear characteristics of the cable structure under the influence of waves, currents, and floating body motions in a deep-sea environment. In contrast, the data predicted by the PFLM-PSML model remain relatively stable at approximately 40 kN. The close alignment in the general trends between the measured and predicted data fully demonstrates the effectiveness of the GPR model in capturing the dynamic response of the umbilical cable. Based on Bayesian statistical theory and employing kernel functions to model complex nonlinear systems, the PFLM-PSML approach is capable of achieving precise fitting even when the data contain noise, thereby efficiently predicting the dynamic behavior of the cable. The excellent match between the sea trial results and the model predictions validates the feasibility of the GPR-based prediction method for practical engineering applications.
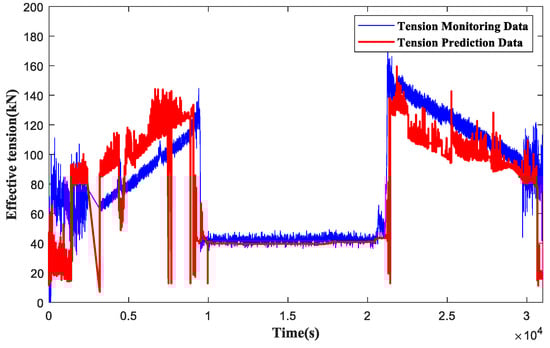
Figure 9.
Comparison of monitored and predicted top tension of the umbilical cable during sea trial mining operations.
In this study, the proposed training method is employed to systematically investigate the effects of wave height, wave direction, current direction, current velocity and water depth on top tension and curvature of the umbilical cable, as well as longitudinal and lateral overturning moments of the mining vehicle. When utilizing the PFLM-PSML model for prediction, significant errors may arise if the input parameters exceed the range covered by the training data. Therefore, the analysis is confined to the parameter ranges specified in Table 5. Additionally, in the subsequent discussions, the water depth is set to 5440 m, the umbilical cable length is set to 5480 m, and the velocity profile configuration is illustrated in Figure 10.
Table 5.
Range of input parameters.
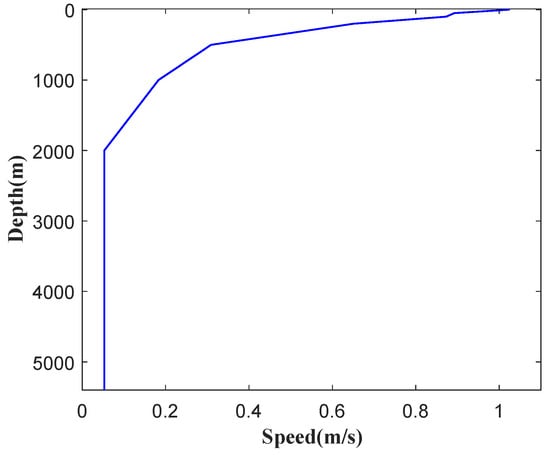
Figure 10.
Velocity profile.
4.3. The Effect of Wave
As shown in Figure 11, wave heights of 1.5 m, 3 m, and 4.5 m are selected for analysis. As wave height increases from 1.5 m to 4.5 m, the top tension and curvature of the cable rise significantly. The lateral overturning moment of the mining vehicle also increases, whereas the longitudinal overturning moment decreases slightly. The increase in wave height intensifies vessel motion and dynamic load transmission through the cable, thereby enhancing both cable tension and the lateral instability of the vehicle.
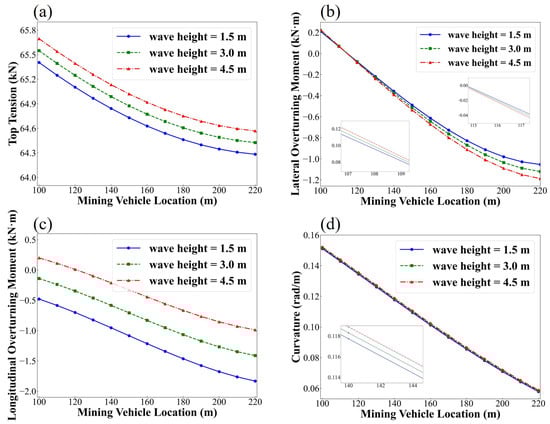
Figure 11.
Predicted dynamic responses of the umbilical cable under different wave heights: (a) top tension; (b) lateral overturning moment; (c) longitudinal overturning moment; (d) curvature.
In Figure 12, the wave direction is also analyzed at intervals of 60°. The results indicate that as the wave direction angle increases, the top tension, curvature of the umbilical cable and overturning moment of the mining vehicle all increase, reaching their maximum at a wave direction angle of 0°. However, it should be pointed out that the umbilical cabe is less sensitive to wave direction.
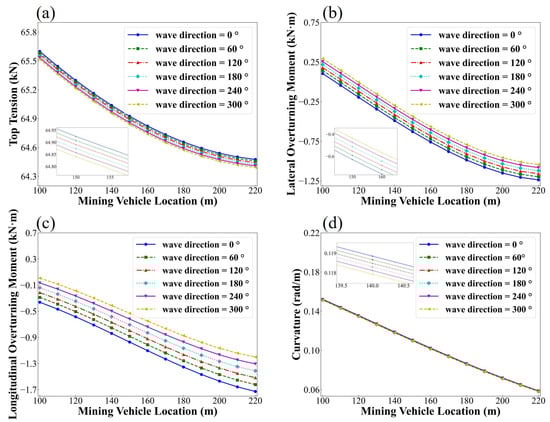
Figure 12.
Predicted dynamic responses of the umbilical cable under different wave directions: (a) top tension; (b) lateral overturning moment; (c) longitudinal overturning moment; (d) curvature.
4.4. The Effect of Current
Figure 13 shows the effects of current direction on the mechanical responses. And current directions of , , , , , and are selected for analysis. The results indicate that no clear pattern is observed in the variation in physical quantities with changing current direction. When the mining vehicle is within 140 m, the top tension of the umbilical cable reaches its maximum at . However, when the mining vehicle distance exceeds 140 m, the top tension is highest at . Additionally, the lateral overturning moment of the mining vehicle is maximized at . The longitudinal overturning moment reaches its maximum at when the mining vehicle is within 168 m. In the range of 168 m to 188 m, the longitudinal overturning moment is highest at , whereas beyond 188 m, it is maximized at . Furthermore, the curvature of the umbilical cable decreases as the current direction increases.
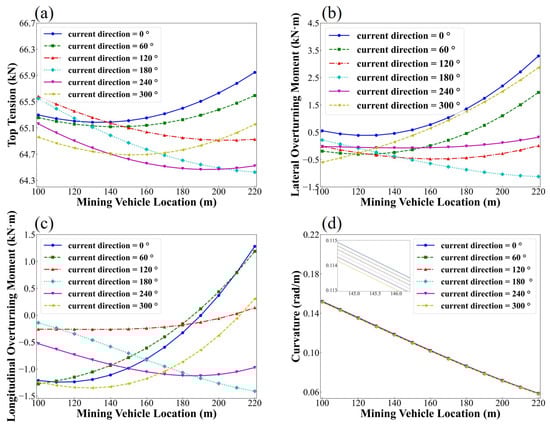
Figure 13.
Predicted dynamic responses of the umbilical cable under different current directions: (a) top tension; (b) lateral overturning moment; (c) longitudinal overturning moment; (d) curvature.
As shown in Figure 14, current velocities of 0.6 m/s, 1.2 m/s, and 1.8 m/s are selected for analysis. The results indicate that when the mining vehicle distance is less than 155 m, the top tension of the umbilical cable reaches its maximum at a current velcocity of 1.8 m/s. Conversely, when the mining vehicle distance exceeds 155 m, the top tension is highest at a current velcocity of 0.6 m/s. Regarding the lateral overturning moment of the mining vehicle, it is maximized at a current velcocity of 1.8 m/s when the mining vehicle distance is less than 180 m, whereas for distances greater than 180 m, the maximum occurs at a current velcocity of 0.6 m/s. Additionally, the longitudinal overturning moment is consistently highest at a current velcocity of 1.8 m/s. Further analysis reveals that as the current velcocity increases, the curvature of the umbilical cable decreases.
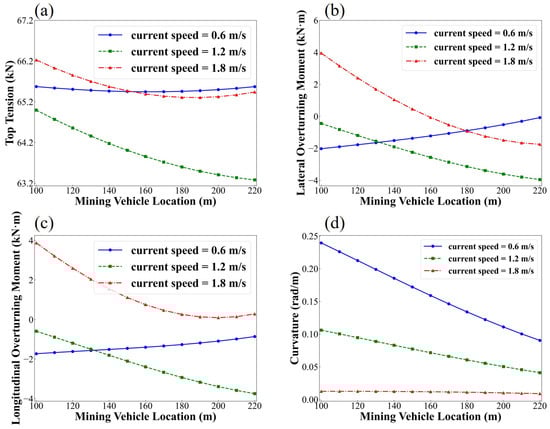
Figure 14.
Predicted dynamic responses of the umbilical cable under different current velocities: (a) top tension; (b) lateral overturning moment; (c) longitudinal overturning moment; (d) curvature.
The top tension of the umbilical cable is primarily influenced by the motion of the upper floating body, as well as by the effects of wave height and direction on the vessel’s motion. In contrast, the impact of current on the top tension is relatively minor. Both the top tension of the umbilical cable and the overturning moment of the mining vehicle are affected by variations in the cable configuration. The configuration itself is influenced by factors such as current velocity, current direction, and the mining vehicle location, leading to a certain degree of randomness. Consequently, irregular patterns may appear under different current directions. As the current velocity increases, the drag force acting on the umbilical cable grows quadratically, leading to a significant rise in axial tension. The increased tension suppresses the lateral deformation of the cable, causing it to become more stretched and aligned with the current direction. Consequently, the curvature of the umbilical cable decreases with increasing current velocity.
4.5. The Effect of Water Depth
The influence of water depth was analyzed for 3330 m and 5440 m, as shown in Figure 15. With increasing depth, the top tension of the umbilical cable and the lateral overturning moment of the mining vehicle increase, while the longitudinal overturning moment of the mining vehicle decreases. As the water depth increases, the difference in the top tension of the umbilical cable is roughly equal to the wet weight of the increased umbilical cable.
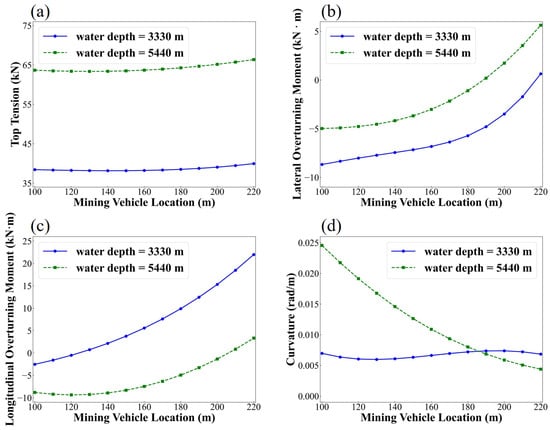
Figure 15.
Predicted dynamic responses of the umbilical cable under different water depths: (a) top tension; (b) lateral overturning moment; (c) longitudinal overturning moment; (d) curvature.
5. Conclusions
The prediction of mechanical characteristics of umbilical cables is significant in the deep-sea mining system. A novel approach (PFLM-PSML) was proposed for the prediction of the mechanical characteristics of the umbilical cable in order to overcome the computing limitation of existing physical approaches under complicated environmental conditions and the absence of uncertainty quantification in the prediction model. The main conclusions are as follows.
The proposed PFLM-PSML model eliminates the need for extensive computational resources, features lower simulation time requirements, and boasts a prediction speed times faster than conventional numerical or empirical prediction methods. Moreover, it provides uncertainty estimation for its predictions, rendering it well-suited for real-time forecasting in practical engineering scenarios.
The reliability and accuracy of the proposed PFLM-PSML framework were comprehensively validated through both numerical simulations and full-scale sea trials, and the error was less than 5%. The results confirmed its robustness and predictive capability under complex marine conditions, indicating its strong potential for practical engineering implementation and further large-scale applications.
The dynamic response of the umbilical cable varies irregularly with current direction and velocity. When the mining vehicle is within 140–155 m, the top tension reaches its maximum at a current direction of and a velocity of 1.8 m/s, while beyond this range, the peak occurs at and 0.6 m/s. The lateral and longitudinal overturning moments are also maximized at 1.8 m/s, and the cable curvature decreases as the current velocity increases.
Although the method significantly reduces computational cost, limited training samples may lead to inaccuracies in some nonlinear conditions. Future research will expand the training dataset and incorporate uncertainty quantification to enhance model generalization.
Author Contributions
Conceptualization, Z.Y., C.H. and Y.S.; methodology, Z.Y., C.H. and Y.S.; software, C.H., L.L. and Y.L.; validation, L.L., L.Y. and Y.L.; formal analysis, S.W., L.L., W.L. and Y.L.; investigation, Z.Y., J.L., Y.S., L.L. and W.L.; resources, C.H., S.W. and J.L.; data curation, W.L. and L.Y.; writing—original draft preparation, Z.Y. and Y.S.; writing—review and editing, Z.Y. and Y.S.; visualization, W.L., L.Y. and Y.L.; supervision, C.H., S.W., J.L. and L.Y.; project administration, C.H., S.W. and J.L.; funding acquisition, S.W. All authors have read and agreed to the published version of the manuscript.
Funding
The authors are deeply grateful for financial support of the National Natural Science Foundation of China (52401348, 52088102), Postdoctoral Fellowship Program of CPSF (GZC20232508), the Fundamental Research Funds for the Central Universities (3009000-842413017), State Key Laboratory of Ocean Engineering (Shanghai Jiao Tong University) (Grant No. GKZD010089), China Postdoctoral Science Foundation (Certificate Number: 2024M753053 ), and the Postdoctoral Innovation Program of Shandong Province (SDCX-ZG-202400212).
Data Availability Statement
The original contributions presented in this study are included in the article. Further inquiries can be directed to the corresponding author.
Conflicts of Interest
Authors Chaojun Huang, Jiancheng Liu, Lei Li and Yuanhe Li were employed by the company China Merchants Marine Equipment Research Institute Co., Ltd. The remaining authors declare that the research was conducted in the absence of any commercial or financial relationships that could be construed as a potential conflict of interest.
References
- Yang, N.; Chen, G.G. Status quo and development trendency of deep sea minerals mining technology. Min. Process. Equip. 2010, 38, 4–9. [Google Scholar]
- Mero, J.L. The Mineral Resources of the Sea; Elsevier: Amsterdam, The Netherlands, 1965. [Google Scholar]
- Van Wijk, J.M. Vertical Hydraulic Transport for Deep Sea Mining: A Study into Flow Assurance. Ph.D. Thesis, Delft University of Technology, Delft, The Netherlands, 2016. [Google Scholar]
- Xiao, Y.X.; Yang, L.B.; Cao, L.; Wang, Z. Distribution of marine mineral resource and advances of deep-sea lifting pump technology. J. Drain. Irrig. Mach. Eng. 2014, 32, 319–326. [Google Scholar]
- Tang, D.S.; Yang, N.; Jin, X. Hydraulic lifting technique with vertical pipe for deep-sea coarse mineral particles. Min. Metall. Eng. 2013, 33, 1–8. [Google Scholar]
- Xiao, L.; Fang, M.; Zhang, W. Advance and present state of the research in oceanic metalliferous nodule mining. Met. Mine 2000, 11–14. [Google Scholar]
- Yang, Z.; Su, Q.; Yan, J.; Wu, S.; Mao, Y.; Lu, Q.; Wang, H. Study on the nonlinear mechanical behaviour of an umbilical under combined loads of tension and torsion. Ocean. Eng. 2021, 238, 109742. [Google Scholar] [CrossRef]
- Garanovic, A. Deep Sea Mining Robot Gets Stuck 4500 Metres Beneath Pacific Ocean’s Surface. 2021. Available online: https://www.offshore-energy.biz/deep-sea-mining-robot-gets-stuck-4500-metres-beneath-pacific-oceans-surface/ (accessed on 17 November 2025).
- Love, A.E.H. A Treatise on the Mathematical Theory of Elasticity; Dover Publications: New York, NY, USA, 1944. [Google Scholar]
- McConnell, K.G.; Zemke, W.P. A model to predict the coupled axial torsion properties of ACSR electrical conductors. Exp. Mech. 1982, 22, 237–244. [Google Scholar] [CrossRef]
- Leroy, J.M.; Estrier, P. Calculation of stresses and slips in helical layers of dynamically bent flexible pipes. Oil Gas Sci. Technol. 2001, 56, 545–554. [Google Scholar] [CrossRef]
- Chakrabarti, S.K.; Cotter, D.C. Motion analysis of articulated tower. J. Waterw. Port Coastal Oceans Div. 1979, 105, 281–292. [Google Scholar] [CrossRef]
- Atalik, T.S.; Utku, S. Stochastic linearization of multi-degree-of-freedom non-linear systems. Earthq. Eng. Struct. Dyn. 1976, 4, 411–420. [Google Scholar] [CrossRef]
- Krolikowski, L.P.; Gay, T.A. An improved linearization technique for frequency domain riser analysis. In Proceedings of the 12th Offshore Technology Conference, Houston, TX, USA, 5–8 May 1980. [Google Scholar]
- Spanos, P.D.; Ghosh, R.; Finn, L.D.; Halkyard, J. Coupled analysis of a spar structure: Monte Carlo and statistical linearization solutions. J. Offshore Mech. Arct. Eng. 2005, 127, 11–16. [Google Scholar] [CrossRef]
- Wu, S.C. The effects of current on dynamic response of offshore platforms. In Proceedings of the Offshore Technology Conference, Houston, TX, USA, 3–6 May 1976. [Google Scholar]
- Hamilton, J. Three-dimensional Fourier analysis of drag force for compliant offshore structures. Appl. Ocean. Res. 1980, 2, 147–153. [Google Scholar] [CrossRef]
- Langley, R. The linearisation of three dimensional drag force in random seas with current. Appl. Ocean. Res. 1984, 6, 126–131. [Google Scholar] [CrossRef]
- Huang, S.; Vassalos, D. A numerical method for predicting snap loading of marine cables. Appl. Ocean. Res. 1993, 15, 235–242. [Google Scholar] [CrossRef]
- Hahn, G.D. A modified Euler method for dynamic analysis. Int. J. Numer. Methods Eng. 1991, 32, 943–955. [Google Scholar] [CrossRef]
- Huse, E.; Kleiven, G.; Niesien, F. Large scale model testing of deep sea risers. In Proceedings of the Offshore Technology Conference (OTC), Houston, TX, USA, 4–7 May 1998. [Google Scholar]
- Chaplin, J.R.; Bearman, P.W.; Huarte, F.; Pattenden, R.J. Laboratory measurements of vortex-induced vibrations of a vertical tension riser in a stepped current. J. Fluids Struct. 2005, 21, 3–24. [Google Scholar] [CrossRef]
- Huarte, F.; Bearman, P.W.; Chaplin, J.R. On the force distribution along the axis of a flexible circular cylinder undergoing multi-mode vortex-induced vibrations. J. Fluids Struct. 2006, 22, 897–903. [Google Scholar] [CrossRef]
- Morse, T.I.; Govardhan, R.N.; Williamson, C.H.K. The effect of end conditions on the vortex-induced vibration of cylinders. J. Fluids Struct. 2008, 24, 1227–1239. [Google Scholar] [CrossRef]
- Vandiver, J.K.; Allen, D.; Li, L. The occurrence of lock-in under highly sheared conditions. J. Fluids Struct. 1996, 10, 555–561. [Google Scholar] [CrossRef]
- Costello, G.A.; Phillips, J.W. Effective modulus of twisted wire cables. J. Eng. Mech. Div. 1976, 102, 171–181. [Google Scholar] [CrossRef]
- Monsalve-Giraldo, J.S.; Cortina, J.P.R.; de Sousa, F.J.M.; Videiro, P.M.; Sagrilo, L.V.S. Hybrid parabolic interpolation-artificial neural network method (HPI-ANNM) for long-term extreme response estimation of steel risers. Appl. Ocean. Res. 2018, 76, 221–234. [Google Scholar] [CrossRef]
- Zhao, Y.L.; Dong, S.; Jiang, F.Y. Reliability analysis of mooring lines for floating structures using ANN-BN inference. J. Eng. Marit. Environ. 2021, 235, 236–254. [Google Scholar] [CrossRef]
- Mao, Y.X.; Wang, T.Q.; Duan, M.L. A DNN-based approach to predict dynamic mooring tensions for semisubmersible platform under a mooring line failure condition. Ocean. Eng. 2022, 266, 112767. [Google Scholar] [CrossRef]
- Sivaprasad, H.; Lekkala, M.R.; Latheef, M.; Seo, J.; Yoo, K.; Jin, C.; Kim, D.K. Fatigue damage prediction of top tensioned riser subjected to vortex-induced vibrations using artificial neural networks. Ocean. Eng. 2023, 268, 113393. [Google Scholar] [CrossRef]
- Guarize, R.; Matos, N.A.F.; Sagrilo, L.V.S.; Lima, E.C.P. Neural networks in the dynamic response analysis of slender marine structures. Appl. Ocean. Res. 2007, 29, 191–198. [Google Scholar] [CrossRef]
- Yang, Y.; Peng, T.; Liao, S.J. Predicting future mooring line tension of floating structure by machine learning. Ocean. Eng. 2023, 269, 113470. [Google Scholar] [CrossRef]
- Yan, J.; Zhang, Y.Y.; Su, Q.; Li, R.; Li, H.; Lu, Z.; Lu, H.; Lu, Q. Time series prediction based on LSTM neural network for top tension response of umbilical cables. Mar. Struct. 2023, 91, 103448. [Google Scholar] [CrossRef]
- Xie, Y.J.; Tang, H.S.; Low, Y.M. Deep gated recurrent unit networks for time-domain long-term fatigue analysis of mooring lines considering wave directionality. Ocean. Eng. 2023, 284, 115244. [Google Scholar] [CrossRef]
- Rasmussen, C.E.; Williams, C.K.I. Gaussian Processes for Machine Learning, 3rd ed.; MIT Press: Cambridge, MA, USA, 2008. [Google Scholar]
- Gao, J.; Ling, H.; Hu, W.; Xing, J. Transfer learning based visual tracking with Gaussian processes regression. In Proceedings of the Computer Vision—ECCV 2014, Part III, Zurich, Switzerland, 6–12 September 2014; pp. 188–203. [Google Scholar]
- Liu, Y.; Pan, Y.; Huang, D.; Wang, Q. Fault prognosis of filamentous sludge bulking using an enhanced multi-output Gaussian processes regression. Control Eng. Pract. 2017, 62, 46–54. [Google Scholar] [CrossRef]
- Verrelst, J.; Rivera, J.P.; Gitelson, A.; Delegido, J.; Moreno, J.; Camps-Valls, G. Spectral band selection for vegetation properties retrieval using Gaussian processes regression. Int. J. Appl. Earth Obs. Geoinf. 2016, 52, 554–567. [Google Scholar] [CrossRef]
- Rezazadeh, N.; De Luca, A.; Perfetto, D.; Salami, M.R.; Lamanna, G. Systematic critical review of structural health monitoring under environmental and operational variability: Approaches for baseline compensation, adaptation, and reference-free techniques. Smart Mater. Struct. 2025, 34, 073001. [Google Scholar] [CrossRef]
Disclaimer/Publisher’s Note: The statements, opinions and data contained in all publications are solely those of the individual author(s) and contributor(s) and not of MDPI and/or the editor(s). MDPI and/or the editor(s) disclaim responsibility for any injury to people or property resulting from any ideas, methods, instructions or products referred to in the content. |
© 2025 by the authors. Licensee MDPI, Basel, Switzerland. This article is an open access article distributed under the terms and conditions of the Creative Commons Attribution (CC BY) license (https://creativecommons.org/licenses/by/4.0/).