Abstract
This research focuses on the experimental investigation of the low-cycle fatigue characteristics of marine structural steel. The study aimed to explore the behavior of marine-grade steel under low-cycle fatigue conditions. The experimental parameters include the fatigue life of the material, crack propagation behavior, and a comprehensive analysis of mechanical properties associated with various loading conditions. Based on the experimental results, a low-cycle fatigue crack propagation rate model for marine structural steel plates was established using CTOD as a characterization parameter. The primary objective of this research is likely to enhance the durability and safety of maritime structures, providing valuable technical insights for the field of naval engineering.
1. Introduction
In recent years, the international shipping market has progressively raised demands for transportation efficiency and cost-effectiveness. The trend towards larger vessels has become significant. However, this increase in ship size has drawn attention to issues related to structural fatigue. It is well-known that fatigue in materials or components can be categorized into high-cycle fatigue and low-cycle fatigue, with low-cycle fatigue being characterized by high stress, significant deformation, and a typical lifespan of fewer than 104 cycles. Large-sized vessels, when navigating in harsh sea conditions, are subjected to extreme loads, causing stress on the ship’s structure to approach the material’s yield strength and, thus, leading to a state of low-cycle fatigue [1]. During the maritime journey, the ship’s structure often experiences cyclic loading such as wave loads, wind loads, and tidal loads, resulting in the continuous accumulation of plastic deformation in local structures. This diminishes the ductility of structural materials, ultimately leading to the accumulation of plastic damage. Research has indicated that, under the influence of larger cyclic loading, the ship’s structural integrity can be compromised, resulting in damage and even fracture due to the combined effects of low-cycle fatigue and accumulative plasticity. This can lead to severe safety incidents [2,3]. Therefore, incorporating the consideration of accumulative plasticity as a crucial factor in the study of low-cycle fatigue issues in ship structures is imperative [4].
The fatigue crack growth life of a structure refers to the duration between the emergence of observable macroscopic cracks and the occurrence of fracture failure. For structures subjected to low-cycle loads, the fatigue crack growth life is typically less than 104 cycles and is accompanied by significant deformations, leading to structural failure within a short period. Therefore, conducting research to study and predict the fatigue crack growth behavior under low-cycle conditions is of great engineering significance. Paris [5], through the analysis of a large volume of experimental data, introduced the Paris equation, which utilizes the stress intensity factor, K, as a fracture parameter applicable to linear elastic fracture mechanics. This model is currently the most widely used fatigue crack growth rate model. However, for low-cycle fatigue crack growth behavior involving plastic deformation, the Paris equation is evidently inadequate. To address this issue, researchers have made improvements and substitutions to fracture parameters based on the Paris equation. Elber [6] proposed an improved fatigue crack growth rate equation using an effective stress intensity factor range, △Keff, to account for crack closure induced by plastic deformation. However, due to its limited applicability to short cracks or small-scale yielding problems, this model may not provide a straightforward and accurate prediction of low-cycle fatigue crack growth rates. Dowling [7] introduced a low-cycle fatigue crack growth rate model using the J-integral range as a substitute for stress intensity factor. However, because the J-integral cannot represent unloading conditions, this model is not suitable for situations involving low-cycle loads with negative stress ratios.
Low-cycle fatigue crack propagation experiments are also a crucial means of studying the behavior of crack growth. Researchers from both domestic and international arenas have conducted low-cycle fatigue crack propagation tests on various materials and structural configurations, with a particular focus on examining the influence of applied loading conditions on low-cycle fatigue crack growth behavior. Liang [8], through experimental investigations, examined the effects of different stress ratios, maximum loads, and overload ratios on the crack propagation rates of AH36 steel specimens containing cracks in flat plates. Their findings revealed that the low-cycle fatigue crack propagation rate significantly decreases with an increase in stress ratio. Under variable amplitude loading, the crack propagation rate after an overload peak is notably higher than that under constant amplitude loading within a short timeframe. Zhang [9] conducted experiments to study the impact of strain amplitude on low-cycle fatigue cracks in standard tension specimens of TP347H steel. The experimental results indicated that the strain amplitude has a substantial effect on the fatigue crack propagation life. As the strain amplitude increases, the crack propagation rate also increases. Furthermore, in multi-crack structures, there are phenomena of coalescence and interference between cracks. The coalescence of cracks leads to the formation of large damaged regions in the structure, significantly reducing low-cycle fatigue life, while crack interference inhibits the growth of one another, thereby extending low-cycle fatigue life. Deng [10] carried out biaxial non-proportional low-cycle fatigue crack propagation tests on Q235 steel cruciform ship plate structures. They investigated the effects of different stress ratios, phase angles, and biaxial ratios on low-cycle fatigue crack propagation rates. The experimental results demonstrated that an increase in phase angle leads to an increase in crack propagation rates, and under the same phase angle, the crack propagation rate also increases with an increase in biaxial stress ratio. Notably, the experiments revealed that, under specific phase angles and biaxial non-proportional low-cycle loading, there is a noticeable accumulative plastic deformation phenomenon at the crack tip. Additionally, there exists a strong correlation between biaxial low-cycle fatigue crack propagation rates and accumulative plasticity.
In the research on low-cycle fatigue, the commonly utilized elastoplastic fracture mechanics parameters include plastic strain amplitude [11,12,13], reverse plastic zone size [14,15], plastic dissipation energy [16,17,18,19], and cyclic J-integral [20,21,22,23]. However, these parameters still exhibit certain limitations when describing low-cycle fatigue crack propagation behavior. The plastic strain amplitude is based on empirical analysis from experimental data and lacks a theoretical foundation, making it incapable of fully characterizing crack propagation mechanisms. Reverse plastic zone size and plastic dissipation energy are established through simulation calculations to establish their relationship with low-cycle fatigue crack propagation rates, but they lack robust theoretical support. The definition of cyclic J-integral is not clearly defined and challenging to calibrate through experiments. It is primarily used in simulation analyses and cannot be applied to unloading conditions, making it less suitable for accurately assessing the effects of cyclic loading. In contrast, the crack tip opening displacement (CTOD) possesses a well-defined physical significance and is capable of effectively characterizing plastic deformation at the crack tip. Therefore, it is more suitable for describing low-cycle fatigue-related issues.
The concept of CTOD was first introduced in 1963 by Wells [24]. Through experiments, Wells observed that, when materials with good fracture toughness, such as low-carbon steel, entered a state of full yielding, there would be a significant plastic zone near the crack tip. The stress within this plastic zone was equal to the material’s yield stress. At this stage, stress and its derivative forms (e.g., stress intensity factors) could no longer serve as suitable parameters to characterize fracture toughness. Additionally, experimental observations indicated that, for materials with good toughness, there was a noticeable opening phenomenon between the upper and lower surfaces near the crack tip before fracture occurred. Based on these observations, Wells postulated the existence of a critical strain or strain-related parameter as a threshold value at the crack tip. When the strain at the crack tip reached this threshold value, crack propagation would initiate. This strain-related parameter became known as CTOD. Subsequently, many researchers conducted in-depth studies on CTOD, which can be broadly categorized into theoretical analysis and numerical simulation.
In the realm of CTOD theoretical models, Dugdale [25] introduced a classic model for CTOD calculation, focusing on an infinite thin plate subjected to uniaxial tensile loading. This model simplified the complex problem of crack propagation into an overlay of several linear elastic problems, allowing for a direct CTOD calculation based on external loading conditions. However, due to the idealized assumptions upon which this model is derived, it is limited to ideal elastic–plastic materials and small-scale yielding scenarios. Recognizing the limitations of the Dugdale model for CTOD calculation, some researchers have established functional relationships between CTOD and J-integral based on the Dugdale model. Diego [26], relying on simulation analysis of crack propagation in single-edge notched tension specimens, developed a CTOD-J integral model applicable to situations involving large-scale yielding. Duan [27] combined finite element analysis and experimental research to create a CTOD-J integral model suitable for single-edge notched tension specimens. This model calculates CTOD by considering the ratio of J-integral to plastic constraint factor and accounts for factors such as crack length, specimen size, and material properties that influence the plastic constraint factor. Shikalgar [28], through a three-dimensional finite element analysis of small punched-hole specimens with pre-cracks, proposed two functional relationships for the plastic constraint factor in the CTOD-J integral model. Their study demonstrated that functions correlated with the material hardening exponent, specimen shape factor, applied load displacement, and the ratio of crack length can lead to more precise calculations of the plastic constraint factor and, consequently, accurate CTOD estimation. However, these functions are specific to the test specimens used in their research.
In the realm of CTOD finite element analysis, Chen [29] employed the XFEM to establish a CTOD calculation model for cyclic tension–compression loading, specifically considering the effects of compression loading. They analyzed the influence of factors such as plate width, crack length, stress levels, and material properties (yield strength, elastic modulus, and material hardening effects). This model is suitable for calculating CTOD for finite-width plates of different materials under cyclic tension–compression loading conditions. Werner [30], using XFEM, conducted an analysis to investigate the variations in CTOD and crack propagation rates for flat high-strength-steel specimens containing central cracks under different maximum tensile loading conditions. When compared with the results from cyclic tension testing on center-cracked specimens and equal amplitude loading, XFEM was found to accurately represent the variations in CTOD and crack propagation rates at different stages of crack growth.
In summary, concerning CTOD theoretical models, the relationship model between CTOD and J-integral provides a reasonably accurate means to compute CTOD. However, the direct application of this model is still subject to constraints related to plastic constraint factors. CTOD and J-integral can serve as elastoplastic fracture parameters to describe low-cycle fatigue crack propagation behavior, but further research is needed to fully understand the accumulative plasticity effects under cyclic loading conditions. This paper focuses on conducting low-cycle fatigue crack propagation experiments using marine structural steel plates as the research subject. Marine structural steel plates were specifically designed to withstand harsh marine environments, including exposure to saltwater, corrosive elements, and dynamic loading conditions. These steels exhibit enhanced mechanical properties compared to conventional structural steels to ensure the structural integrity and safety of marine structures. The study aimed to establish a crack propagation-rate model characterized by CTOD as a fracture parameter. Firstly, mechanical property tests were carried out on marine steel materials to obtain relevant mechanical parameters. Secondly, low-cycle fatigue crack propagation experiments were designed and conducted under different load ratios and maximum loads according to relevant standards. Data including crack lengths, corresponding cycle numbers, CTOD, etc., were collected, and the impact of different loading conditions on low-cycle fatigue crack propagation behavior was analyzed. Finally, based on the experimental results, a low-cycle fatigue crack propagation rate model for marine structural steel plates was established using CTOD as a characterization parameter.
2. Experimental Investigation of Mechanical Properties of Marine Structural Steel
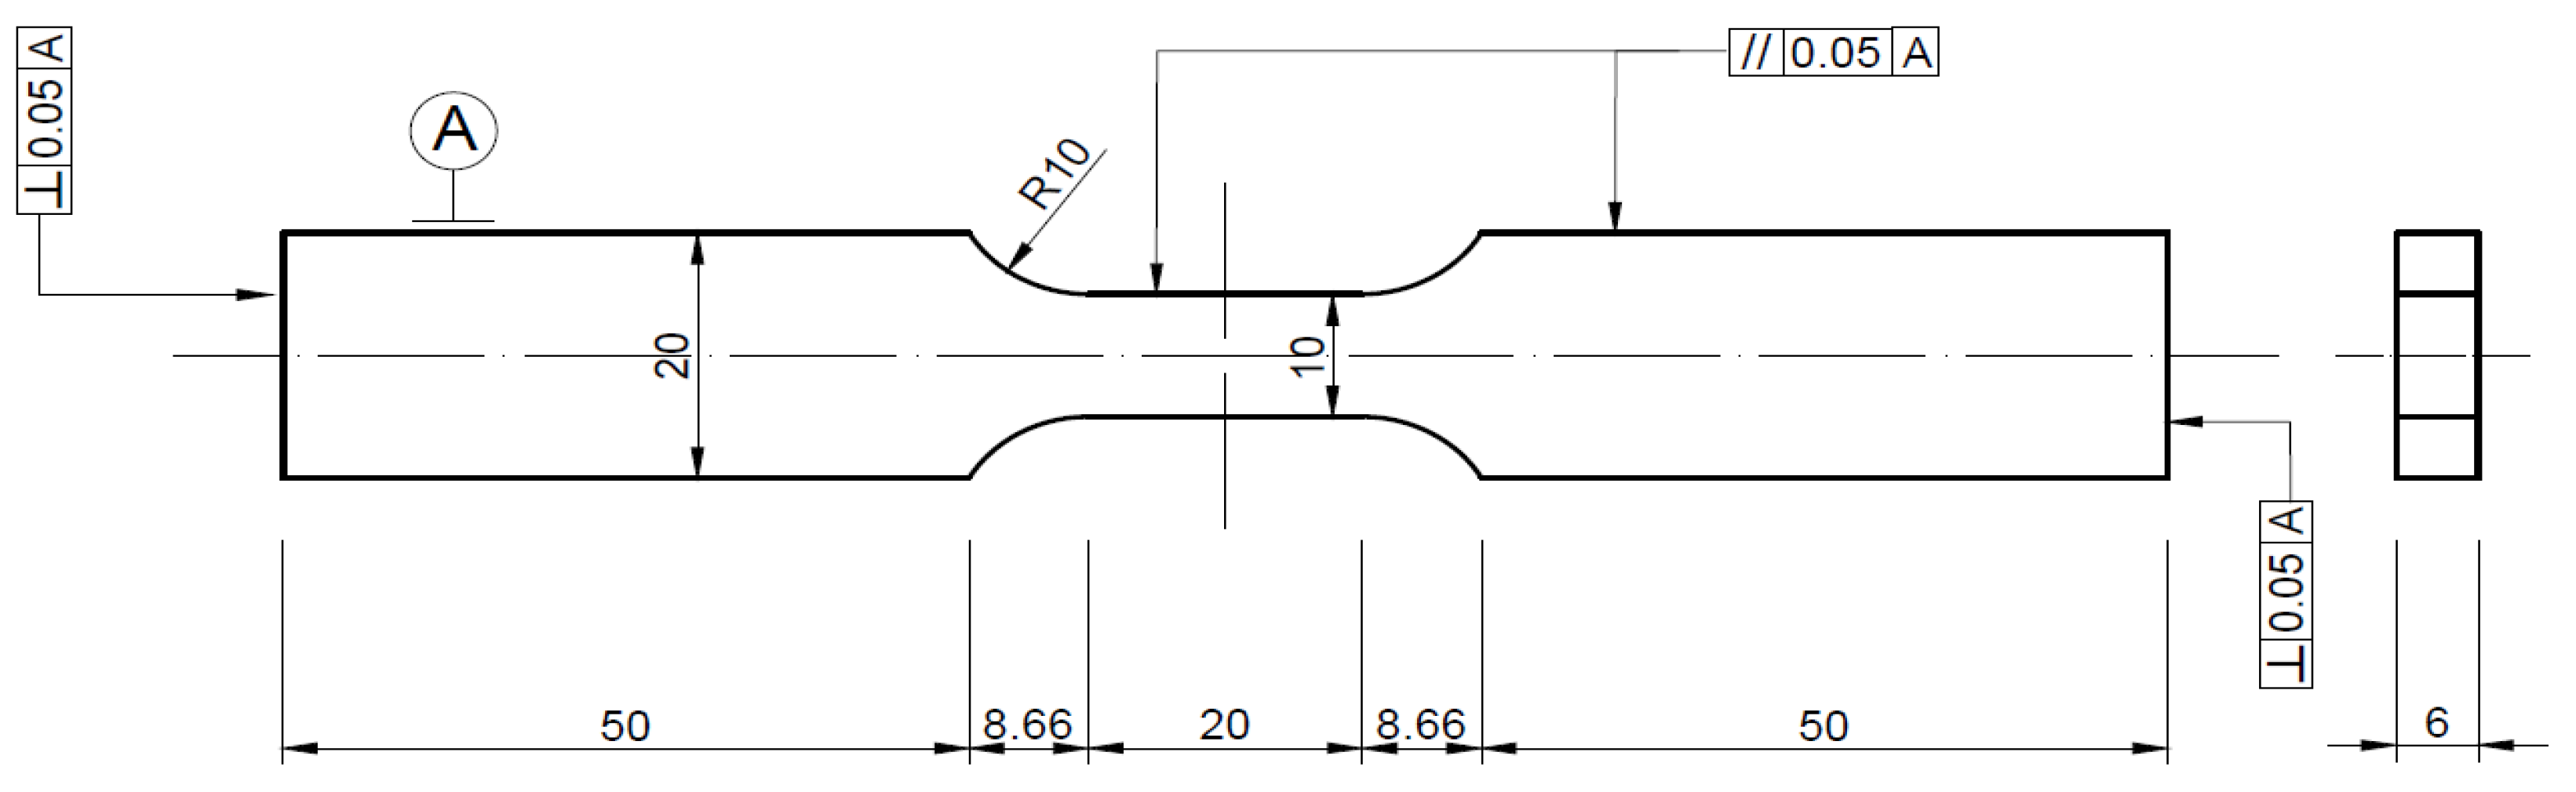
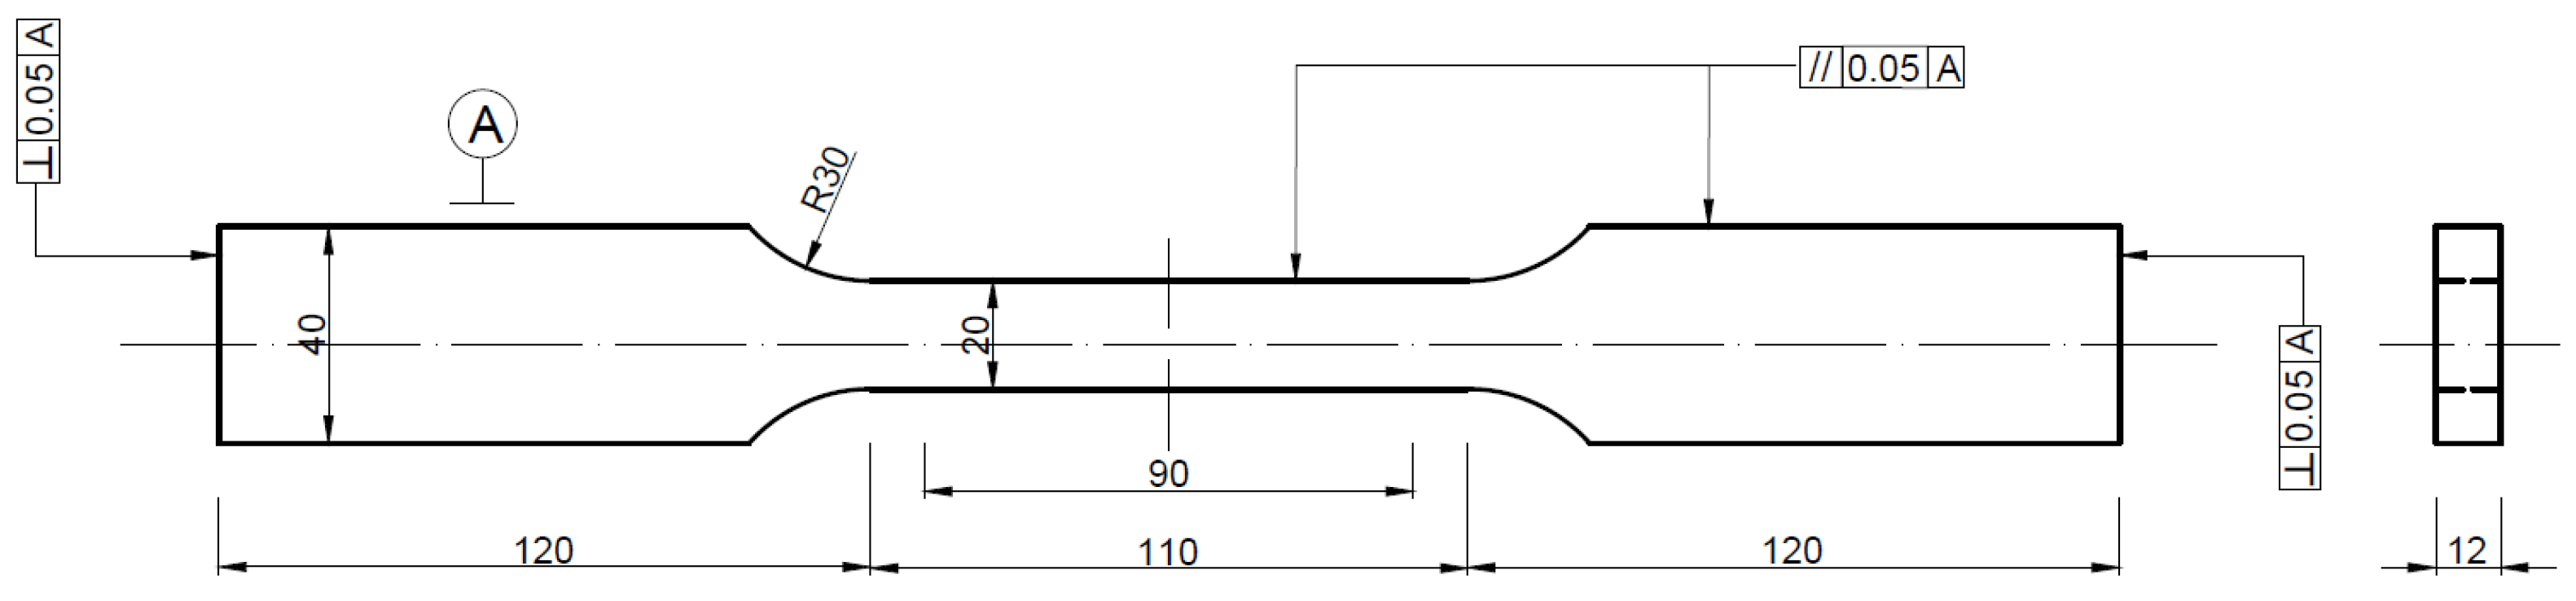
Due to the undisclosed material mechanical properties of the marine steel plates used in the experimental research of this paper, the prediction of low-cycle fatigue life for cracked ship hull plates becomes challenging. Consequently, in accordance with GB/T 228.1-2021 “Metal Materials Tensile Testing Part 1: Room Temperature Test Methods” [31] and GB/T 15248-2008 “Metal Materials Axial and Fully Reversed Low-Cycle Fatigue Testing Method” [32], standard tensile and cyclic loading tests were conducted on the marine steel materials employed in the study to obtain their fundamental mechanical properties. The chemical composition of the marine steel is presented in Table 1.
Table 1.
Chemical composition of the marine structural steel (wt%).
2.1. Test Specimen
The standard tensile test employed rectangular cross-sectional ratio specimens with a proportionality factor of 5.65. The thickness was 12 mm, and the width of the parallel section was 20 mm. The theoretical original gauge length was 87.53 mm, while the actual gauge length was 90 mm. The length of the parallel section was 110 mm, and the total length of the specimen was 350 mm. The specific geometric dimensions are illustrated in Figure 1. The markings in Figure 1 follow the specified guidelines set forth by the Chinese national standard.
Figure 1.
Standard tensile test specimen.
For the cyclic tensile–compression test, rectangular cross-sectional ratio specimens were selected with the same thickness as the standard tensile test specimens. The width of the parallel section for these specimens was 10 mm, and the total length of the specimen was 137.3 mm. While the cyclic tensile–compression test specimen shares a similar shape with the standard tensile test specimen, precautions were taken to prevent local buckling deformation during the compression test. Therefore, the length of the parallel section for the cyclic compression test specimen was reduced to 20 mm. The specific geometric dimensions are depicted in Figure 2.
Figure 2.
Cyclic tensile–compression test specimen.
2.2. Test Loading
The experimental loading system utilized the MTS 322 fatigue testing machine with displacement-controlled loading. The standard tensile test was conducted at a loading speed of 10 mm/min, adhering to the specifications outlined in GB/T 228.1-2021, until specimen failure. The specimen is fixed by a self-centering design wedge fixture to ensure uniform axial loading of the sample. During loading, axial force data are collected in real time by a force sensor located at the actuator head end. The parallel segment displacement for monotonic and cyclic tests is recorded using a 25 mm gauge-length extensometer (MTS 634.12F-24). The extensometer’s strain measurement range is +50%/−10%, meeting the strain measurement capability requirements of the test. To minimize dimensional uncertainties caused by manufacturing processes, before assembling the specimen, the original dimensions of the specimen were measured three times at different positions, using a caliper, and the average values were recorded, including actual gauge length, plate thickness, parallel specimen length, and other dimension parameters. After starting the assembly of the specimen, one end of the specimen was clamped first by the lower fixture. We controlled the upper fixture to move to the appropriate position at the other end of the specimen, ensuring that the specimen is vertically aligned, and then fixed the specimen completely through the fixture. After completing the test assembly, we applied a small preload to the specimen to eliminate some initial geometric deformation, ensuring the correct assembly and normal operation of the test equipment. After unloading, we zeroed the displacement data acquisition system and started the formal loading process.
For each condition, three sets of parallel tests were conducted to mitigate the accidental variability in test data. For cyclic tensile–compression testing, the displacement loading was determined based on the length of the specimen’s parallel section to ensure a strain amplitude of 1.0 εys, and the test was conducted for 10 cycles. During the testing process, strain measurements were acquired using extensometers on the central parallel section of the specimen. The material’s relevant mechanical parameters were calculated by combining real-time strain measurements from the extensometer with load data recorded by the fatigue testing machine.
2.3. Test Result
The mechanical performance parameters of the marine structural steel obtained through standard tensile testing and cyclic tensile–compression testing are presented in Table 2.
Table 2.
Mechanical parameters of marine structural steel.
The cyclic yield stress, σys, obtained from mechanical performance tests can serve as a reference for estimating the plastic zone size at the crack tip in conditions designed for compact tension low-cycle fatigue crack propagation experiments. Marine structural steel might exhibit higher fracture toughness, making it more resistant to crack propagation. On the other hand, higher ductility could enhance the ability of the steel to deform before fracture, impacting the CTOD values. Poisson’s ratio is typically determined indirectly by measuring the change in dimensions of the specimen during loading. This is achieved by recording the axial strain (elongation) and lateral strain (contraction) of the specimen using strain gauges or extensometer. Poisson’s ratio (n) is then calculated as the negative ratio of lateral strain to axial strain. Material parameters such as the elastic modulus, E; Poisson’s ratio, n; cyclic hardening exponent, nys; and cyclic hardening coefficient, kys, can be employed in the computation of accumulative plasticity for consideration in the calculation of CTOD. These parameters serve as references for setting the loads in subsequent crack propagation tests.
3. The Low-Cycle Fatigue Crack Propagation Experiment
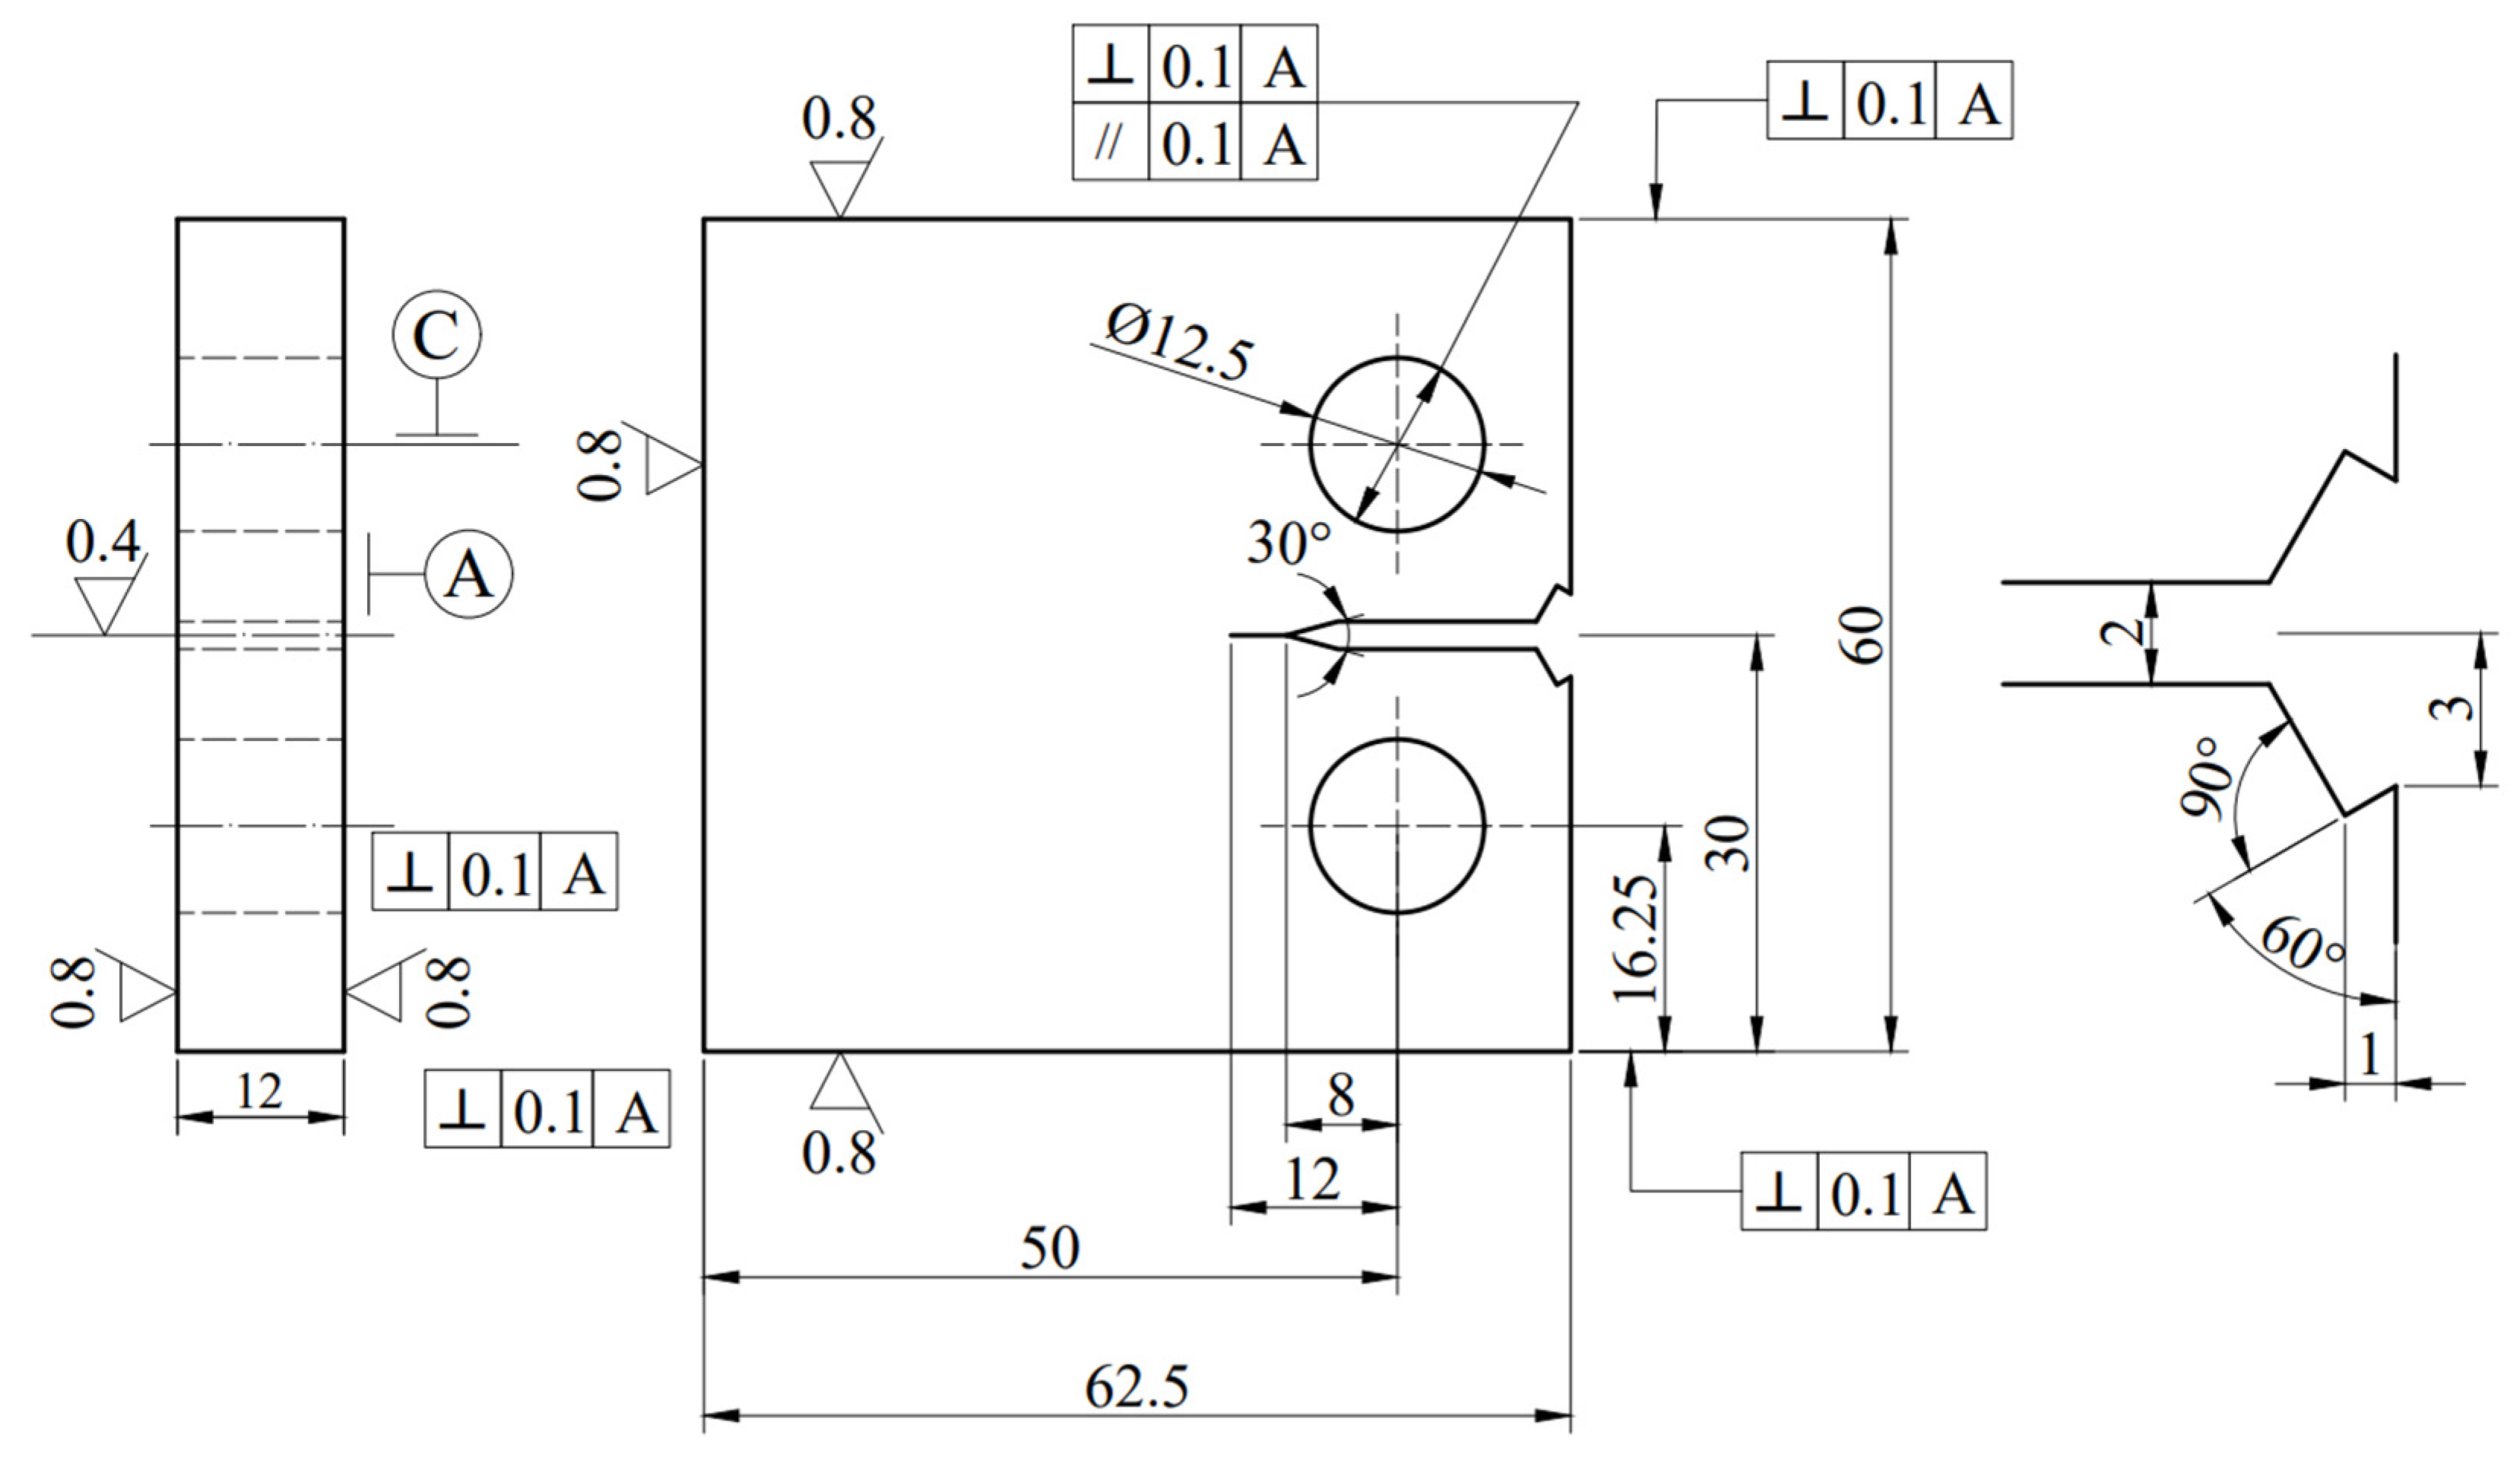
3.1. Test Specimen
In order to investigate the low-cycle fatigue crack propagation behavior of ship hull plates under cyclic loading, the study conducted low-cycle fatigue crack propagation experiments. Experimental studies have demonstrated that compact tension (CT) specimens are ideal for exploring crack propagation behavior [33]. Therefore, in this study, CT specimens are selected for experimentation.
The specimen dimensions are designed according to GB/T 21143-2014 “Unified Test Method for Quasi-static Fracture Toughness of Metallic Materials” [34], with width 50 mm, thickness 12 mm, and pre-crack length of 4 mm. A pre-existing crack is machined at the front end of the specimen opening. The specific geometric dimensions of the specimen are illustrated in Figure 3, and the physical appearance of the CT specimen during the experiment is depicted in Figure 4. To ensure the similarity of material properties among all specimens, they are sourced from the same steel plate, with sampling performed in the L-T direction, i.e., the direction of steel plate rolling. In accordance with GB/T 6398-2017 “Test Method for Fatigue Crack Growth Rates of Metallic Materials” [35], all specimens undergo cutting, grinding, polishing, and other processes to meet roughness and surface tolerance requirements, facilitating experimental pre-processing and observation.
Figure 3.
Geometric dimensions of CT specimen.
Figure 4.
Physical illustration of CT specimen.
3.2. Test Loading
In order to investigate the influence of applied load on the low-cycle fatigue crack propagation behavior of ship steel plates, crack propagation tests are conducted under different maximum loads and load ratios. During the design of loading conditions, the plastic zone size at the crack tip is calculated using Equation (1) [36].
where K is the stress intensity factor. The calculation formula is as follows:
where is the applied load; is the crack length; W = 50 mm is the effective width of CT specimen; is the correction coefficient of the shape factor, . For the CT specimen, the calculation formula is as follows:
According to the correction coefficient of shape factor, , it can be determined that, when the applied maximum load, , is applied, the plastic zone at the crack tip is of the same order of magnitude as the crack length, indicating a significant yielding state in the crack tip region. Therefore, considering the loading conditions of the MTS fatigue testing machine and the geometric constraints of the CT specimen, specific loading conditions are designed as shown in Table 3, where the load ratio, R, is defined as the ratio of the maximum load to the minimum load. The crack-tip plastic zone ratio represents the ratio of the plastic zone size at the crack tip to the pre-existing crack length, indicating that the specimen’s crack tip is in a significantly yielding state.
Table 3.
The loading conditions for CT specimen.
The experimental loading equipment utilizes the MTS 322 electro-hydraulic servo fatigue testing machine, with loading control and data acquisition performed through the Test Star control system. The experiment involves cyclic loading, employing sinusoidal waveforms throughout the loading process at a frequency of 1 Hz. At the control console of the fatigue testing machine, parameters such as mean stress, stress range, loading frequency, maximum loading cycles, etc., corresponding to the experimental loading conditions, are set. To ensure experimental safety, loading is halted just before complete specimen fracture, and the final loading cycle count is recorded as the low-cycle fatigue life of the specimen.
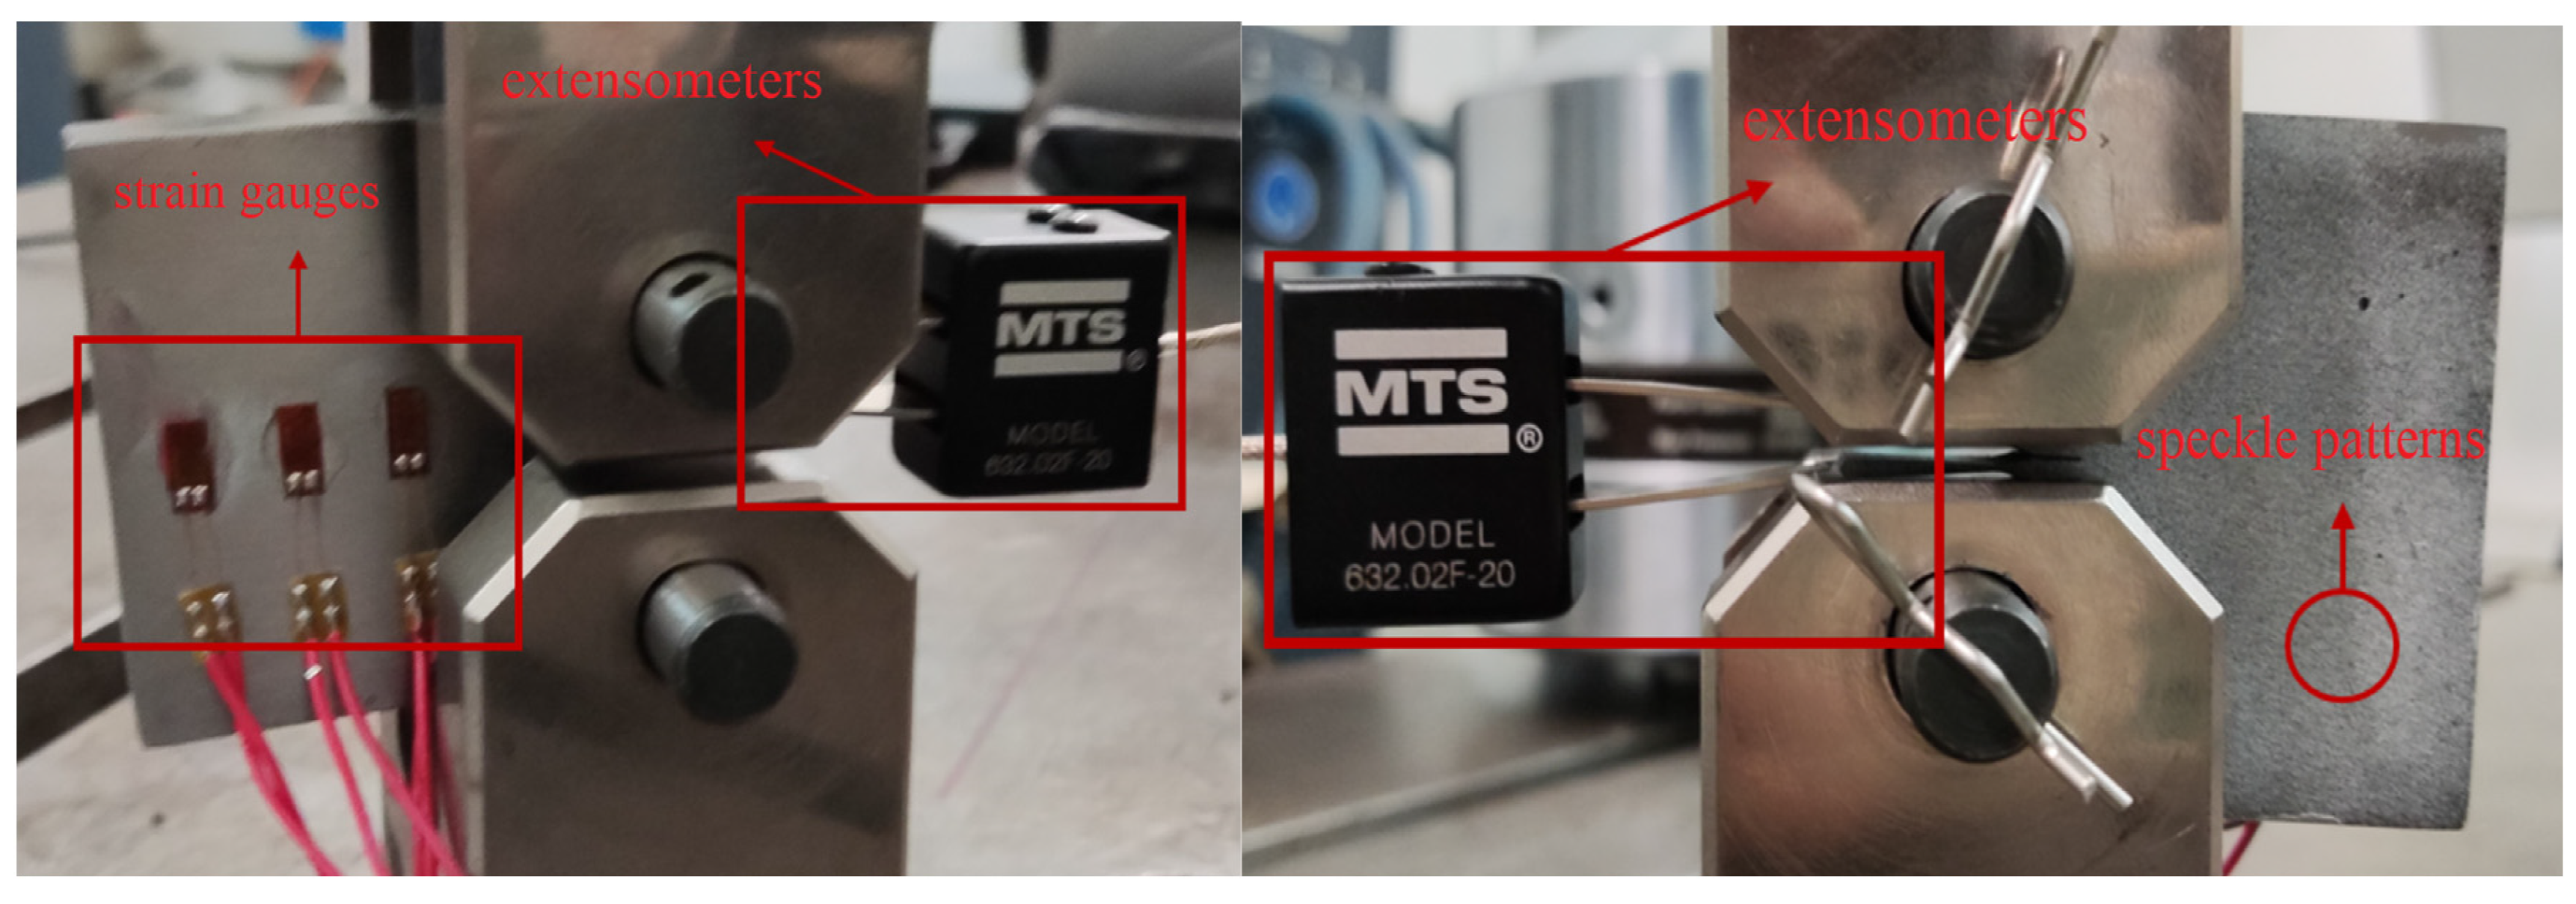
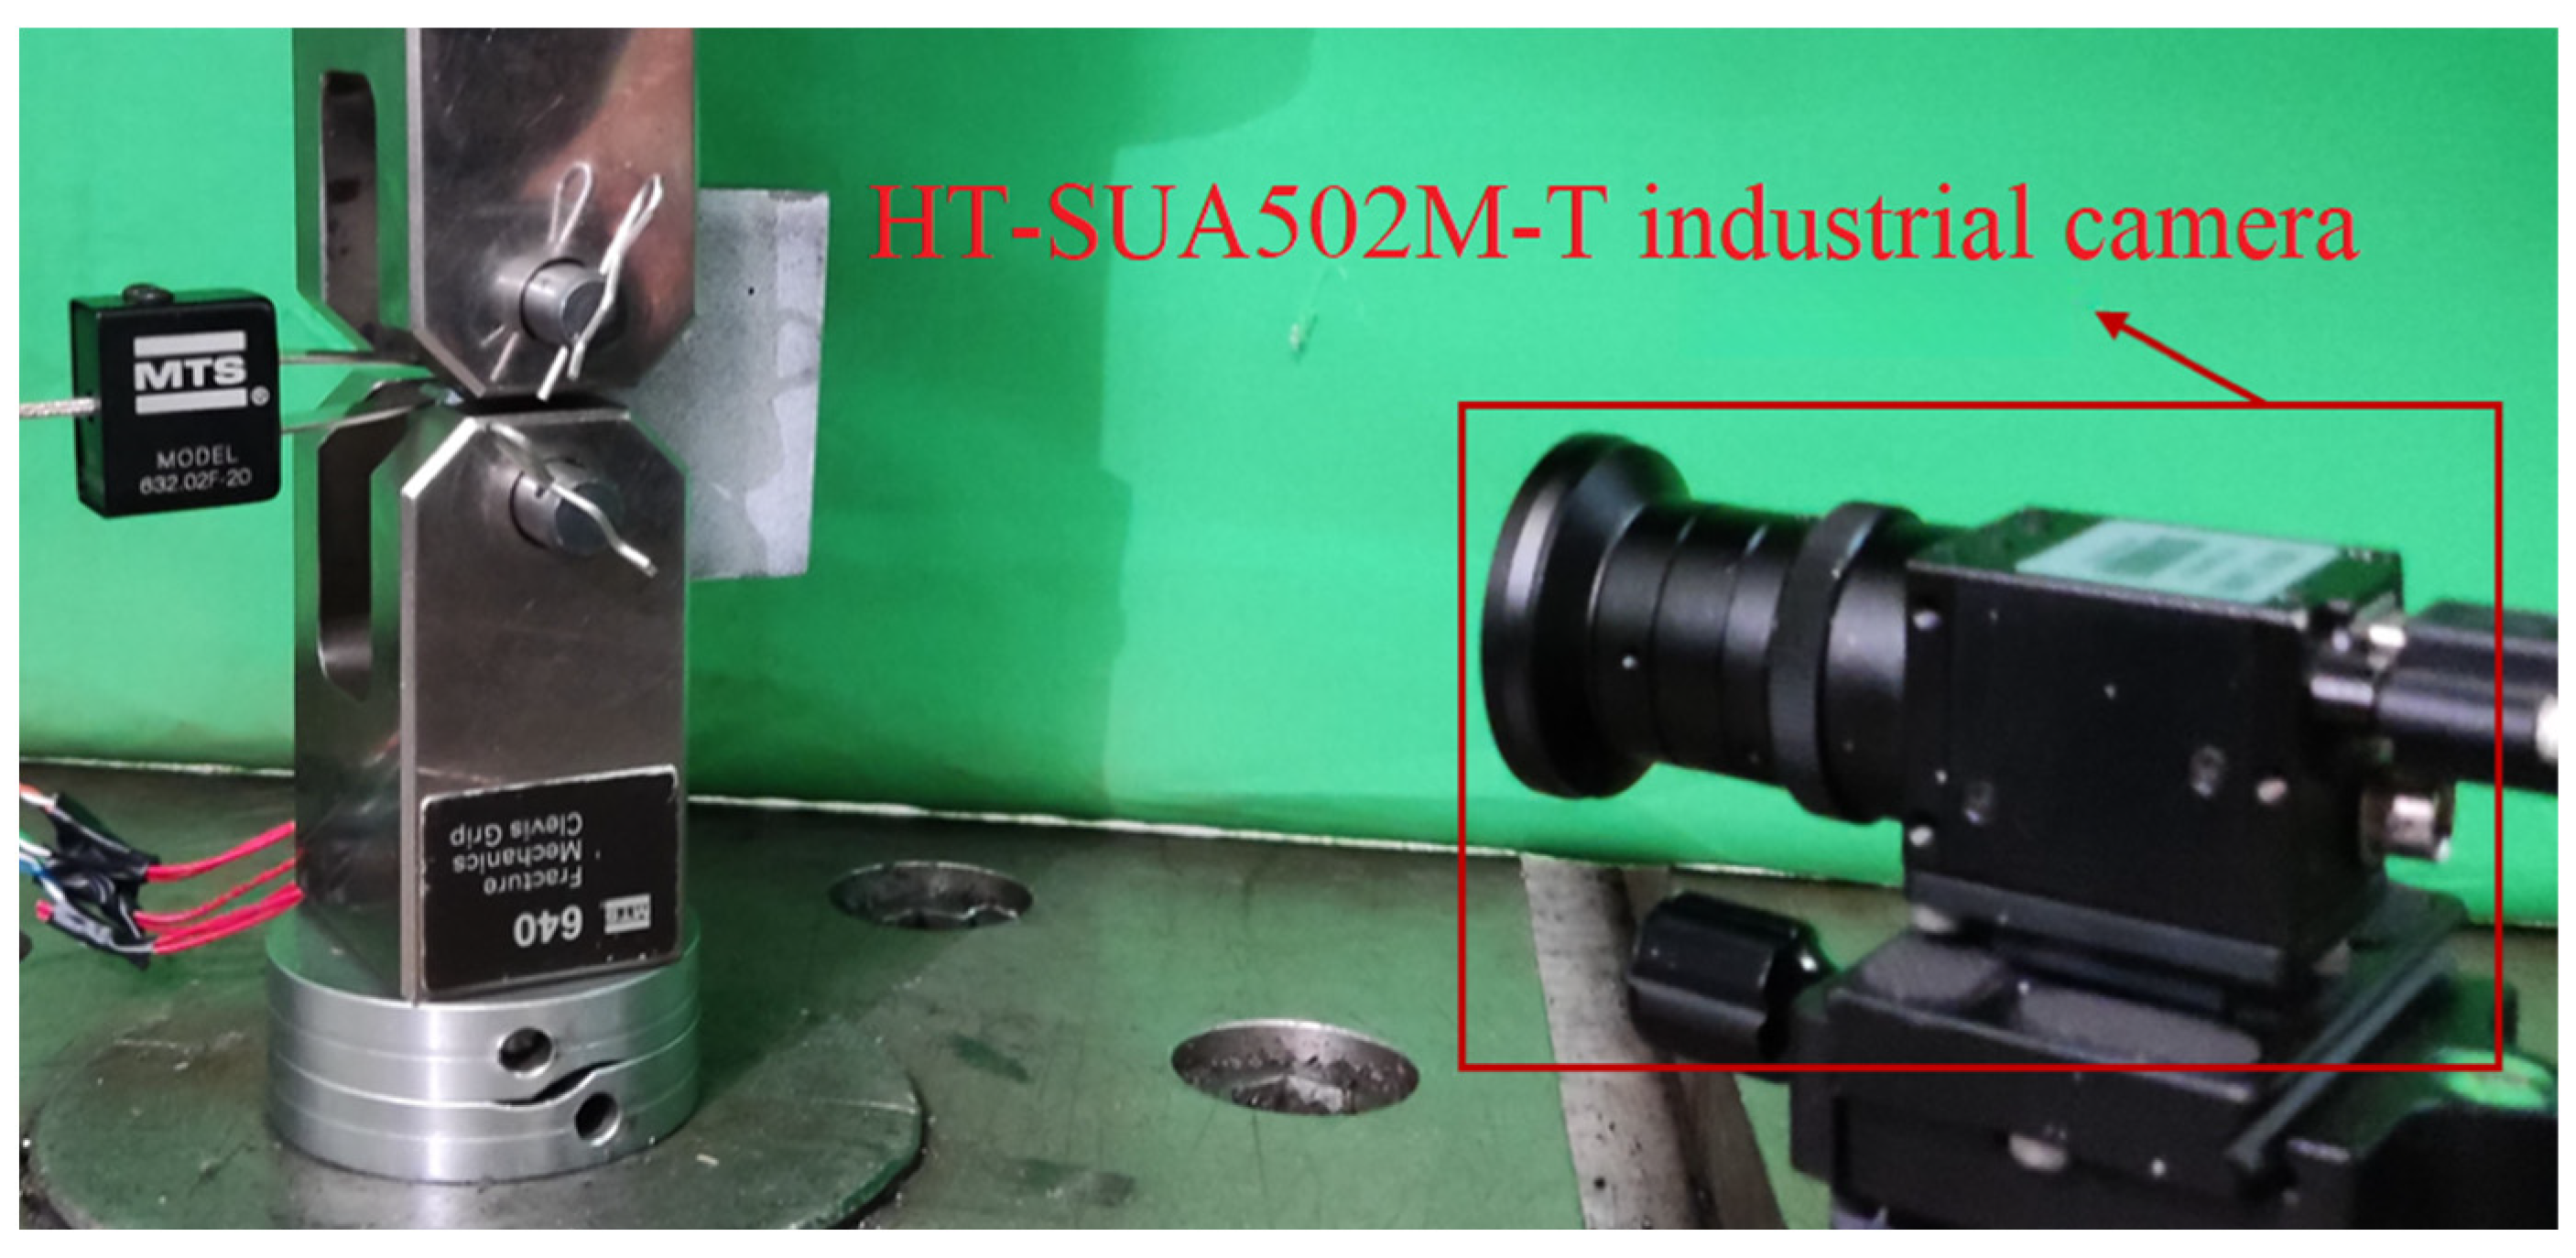
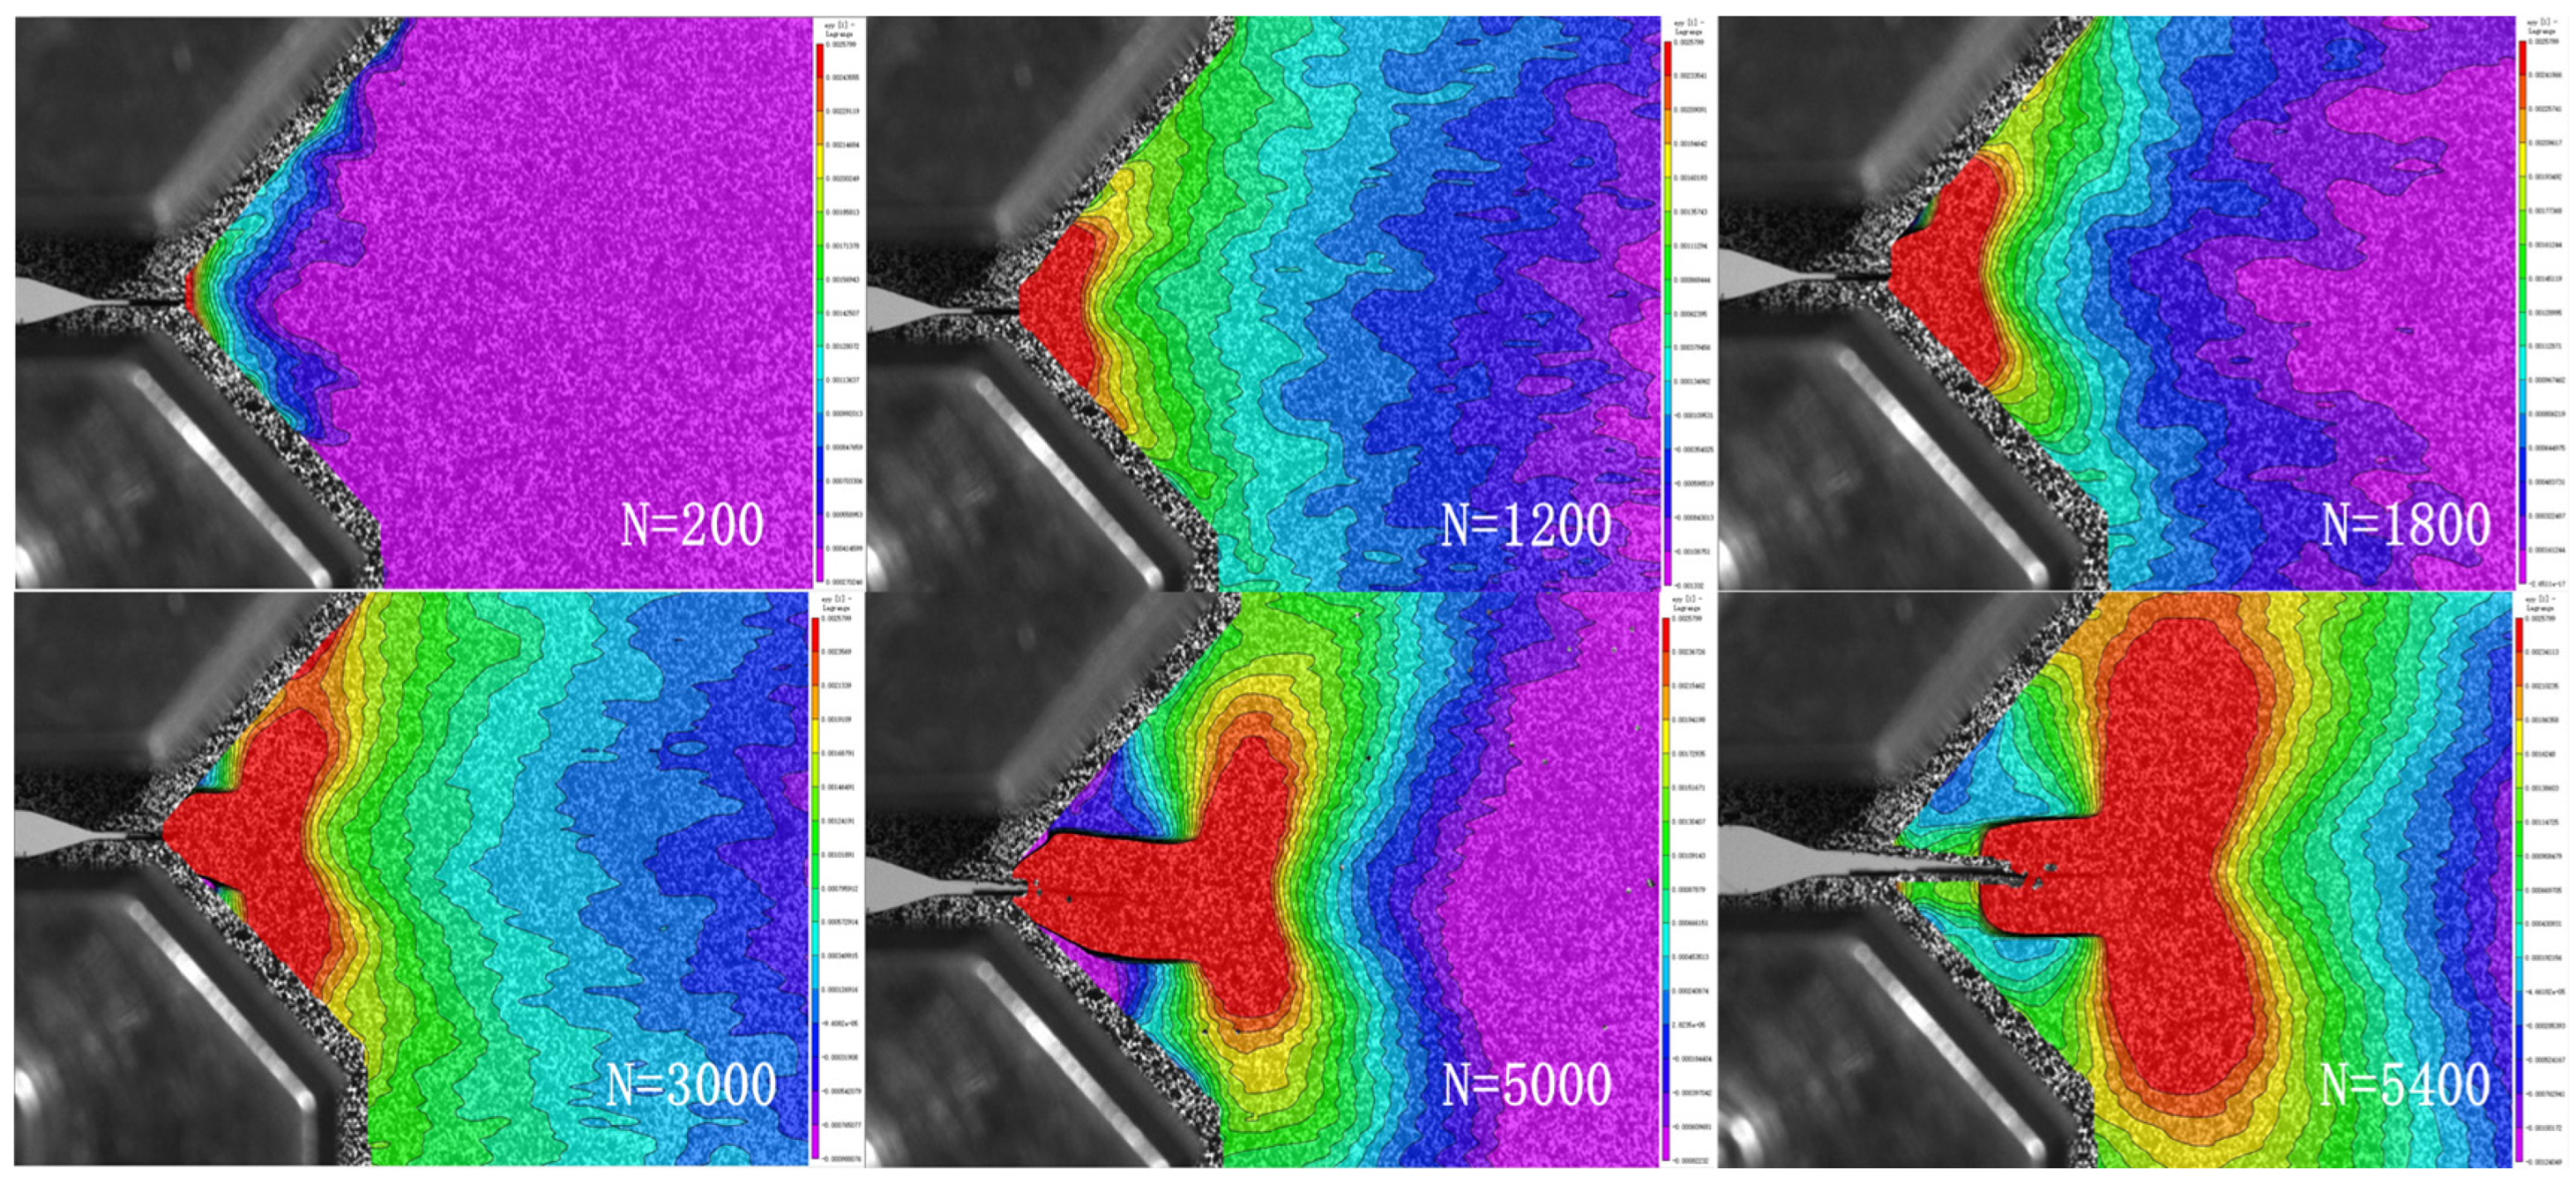
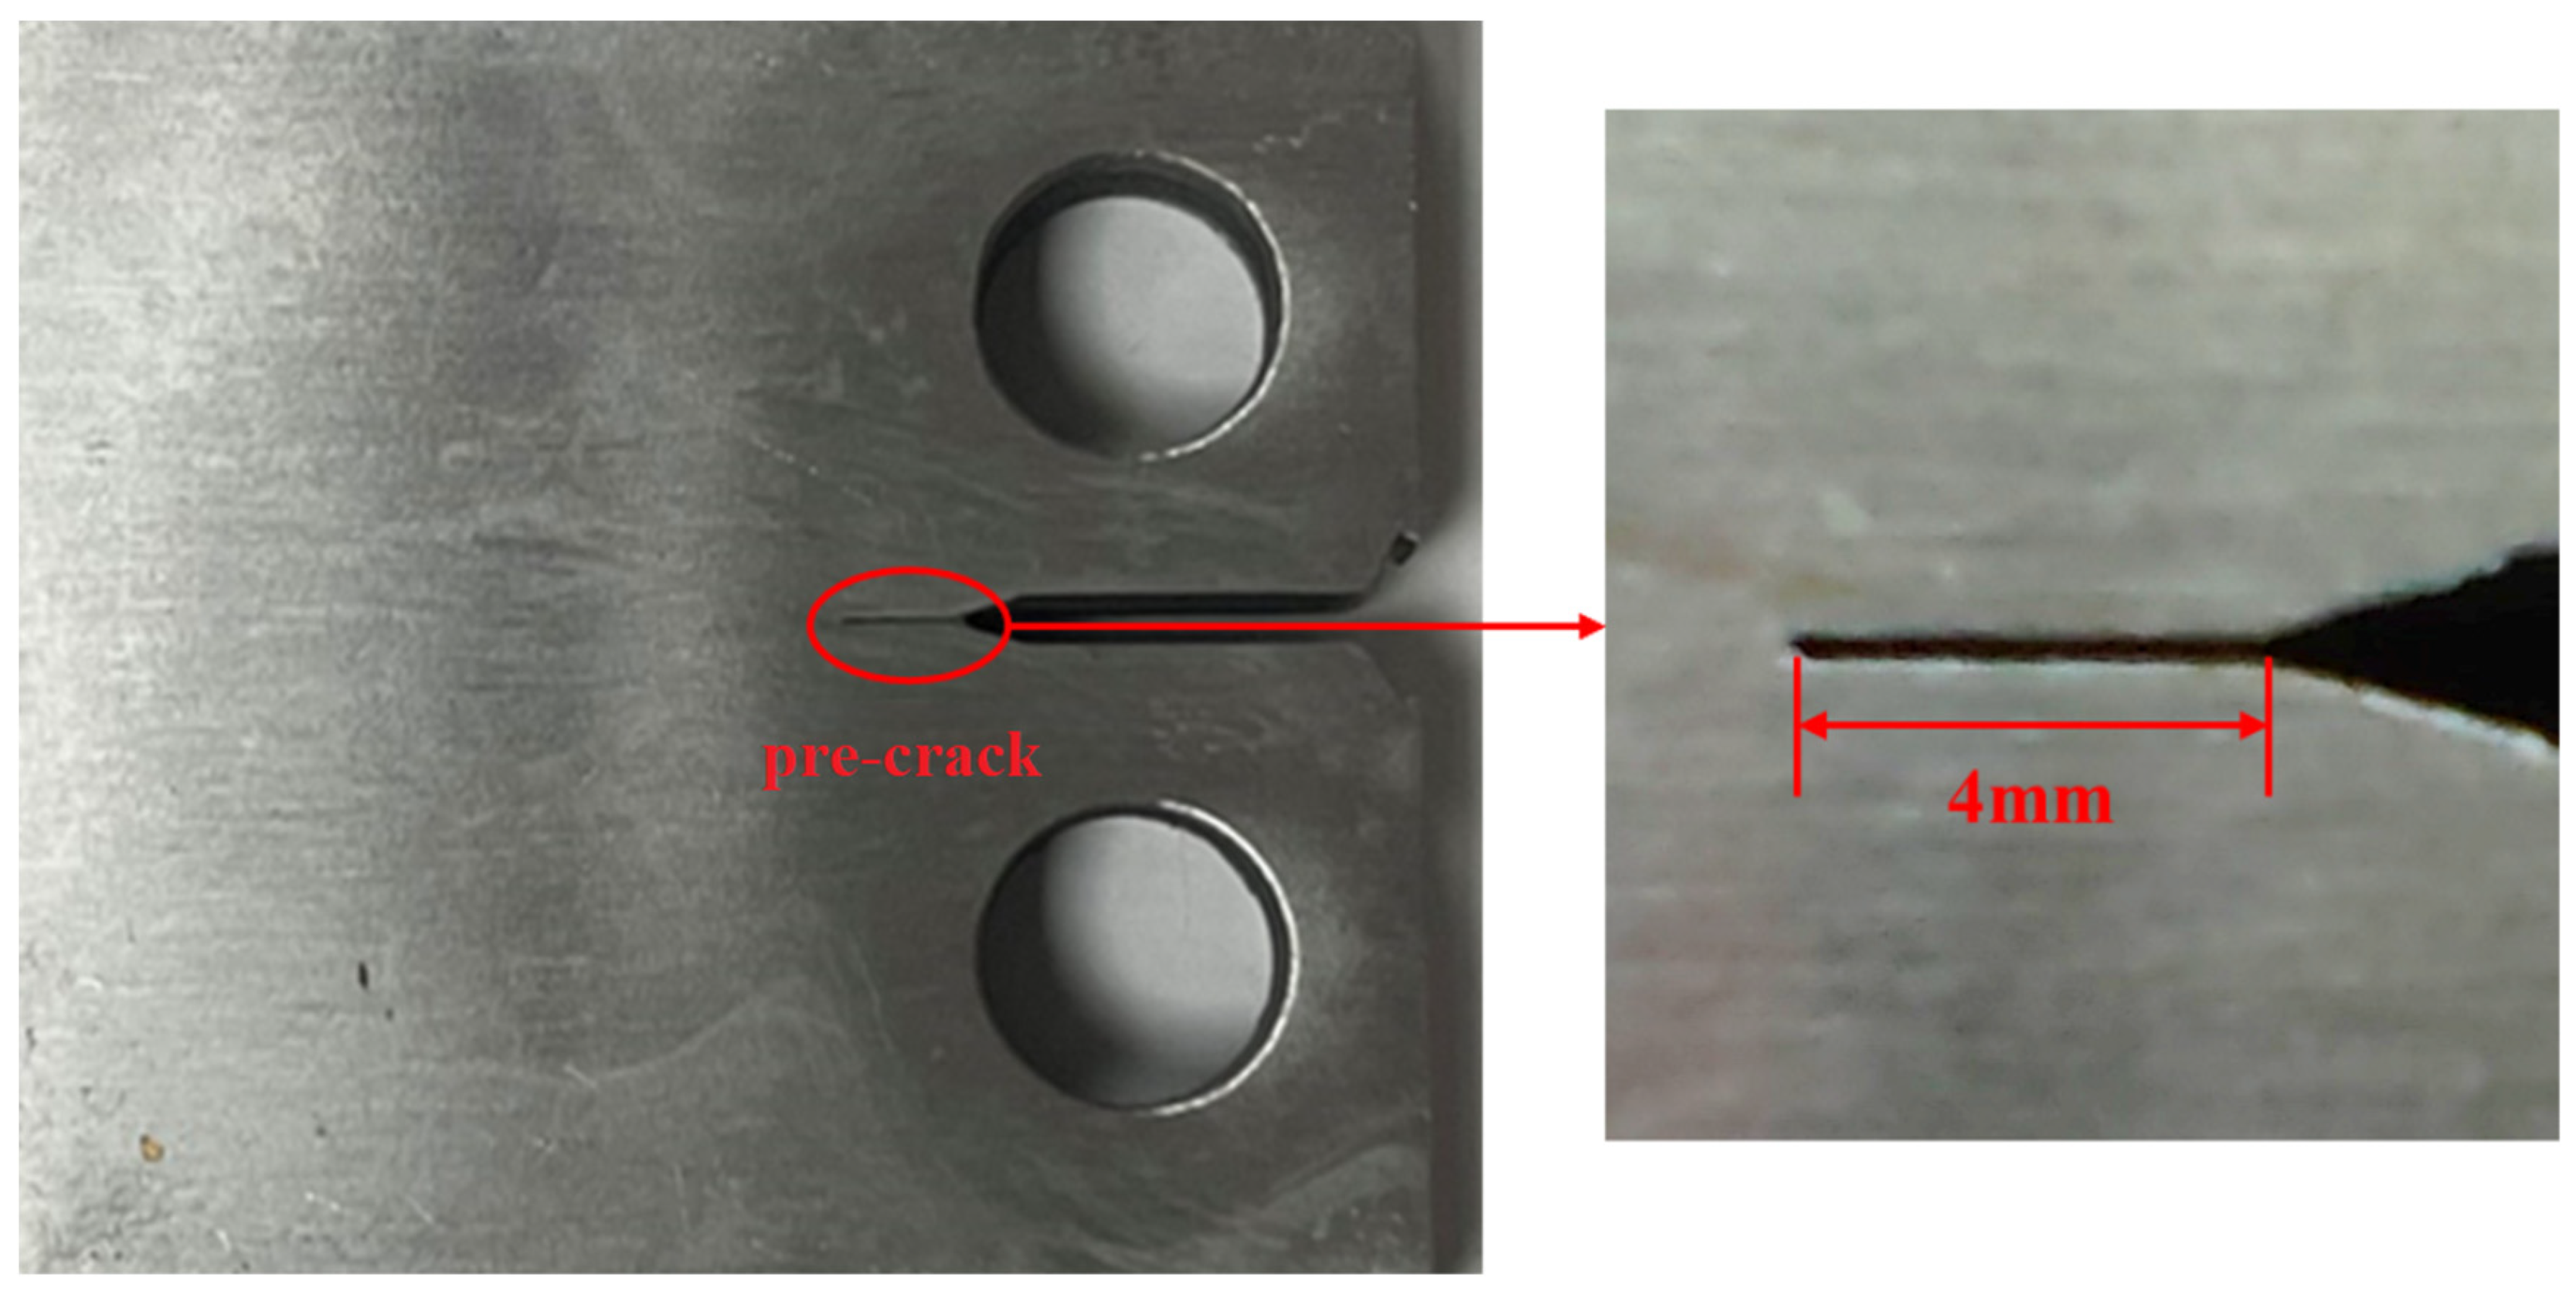
3.3. Experimental Observation
To obtain the low-cycle fatigue crack length of the CT specimen subjected to cyclic loading, along with the corresponding number of loading cycles and CTOD, the experimental observation setup comprises strain gauges, extensometers, and a Digital Image Correlation (DIC) system. The strain gauges are employed to monitor the strain variation at the crack tip and the propagation of crack growth, while the extensometer is utilized for measuring the raw data of CTOD. The DIC system is responsible for recording the crack growth length corresponding to each loading cycle. The experimental setup, involving the extensometer, strain gauges, and DIC observation system, utilizing the HT-SUA502M-T industrial camera, is depicted in Figure 5 and Figure 6. In order to establish a correlation between data points and surface strain deformation dimensions during subsequent data processing, speckle patterns are sprayed onto the specimen surface during the experimental pre-processing stage. The high-speed camera is set to capture 60 frames per second, meaning that 60 images are captured within one second of each trigger, allowing for the observation of crack growth and plastic zone variations during the cyclic loading process. Subsequently, the images of the crack tip captured by the high-speed camera are imported into the VIC-2D image processing software, and crack length is measured based on the initial calibration values, as illustrated in Figure 7.
Figure 5.
Schematic representation of experimental observation setup.
Figure 6.
DIC observation system.
Figure 7.
Data-processing interface in the VIC-2D software.
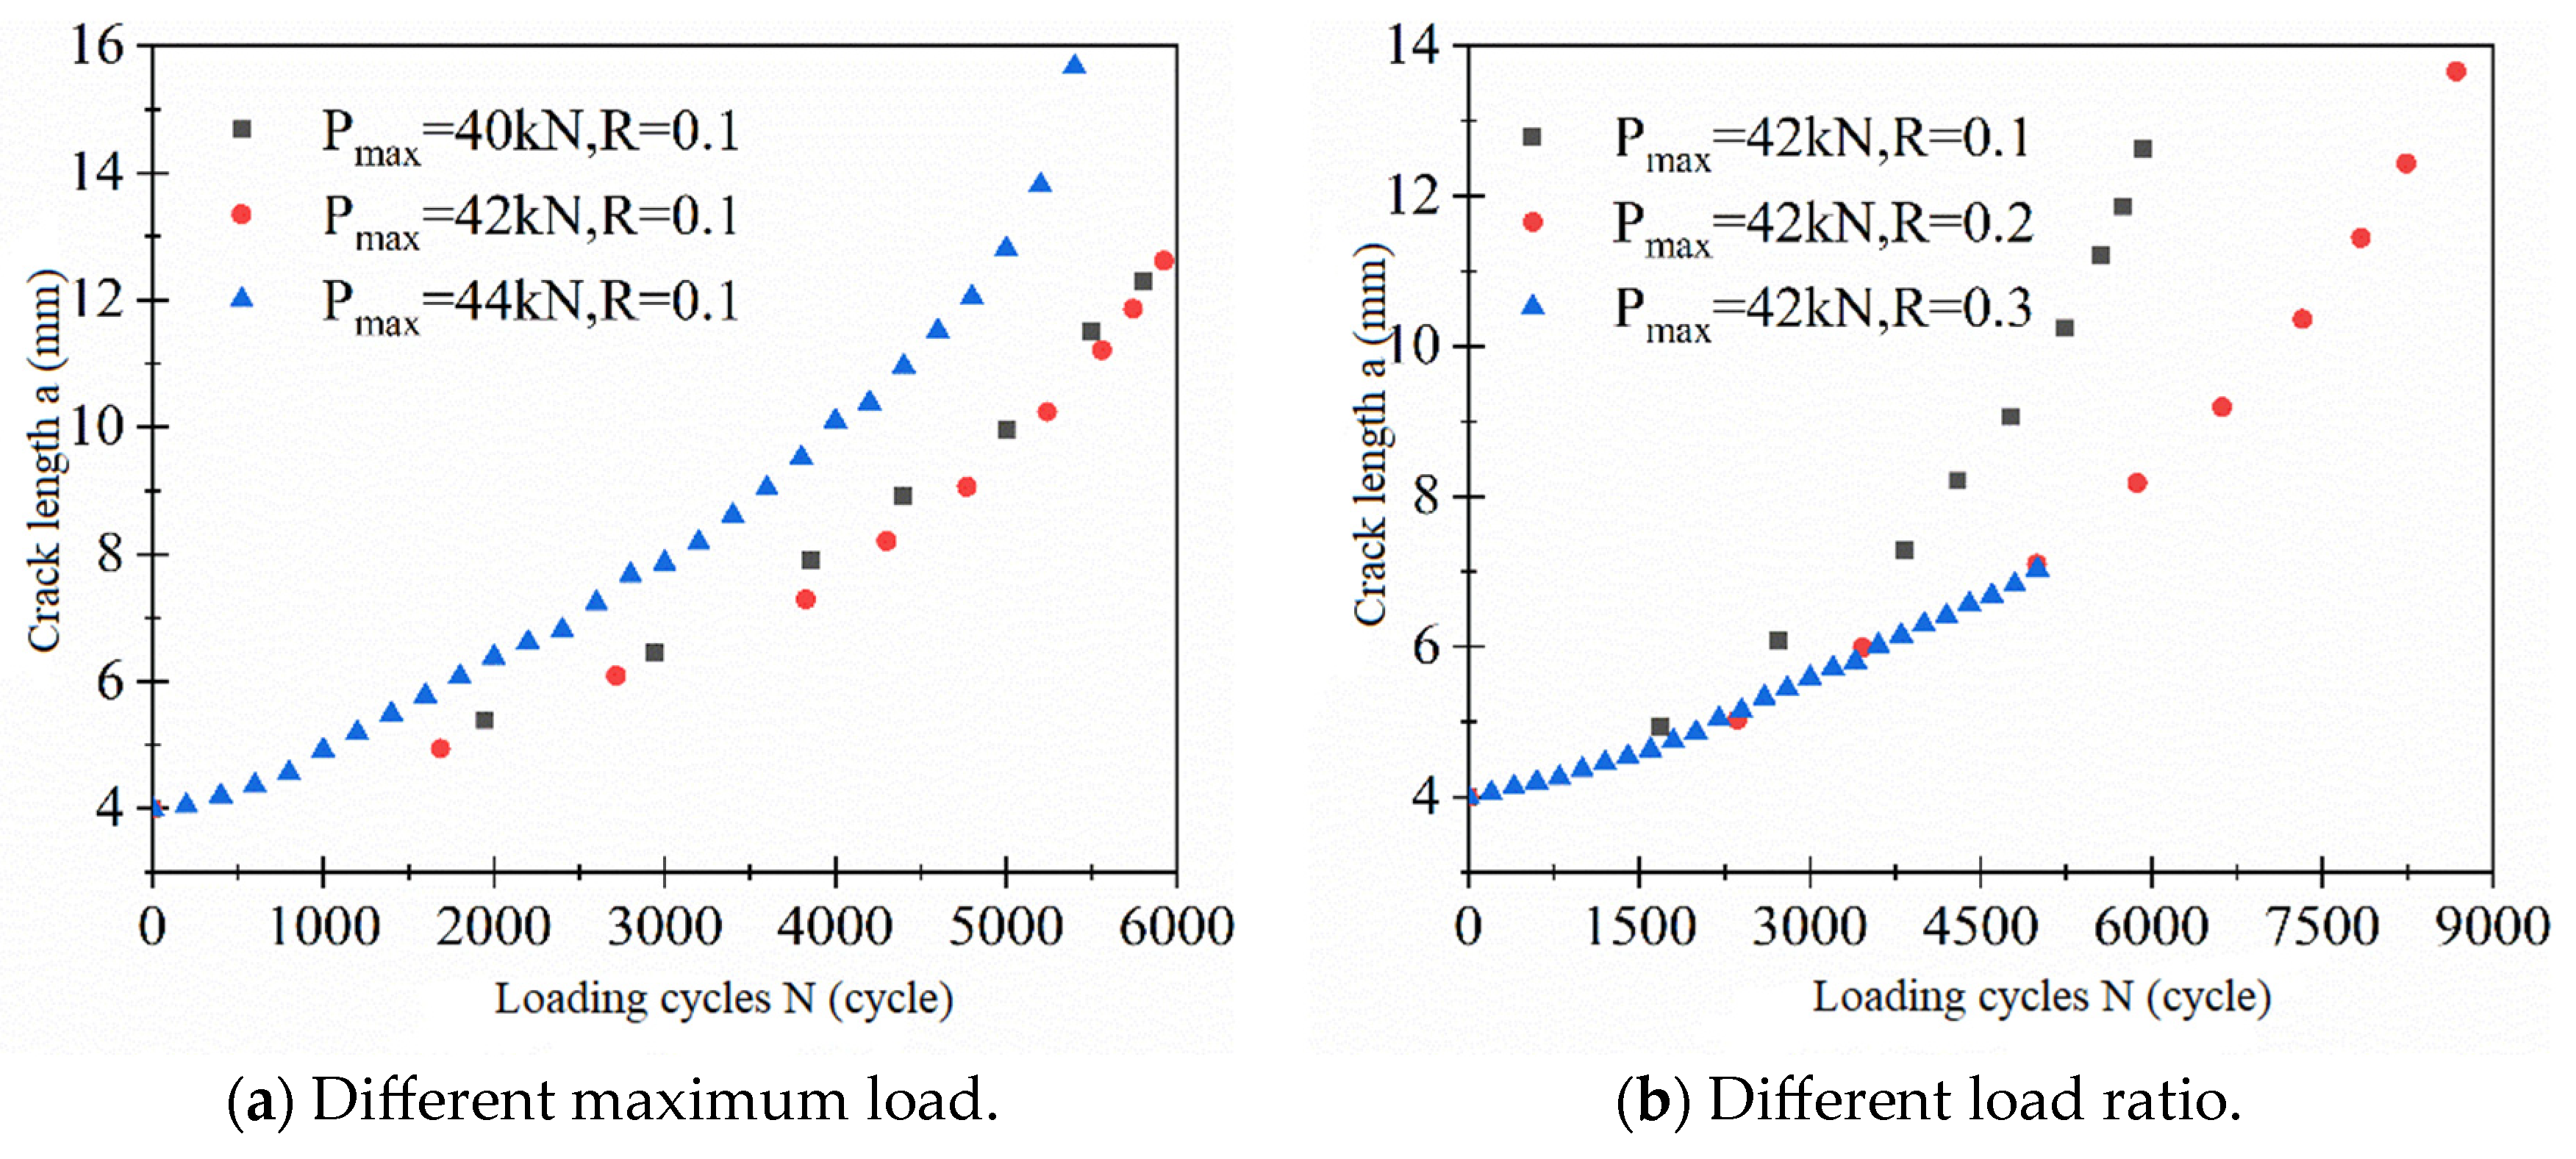
3.4. Experimental Result
Upon the occurrence of whole fracture in the CT specimen, the loading is immediately halted.
During the experimental process, the crack propagation behavior at the crack tip was captured using an industrial camera, and through software processing, the variation in the plastic deformation zone at the crack tip with the number of loading cycles, N, was obtained, as shown in Figure 8. Under the loading condition with a maximum load of 44 kN and a load ratio of 0.1, when the number of loading cycles was 200, 1200, 1800, 3000, 5000, and 5400, the plastic deformation zone at the crack tip (highlighted in red in Figure 9) gradually increased with the increasing number of cycles until the specimen failed. At the beginning of loading, the plastic deformation zone at the crack tip was negligible, but as the cycles progressed, this area became increasingly significant and expanded gradually. This indicates that cyclic loading induces plastic deformation at the crack tip, which accumulates progressively. The accumulative plastic deformation at the crack tip has a cumulative effect on crack propagation under large-scale yielding conditions, as well as on the values of CTOD, leading to accelerated crack propagation with additional damage. Therefore, considering the impact of accumulative plasticity is crucial in the study of low-cycle fatigue crack propagation behavior.
Figure 8.
The variation in the plastic deformation zone with the number of loading cycles.
Figure 9.
The variation in plastic zone size with crack length.
Based on the experimental results, the variation in the plastic zone size at the crack tip with crack length under the designed loading conditions is presented in Table 4 and Table 5. Here, represents the crack length, denotes the plastic zone size, and signifies the ratio of crack length to plastic zone size.
Table 4.
The variation in plastic zone size under different maximum load.
Table 5.
The variation in plastic zone size under different load ratio.
From Table 4 and Table 5, it is observed that, under the designed loading conditions, the crack growth length and the plastic zone size at the crack tip are of the same order of magnitude under the influence of applied loading. This suggests that the crack tip is in a state of large-scale yielding, indicating that the crack propagation behavior is primarily controlled by plastic deformation. The curves depicting the variation in plastic zone size with crack length under different loading conditions are illustrated in Figure 9.
As observed from Figure 9, the size of the plastic zone at the crack tip gradually increases with the propagation of the crack length. Figure 10a illustrates the variation in the plastic zone size at the crack tip for different maximum loads, where, under a constant load ratio, the plastic zone size increases with the augmentation of the maximum load. Figure 10b depicts the variation in the plastic zone size at the crack tip for different load ratios, and with the applied maximum load remaining constant, the change in plastic zone size is not prominently affected by different load ratios. The curves depicting the variation in crack length with loading cycles under different loading conditions are illustrated in Figure 10.
Figure 10.
The variation in crack length with loading cycles.
As depicted in Figure 10, with the continuous tensile loading on the specimen, the pre-existing crack, initially 4 mm in length, gradually begins to propagate. Simultaneously, the crack propagation rate (i.e., the slope of the curve in Figure 10) increases progressively from an initially more gradual phase until the specimen undergoes complete fracture and failure. This phenomenon is attributed to the forward propagation of the fatigue crack, leading to a gradual increase in the material’s fracture parameters. Correspondingly, the crack propagation rate continually rises.
4. Low-Cycle Fatigue Crack Propagation Model Based on CTOD
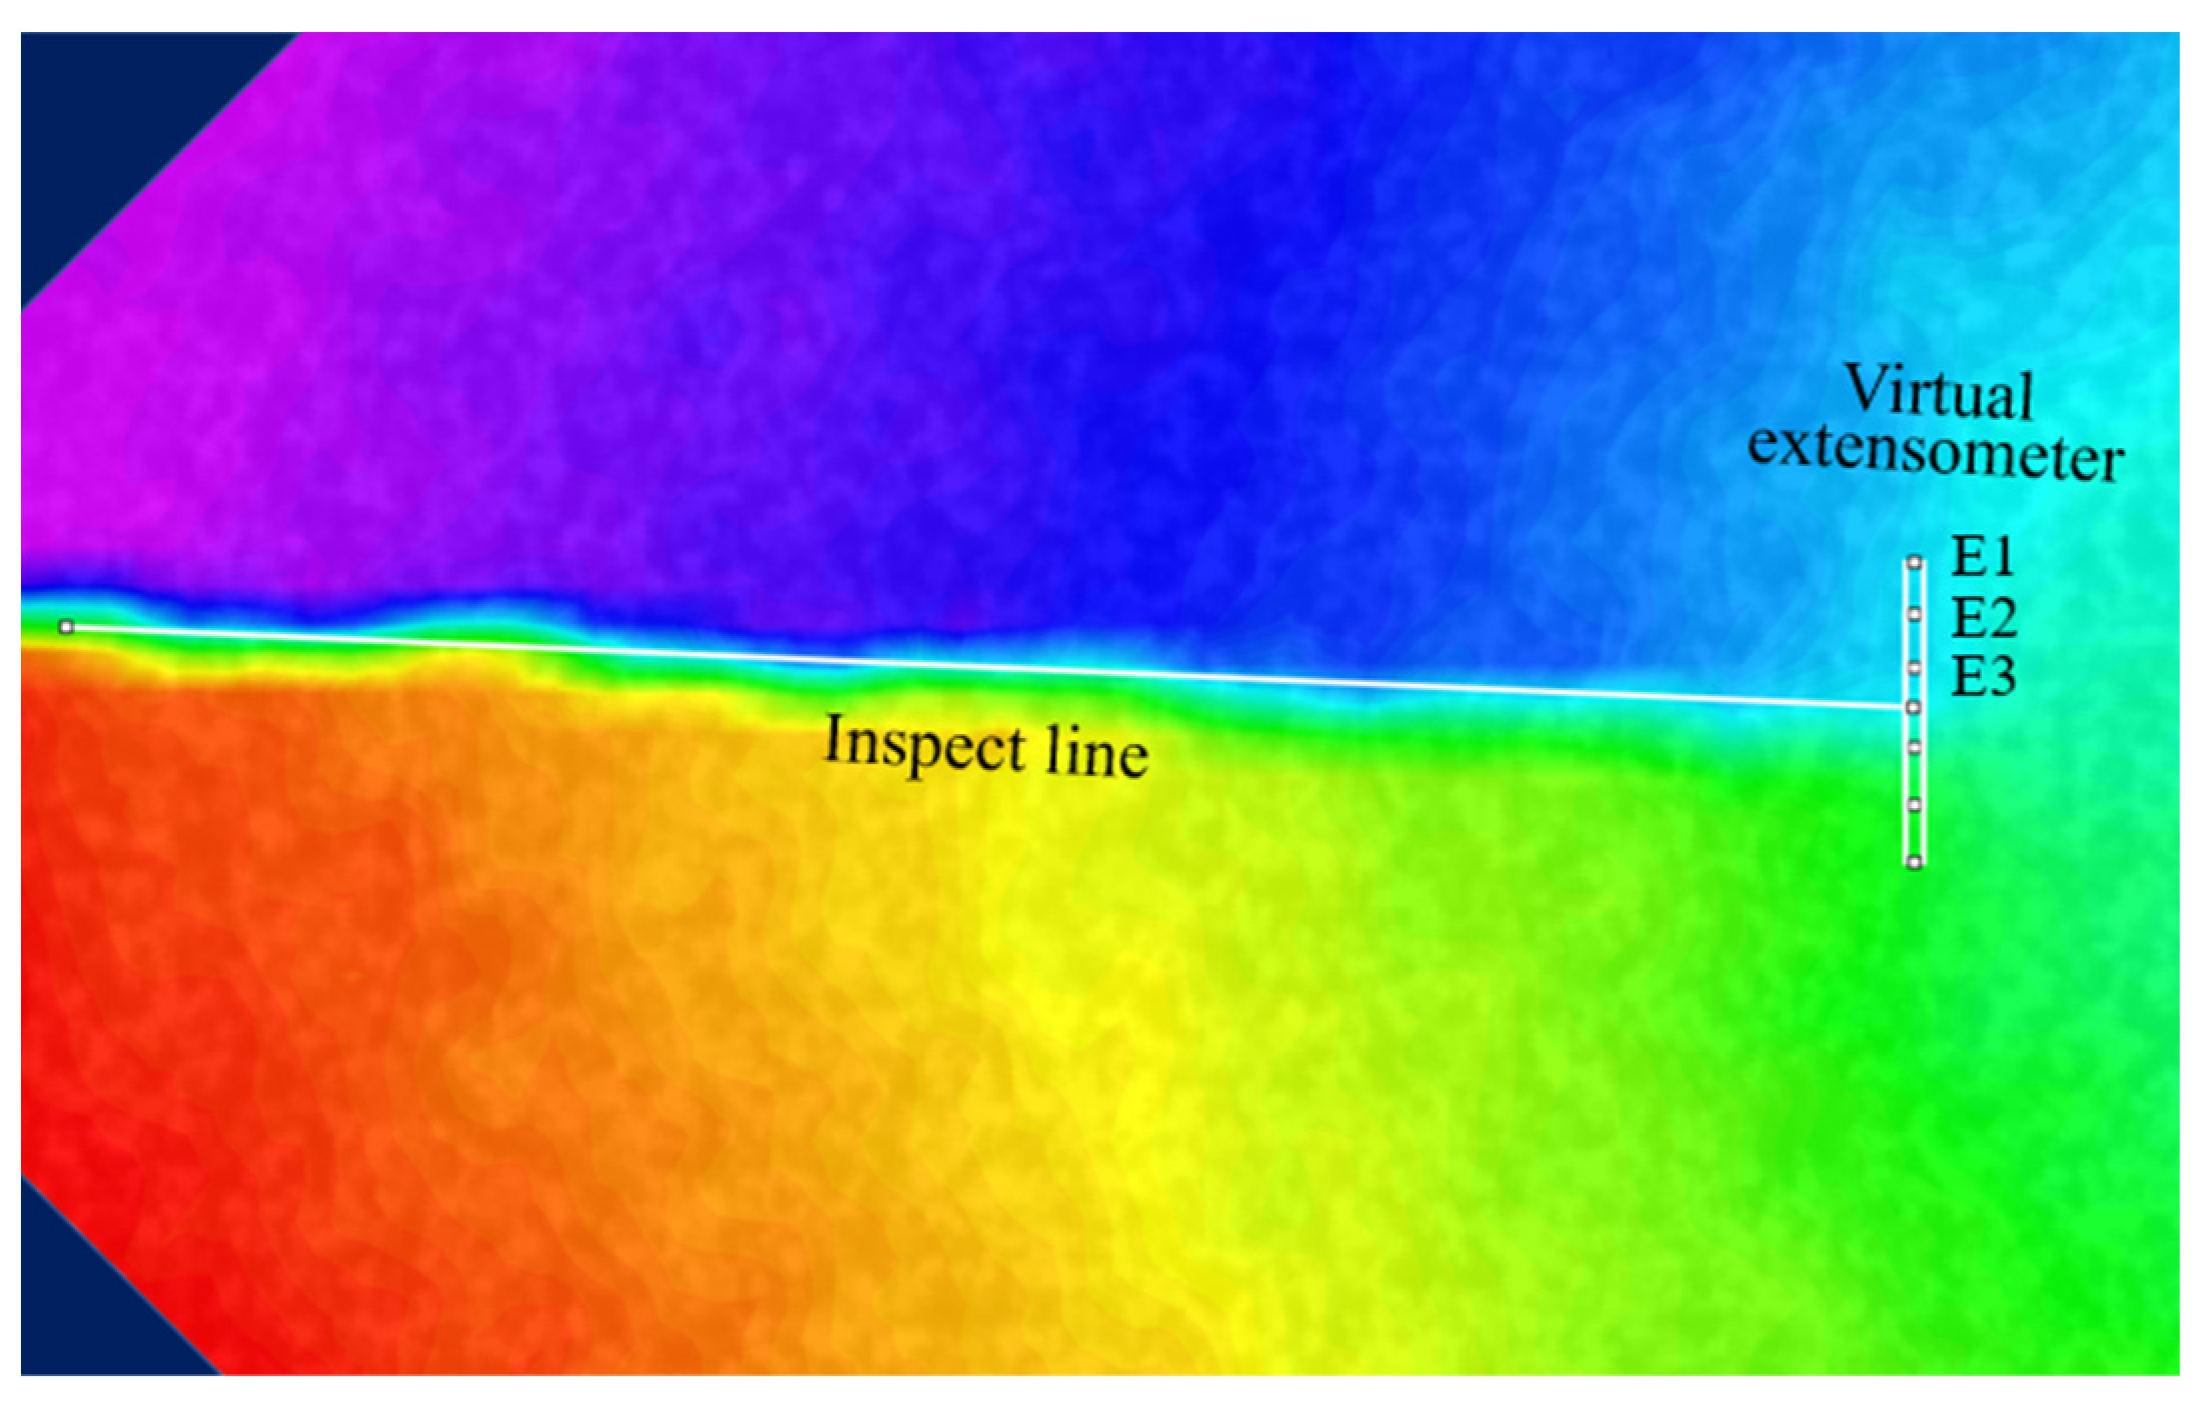
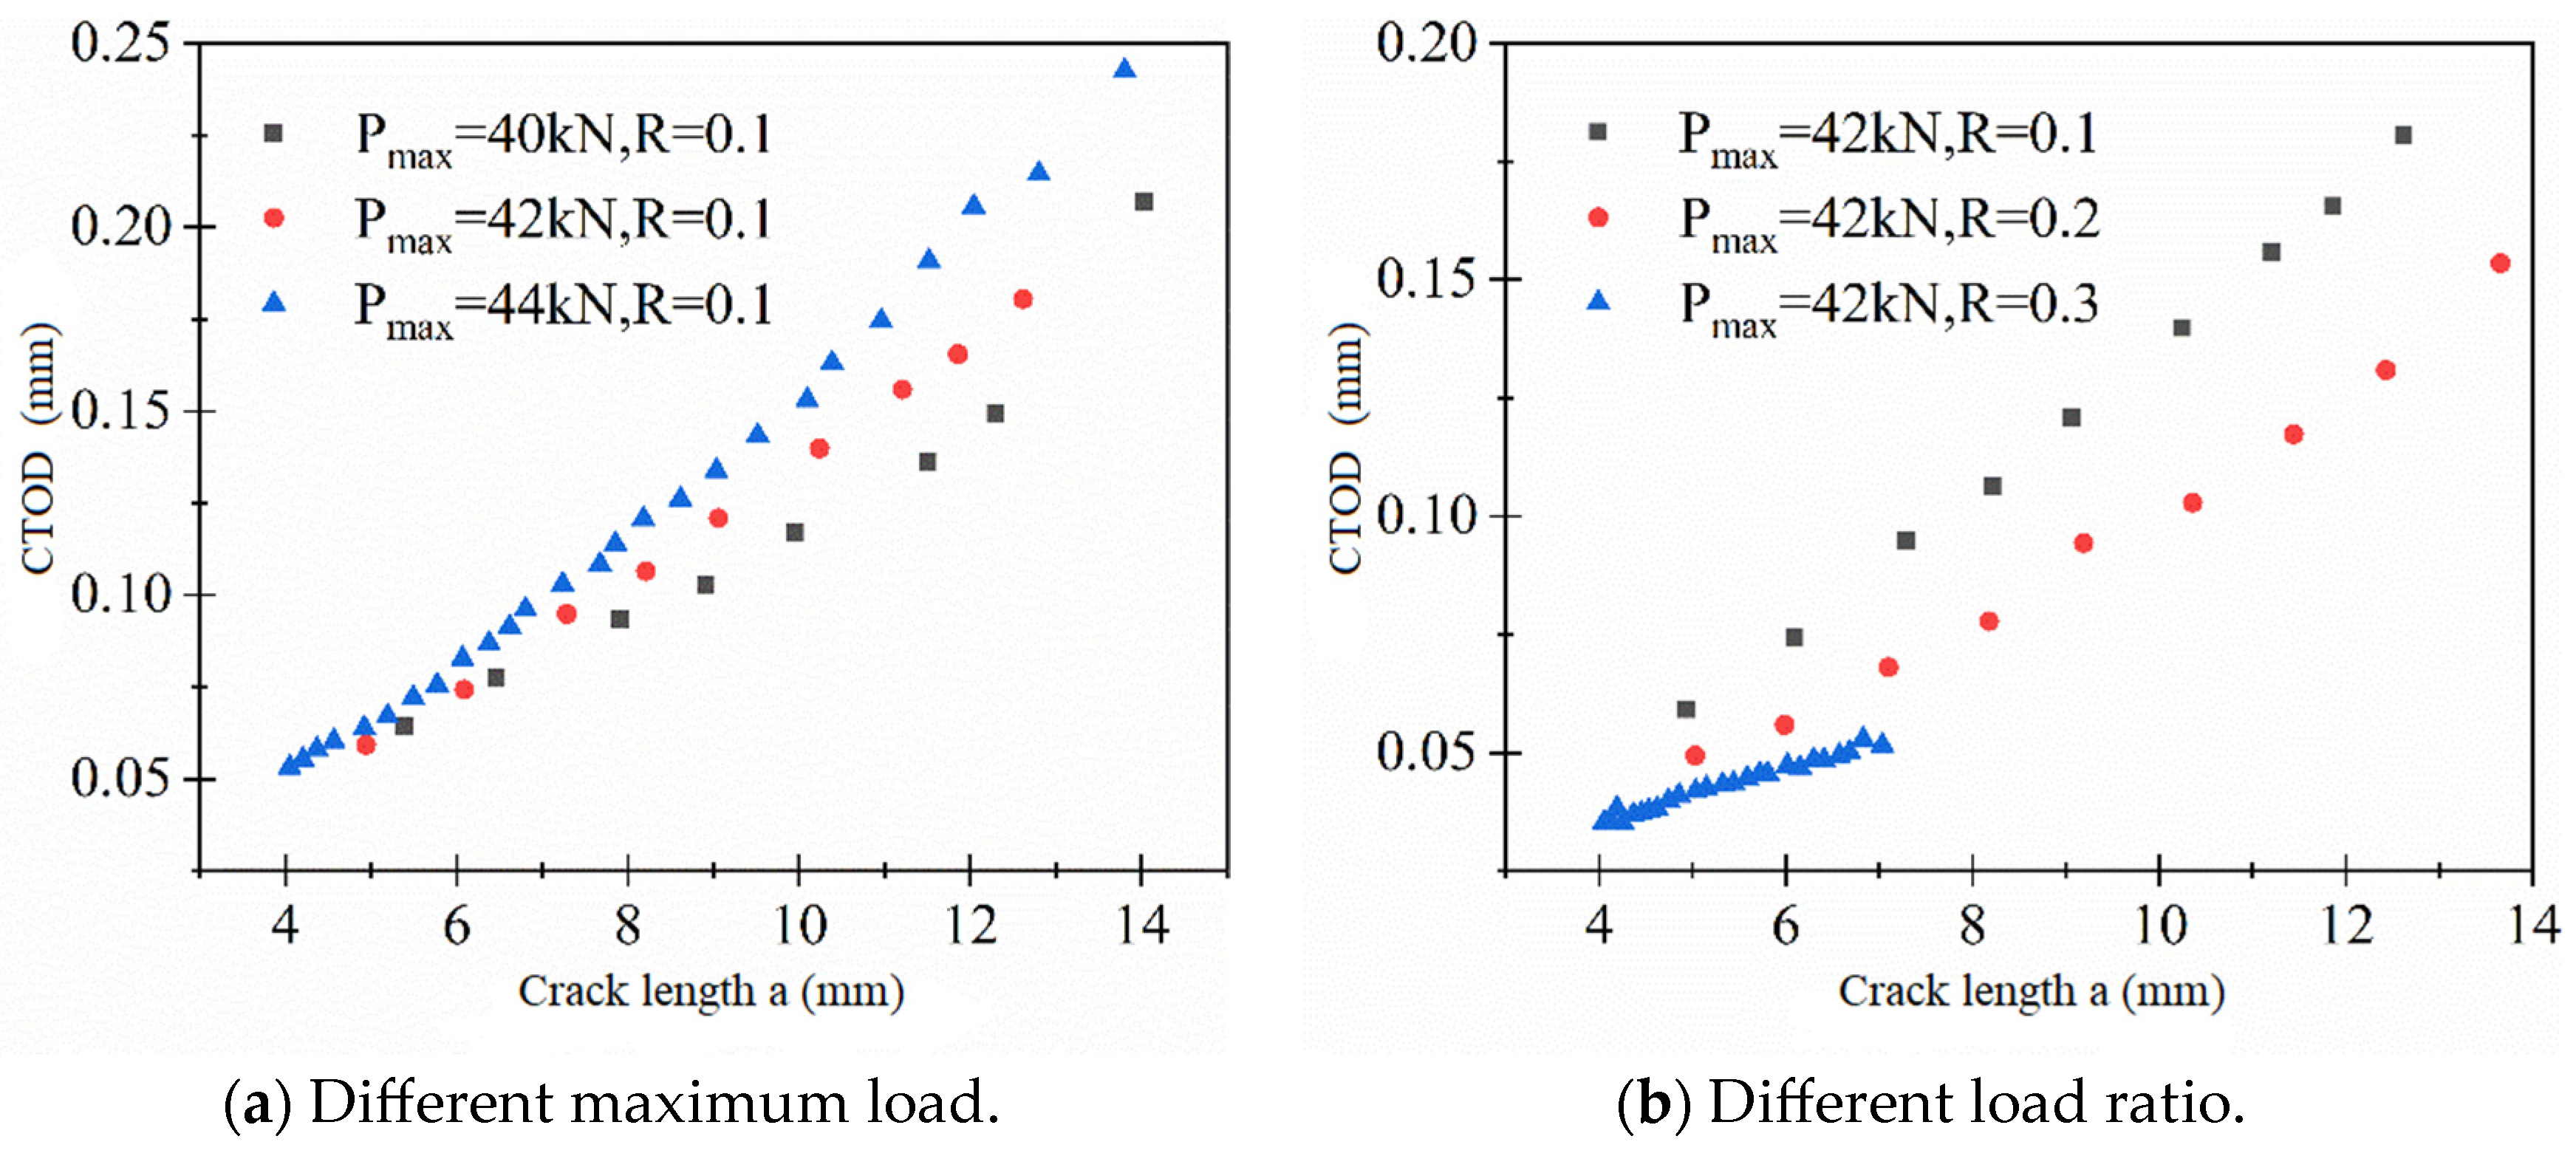
4.1. Measurement Results of CTOD
The variation in CTOD with crack growth length under different loading conditions is illustrated in Figure 11.
Figure 11.
The variation in CTOD with crack length.
From Figure 11, it can be observed that, under a constant load ratio, the crack growth length corresponding to the same number of cycles increases with the increment of the maximum load, and CTOD also increases accordingly. When the maximum load is the same, with an increase in the load ratio, the fatigue crack growth length corresponding to the same number of cycles decreases, and CTOD also decreases. This phenomenon indicates that the magnitude of crack propagation rate is primarily determined by the range of the applied load. Changes in the load range result in variations in the driving force for crack propagation, represented by the change in CTOD, thereby influencing the crack propagation rate.
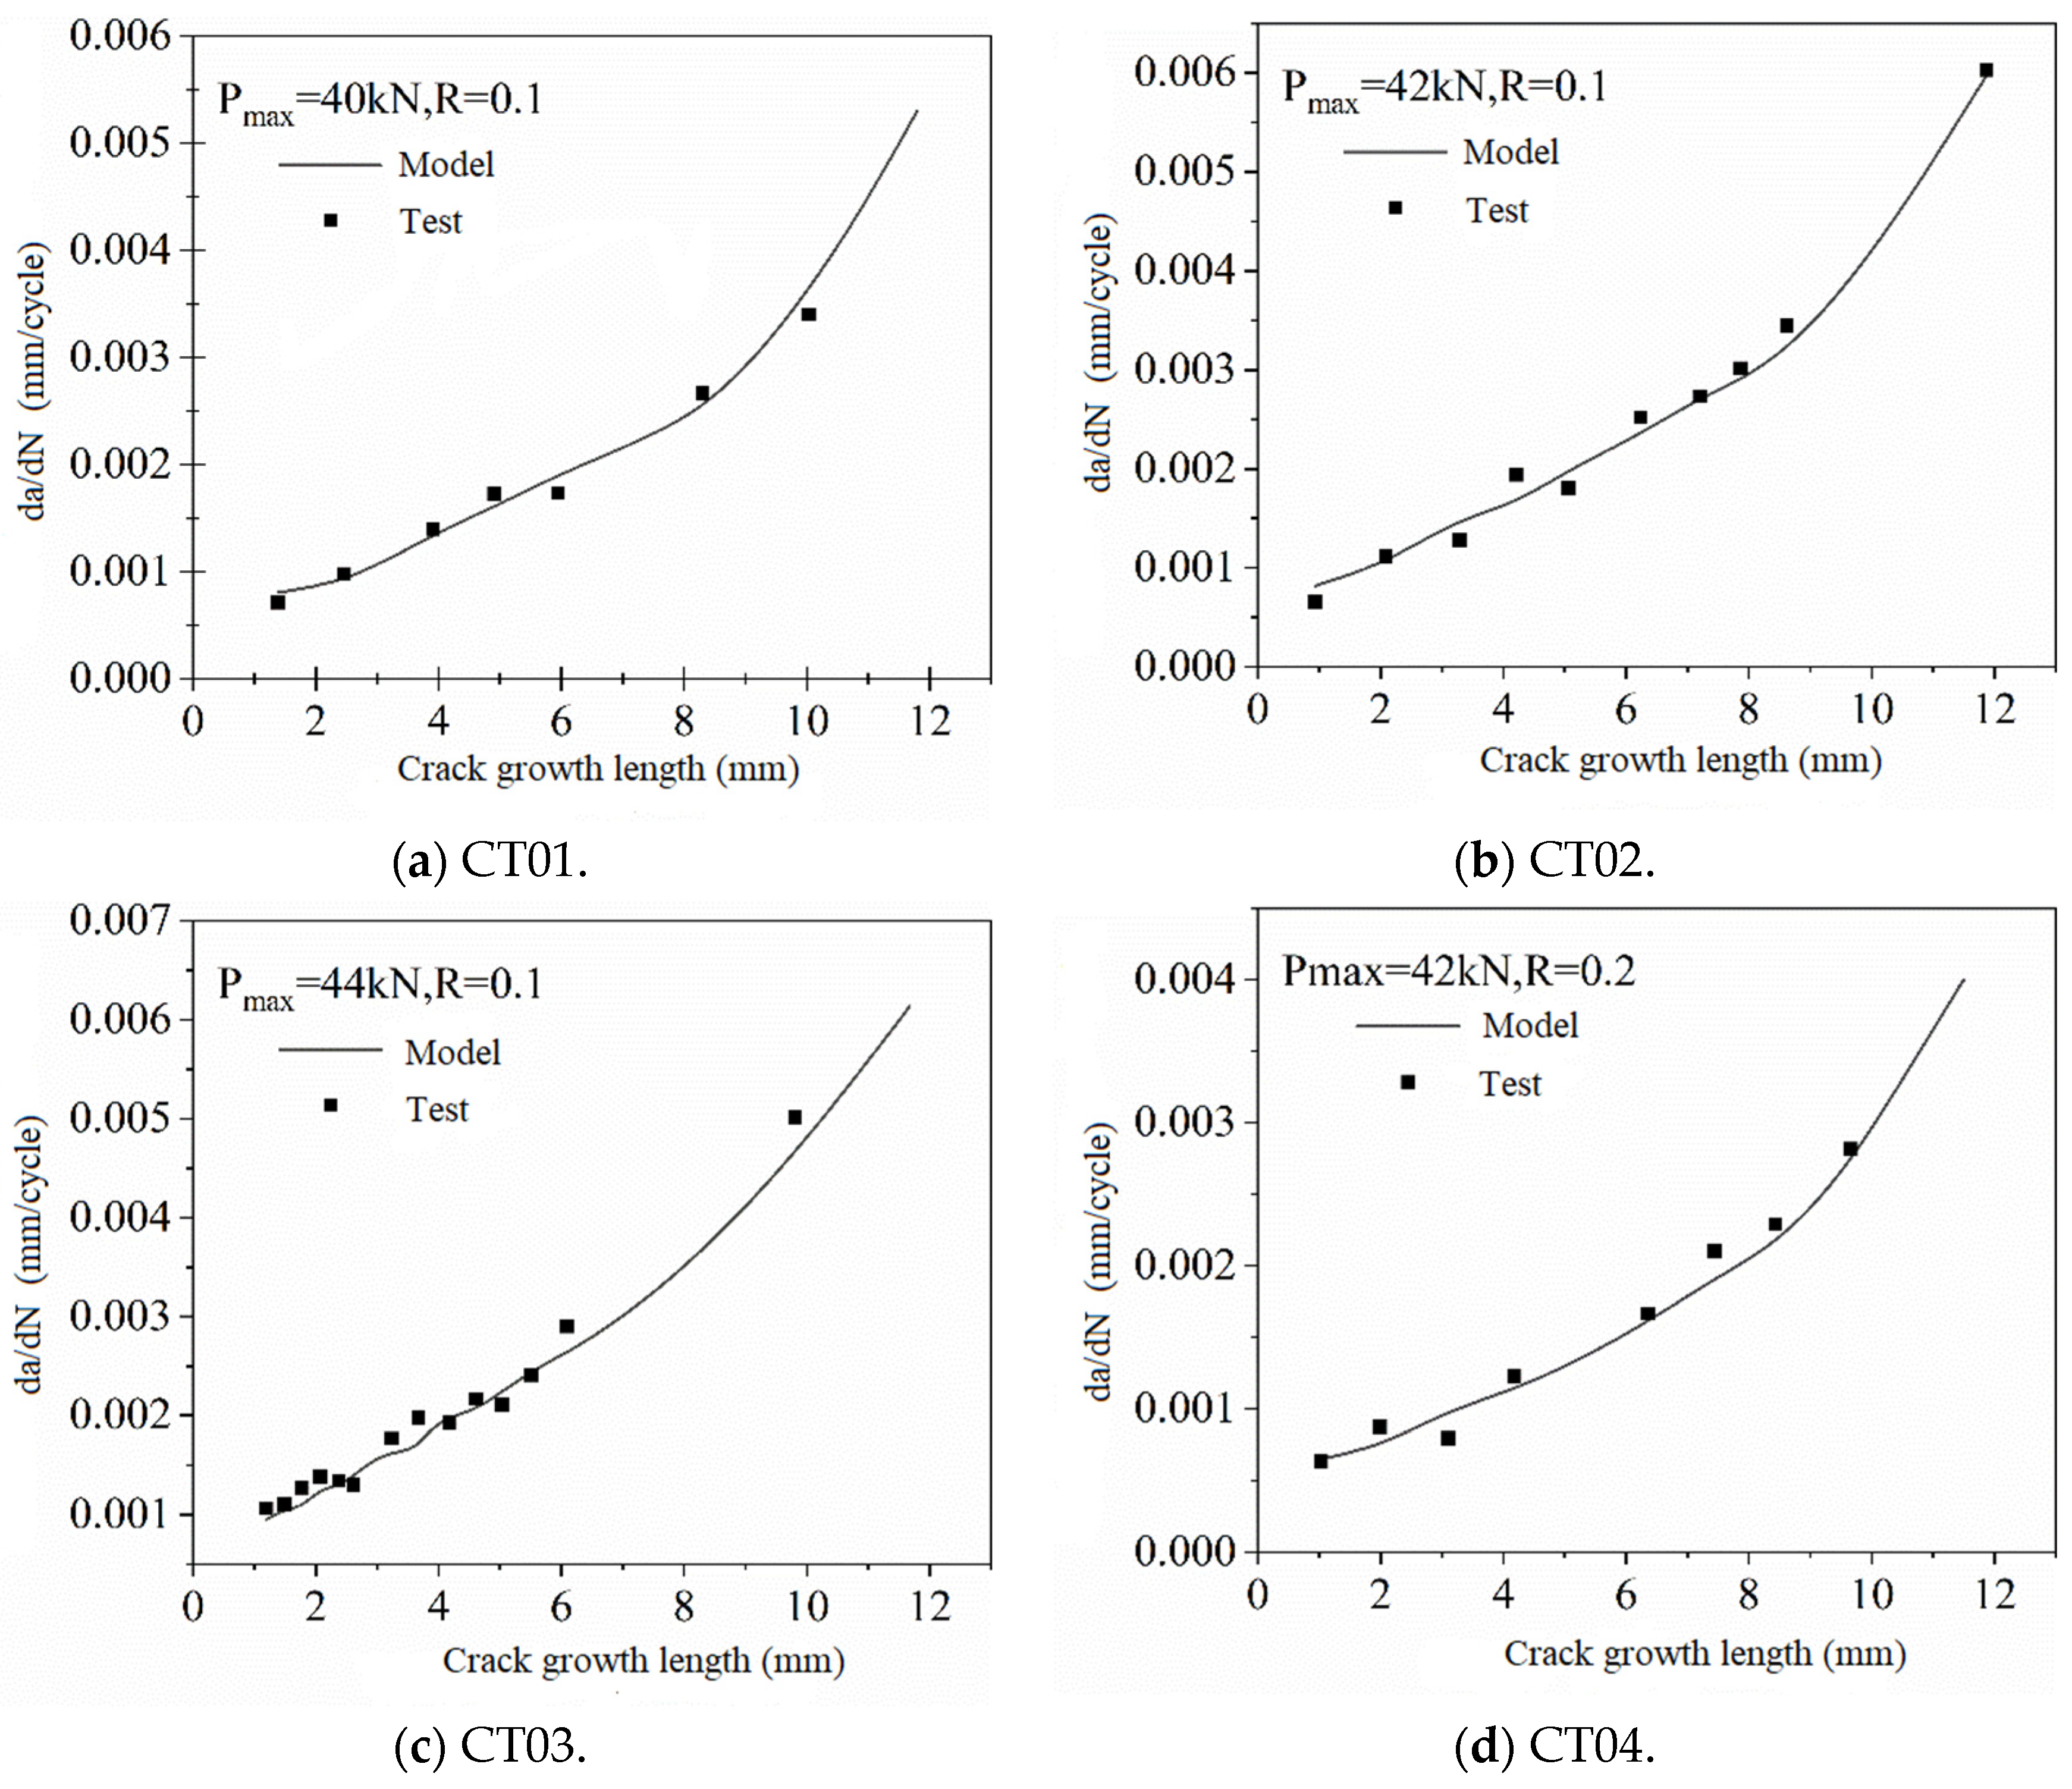
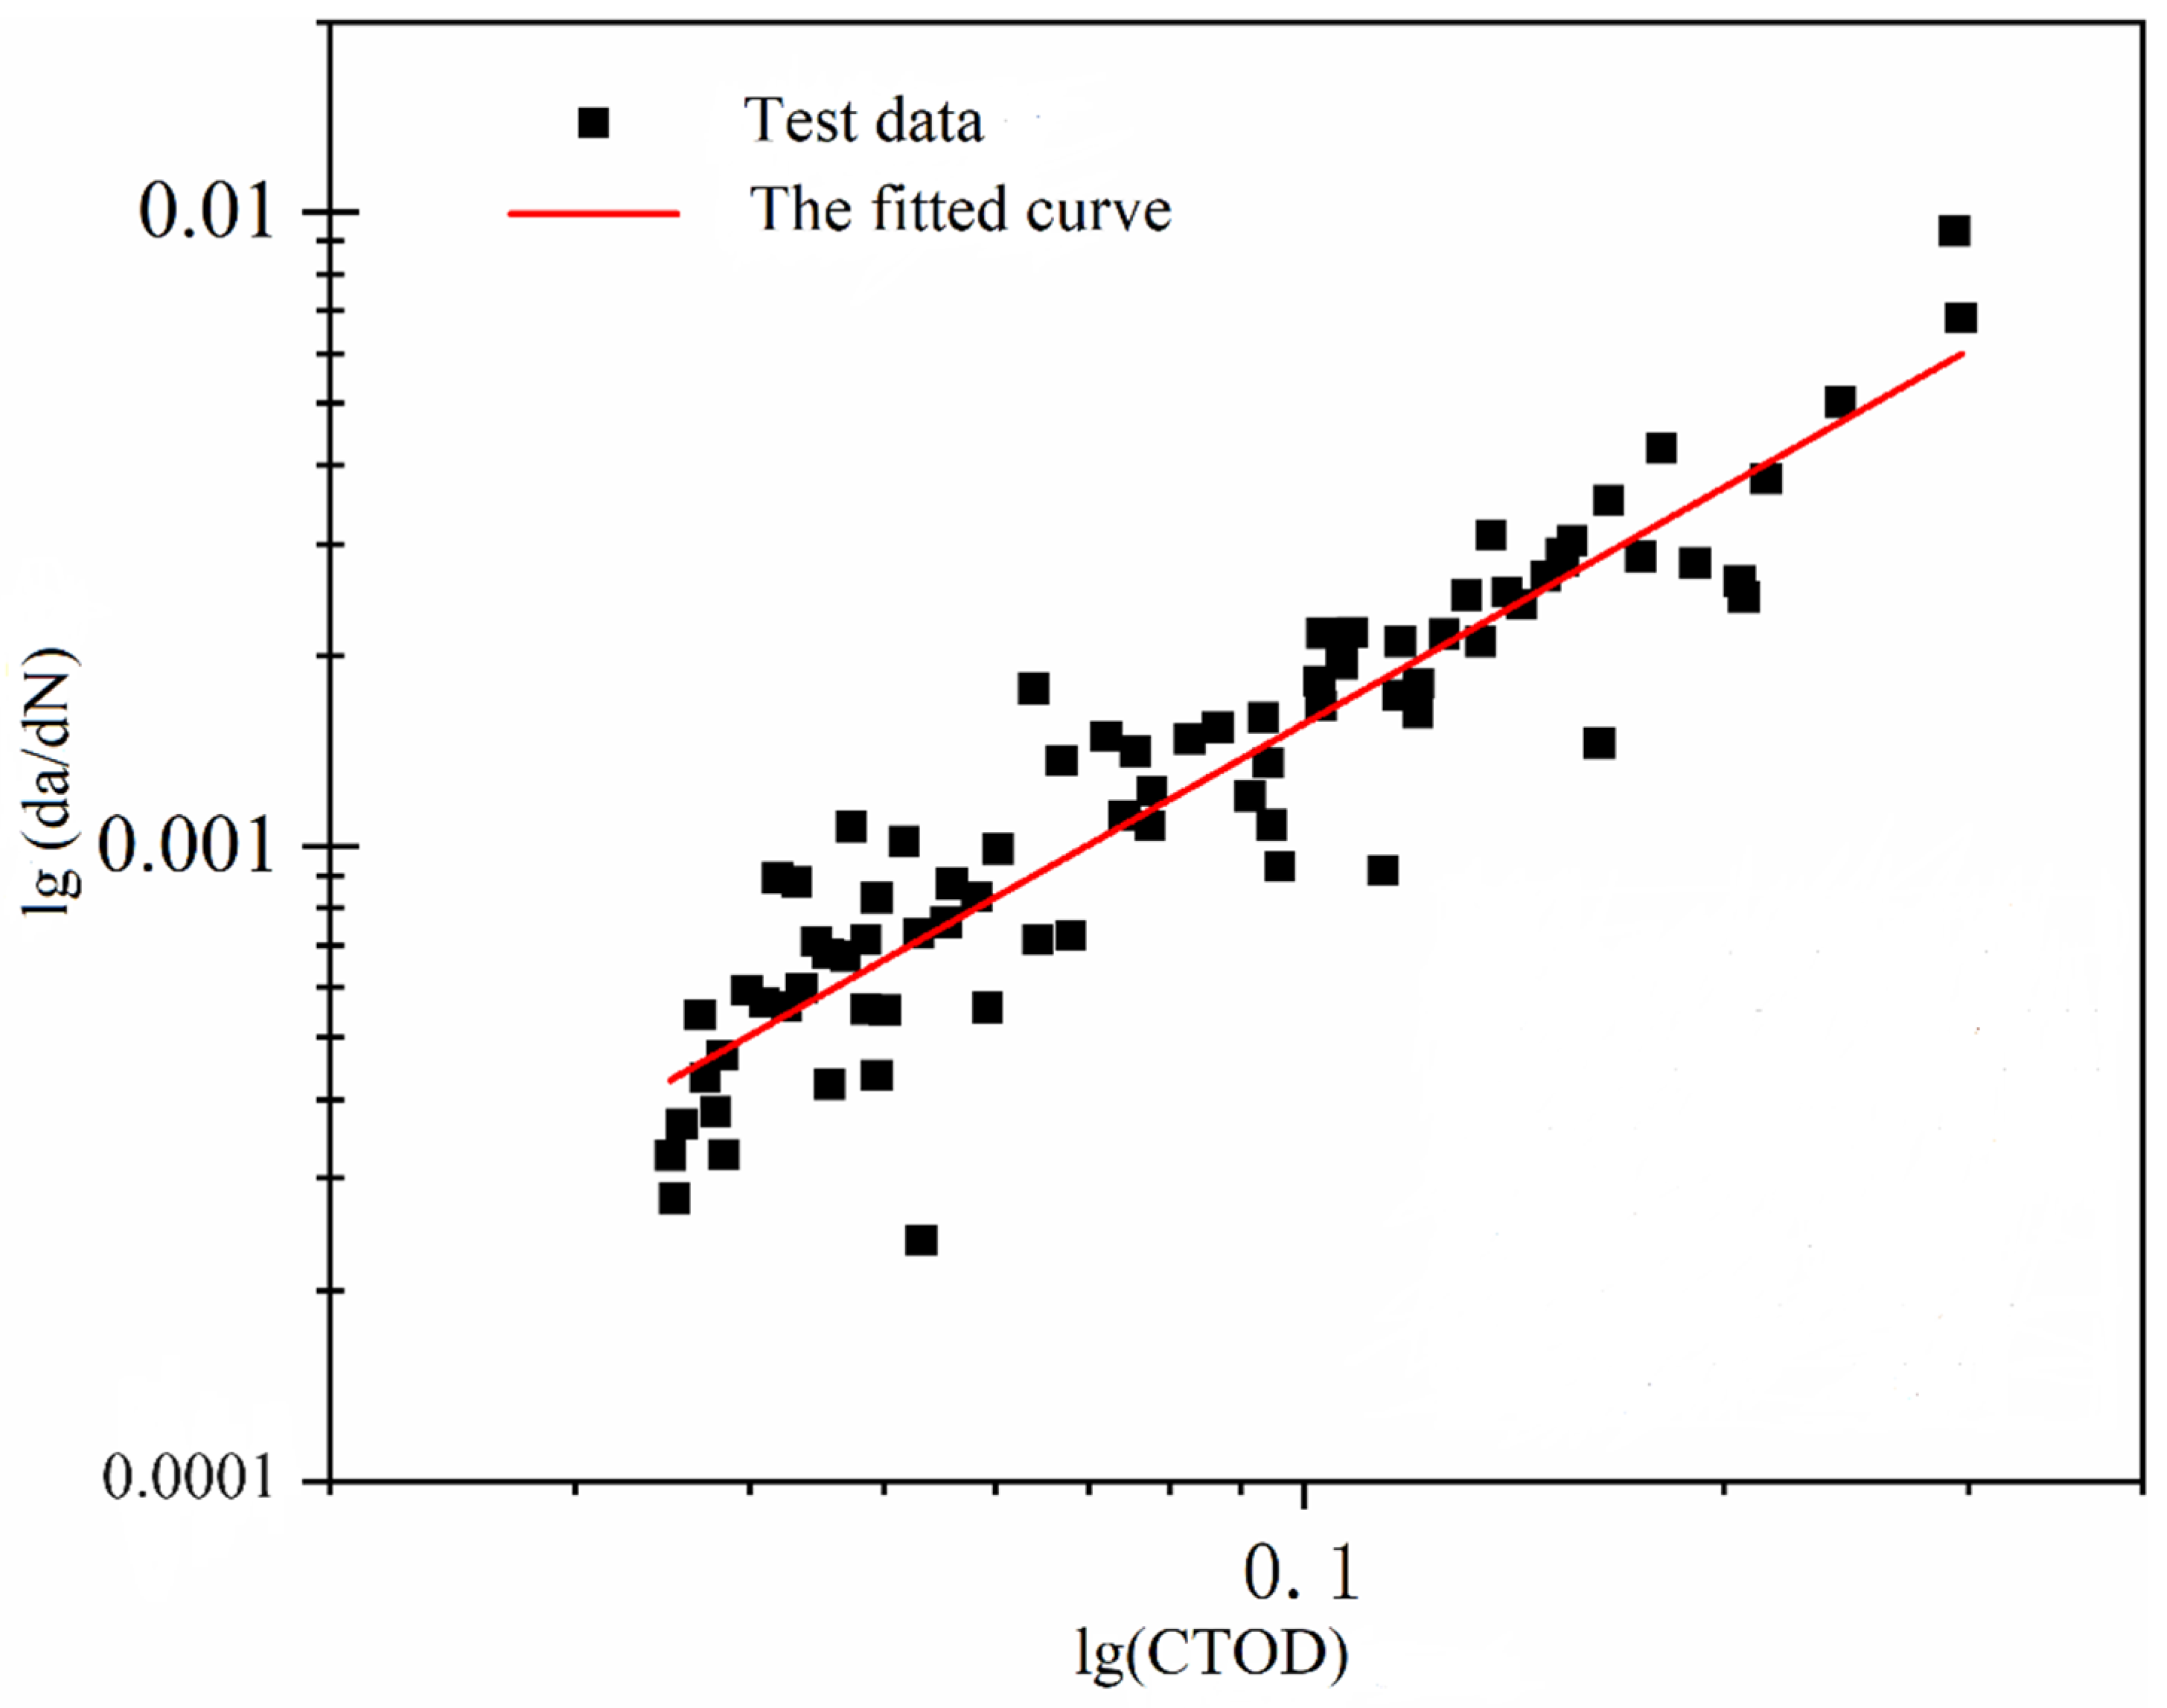
4.2. Crack Growth Rate
The observations from the low-cycle fatigue crack propagation experiments indicate that applied loading influences the crack propagation rate through its impact on CTOD. Therefore, CTOD is employed as a fracture parameter to characterize the crack tip propagation behavior. Based on the CTOD data obtained from the low-cycle fatigue crack propagation experiments, a model for crack propagation rate, represented by the fracture parameter CTOD, is fitted as illustrated in Figure 12.
Figure 12.
The fitted curve of .
Considering the Paris equation, the relationship between crack propagation rate (da/dN) and the change in CTOD is given by the following:
where are the material constant.
From Figure 12, it can be observed that, on a log–log scale, there is a positive correlation between the change in CTOD and crack propagation rate. Based on this phenomenon, a model for the intrinsic crack propagation rate of the marine structural steel was fitted. The model is expressed as follows:
According to the fitted formula mentioned above, the variation curves of crack propagation rate with crack growth length under different loading conditions are illustrated in Figure 13.
Figure 13.
The crack growth rate curves under different loading conditions.
From Figure 13, it can be observed that the intrinsic crack propagation rate model characterized by CTOD as a fracture parameter aligns well with the experimental data under different loading conditions. This indicates that the model accurately describes the low-cycle fatigue crack propagation behavior of ship hull plates accounting for accumulative plasticity.
4.3. Discussion of the Results
This part delves into a detailed examination of the mechanisms underlying the effect of the maximum load and load ratio. When the load ratio is constant, a higher maximum load corresponds to a larger crack tip-opening displacement. Conversely, the maximum load remains constant, while the crack tip-opening displacement decreases significantly with the increasing load ratio. As for the reason, a larger maximum load leads to increased forward plastic strain and decreased residual strain at the crack tip. A higher forward plastic strain at the crack tip indicates a larger plastic zone ahead of the tip during loading and less residual plastic deformation upon unloading. As the maximum load increases, the compressive residual stress in front of the crack tip also increases due to the elevated residual plastic deformation at the minimum load. However, the variation in plastic strain and compressive residual stress behind the crack tip is opposite to that ahead. The reduction in residual plastic strain at the crack tip implies a decrease in residual plastic deformation transferred into the plastic wake. Consequently, a smaller compressive residual stress magnitude develops in the plastic wake for higher maximum load. Increasing load ratio results in a higher load at the end of unloading and a weaker reverse plastic strain both behind and ahead of the tip. This reduction in the plastic strain range translates to a lower compressive stress around the tip at the end of unloading, and the magnitude of the compressive residual stress in the plastic wake effectively reflects the variations in crack growth behavior.
5. Conclusions
In this paper, standard tensile tests and cyclic loading tests were conducted on marine structural steel to obtain basic mechanical properties. Based on these, low-cycle fatigue crack propagation experiments under constant amplitude cyclic loading were conducted and a model for crack propagation rate characterized by CTOD considering accumulative plasticity was established. Some conclusions can be drawn:
- (1)
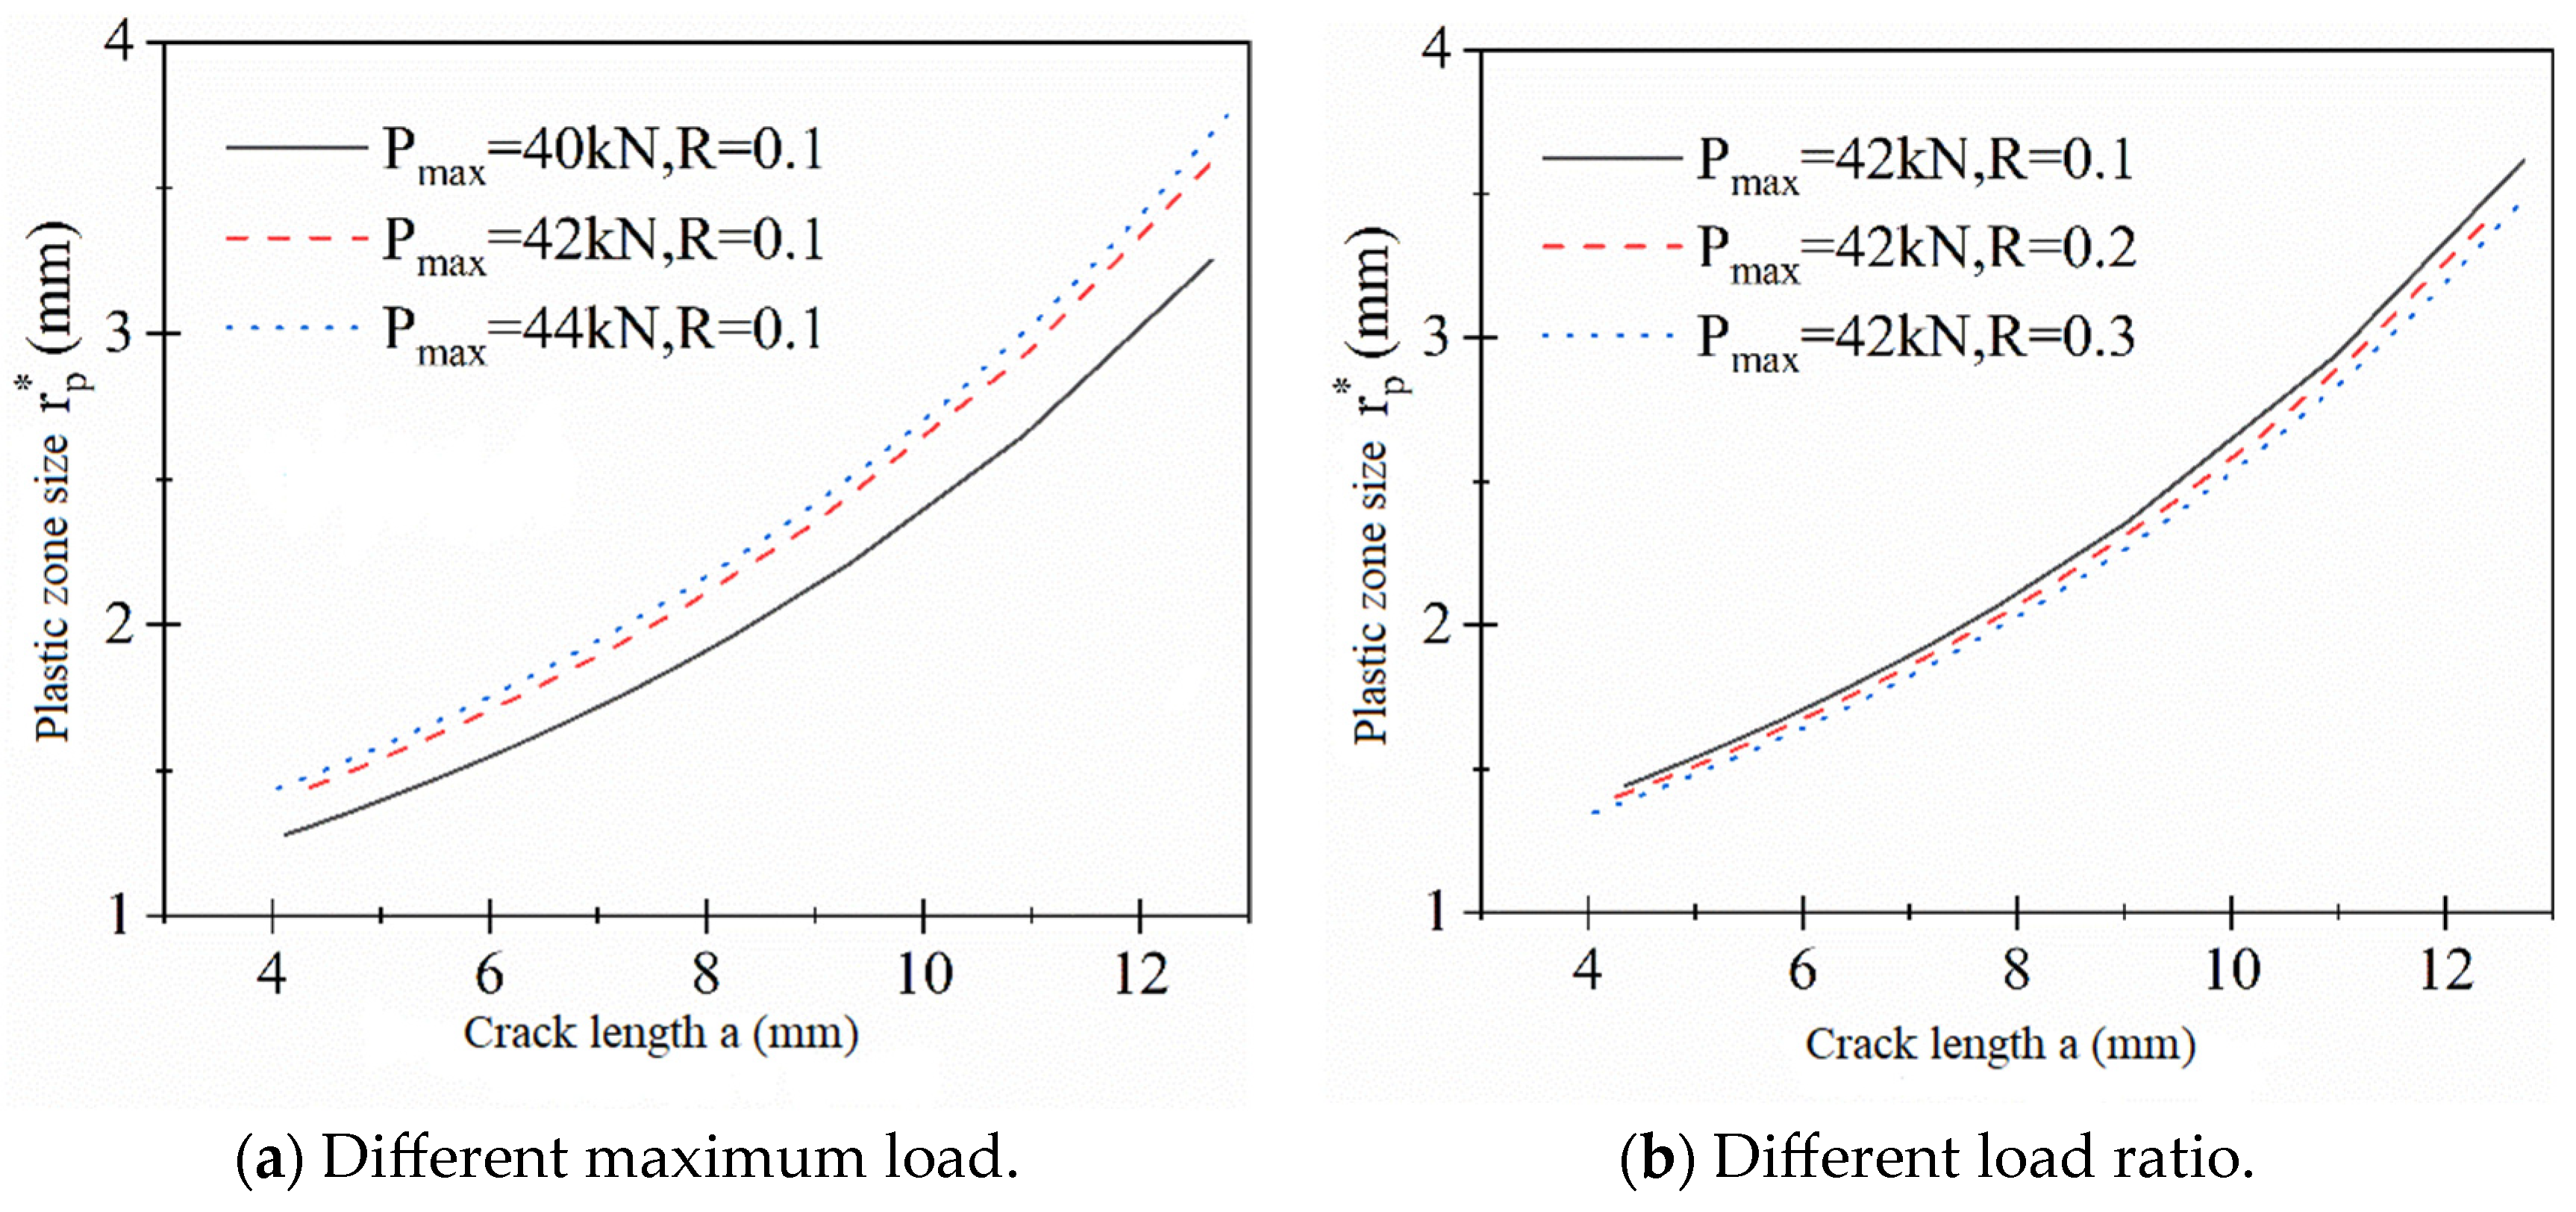
- Under the designed loading conditions in the experiments, the crack length and the plastic zone size at the crack tip are of the same order of magnitude, indicating that the crack tip is in a state of large-scale yielding. In this state, the crack propagation behavior is primarily controlled by plastic deformation.
- (2)
- With an increase in the number of loading cycles, there is a noticeable accumulation of plastic deformation at the crack tip. This phenomenon influences both the fatigue crack propagation and CTOD to a certain extent. This experimental observation confirms the necessity of considering the accumulative plasticity effect in the study of low-cycle fatigue crack propagation behavior.
- (3)
- Under a constant load ratio, an increase in the maximum load results in a corresponding increase in the crack growth length and CTOD for the same number of cycles. When the maximum load is kept constant, an increase in the load ratio leads to a decrease in the fatigue crack growth length for the same number of cycles. This indicates that the magnitude of the applied load range determines CTOD, thereby influencing the crack propagation rate.
- (4)
- On a log-log scale, there is a positive correlation between the range of CTOD and the crack propagation rate. A crack propagation rate model for marine structural steel was developed based on this relationship. Furthermore, the comparison of the model predictions with experimental results under different conditions indicates that the model accurately describes the crack propagation behavior under low-cycle fatigue cyclic loading.
The above work provides a comprehensive understanding of the low-cycle fatigue crack propagation behavior of marine structural steel, considering accumulative plasticity, which lays the foundation for predicting fatigue strength for marine structures.
Author Contributions
D.Q., study design and manuscript writing; L.X., literature search and article translation; X.G., making charts and data analysis. All authors have read and agreed to the published version of the manuscript.
Funding
This research was funded by the National Natural Science Foundation of China (grant no. 51909198).
Institutional Review Board Statement
Not applicable.
Informed Consent Statement
Not applicable.
Data Availability Statement
Data is contained within the article.
Conflicts of Interest
The authors declare no conflict of interest.
References
- Sumi, Y. Structural safety of ships developed by lessons learned from the 100-year history of break-in-two accidents. Mar. Struct. 2019, 64, 481–491. [Google Scholar] [CrossRef]
- Dover, W.D. Fatigue crack growth under COD cycling. Eng. Fract. Mech. 1973, 5, 11–21. [Google Scholar] [CrossRef]
- Huang, Z. A new insight of ship’s longitudinal strength criterion. China Shipbuild. 1996, 3, 87–98. [Google Scholar]
- Dong, Q.; Yang, P.; Deng, J.; Wang, D. Research on low-cycle-fatigue crack propagation life for ship plate based on accumulative plastic damage. J. Ship Mech. 2015, 19, 690–699. [Google Scholar]
- Paris, P.C.; Erdogan, F.A. Critical analysis of crack growth propagation laws. J. Basic Eng. 1963, 85, 528–534. [Google Scholar] [CrossRef]
- Elbert, W. Fatigue crack closure under cyclic tension. Eng. Fract. Mech. 1970, 2, 37–45. [Google Scholar]
- Dowling, N.E. Fatigue crack growth during gross plasticity and the J-integral. ASTM STP 1976, 590, 80–103. [Google Scholar]
- Liang, Y.; Yang, P.; Yu, Z. Experimental study on low-cycle fatigue crack propagation of cracked plate and stiffened plate based on AH36 steel. Ship Ocean. Eng. 2018, 5, 15–18. [Google Scholar]
- Zhang, Y. Study on Low Cycle Fatigue Crack Propagation of TP347H; Dalian University of Technology: Dalian, China, 2021. [Google Scholar]
- Deng, J.; Tu, W.; Dong, Q.; Dong, D.; Qiu, S. Experimental study on biaxial proportional low-cycle fatigue crack propagation of hull inclined-crack plate based on CTOD. J. Mech. Mater. Struct. 2022, 17, 207–228. [Google Scholar] [CrossRef]
- Shi, K.; Cai, L.; Bao, C.; Wu, S.; Chen, L. Structural fatigue crack growth on a representative volume element under cyclic strain behavior. Int. J. Fatigue 2015, 74, 1–6. [Google Scholar] [CrossRef]
- Chen, L.; Cai, L.X.; Yao, D. A new method to predict fatigue crack growth rate of materials based on average cyclic plasticity strain damage accumulation. Chin. J. Aeronaut. 2013, 26, 130–135. [Google Scholar] [CrossRef]
- Shi, K.; Cai, L.; Qi, S.; Bao, C. A prediction model for fatigue crack growth using effective cyclic plastic zone and low cycle fatigue properties. Eng. Fract. Mech. 2016, 158, 209–219. [Google Scholar] [CrossRef]
- Chen, J.; Huang, Y.; Dong, L.; Li, Y. A study on evaluation method of crack tip reverse plastic zone size for the center cracked steel plate model under tension-compression cyclic loading. Eng. Fract. Mech. 2015, 133, 138–151. [Google Scholar] [CrossRef]
- Gómez Gonzales, G.L.; Ortiz González, J.A.; Antunes, F.V.; Neto, D.M.; Díaz, F.A. Experimental determination of the reversed plastic zone size around fatigue crack using digital image correlation. Theor. Appl. Fract. Mech. 2023, 125, 103901. [Google Scholar] [CrossRef]
- Ding, G.; Anette, M.; Michael, H. Numerical evaluation of fatigue crack growth in polymers based on plastically dissipated energy. Int. J. Fatigue 2017, 94, 89–96. [Google Scholar] [CrossRef]
- Smith, K. Application of the dissipated energy criterion to predict fatigue crack growth of Type 304 stainless steel following a tensile overload. Eng. Fract. Mech. 2011, 78, 3183–3195. [Google Scholar] [CrossRef]
- Wang, J.; Jiang, W.; Wang, Q. Experimental and numerical evaluation of fatigue crack growth rate based on critical plastically dissipated energy. Int. J. Fatigue 2019, 118, 87–97. [Google Scholar] [CrossRef]
- He, W.; Wang, C.; Deng, J.; Xie, D.; Zhang, Z. Effect of single tensile overload on fatigue crack growth behavior based on plastically dissipated energy and critical distance theory. Eng. Fract. Mech. 2020, 223, 106744. [Google Scholar] [CrossRef]
- Zhu, D.; Zhang, W.; Ding, Z.; Kim, J. Investigation of crack propagation driving force based on crystal plasticity and cyclic J-integral. Eng. Fract. Mech. 2023, 289, 109362. [Google Scholar] [CrossRef]
- Zhu, X. Effects of large plastic deformation and residual stress on the path independence of J-integral for cracks in ductile materials. Eng. Fract. Mech. 2023, 277, 108945. [Google Scholar] [CrossRef]
- Goutianos, S.; Bent, F. The application of J integral to measure cohesive laws under large-scale yielding. Eng. Fract. Mech. 2016, 155, 145–165. [Google Scholar] [CrossRef]
- Majidi, H.; Torabi, A.; Golmakani, M. J-integral expression for mixed mode I/II ductile failure prediction of U-notched Al 6061-T6 plates under large-scale yielding regime. Eng. Fract. Mech. 2018, 195, 253–266. [Google Scholar] [CrossRef]
- Wells, A.A. Application of fracture mechanics at the beyond general yielding. Br. Weld. J. 1963, 10, 563–570. [Google Scholar]
- Dugdale, D.S. Yielding of steel sheets containing slits. J. Mech. Phys. Solids 1960, 8, 100–108. [Google Scholar] [CrossRef]
- Diego, F.B.; Rodolfo, F.S.; Claudio, R. J–CTOD relations in clamped SE(T) fracture specimens including 3-D stationary and growth analysis. Eng. Fract. Mech. 2015, 147, 331–354. [Google Scholar]
- Duan, C.; Zhang, S. Further investigation of J-CTOD relationship for clamped SET specimens based on finite element analyses—Part I: Homogeneous materials. Theor. Appl. Fract. Mech. 2022, 121, 103523. [Google Scholar] [CrossRef]
- Shikalgar, T.D.; Dutta, B.K.; Chattopadhyay, J. New J-CTOD empirical correlations for p-SPT specimens. Eng. Fract. Mech. 2021, 254, 107934. [Google Scholar] [CrossRef]
- Chen, J.; Jiang, L.; Huang, Y. A quantitative study on the influence of compressive stress on crack-tip opening displacement. Ocean. Eng. 2017, 143, 140–148. [Google Scholar] [CrossRef]
- Werner, K. The fatigue crack growth rate and crack opening displacement in 18G2A-steel under tension. Int. J. Fatigue 2012, 39, 25–31. [Google Scholar] [CrossRef]
- GB/T 228.1-2021; Metallic Materials-Tensile Tasting-Part 1: Method of Test at Room Temperature. State Administration for Market Regulation of the People’s Republic of China; Standardization Administration of China: Beijing, China, 2021.
- GB/T 15248-2008; The Test Method for Axial Loading Constant-Amplitude Low-Cycle Fatigue of Metallic Materials. The State Administration of Quality Supervision, Inspection and Quarantine of the People’s Republic of China; Standardization Administration of China: Beijing, China, 2008.
- Yu, Z.; Yang, P.; Dong, Q.; Li, Y.; Yao, G. Experimental study on low cycle fatigue crack propagation of CT specimen under constant amplitude and overload. J. Wuhan Univ. Technol. (Transp. Sci. Eng.) 2017, 3, 488–492. [Google Scholar]
- GB/T 21143-2014; Metallic Materials—Unified Method of Test for Determination of Quasistatic Fracture Toughness. State Administration for Market Regulation of the People’s Republic of China; Standardization Administration of China: Beijing, China, 2014.
- GB/T 6398-2017; Standard Test Method for Fatigue Crack Growth Rates of Metallic Materials. State Administration for Market Regulation of the People’s Republic of China; Standardization Administration of China: Beijing, China, 2017.
- Chen, C. Commonly used stress intensity factor for fracture toughness specimens. Phys. Chem. Insp. Newsl. (Phys. Vol.) 1975, 3, 19–27. [Google Scholar]
Disclaimer/Publisher’s Note: The statements, opinions and data contained in all publications are solely those of the individual author(s) and contributor(s) and not of MDPI and/or the editor(s). MDPI and/or the editor(s) disclaim responsibility for any injury to people or property resulting from any ideas, methods, instructions or products referred to in the content. |
© 2024 by the authors. Licensee MDPI, Basel, Switzerland. This article is an open access article distributed under the terms and conditions of the Creative Commons Attribution (CC BY) license (https://creativecommons.org/licenses/by/4.0/).