Article

Characterization of the Structural–Stratigraphic and Reservoir Controls on the Occurrence of Gas Hydrates in the Eileen Gas Hydrate Trend, Alaska North Slope

1
U.S. Geological Survey, Denver, CO 80225, USA
2
National Energy Technology Laboratory, Pittsburg, PA 15236, USA
*
Author to whom correspondence should be addressed.
J. Mar. Sci. Eng. 2024, 12(3), 472; https://doi.org/10.3390/jmse12030472
Submission received: 11 February 2024 / Revised: 25 February 2024 / Accepted: 5 March 2024 / Published: 10 March 2024
(This article belongs to the Section Geological Oceanography)

Abstract

:
One of the most studied permafrost-associated gas hydrate accumulations in Arctic Alaska is the Eileen Gas Hydrate Trend. This study provides a detailed re-examination of the Eileen Gas Hydrate Trend with a focus on the gas hydrate accumulation in the western part of the Prudhoe Bay Unit. This integrated analysis of downhole well log data and published geophysical data has provided new insight on structural, stratigraphic, and reservoir controls on the occurrence of gas hydrates in the Eileen Gas Hydrate Trend. This study revealed the relatively complex nature of the gas hydrate occurrences in the Eileen Gas Hydrate Trend, with gas hydrates present in a series of coarsening upward, laterally pervasive, mostly fine-grained sand beds exhibiting high gas hydrate saturations. Most of the gas hydrate-bearing reservoirs in the Eileen Gas Hydrate Trend are laterally segmented into distinct northwest- to southeast-trending fault blocks, occur in a combination of structural–stratigraphic traps, and are only partially hydrate filled with distinct down-dip water contacts. These findings suggest that the traditional parts of a petroleum system (i.e., reservoir, gas source, gas migration, and geologic timing of the system formation) also control the occurrence of gas hydrates in the Eileen Gas Hydrate Trend.

1. Introduction

Gas hydrates are thought to represent a vast untapped source of energy, with the total amount of gas in the gas hydrate accumulations of the world possibly surpassing the volume of known conventional gas reserves [1,2]. Gas hydrates have also been shown to be a significant natural and human-induced geologic hazard [3,4,5,6,7], and they may play a significant role in the Earth’s carbon cycle and associated global change concerns [8].
Significant advancements have been made in understanding the occurrence, distribution, and characteristics of marine- and permafrost-related hydrates through the investigation of geologic and geophysical data, reservoir modeling, and short-term field production tests [9,10,11,12,13,14,15,16,17,18,19,20,21,22,23,24,25,26,27]. The Alaska North Slope (ANS) contains several confirmed and potential gas hydrate accumulations. Our understanding of the geologic controls on the occurrence of gas hydrates in northern Alaska became possible in part because of the long history of conventional oil and gas exploration and development on the ANS [13]. These exploration and development activities provided the necessary geologic data to study and assess the occurrence of gas hydrates and identify sites for potential gas hydrate scientific drilling and production testing.
The Eileen Gas Hydrate Trend along the western margin of the Prudhoe Bay oil field on the ANS is one of the most extensively studied gas hydrate accumulations in the world [13,14,15,16,17,18,19,20,21,28,29,30,31,32,33,34,35,36,37] and has been the target of three gas hydrate scientific field stratigraphic and production testing programs: Mount Elbert 1 (Mount Elbert) [15,16], Iġnik Sikumi 1 (Iġnik Sikumi) [29,30], and the Hydrate-01 [2,17,18,19,35,36,37] test well projects. The results from these studies provided the data needed to further develop and calibrate geophysical and well log analysis methods used to characterize gas hydrate accumulations in both arctic permafrost and marine environments [14,18,36,37,38]. The production studies associated with the well tests in the Eileen Gas Hydrate Trend supplied important gas hydrate reservoir engineering data and provided insight into gas hydrate production concepts along with data to calibrate gas hydrate production simulators [19,20,21,28,31]. The gas hydrate-bearing reservoirs in and around the area of the Prudhoe Bay Unit (PBU) L-Pad have been the focus of several detailed geologic and geophysical studies in support of the 2011/2012 Iġnik Sikumi gas hydrate production test well project [28,29,30,32].
The objective of this study was to review our existing understanding of the occurrence of gas hydrates on the ANS and, with recently acquired new data and new approaches, re-examine the occurrence and geologic controls on gas hydrate accumulations in the ANS Eileen Gas Hydrate Trend, focusing on the area of the PBU L-Pad and the site of the Iġnik Sikumi test well (Figure 1). Relative to previous analyses performed in the area [15,18,28,29,30,32,34,36,37], this investigation utilized borehole logs from an additional 69 wells and considered the results of published seismic framework studies [17,18,28,30,32]. This allowed us to expand the geologic framework to improve our understanding of the local and regional occurrence of gas hydrates in the Eileen Gas Hydrate Trend. A new Archie-based resistivity log analysis method that includes special consideration for the physical meaning of the empirical parameters within the Archie relationship [14,39] was used along with more advanced log and core analysis methods to generate a more complete gas hydrate reservoir saturation model for the Eileen Gas Hydrate Trend. In addition, the acquisition of nuclear magnetic resonance (NMR) well logs and formation test data from the Mount Elbert [14,16] and Iġnik Sikumi [29,30,32] test wells provided critical information on the porosity and permeability relationships in gas hydrate reservoirs within the Eileen Gas Hydrate Trend. More recently, the analysis of well log data and sidewall pressure cores acquired from the Hydrate-01 well [17,18,35,36,37] has provided additional important insight into the reservoir properties of the gas hydrate-bearing reservoirs in the Eileen Gas Hydrate Trend. In this study, we have further reviewed the results and geologic findings from the prior gas hydrate test well projects that have been integrated with the analysis of downhole logs and other geologic data acquired from industry wells that have been drilled for other purposes. These integrated data sets and new analytical approaches have been used in this study to examine in greater detail the structural, stratigraphic, and reservoir controls on the occurrence of gas hydrates in the Eileen Gas Hydrate Trend. We have also described how the results of the Mount Elbert [14,15,16,33] and Hydrate-01 well [18,35,36,37] geologic research efforts have contributed to this study.

2. Background

2.1. Geological Controls on the Occurrence of Gas Hydrates—Marine and Arctic Permafrost Environments

Collett et al. [9] were the first to propose that the geologic controls on the occurrence of gas hydrates in marine and permafrost environments could be grouped into what have been collectively known as the “methane hydrate petroleum systems” and eventually “gas hydrate systems.” In recent years, significant progress has been made in addressing key issues related to the formation, occurrence, and stability of gas hydrates in nature. The concept of a gas hydrate system, similar to the concept that guides conventional oil and gas exploration (as adapted from Magoon and Dow [41]), has been developed to systematically assess the geologic controls on the occurrence of gas hydrates in nature [9,10]. In a gas hydrate system, the individual factors that contribute to the formation of gas hydrate accumulation can be identified and assessed; the most important include (1) gas hydrate pressure–temperature stability conditions, (2) gas source, (3) gas migration, (4) availability of water, (5) suitable host sediment or reservoir, and (6) the timing of the gas hydrate system’s development.
Another key development in our understanding of the geologic controls on the formation, occurrence, and stability of gas hydrates has come from field system modeling [26,42]. Published system models dealing with the formation and evolution of gas hydrate systems in the Gulf of Mexico [23,24], offshore New Zealand [22], and in the Danube Fan of the Black Sea [25] have provided the gas hydrate research community with the critical tools to quantitatively characterize various gas hydrate systems.
One of the important factors linking the formation of highly concentrated pore-filling gas hydrate accumulations in both marine and Arctic permafrost terrestrial environments, as examined in this study, is the presence of relatively coarse-grained sediments with the porosity and permeability needed to support the migration and accumulation of gas and the nucleation of gas hydrates. This same configuration has been shown to be conducive to production by conventional depressurization technologies [2]. The results of seismic stratigraphic analysis and the examination of downhole logging and sediment coring data acquired by industry and scientific drilling have confirmed the presence of highly saturated gas hydrate accumulations in coarse-grained, often sand-rich, depositional systems in the northern portion of the Gulf of Mexico [38,43,44,45], along the Nankai Trough continental margin of Japan [46,47,48,49,50,51,52], and throughout the Krishna–Godavari Basin in the offshore of India [53,54,55] and China [56,57], all of which represent ideal sites for continuing gas hydrate energy resource studies.
Studies associated with the Gulf of Mexico Joint Industry Project provided the initial indication of the occurrence of highly concentrated gas hydrate accumulations associated with coarse-grained reservoir systems in the Gulf of Mexico [58]. The University of Texas-Gulf of Mexico 2-1 (UTGOM2-1) Hydrate Pressure Coring Expedition, conducted in 2017 in the area of Green Canyon Block 955, yielded direct evidence for the occurrence of gas hydrates at high concentrations within an interbedded sandy silt and clayey silt reservoir turbidite channel system [38,43,44,45].
High-resolution seismic facies analysis and the examination of downhole log and core data from the Tokai–Kumano forearc basin along the Nankai Trough continental margin of Japan, acquired during several industry drilling programs led by the Japan Oil, Gas, and Metals National Corporation, have revealed the presence of highly concentrated gas hydrate occurrences in sandy sediments deposited within deep marine fan systems often associated with channel facies that onlap against structural highs forming stratigraphic traps [47,49,50,51,52]. The interpreted facies of the highly interbedded fine- to coarse-grained gas hydrate reservoir system in the Nankai Trough region range from basin-floor to slope and slump to fan channel facies.
The National Gas Hydrate Program Expedition 02, executed in the offshore of India, established the existence of a widely distributed, highly concentrated gas hydrate system in what has been named Area C of the Krishna–Godavari Basin [53,54,55]. The discovered interconnected depositional system that extends from an upper continental slope channelized system downslope to a prominent channel-levee system and finally a thick succession of basin-floor fans at the base of the slope provides the coarse-grained reservoirs suitable for the occurrence of highly concentrated gas hydrate accumulations. Area B in the Krishna–Godavari Basin, as defined by a large anticlinal structure, is characterized by two prominent reservoir systems exhibiting characteristics of a sand-rich debris flow. The gas hydrate-bearing reservoir system in Area B is characterized by an interbedded section of thinly bedded coarse- and fine-grained reservoir and non-reservoir layers with a higher-quality portion of logged and cored sections containing gas hydrates at high concentrations [54].
Much like our study here of the Eileen Gas Hydrate Trend in northern Alaska, integrated analysis of acquired downhole logging and core data, along with regional seismic studies, has provided similar insight into the deepwater geologic processes that have produced the coarse-grained (often sand-rich) sedimentary facies and associated porous/permeable reservoirs required for the formation of highly concentrated marine gas hydrate accumulations.

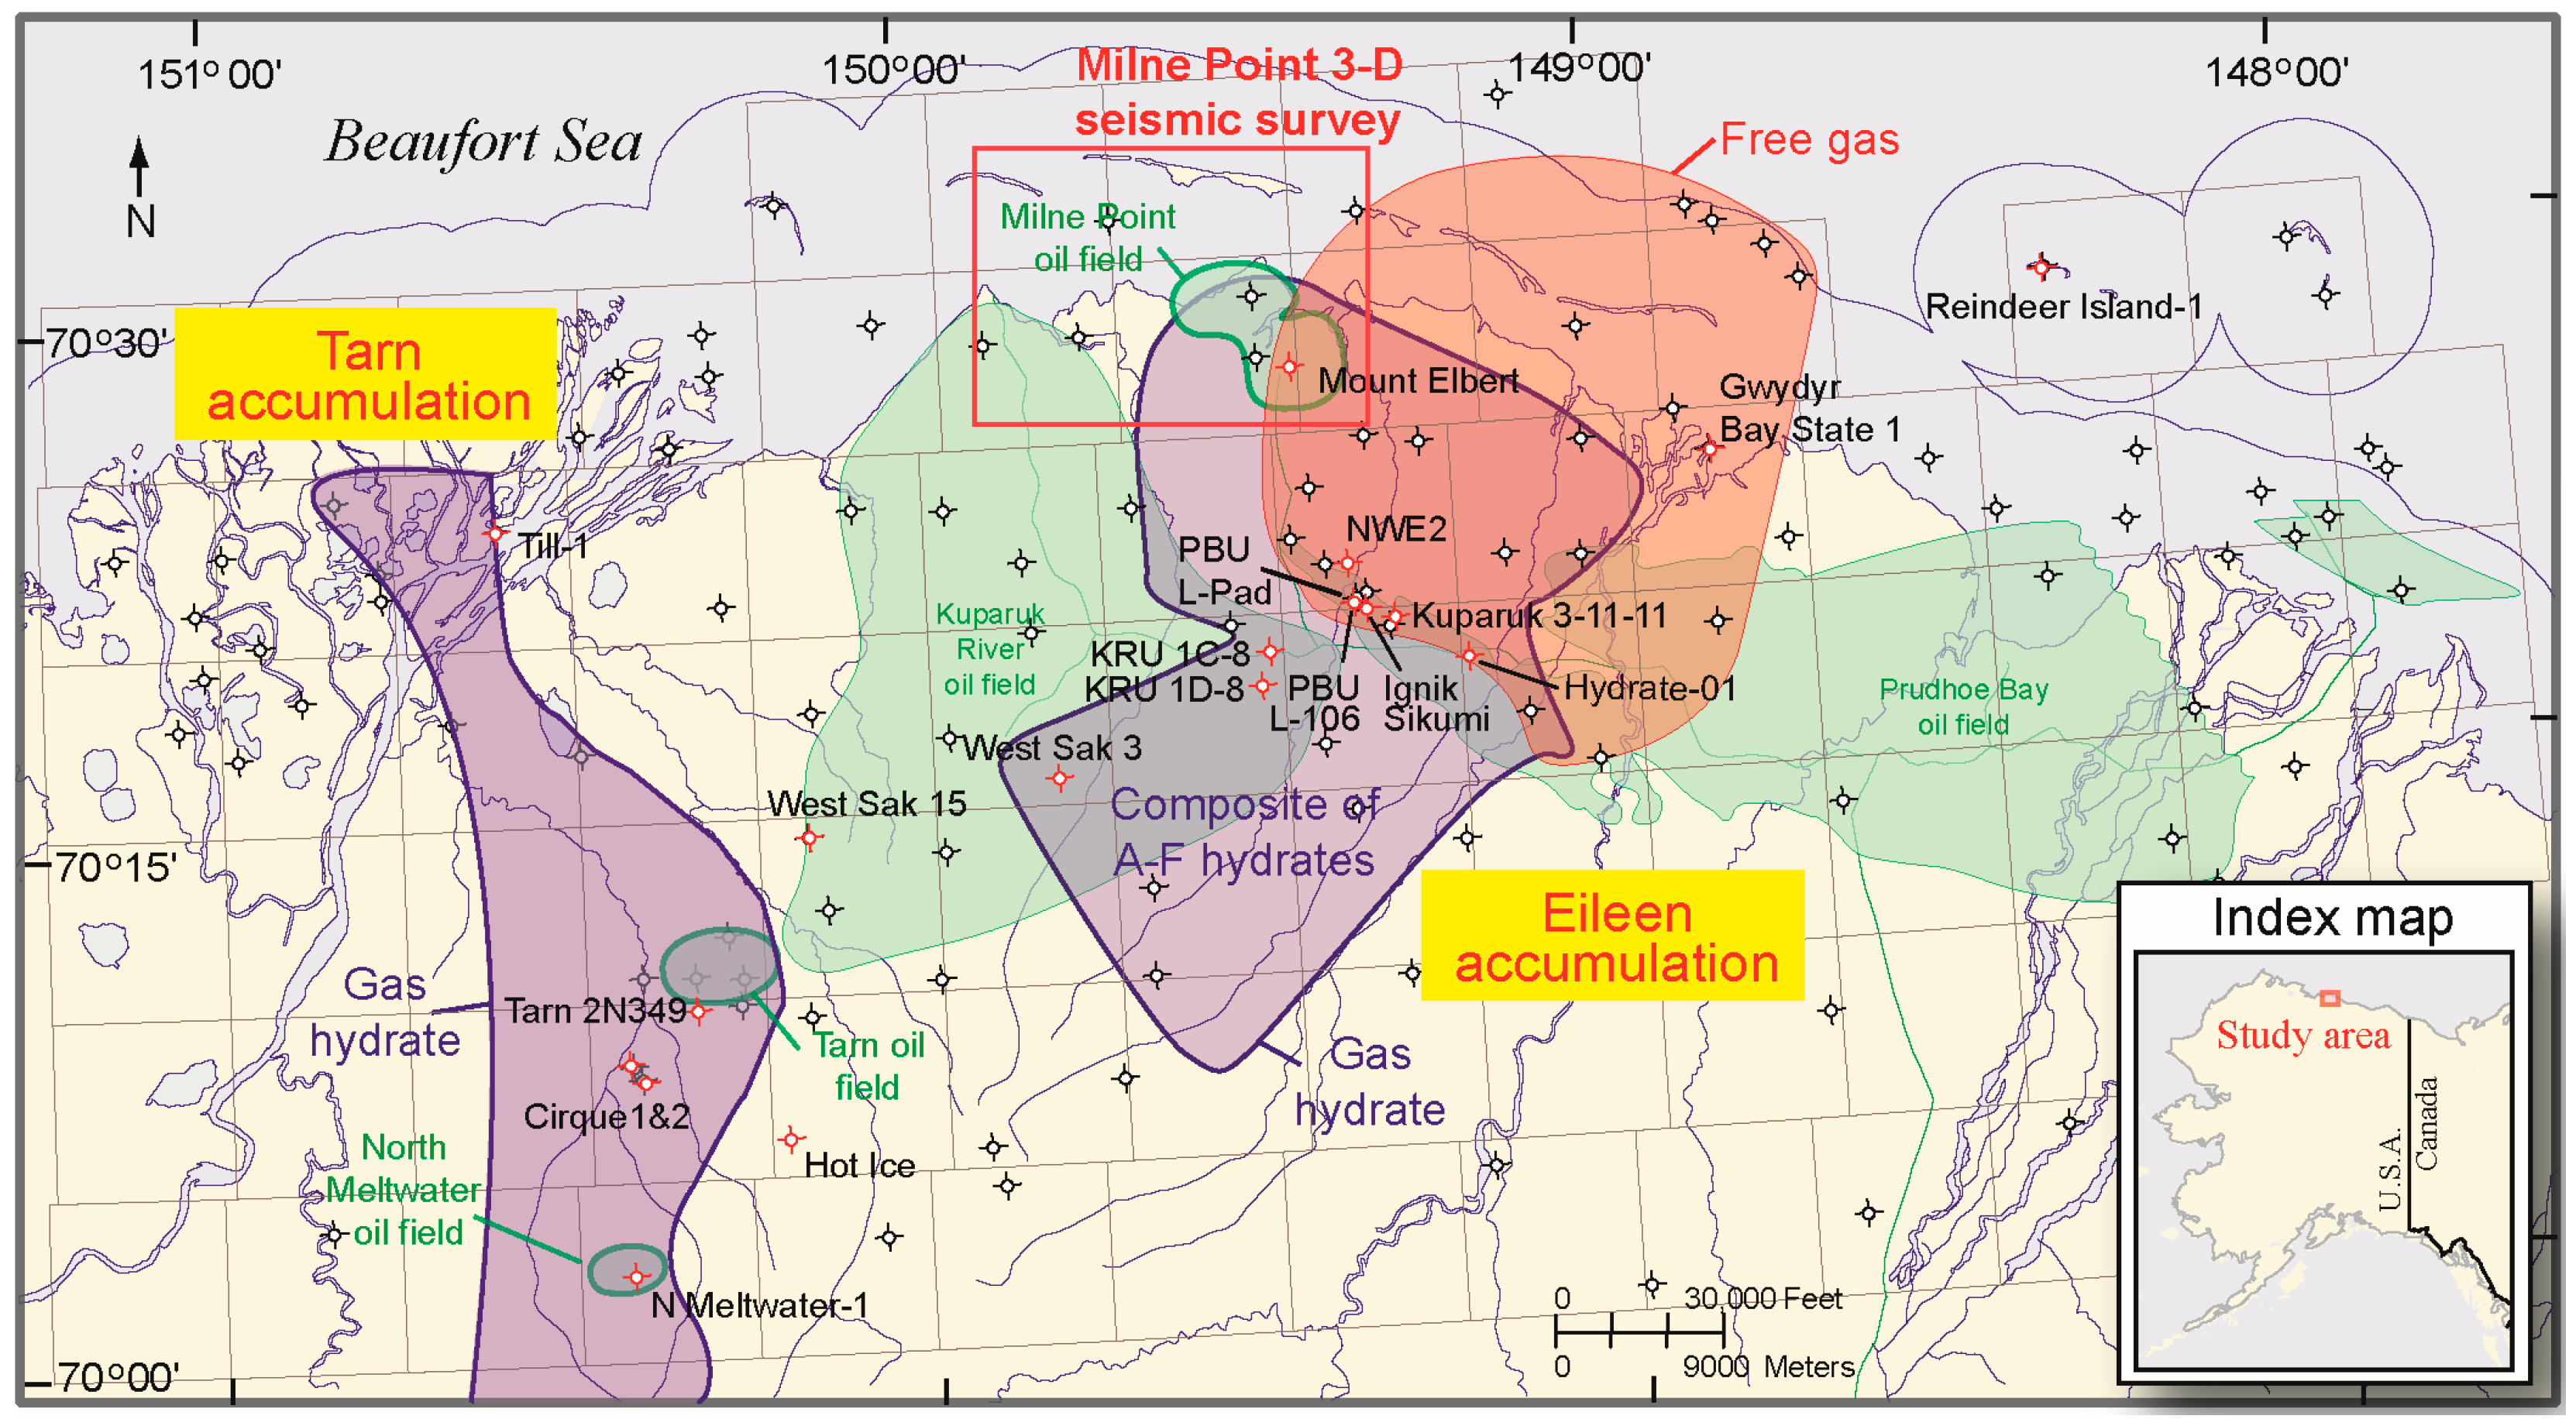
2.2. Geologic Controls on the Occurrence of Gas Hydrates—Alaska Eileen Gas Hydrate Trend

The occurrence of gas hydrates on the ANS is closely associated with a well-characterized petroleum system. The distribution of the gas hydrate stability zone (GHSZ) on the ANS is presented by Collett et al. [13] and reported by the U.S. Geological Survey (USGS) Alaska Gas Hydrate Assessment Team [40] in a series of maps showing the spatial limit, depth to top and base, and calculated thickness. The offshore extent of the stability zone is not well defined due to a lack of data but could extend to the current water depth of 120 m (~394 ft) [13]. More recent studies, however, suggest that the present-day GHSZ on the Alaskan Beaufort continental shelf may only extend to water depths of about 20 m (~66 ft) [59,60,61].
Evidence for the existence of gas hydrates on the ANS comes directly from analyses of cores and well log data obtained from one industry test well (the Northwest Eileen State 2 (NWE2) well) and three gas hydrate research wells (Mount Elbert, Iġnik Sikumi, and Hydrate-01), as well as indirectly from well log data obtained from more than 1000 wells across the ANS. Most permafrost-associated gas hydrate accumulations probably developed from preexisting free gas fields that originally formed in conventional hydrocarbon traps, which were later converted to gas hydrates upon the onset of glaciation and cold arctic conditions [13,16,62,63].
The first direct evidence of the existence of gas hydrates on the ANS was obtained in 1972 with cores, well logs, and pressure test data from the NWE2 test well, located in the northwest part of the Prudhoe Bay oil field [13], which later became known as the Eileen Gas Hydrate Trend (Figure 1). In 1992, the ARCO Cirque #1 and #2 wells and the ARCO Tarn #2 well, drilled near the western edge of the Kuparuk River oil field [13,64], encountered a thick gas hydrate-bearing interval near the base of the permafrost, which is now known to be a part of the Tarn Gas Hydrate Trend (Figure 1) [13]. The Tarn Gas Hydrate Trend is less studied because it resides mostly within permafrost, making the reservoir colder and less favorable for the production of gas [2].
The Eileen Gas Hydrate Trend, when first described [13], is composed of six laterally continuous gas hydrate-bearing stratigraphic units. Many of the wells that penetrated the Eileen Gas Hydrate Trend recorded multiple gas hydrate-bearing sand-rich intervals within these units, with individual occurrences ranging from 3 to 30 m (10 to 99 ft) thick. The Eileen Gas Hydrate Trend can be traced throughout the eastern part of the Kuparuk River oil field, the southern part of the Milne Point field, and the western part of the Prudhoe Bay field. The six gas hydrate-bearing sedimentary units were assigned reference letters, units A through F, with unit A being the deepest and oldest (Figure 1) [13].
The gas hydrate-bearing reservoirs in the Eileen Gas Hydrate Trend are cut by a series of northwesterly trending faults [65,66] that appear in some cases to be connected to deeper faults that extend into the deeply buried Prudhoe Bay and Kuparuk River oil and gas fields. Methane, which originated from microbial and thermogenic sources, is the dominant gas in the Eileen Gas Hydrate Trend. Thermogenic methane likely migrated along fault systems from deeper sources associated with the Prudhoe Bay Sadlerochit Group [13].
The Mount Elbert Gas Hydrate Stratigraphic Test Well was drilled in 2007 to test one of the larger seismic-inferred gas hydrate prospects along the northern edge of the Eileen Gas Hydrate Trend in the Milne Point oil field (Figure 2 and Figure 3) [15]. The Mount Elbert well was cored, logged, and tested, providing the first comprehensive data collection on gas hydrate occurrences in northern Alaska. Four potential gas hydrate-bearing stratigraphic units were identified, units B through E. Analysis of well log, core, and seismic data concluded that the distribution of gas hydrates in this portion of the Eileen Gas Hydrate Trend is controlled by a combination of complex stratigraphic and structural relationships [15,16]. Predicted and data-derived pore-filling gas hydrate saturations correlated closely with reservoir quality and demonstrated sensitivity to modest lateral and vertical changes in reservoir properties [16], suggesting that stratigraphically-driven lateral variations in reservoir quality are an important control on the occurrence of gas hydrates. Boswell et al. [16] further concluded that the gas hydrates in the Mount Elbert prospect originally formed as free gas pools within combined structural and stratigraphic traps. Boswell et al. [16] postulated that free gas migrated up the western bounding fault, entered the structure, and was trapped within the sand reservoir units. The lack of gas in the deeper unit B is likely due to non-conducive trapping geometries. The free gas trapped in units C and D was later converted to gas hydrates with the onset of permafrost and gas hydrate stability conditions [13,15,16].
The analysis of the available log data from existing industry wells in the area led to the identification of the PBU L-Pad area as the most optimal site for long-term gas hydrate production testing [28,29,30,32]. The 2011 Iġnik Sikumi field program included drilling a single, near-vertical test well and performing extensive wireline logging through a thick section of gas hydrate-bearing sand reservoirs (Figure 3, Figure 4 and Figure 5). A total of three hydrate-bearing stratigraphic units previously described as units C, D, and E were encountered in the Iġnik Sikumi test well. In this case, unit C was further subdivided into a lower unit C and an upper unit C, also named C-1 and C-2, respectively, in other publications [16,17,28,29]. In comparison to the upper unit C, the lower unit C is more heterogeneous, with a high number of interbedded, prominent clay-rich beds [16,28,29,30]. Sandy intervals below the hydrate-bearing portion of the upper unit C and in unit B are mostly water-bearing. NMR-density porosity analysis of gas hydrate saturations yielded gas hydrate saturations > 75% in the more uniformly bedded upper unit C.
The Hydrate-01 well was drilled in 2018 [17,18,35,36,37] as a stratigraphic test well in the western portion of the PBU to verify the geological and reservoir conditions at a proposed gas hydrate production test site (Figure 1). Data collected from the well confirmed the occurrence of highly saturated (~70%) (pore-filling) gas hydrate-bearing reservoirs [17,18,35,36,37] in the identified targets within the unit B and unit D Eileen Gas Hydrate Trend stratigraphic units. Unit B, the deeper of the two reservoirs, is composed of a range of well-sorted, very fine-grained sand to coarse silt. The hydrate was interpreted to be filling 65% to more than 80% of the porosity in the upper 40 feet of unit B [17,18,36,37]. Unit D, the shallower of the two reservoirs, exhibited similar gas hydrate saturations to those observed for unit B. With the success of the Hydrate-01 stratigraphic test well, the project leadership group developed plans to drill a geologic data well and production test wells [17].
The acquisition of research-quality downhole log data and sidewall pressure cores from the Hydrate-01 well, along with a three-dimensional (3-D) vertical seismic profile (VSP) survey, provided critical new insight into the geologic controls on the occurrence of gas hydrates in the Eileen Gas Hydrate Trend [4,17,18,36,37]. Tamaki et al. [18] confirmed the regional structural trends observed in previous studies [13,65,66] with down-to-the-east normal faulting that offsets the reservoir units across the Hydrate-01 well area, with a prominent northeast-dipping relay structure associated with overstepping imaged normal faults. As examined by Tamaki et al. [18], the Hydrate-01 well log data confirm the presence of highly saturated gas hydrate occurrences in the B1 and D1 sand reservoirs associated with unit B and unit D, respectively. The analysis of the log data from the Hydrate-01 well also confirmed that the base of the gas hydrate occurrence in the B1 and D1 sands was at the same depth as the 7-11-12 well that had been previously drilled from the same site as an industry exploratory well that had targeted deeper conventional oil-bearing reservoir sections. Tamaki et al. [18] confirmed the previous insight gained from the Mount Elbert Stratigraphic Test Well [13,15,16] that the presence of highly saturated gas hydrate occurrences in the Eileen Gas Hydrate Trend is controlled by a series of complex structural stratigraphic relationships. For the B1 sands, the seismic mapping indicated subtle structural highs around the Hydrate-01 well, similar to those observed associated with the Mount Elbert well. Seismic reflection imaging of the D1 sands, however, reveals a gentle dipping structure that is bounded between overstepping faults.
The addition of the integrated analysis of sidewall pressure core data and nuclear magnetic (NMR) well log data from the Hydrate-01 well by Tamaki et al. [18] and Yoneda et al. [36,37] yielded the petrophysical data needed to further assess the reservoir controls on the occurrence of gas hydrates in the B1 and D1 reservoir sands. The comparison of core and well log-derived gas hydrate saturation, porosity, and permeability data from the Hydrate-01 well with the gas hydrate saturation and porosity data from the 7-11-12 well shows a sharp transition in both the B1 and D1 sands from high gas hydrate saturations to water-saturated reservoir sections. For the D1 sand in both the 7-11-12 and Hydrate-01 wells, the available well log and core data reveal a common gas hydrate/water contact between the two wells. However, the reservoir quality is likely sufficient to host gas hydrates at the base of the D1 sands, thus suggesting insufficient gas to charge the D1 reservoir section. For the B1 sands, however, the reservoir quality portion of the section appears to be fully saturated with gas hydrates to its petrophysical limit (as defined later in this paper), with gas hydrate saturations reduced with depth, which correlates with well log- and core-inferred reservoir quality reductions with depth.

3. Methods and Results

3.1. Reservoir Controls on the Occurrence of Gas Hydrates in the Eileen Gas Hydrate Trend

Well logs have been used to assess the occurrence of gas hydrates in numerous sedimentary basins [14]. This study used well logs to delineate and characterize the properties of the gas hydrate-bearing reservoirs in the area of the PBU L-Pad. For a more complete review of well log responses to the presence of gas hydrates, see Collett and Lee [14], Collett et al. [28], and Schoderbek et al. [30].

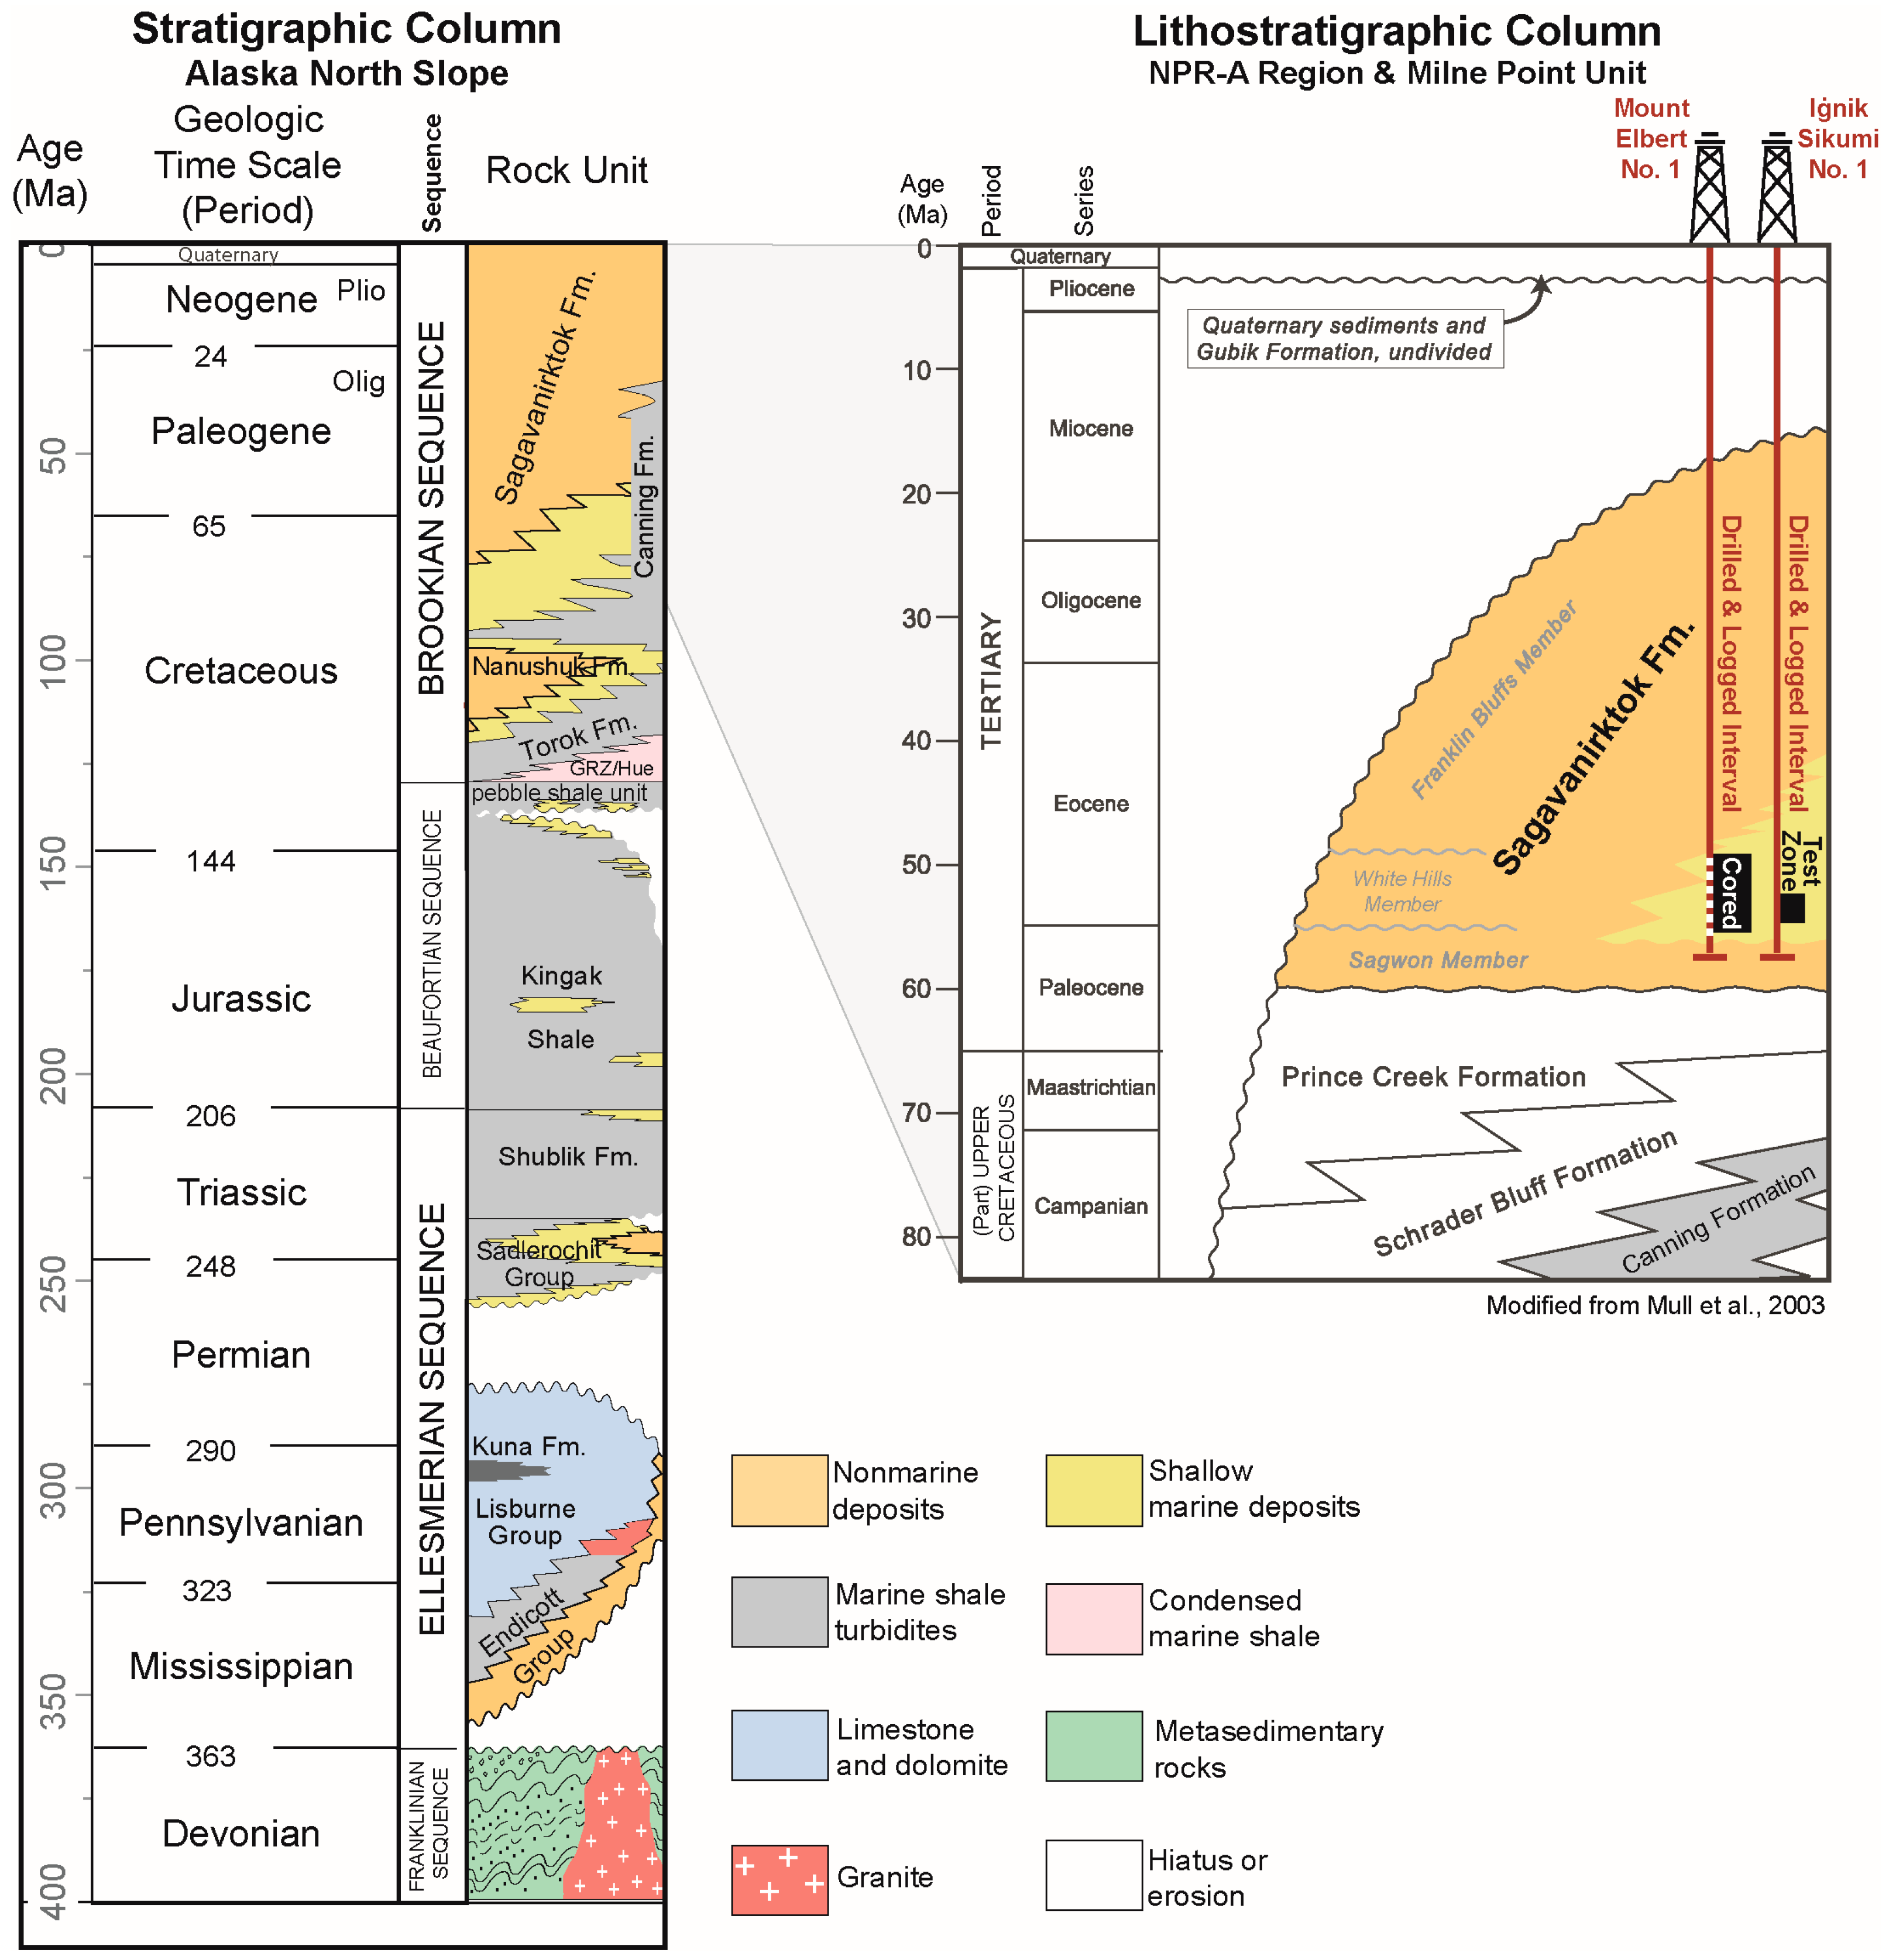
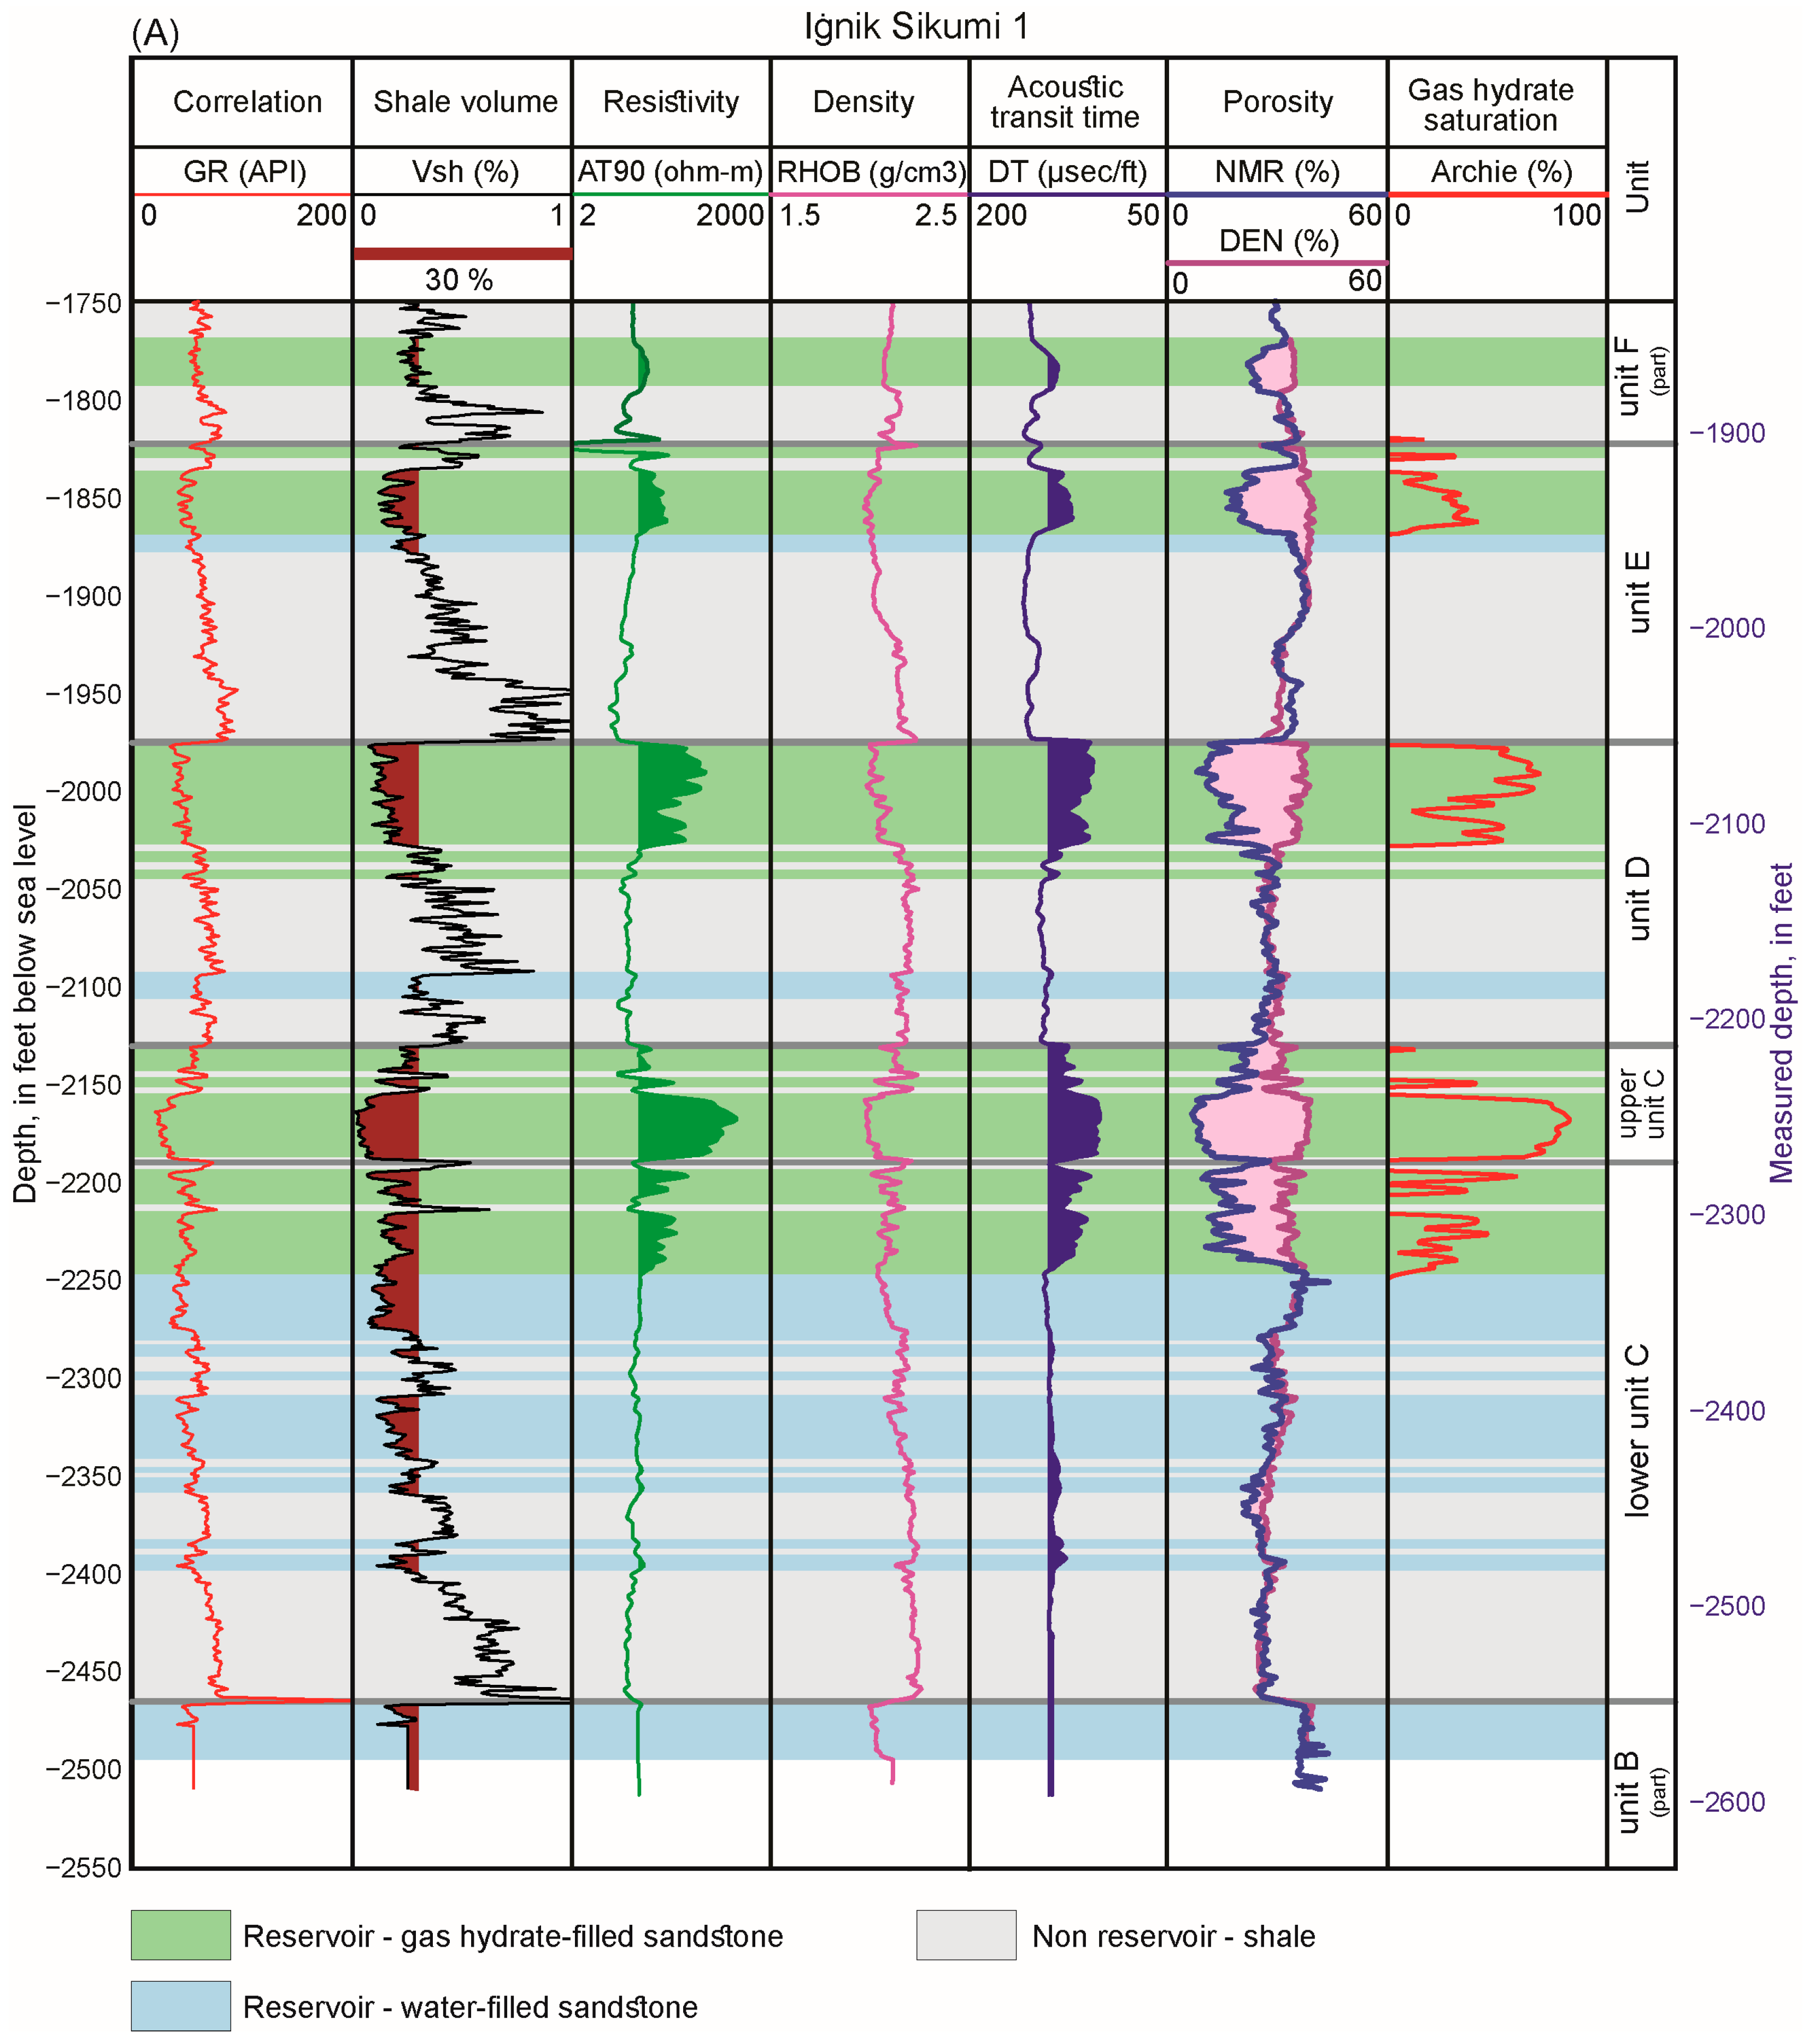
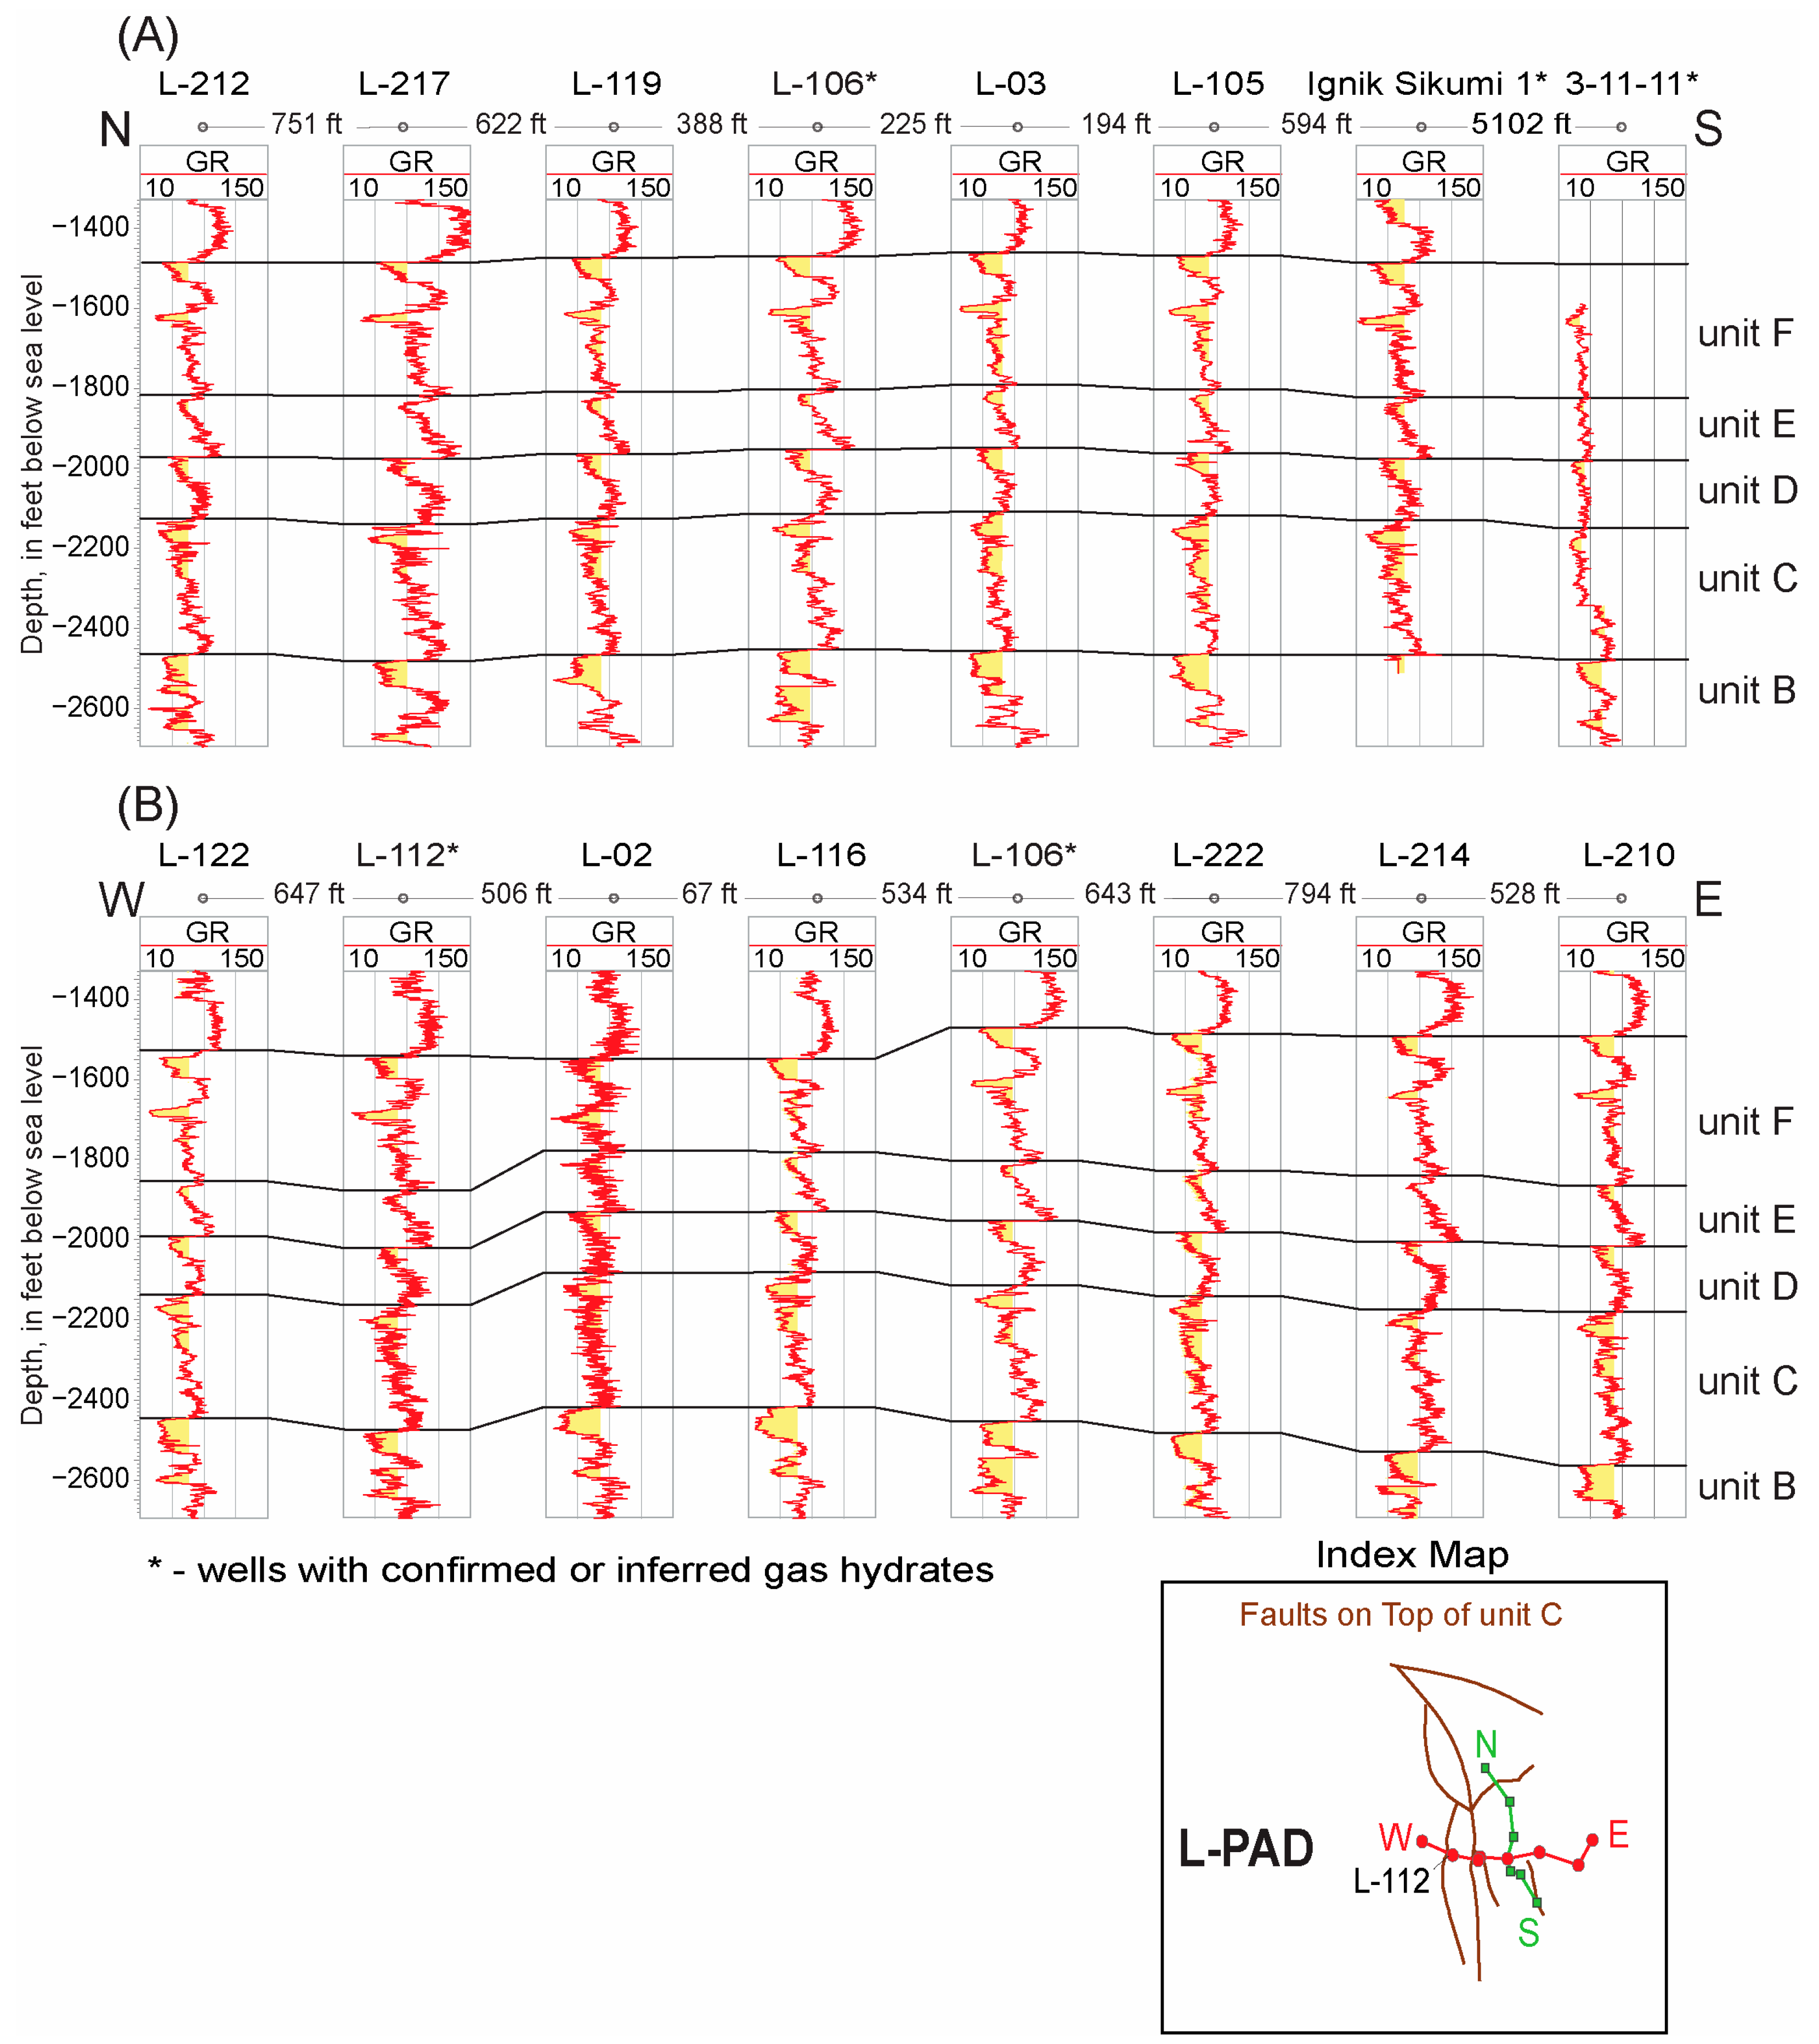
3.1.1. Reservoir Lithology

Clay content, which is often referred to as shale volume (Vsh) in conventional reservoir analysis, is one of the primary factors controlling the occurrence and concentration of oil and gas in conventional reservoir systems [68]. Collett and Lee [14] also recognized that the occurrence of pore-filling gas hydrates in clastic reservoir sections is controlled, in part, by the presence of clay. In our study of the occurrence of gas hydrates in the area of the PBU L-Pad, the Vsh within the log-inferred gas hydrate intervals was calculated from gamma ray logs using standard log analysis procedures for the type and age of sedimentary sections in the Eileen Gas Hydrate Trend. The relationship between gamma ray log values and Vsh used in our study area is shown in Equations (1) and (2) [69]:
I G R = G R G R c l n G R s h G R c l n
V s h = 0.083   ( 2 3.7 I G R 1 )
where IGR is a gamma ray index or volume of shale, GR is a gamma ray log value, GRcln is a constant gamma ray value for the cleanest (i.e., lowest shale content) sand in the reservoir section (lowest American Petroleum Institute (API) log value), GRsh is a constant gamma ray value for a pure shale in the sedimentary section (the highest API log value), and Vsh is a volume of shale corrected for tertiary rocks, which is partially related to the degree of compaction that the sedimentary section has experienced.
Gamma ray logs from a total of 90 wells located on and near the PBU L-Pad (Figure 6 and Figure 7) were used to calculate Vsh in each well for the targeted reservoir sections of interest, from unit B through E. Since gamma ray logs were not normalized in this study, the clean sand and shale baselines required for the Vsh calculations (Equations (1) and (2)) were selected on a well-by-well basis. For the sand-dominated portions of reservoir units C and D, the estimated Vsh ranged from near 0% to a maximum of about 30%.

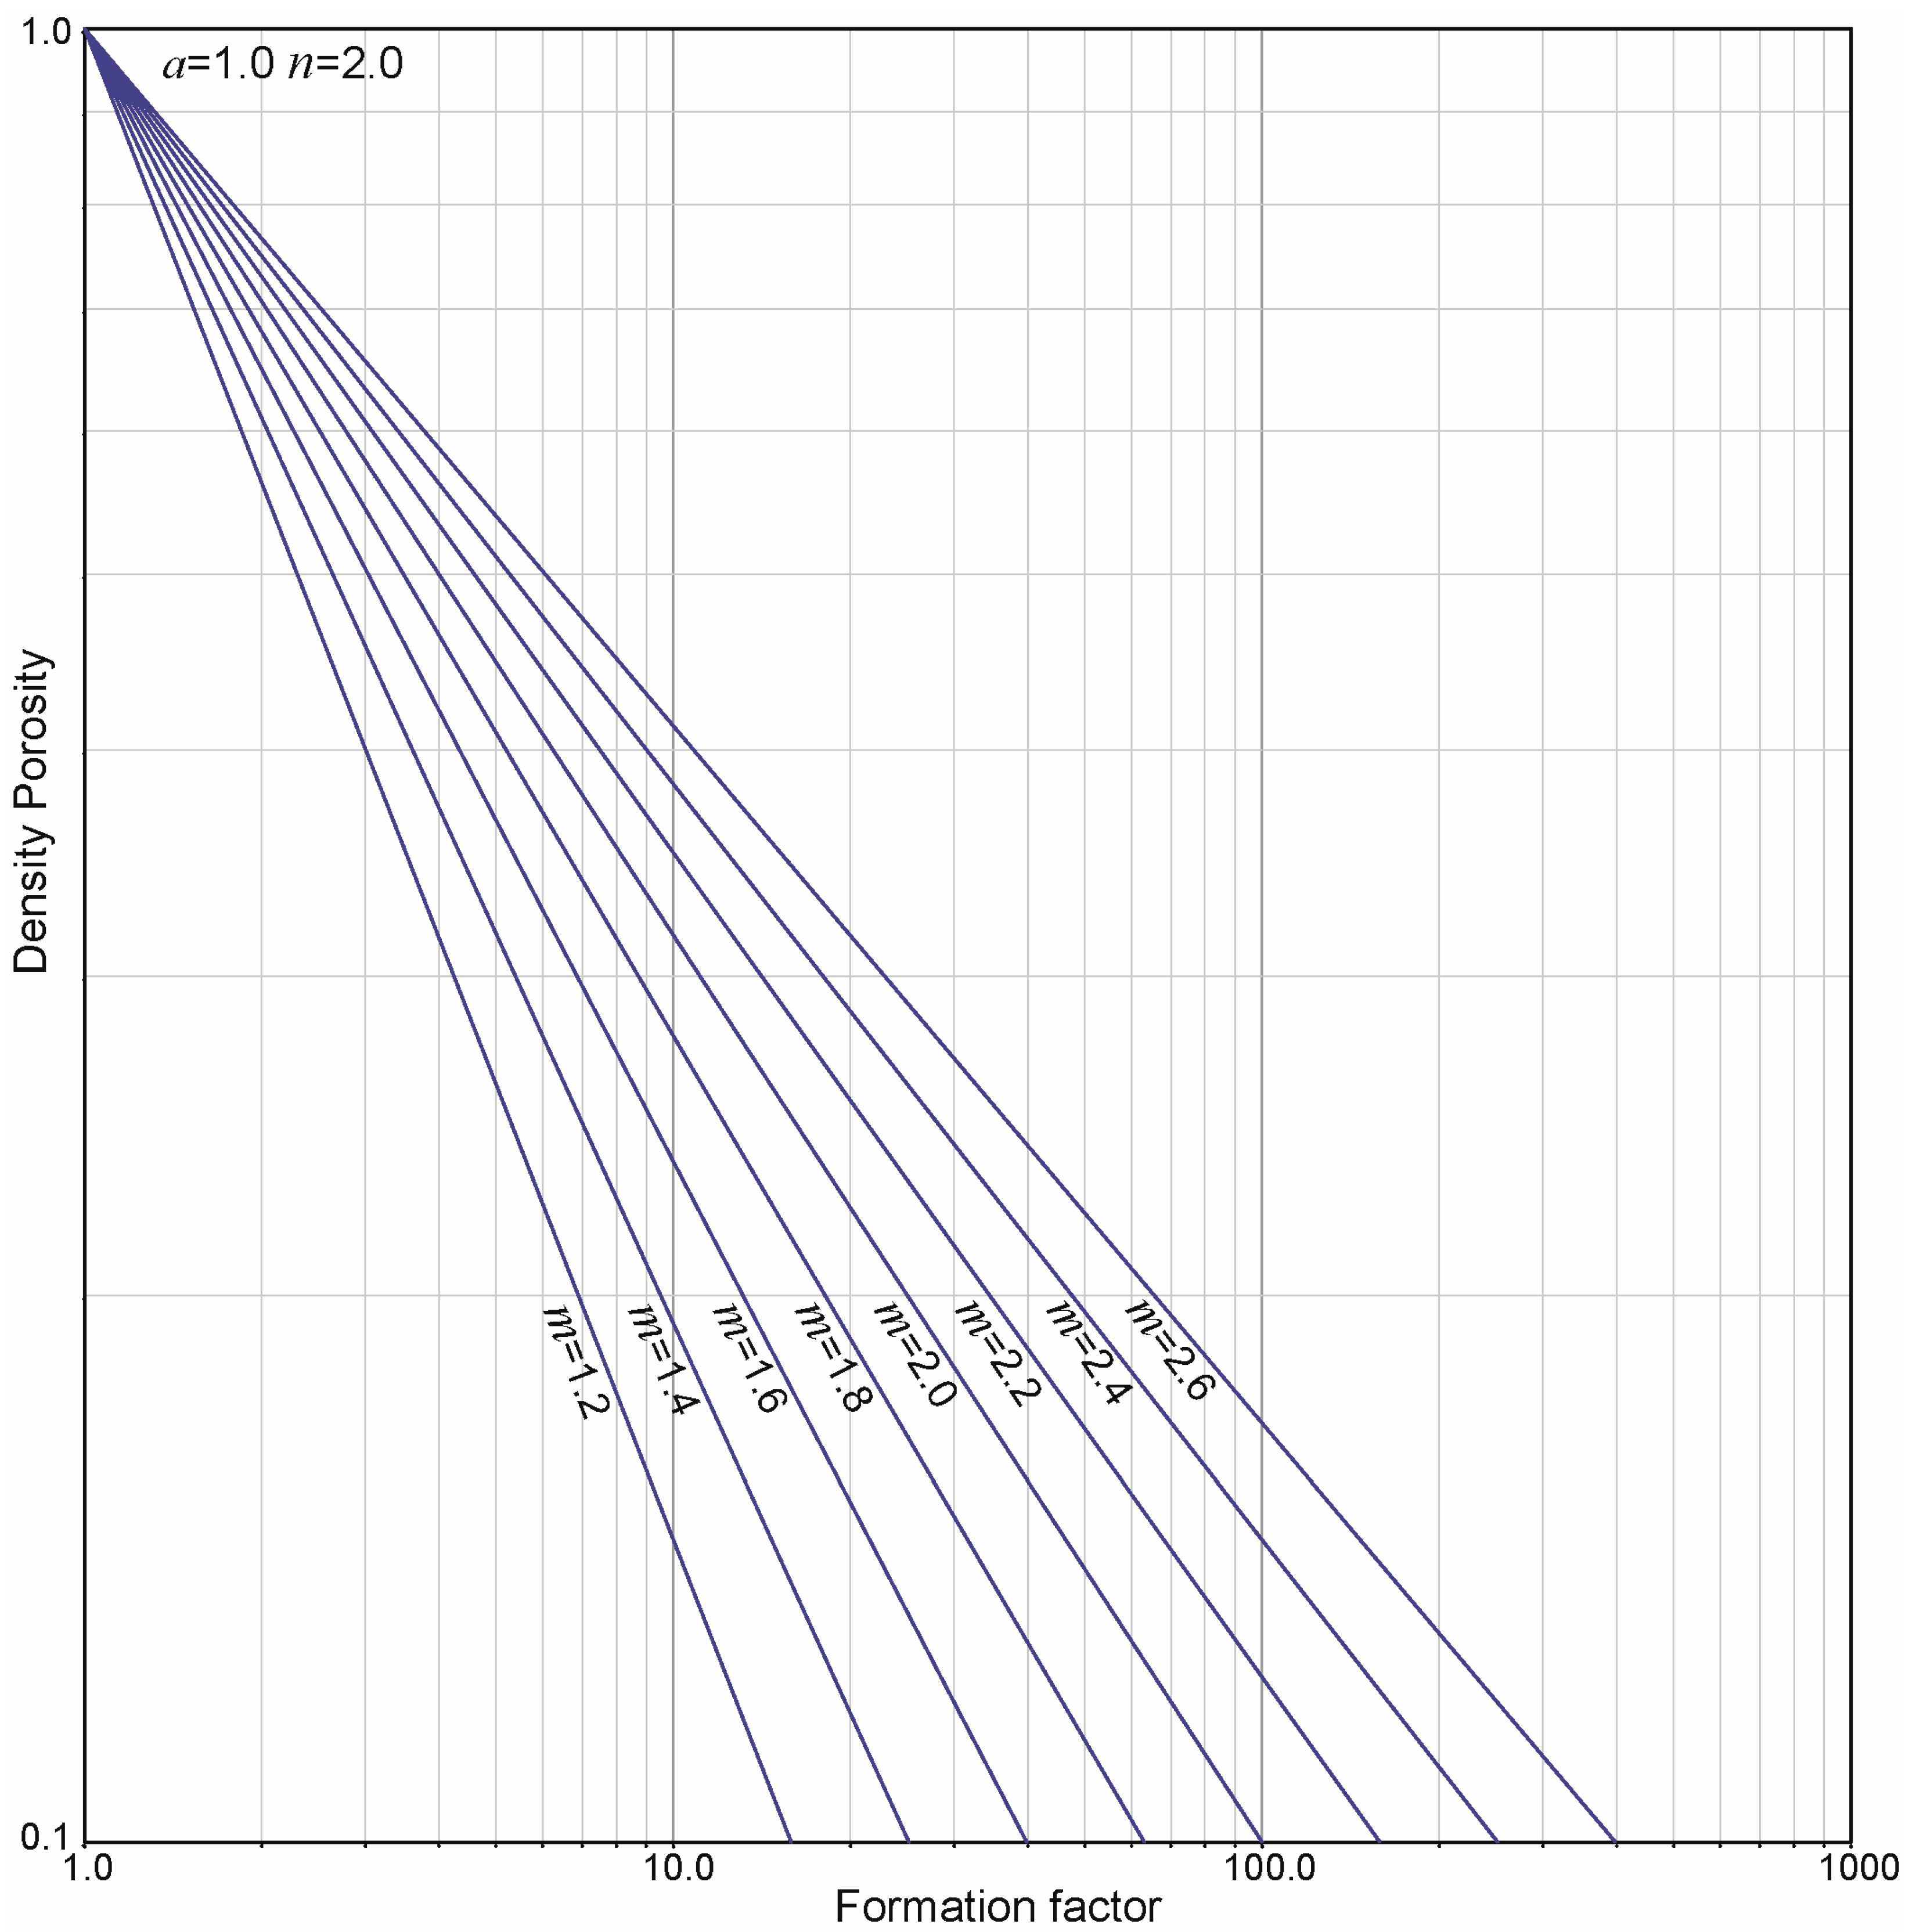
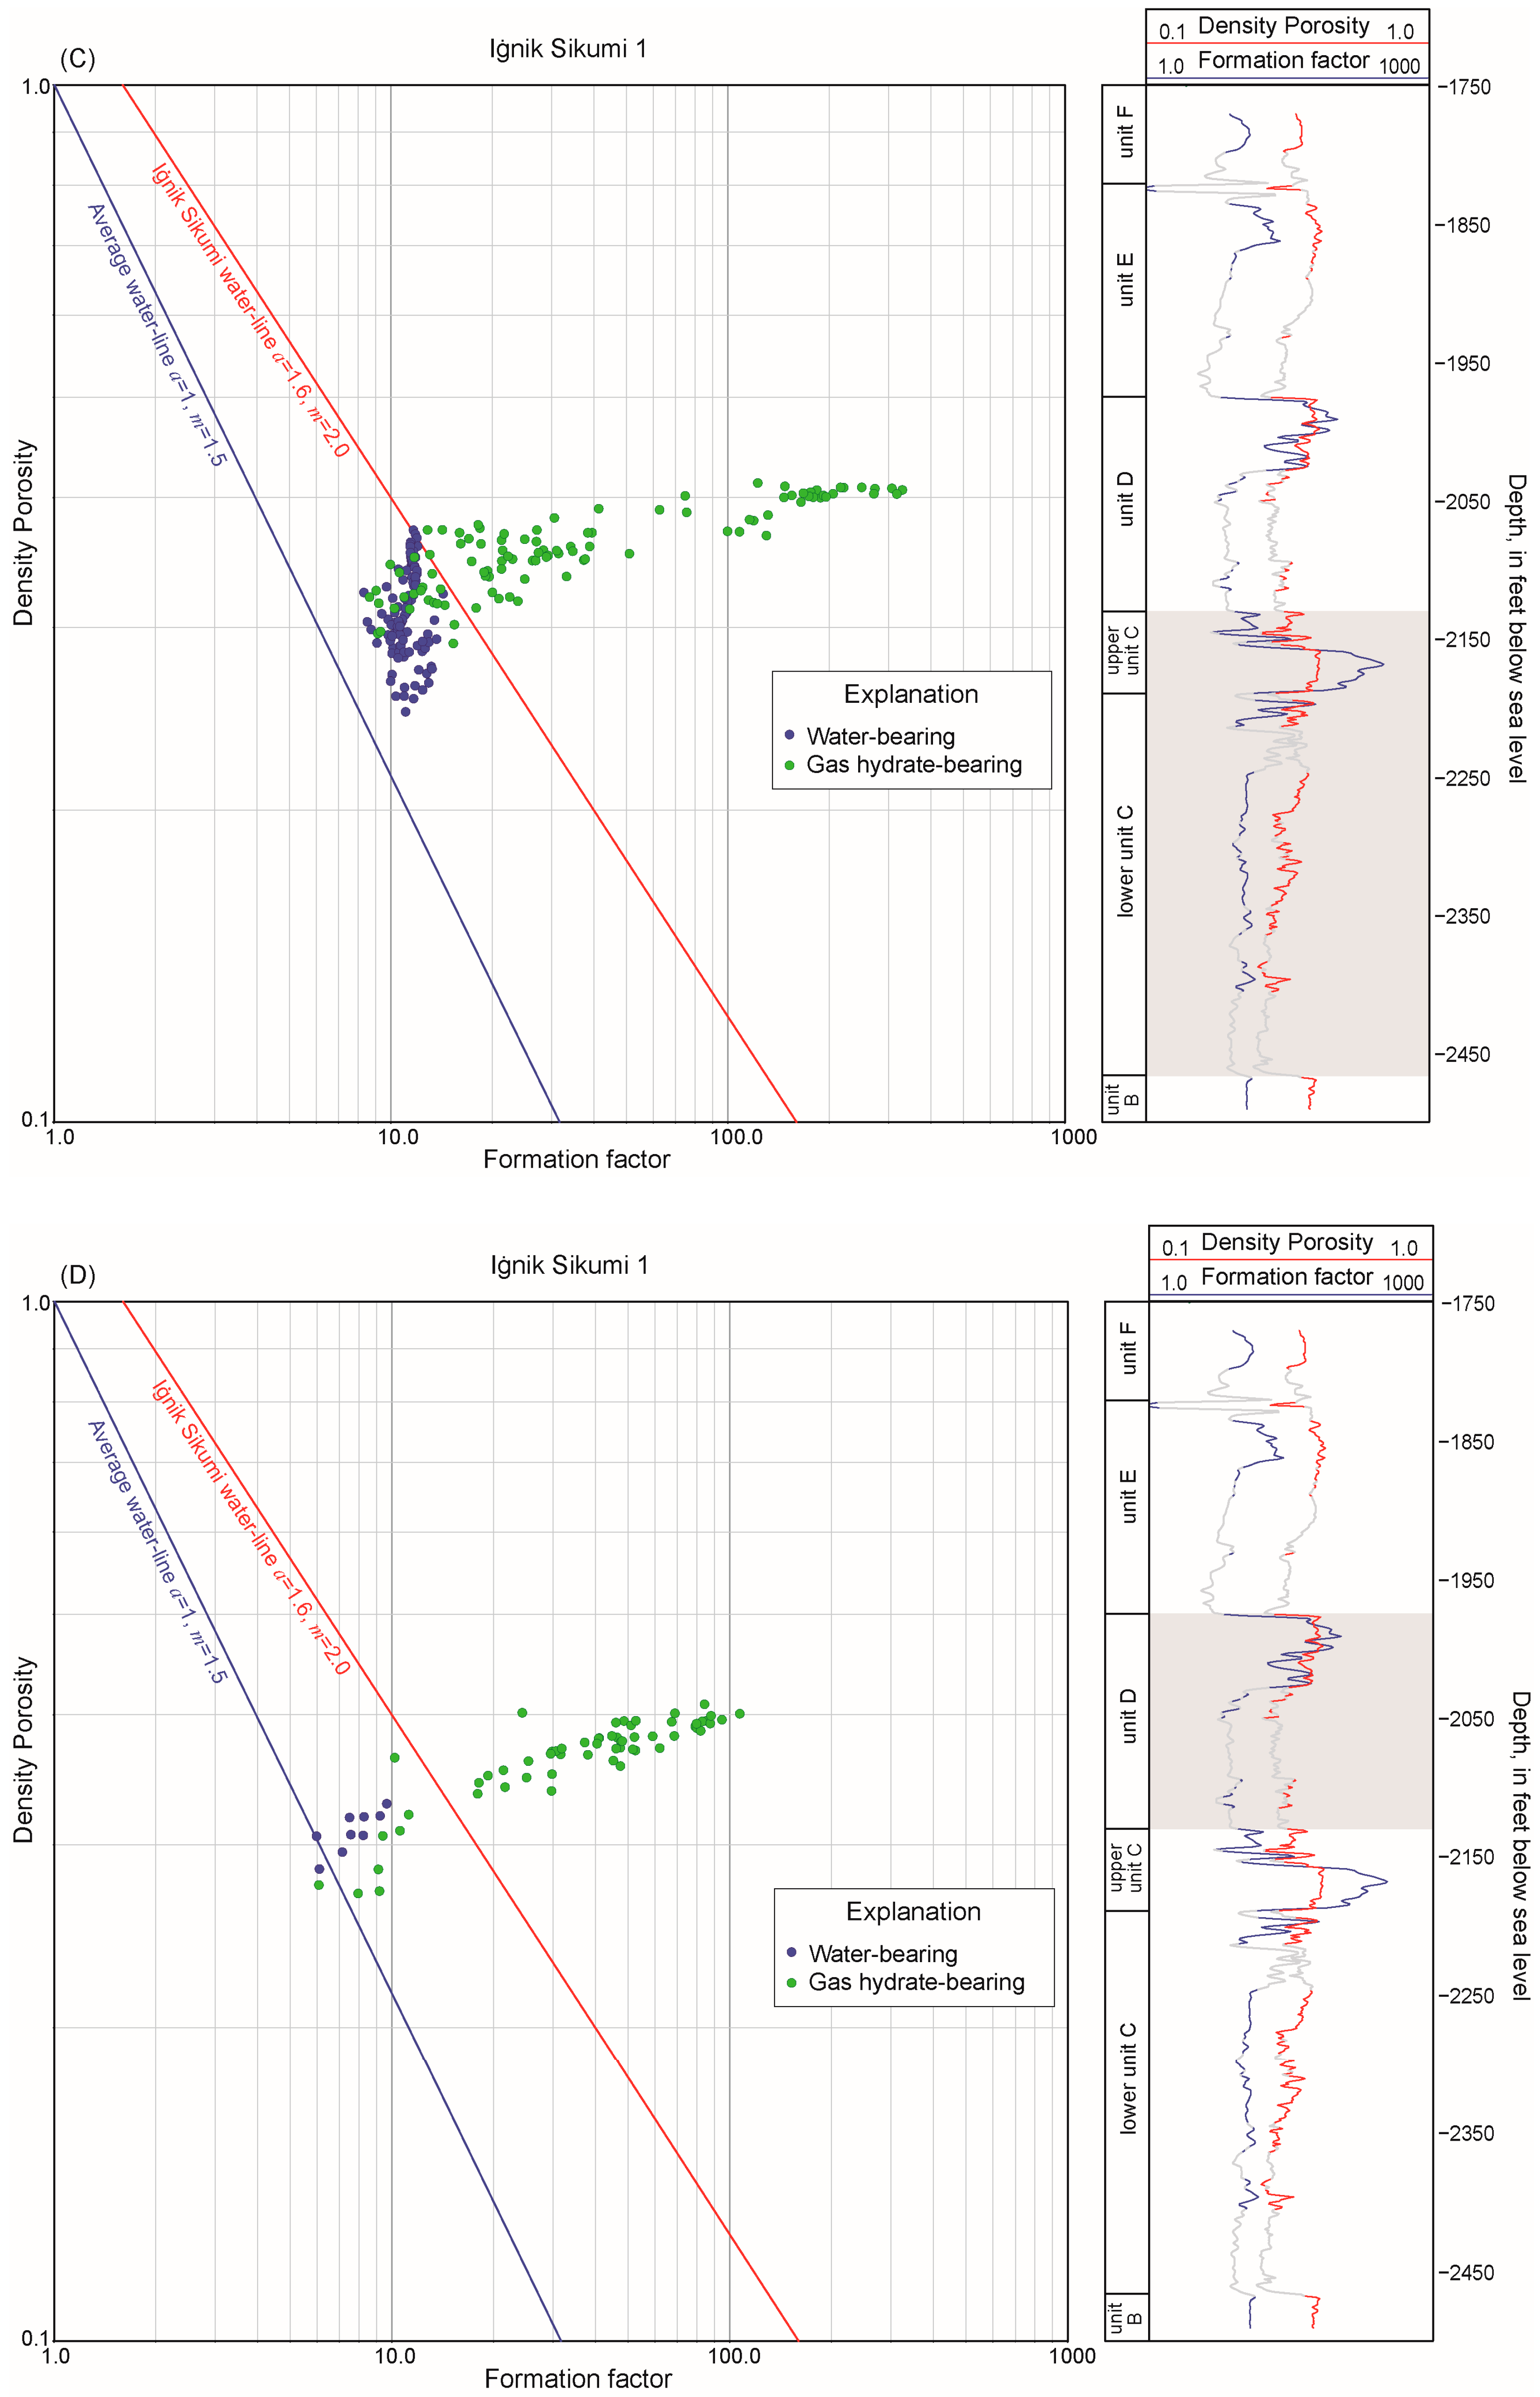
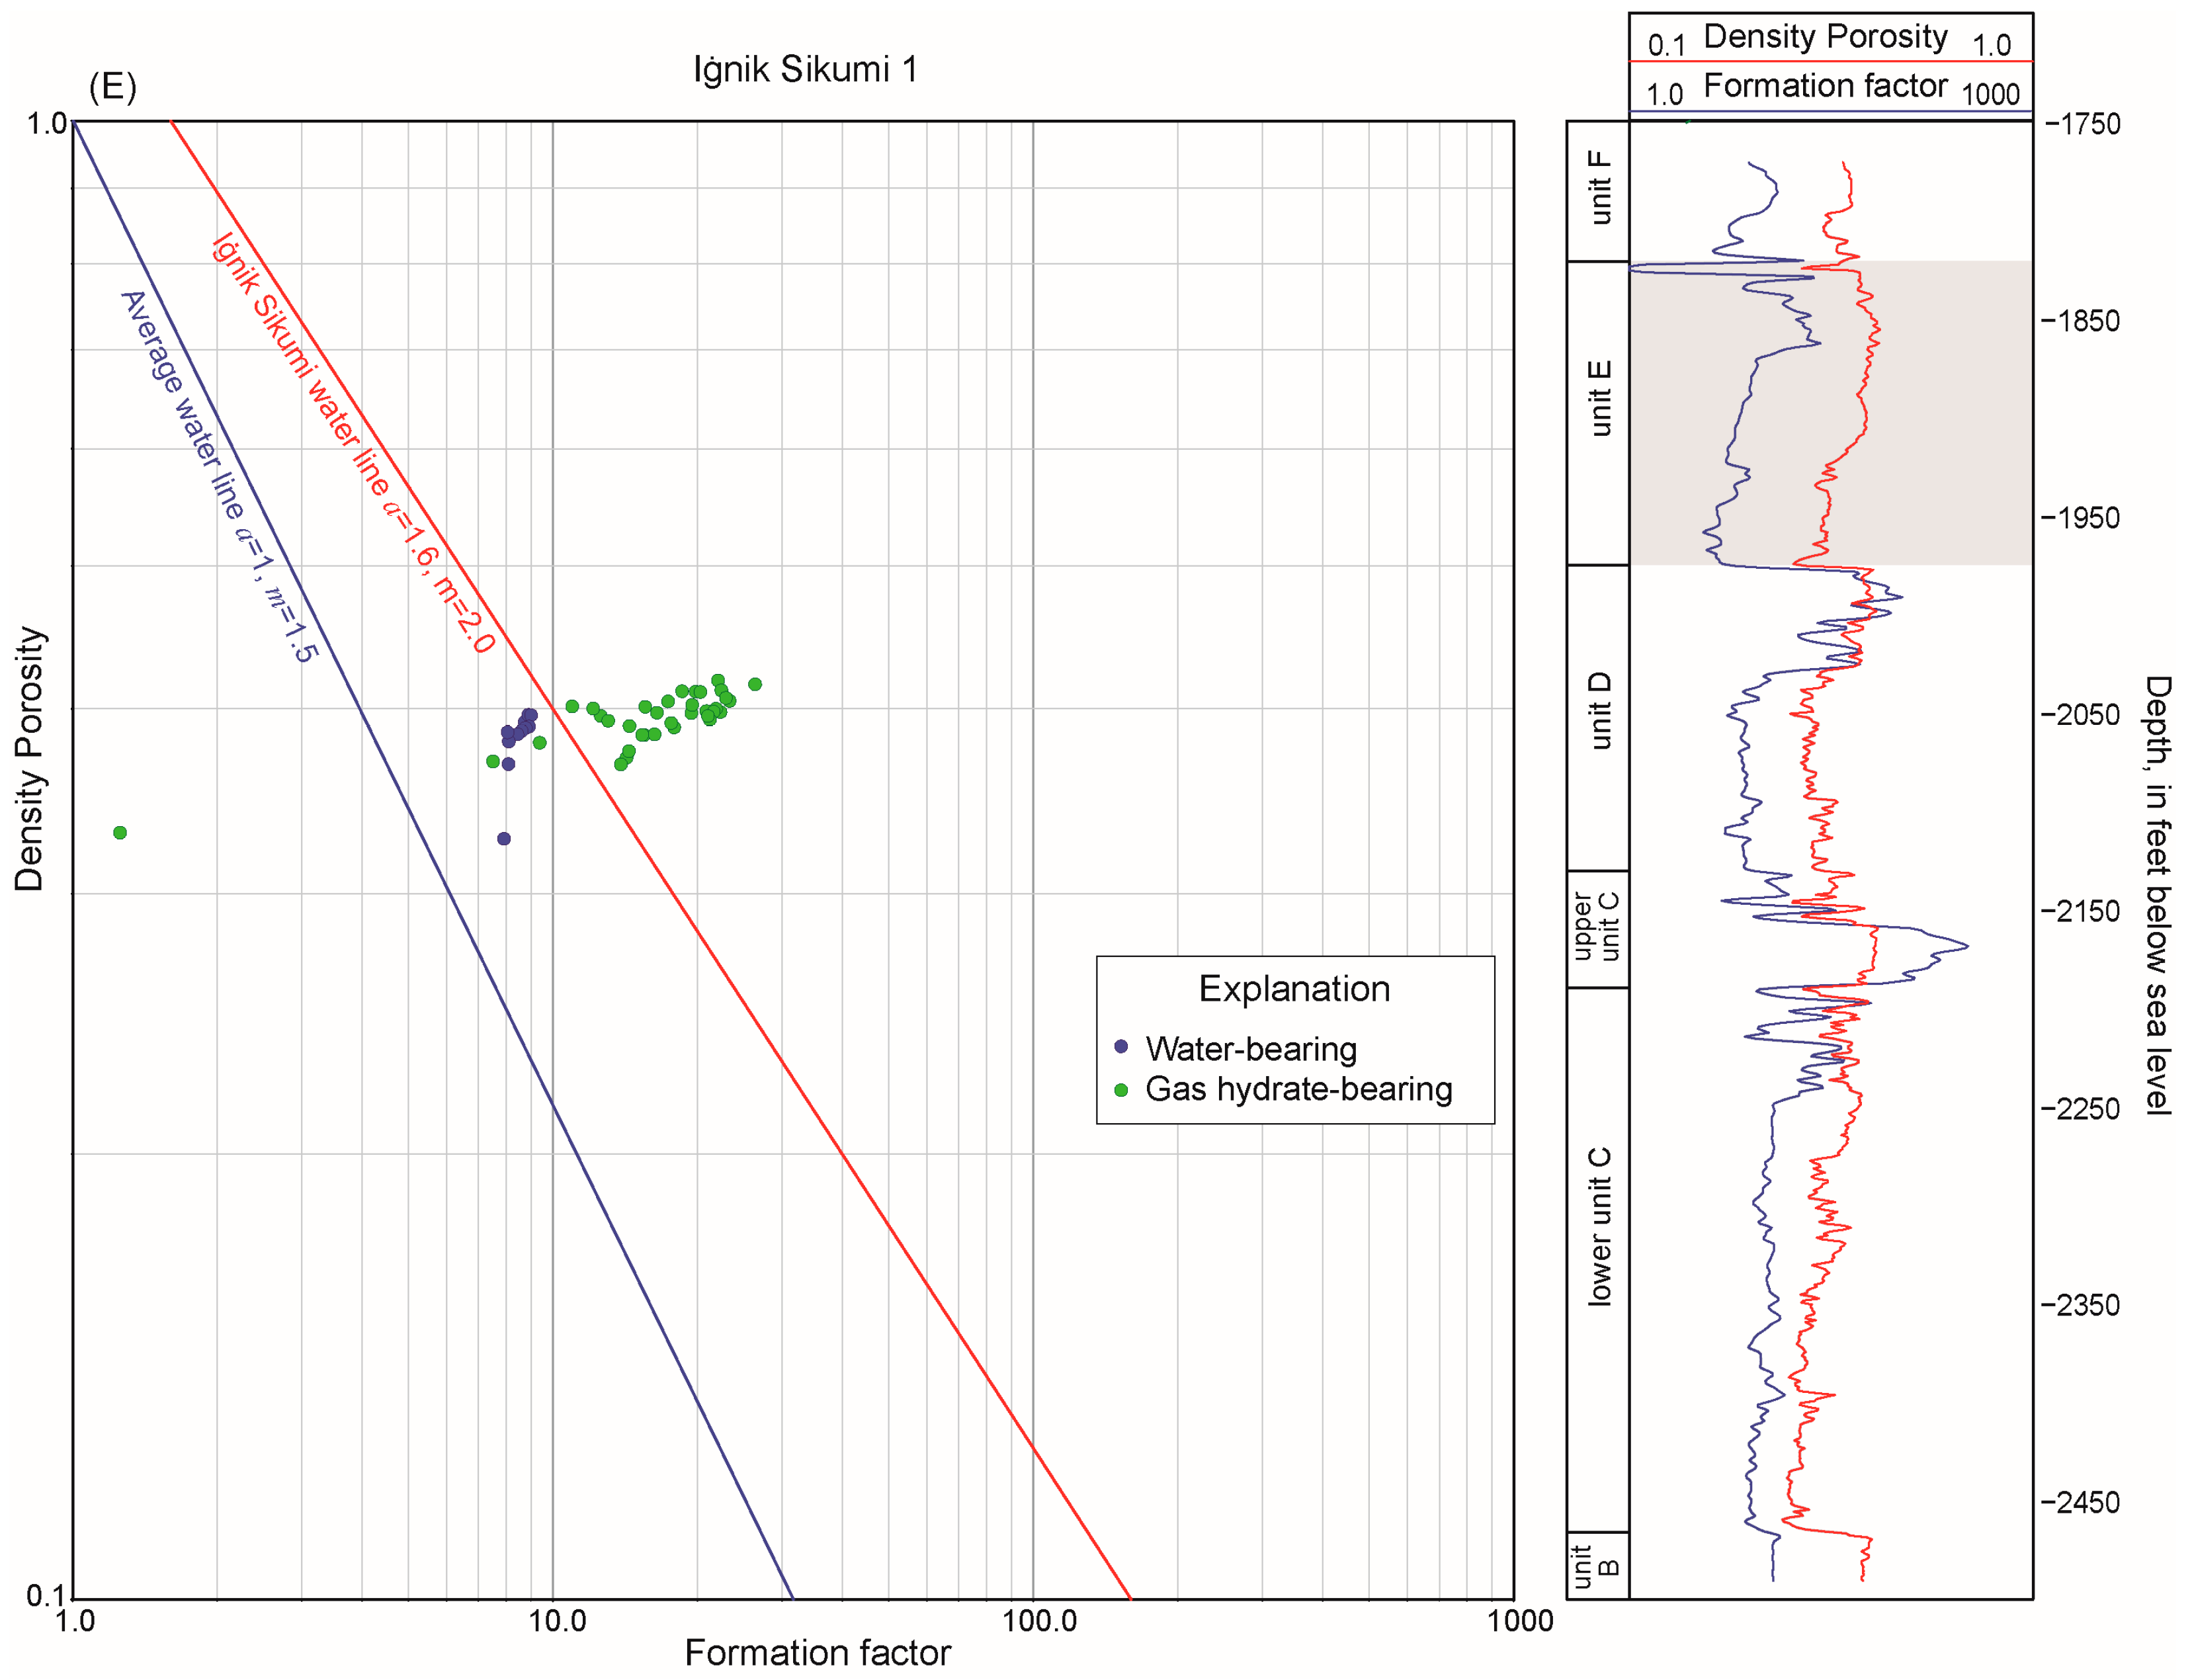
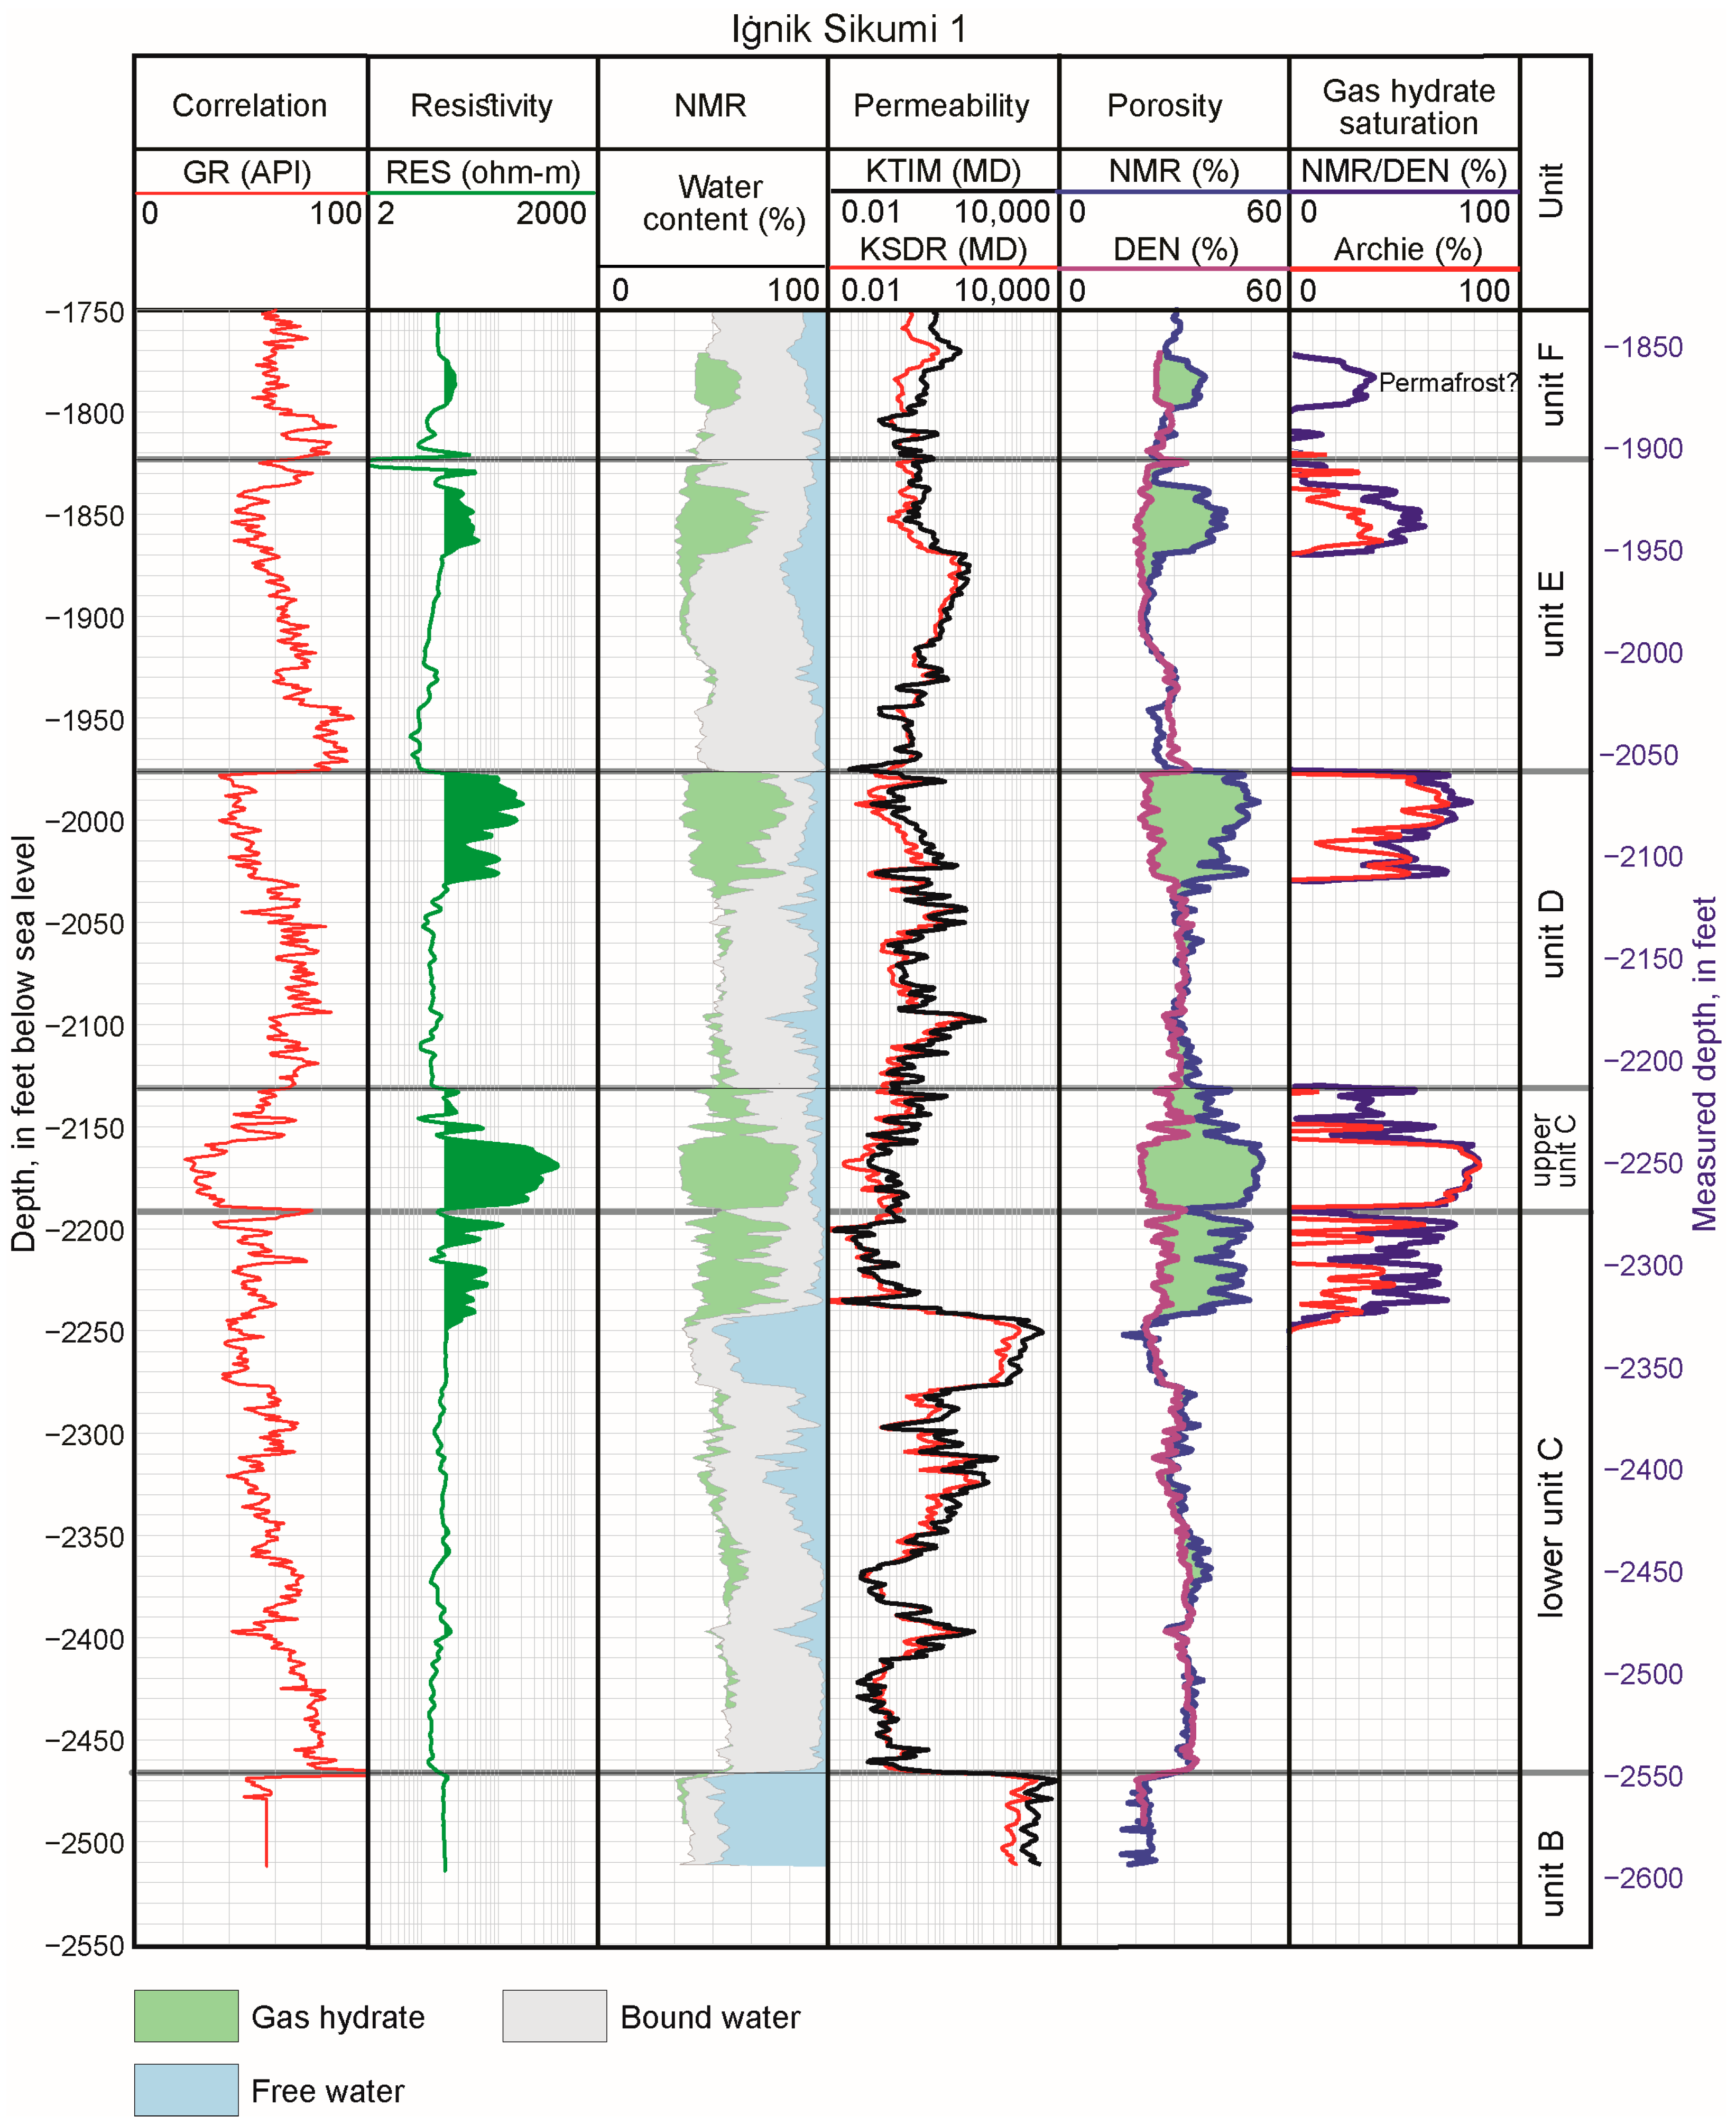
3.1.2. Reservoir Porosity

Advanced well logging tools are routinely used to examine petrophysical properties such as porosity, substances occupying pore space, and their distribution as pore-filling material. In this study, the analysis of nine wells with sufficient log data to determine the presence of gas hydrates, located on or near the PBU L-Pad (Figure 6 and Figure 7), reveals the widespread occurrence of gas hydrates in units C, D, and E [13,28]. The same units were shown to be hydrate-bearing in three previously drilled gas hydrate research wells: NWE2 [13], Mount Elbert [14,15,16], and Iġnik Sikumi [29,30]. The well path trace map in Figure 7 shows the location of the top of units C, D, and E as penetrated in each well. Density log data from available wells in the PBU L-Pad study area were used to estimate porosity within the gas hydrate-bearing units of interest. The Archie relationship and the NMR-density log porosity data were used in this study to calculate gas hydrate saturations (as reviewed below).
The presence of gas hydrates in the Iġnik Sikumi test well is inferred from resistivity (AT90) and acoustic sonic log data (DT). Resistivities of 20 ohm-m and greater and transit times less than 140 μsec/ft were determined as gas hydrate indicators (Figure 5). Based on these criteria, three gas hydrate-bearing intervals are interpreted within the Iġnik Sikumi well: ~670–710 m (2215–2332 ft) measured depth (MD) in unit C, ~630–650 m (2060–2130 ft) MD in unit D, and ~580–600 m (1907–1954 ft) MD in unit E (Figure 5). Unit C is subdivided into an upper unit C and a lower unit C for description purposes. The 9-meter-thick (30-ft) section within the upper unit C (~680–690 m MD; ~2243–2273 ft MD) was selected for testing during the 2012 CO2-CH4 exchange trial [29,30,32].
The standard density–porosity relationship was used to calculate porosity (ϕD).
ϕ D = ρ m a ρ b ρ m a ρ w
where ρma is the matrix density (assumed value of 2.65 g/cm3), ρb is bulk density (g/cm3) measured from the density log, and ρw is the formation water density (assumed value of 1.02 g/cm3). Density log data from five wells with log data in gas hydrate intervals (NWE2, PBU L-112, PBU L-106, Iġnik Sikumi, and Mount Elbert) were used to derive density–porosity trends throughout the delineated PBU L-Pad gas hydrate accumulation. The density log-derived porosities in the gas hydrate-bearing portion of the upper unit C in the Iġnik Sikumi test well averaged about 35% (Figure 5).

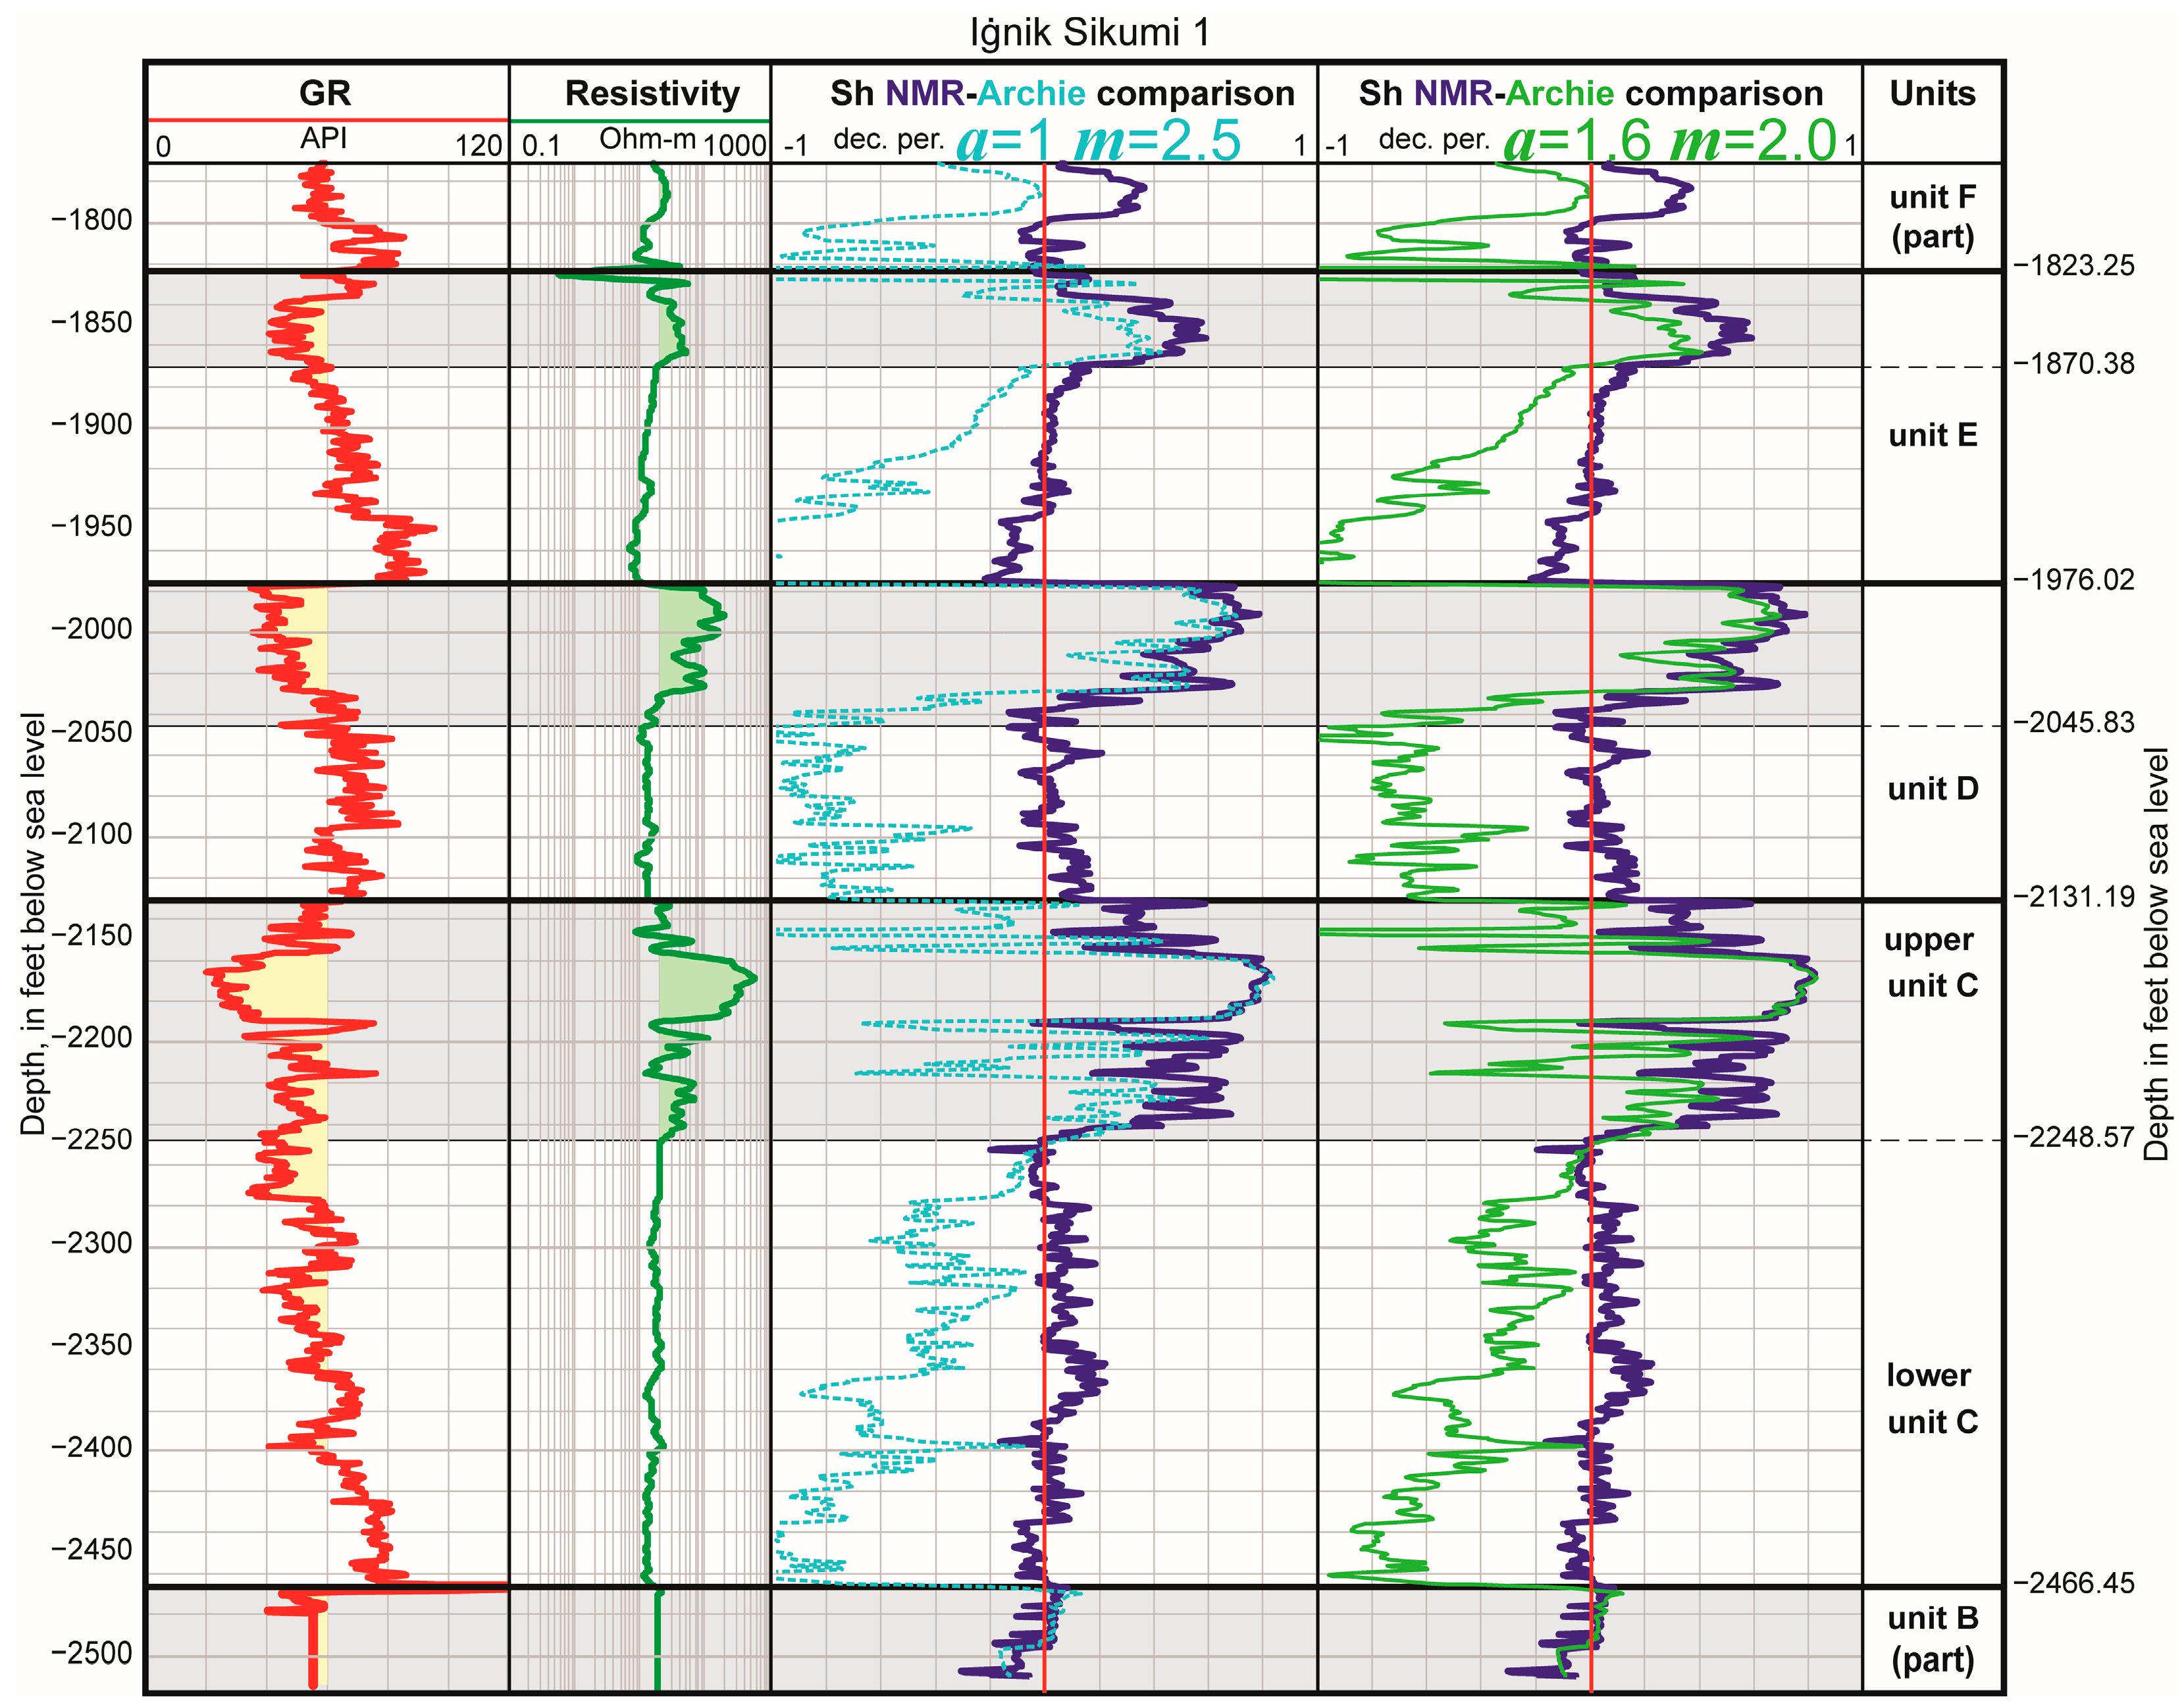
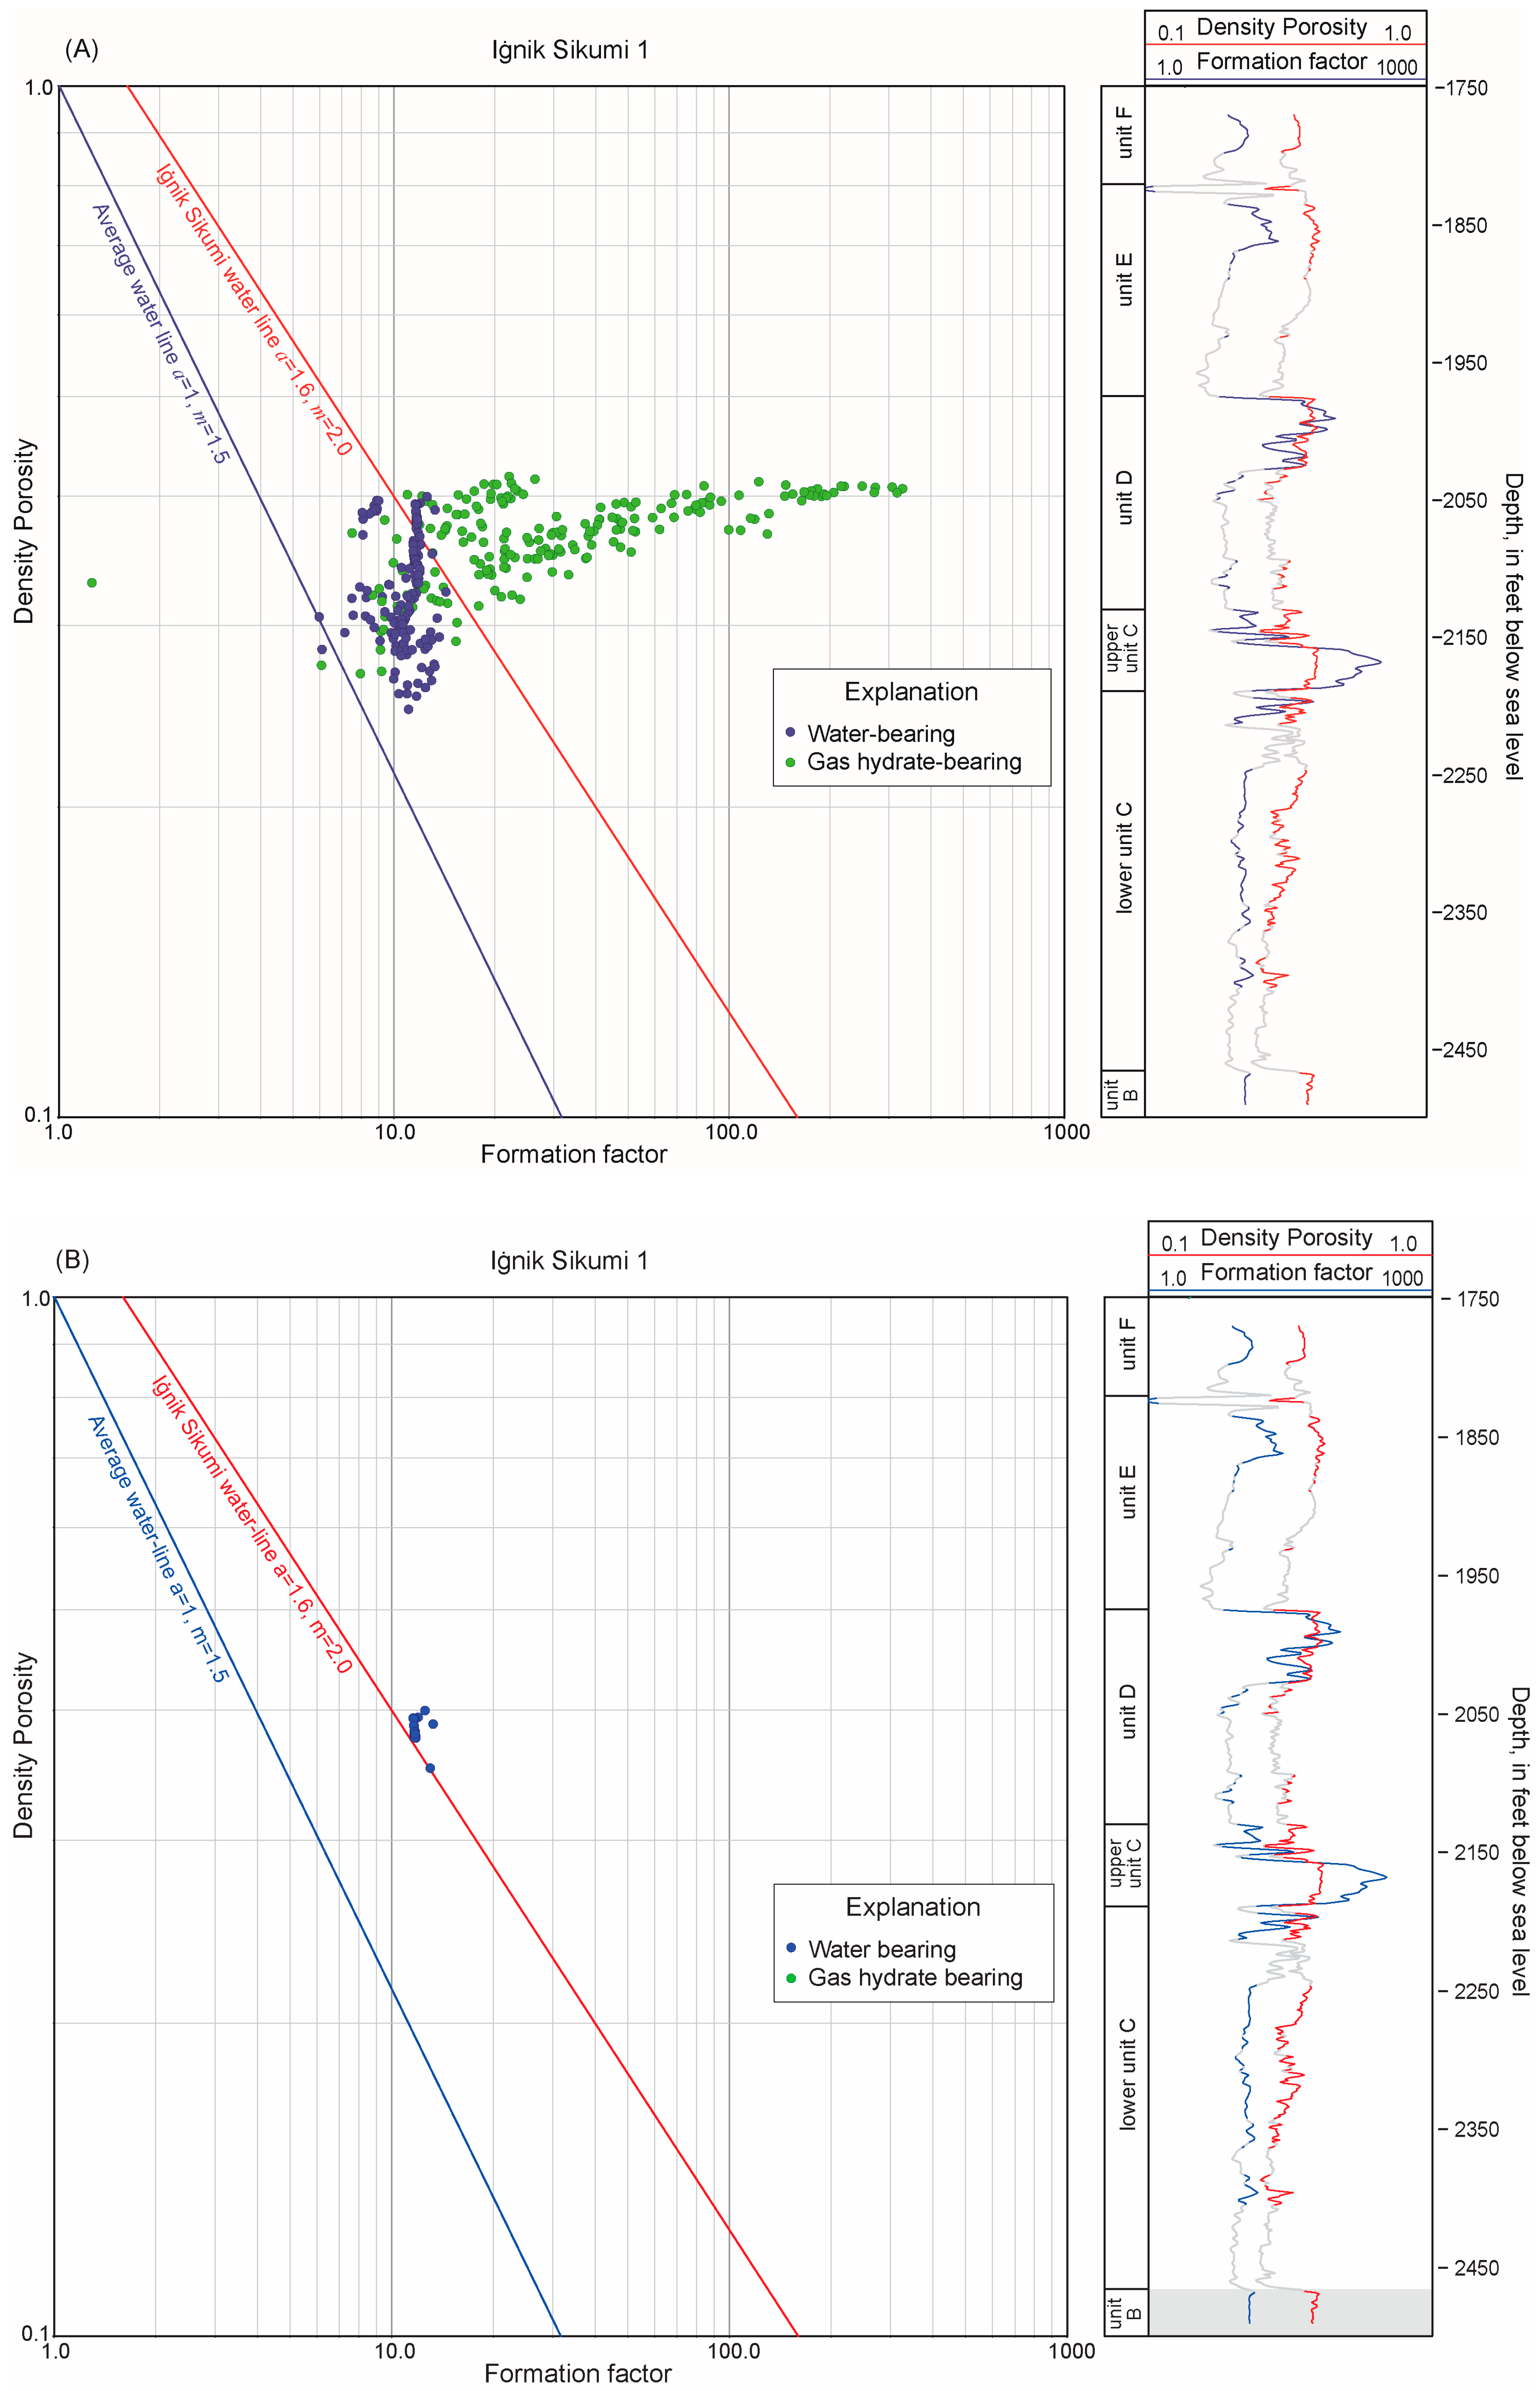
3.1.3. Reservoir Gas Hydrate Saturations

Gas hydrate saturations (Figure 5) were determined through Archie analysis methods utilizing measured resistivity log data [14,39], as well as a density and NMR porosity log method [70]. Gas hydrate saturations estimated from the density porosity approach and NMR do not depend on empirical relationships; thus, the accuracy of the estimation depends only on the accuracy of the log measurements. The NMR and density log-derived gas hydrate saturations were assumed to be the most accurate and were used to constrain the saturation estimates derived using the Archie method for the Iġnik Sikumi well.
The NMR well logging tools primarily respond to the presence of movable hydrogen molecules in the rock formation [70]. Thus, gas hydrates cannot be directly detected with a downhole NMR logging tool because they behave like they are part of the solid matrix. Therefore, NMR porosity is a measurement of the pore space volume that is occupied by free water, capillary-bound water, and clay-bound water, but not gas hydrates. As a result, the NMR-derived porosities will substantially underestimate the true or total formation porosities in gas hydrate-bearing reservoirs. A comparison of accurate in situ total porosities from an independent source, such as those calculated from density log measurements (Equation (3)), with NMR-derived porosities would allow an estimation of gas hydrate saturations from NMR measurements. A set of equations was developed for computing gas hydrate saturations using porosities estimated from density and NMR logs [14,70]:
ϕ N M R = ( 1 S h ) ϕ
S h = ϕ ϕ N M R ϕ
λ h = ρ w ρ h ρ m a ρ w
ϕ = ϕ D + λ h ϕ N M R 1 + λ h
where ϕNMR is the NMR-derived porosity, which is the same as the water-filled porosity, Sh is the NMR-density porosity-derived gas hydrate saturation, ϕ is the total porosity, representing the pore space occupied by water and gas hydrates, λh is a correction constant that deals with the differences in the density of the pore-filling constituents, ρw is the formation water density (assumed value of 1.02 g/cm3), ρh is the gas hydrate density (assumed value of 0.9 g/cm3 for a structure-I gas hydrate [71]), ρma is the matrix density (assumed value of 2.65 g/cm3), and ϕD is the density porosity derived from assuming a two-component system (matrix and water; Equation (3)).
For the NMR-density porosity-derived gas hydrate saturations, the “total porosity” value for the gas hydrate-bearing units was derived from bulk density well log data using Equation (3). Input parameters for the density porosity log calculations are summarized in Table 1. Grain or matrix density and fluid density values, required for density porosity calculations, are usually derived from core data. These types of data were not generally available from the wells in the study area. Therefore, published grain (matrix), water and gas hydrate densities, formation temperatures, and pore water salinities from Mount Elbert-acquired cores and other sources [13,14,15,16,17,28,29,30] provided accurate estimates of these geologic and petrophysical parameters for the wells used in this study (Table 1). The calculated NMR porosity was compared with the density log-derived porosity to identify gas hydrate-bearing intervals by the separation between the two porosity curves (pink-shaded area in Figure 5, track 5). The NMR-density porosity-derived gas hydrate saturation log for units C, D, and E is shown in Figure 5 (track 6), with the gas hydrate saturations in the upper unit C averaging about 75%.
Gas hydrates, much like oil or gas, act as an electrical insulator and can be detected with resistivity tools. Resistivity log measurements can also be used to estimate gas hydrate saturations. The Archie [39] equation, which relates porosity, pore-fluid resistivity, and rock resistivity, is often used to calculate fluid saturations in gas hydrate-bearing sand reservoir systems [14]. According to Archie [39] and as modified by Winsauer et al. [72], the water saturation (Sw) of a formation containing hydrocarbon-bearing sediments can be derived from the resistivity log as follows:
S w = a R w ϕ m R t 1 / n
S h = 1 S w
F F = R t R w
where a and m are Archie constants (tortuosity factor and cementation exponent, respectively), n is an empirically derived parameter called the saturation exponent, Rw is the resistivity of the connate water (ohm-m), ϕ is the porosity, Rt is the formation resistivity as measured by the deep-reading resistivity log (ohm-m), Sh is the Archie equation-derived gas hydrate saturation, and FF is a formation factor.
The parameter n, which depends on the reservoir lithology, has been shown to vary between 1.715 for unconsolidated sediment and 2.166 for sandstone and typically averages about 1.939 as a “pooled estimate” [73] for gas hydrate-bearing reservoirs using water ice as an analog. However, more recent studies presented in Spangenberg [74] and Cook et al. [75], as examined later in this review, raise questions about the Pearson et al. [73] assumed pooled estimate of 1.939 for the n parameter in the Archie relationship. Values for a and m are empirically derived parameters often obtained from logarithmic porosity–resistivity cross plots [76], the physical meaning of which will be described in more detail below. Porosity values (Equation (3)) can be estimated from other porosity logs, such as density logs. The resistivity of the pore water (Rw) can also be calculated using Arp’s formula if the salinity and temperature of the formation water are known [14,77,78]. Specific information on pore water salinities and formation temperatures in the Eileen Gas Hydrate Trend can be found in Hanor et al. [33] and Lachenbruch et al. [79], respectively. The Archie method relies heavily on the selection of accurate values for the n parameter and the empirical parameters a and m, the latter of which can be derived from Pickett plots [68,69,76,80].
The Archie method is based on the general concept of comparing the resistivity of conventional hydrocarbon-bearing reservoirs with the resistivity of 100% water-saturated, mostly sand-rich reservoirs. Since the gas hydrates in the Eileen Gas Hydrate Trend are mostly found in conventional sand-rich reservoir sections and the gas hydrate-bearing reservoirs appear to contain appreciable amounts of free water and bound water within interconnected pores [13,29,30], it is reasonable to apply the Archie method to calculate accurate gas hydrate saturations with the well log data from the ANS as reviewed by Collett and Lee [14].
In the Archie method, if the baseline salinity of the formation water is known within the stratigraphic section of interest, the data from the deep reading resistivity log can be plotted against the density porosity log values on a Pickett plot (Figure 8 and Figure 9) to derive the required Archie parameters, which can then be used to directly calculate the water saturations (Equation (8)). The Archie m parameter can be derived from the slope of the “water line,” which is a line fitted through the data points representing 100% water-saturated sand units as posted on the Pickett plot. The intercept of the water line with the porosity cross-plot axes at unity (which is ϕ equal to unity or 100% porosity) yields the value for the relationship of (a × Rw), where a is the Archie tortuosity factor (Equation (8)). To simplify this process in this study, the formation factor (FF, Equation (10)) was used instead of the well log-measured formation resistivity in the Pickett plots (Figure 8 and Figure 9). In this case, in the modified plot (Figure 8 and Figure 9), the water line intercept of the porosity axis will yield the direct value for a, while m is derived from the slope of the water line. The water line with the Archie parameter a = 1 will intercept the porosity axis at ϕ = 100%.
When NMR logs are not available, core data can be used to derive accurate values for the empirical Archie parameters. But in either case, it is important to consider the underlying physical controls and meanings of each of the Archie parameters. Though most often called the Archie tortuosity factor, Archie parameter a is sometimes referred to as the cementation intercept, lithology factor, or lithology coefficient. This parameter, as introduced by Winsauer et al. [72], is meant to correct for variation in compaction, pore structure, grain size, and matrix mineralogy in the original presented Archie relationship [39]. The value of a in most cases ranges from 0.5 to 1.5 and is controlled by the electric current path length. A value of a = 1.0 is often used to represent clean (no clay), non-conductive, sand-rich reservoirs, while any variation from 1.0 is most often attributed to more clay-rich rocks that are relatively more conductive. Maute et al. [34] presented an approach to determining Archie a and m parameters from standard resistivity measurements on cores. Maute et al. [81] concluded that a is a “weak-fitting parameter with no physical significance,” thus it is recommended to fix a to unity. Mathematical analysis demonstrates that, for most reservoirs, the change from a = 1 to a ≠ 1 has a small effect on the Archie-derived saturation values. The Archie a parameter most likely accounts for hidden variables such as conductive minerals. In other words, a is a correction factor with no specific trends relative to lithology (clay), grain size, or compaction, and it is used to adjust Archie-derived saturation values.
The Archie cementation exponent, m, models how much the pore network affects the conductivity of the reservoir because the rock itself is assumed to be non-conductive. If the pore network is assumed to be represented by a set of parallel capillary tubes, a cross-sectional area average of the rock’s resistivity would yield a porosity-dependent cementation exponent of m = 1 [11]. While this hypothetical rock does not exist in nature, the Archie parameter m does generally increase with increasing tortuosity of the pore space connectivity and decreases with increasing connectivity. The Archie cementation exponent, m, has been observed to range from 1.3 to 2.6, with lower values related to unconsolidated sands. Common values for the cementation exponent for unconsolidated rocks are expected to range from 1.3 to 1.8 (average 1.5), while for consolidated sandstones it usually ranges from 1.8 to 2.0 [39,82,83]. The effect of gas hydrate growth on pore space tortuosity is not well known [74]. The permeability of the gas hydrate-bearing reservoirs is significantly impacted by the presence of gas hydrates [14,70], which may indicate that the conduction of electrical currents through a gas hydrate-bearing formation could be similarly impacted by the distribution and nature of gas hydrates at the pore scale. Because of the unconsolidated nature of most of the cored gas hydrate occurrences on the ANS, the Archie cementation exponent, m, for these reservoirs would be less than 1.8, with an expected average value around 1.5 as derived below in this study.
The Archie saturation exponent, n, is usually fixed to a value close to 2.0 based on the estimates presented by Pearson et al. [73], as discussed above in this review. The Archie saturation exponent is, for the most part, dependent on the wettability of the grain surfaces in the reservoir rock and is controlled by the presence of either conductive or non-conductive fluids bound to the grain surfaces. Water-wet rocks maintain a continuous film of conductive water along the pore walls, making the rock conductive. Oil-wet rocks, for example, have discontinuous water films along the grain surfaces, making the rock less conductive, thus exhibiting Archie saturation exponent n values much greater than 2.0. Since gas hydrates have not been observed growing on grain surfaces [84] and the analysis of NMR and formation test data shows significant amounts of both bound water and free water in gas hydrate sand reservoir systems [14], the rock matrix in most gas hydrate-bearing sand reservoir systems can be considered water-wet, and the Archie saturation exponent, n, can be set to 2.0. It is again important to highlight that Cook et al. [75] question the assumed “pooled value” of 1.939 (assumed to be 2.0 in this study) for the n parameter in the Archie relationship. In Cook et al. [75], they derived the value for n for the Mallik 5L-38 well, located in Arctic Canada, by first deriving an independent gas hydrate saturation profile from the acquired compressional-wave acoustic well logs that was subsequently used to inversely calculate the value for n through a modified version of the Archie relationship. They further extended this approach to additional marine gas hydrate sites, located in the Gulf of Mexico, to derive an average value for n of 2.5 ± 0.5. The Archie relationship used by Cook et al. [75], however, did not consider the a (tortuosity factor) Archie constant (Equation (8)) in their calculations. In a contrasting study by Collett and Lee [85], they used the so-called “Humble” [69]-derived Archie a (0.62) and m (2.15) and an assumed Pearson et al. [73]-derived n value of 1.9386 to also derive gas hydrate saturations that compare favorably with other independent calculated gas hydrate saturations, including the NMR-density porosity-derived gas hydrate saturations presented by Kleinberg et al. [70]. The apparent discrepancies between the Pearson et al. [73] and Cook et al. [75] considerations for the Archie saturation exponent n values and the other related Archie parameters (a and m) can be attributed to the fact that we are dealing with a series of non-unique relationships, and the selection of the appropriate Archie related parameters is dependent on the accurate characterization of the reservoir system petrophysical properties and independent confirmation of the selected Archie parameters. In summary, the apparent presence of water-wet grain surfaces associated with the relatively coarse-grained porous reservoir systems as examined in this study and the independent comparison of the NMR-density porosity and Archie-derived gas hydrate saturations (presented later in this review) allow the use of the Pearson et al. [73]-derived n value of 1.9386—as simplified to an n value of 2.0 in this study.
Four wells from the area of the PBU-L Pad in the Eileen Gas Hydrate Trend had sufficient resistivity well log data to allow the calculation of gas hydrate saturations (Figure 4, Figure 6, Figure 7, Figure 8, Figure 9A–E, Figure 10, Figure 11, and Figure 12A–D) (Iġnik Sikumi, PBU L-106, PBU L-112, and NWE2). As discussed previously, the Iġnik Sikumi well also had NMR log data from the gas hydrate-bearing reservoir, which aided in the selection and calibration of the appropriate Archie parameters. A series of modified Pickett plots (Figure 9A–E) document the methodology used to select a and m parameters for the gas hydrate-bearing units in the Iġnik Sikumi and other wells analyzed in this study. Logarithmic cross plots (i.e., a modified Pickett plot) of porosity (ϕ) versus deep resistivity represented by FF (Figure 8 and Figure 9A–E) can be used to select a water line for the water-wet sands in the reservoir section being examined. The slope of the water line and porosity axis intercept at 100% porosity (or unity) can be used to estimate the Archie m and a parameters, respectively. Analysis of the well log data from the Iġnik Sikumi well revealed the presence of water-bearing sand intervals both within and below several of the gas hydrate-bearing reservoir sections. Specifically, the sand-rich interval below the gas hydrate-bearing sand section in the lower unit C in the Iġnik Sikumi well (Figure 5 and Figure 12A) and all of unit B were reported as water-bearing in Schoderbek et al. [8]; therefore, these confirmed water-saturated sand units should help with the selection of the water line for the water-wet sand units.
A critical assumption when using the Pickett plot method is that all the reservoir data points depicted on the plot have similar matrix parameters and pore water salinities. These data points should form clusters, which would permit the projection of a trend line. The series of modified Pickett plots in Figure 9A–E show distributions of well log data values based on reservoir and lithology in the Iġnik Sikumi well. The figures demonstrate the methods used in this study to ascertain the required Archie a and m parameters. The goal is to understand the geologic nature of each data point as plotted and to select only the reservoir sections (within units B, C, D, and E) with similar reservoir properties that yield reasonable data distributions, leading to the accurate selection of Archie parameters from the cross plots. The first step in this process is to eliminate all the non-reservoir sections from consideration. This step was accomplished for units B, C, D, and E by eliminating the reservoir sections with calculated Vsh values of 30% and greater (Figure 9B–E). The next step in the process was to determine if the pore fill in each of the remaining reservoir sections contained either water or gas hydrates. The presence of gas hydrates was inferred from the deep resistivity log data, with gas hydrates indicated by log values of 20 ohm-m and greater. In several cases, compressional-wave transit-time log data (sonic log) were also used to differentiate water-bearing from hydrate-bearing reservoir sections with travel times of 140 μsec/ft and less used as the gas hydrate-bearing threshold. The results of this reservoir discretization process for the Iġnik Sikumi well are depicted in Figure 12A, where the non-reservoir sections are identified in gray, the predominantly water-bearing reservoir sections are shown in blue, and the predominantly hydrate-bearing reservoir sections are shown in green. In the Pickett plots (Figure 9A–E), the mostly water-bearing reservoir sections are shown in blue, and the mostly hydrate-bearing reservoir sections are shown in green in units B, C, D, and E of the Iġnik Sikumi well. As previously discussed, the Archie parameters for unconsolidated sedimentary sections, like those expected in non-hydrate-bearing sediments of the Tertiary Sagavanirktok Formation, should exhibit average values around a = 1.0 and m = 1.5. For reference purposes only, the water line (blue line) corresponding to Archie parameters of a = 1.0 and m = 1.5 has been plotted in Figure 9A–E. This line does not correspond to any posted data trends in this example and is included only for reference purposes. Also plotted for reference purposes (Figure 9A–E) is a water line (red line) representing the Archie parameters of a = 1.6 and m = 2.0. In the cross plot of all the available log data from the potential sand-dominated, water-bearing reservoir sections within units B, C, D, and E, the data points do not lend themselves to a confident determination of a water line; thus, Archie parameters using the Pickett method are hard to determine in this example from the Iġnik Sikumi well (Figure 9A).
The next step in the process was to further subdivide the log data as shown in Figure 9B–E into the four sedimentary units defined in this study (i.e., reservoir intervals within units B, C, D, and E). In Figure 9B, we only consider the log data from unit B in the Iġnik Sikumi well, which is known to be a sand-rich, water-saturated reservoir [30]. As shown in Figure 9B, no apparent trend in data from the water-saturated reservoir (blue data points) intervals would yield reasonable Archie parameters for unit B. Next, in the Figure 9C cross plot, we identify the well log data values associated with the known hydrate- and water-bearing reservoir intervals in unit C of the Iġnik Sikumi well. The data corresponding to the water-saturated intervals for unit C (Figure 9C) are clustered together and exhibit lower FF log values. However, the data points for the water-bearing intervals again fail to yield a reasonable enough spread in the data distribution to allow for the selection of a unique water line. The Pickett plots for units D (Figure 9D) and E (Figure 9E), which are known hydrate- and water-bearing intervals, also do not exhibit enough of a data spread to fit unique water lines to the data for either of the reservoir units. Because of the limited distribution of the plotted well log-derived data values (ϕ and FF) for the wells examined in this study, the standard Pickett plot approach could not be used as a single method to yield reliable Archie a and m parameters.
To overcome the limitations of the Pickett cross-plot method, we have introduced another visual well log data plotting method to estimate the Archie a and m parameters. In this technique, a series of Archie resistivity log-derived gas hydrate saturation curves for a given well are calculated and plotted at the same scale, assuming a range of probable Archie parameters (Figure 10). As a starting point, the value for a was set to 1.0. The adjustments to the Archie a parameter were made if the value for a would not satisfy the physical properties of the sediments or the expected gas hydrate saturation conditions for values for a ranging from 1.0 to 1.8. The value for m, assuming unconsolidated rocks, should range from 1.3 to 1.8 due to the expected low tortuosity of the current flow path through these types of sand-rich reservoirs. However, it can be as high as 2.6 in consolidated rocks, as reviewed previously in this report. Saturation curves were built to accommodate the whole range of the Archie parameter m. Archie parameter n was set to 2.0, as discussed earlier in this report. For the Iġnik Sikumi well (Figure 10), equations were formulated to generate a series of gas hydrate saturation log curves assuming the following range of Archie parameters: 1.0 ≤ a ≤ 1.8, 1.3 ≤ m ≤ 2.5, and n = 2.0. Each of the calculated well log curves was grouped by their Archie parameter a in the respective well log tracks. In addition, the data constraining the NMR-density porosity-derived gas hydrate saturation well log curve for the Iġnik Sikumi well and the water line (in this case, the calculated 0% gas hydrate saturation line) were plotted in each well log track (Figure 10). The overall criteria for best fitting of the Archie-calculated gas hydrate saturation log curve in the Iġnik Sikumi well required that the curve (1) cross the water line at the top and base of each gas hydrate-bearing interval in units C, D, and E; (2) overlay the water line in the hydrate-free unit B (i.e., water-saturated); (3) closely follow the NMR-derived gas hydrate saturation log; and (4) have Archie parameters that are within the expected range of physical conditions for the reservoirs in the Iġnik Sikumi well. The format of the composite well log displays (Figure 10) allows for the quick visual comparison of the Archie-calculated gas hydrate saturation log curves and gas hydrate log saturations from other sources, such as NMR-derived. Although many curves could satisfy several of the key criteria defined above, the gas hydrate saturation curve calculated using a = 1.6 and m = 2.0 demonstrates the best fit to the criteria for the Iġnik Sikumi well.
A deeper understanding of the interrelationship between the Archie a and m parameters and saturations in the Iġnik Sikumi well is demonstrated in Figure 11 (tracks 3 and 4). The figure depicts two scenarios for the selection of Archie a and m parameters. The Archie constant a does not have physical meaning and is mostly used to correct for hidden or unknown variables. In the first scenario, we set the value for the Archie parameter a to 1.0. Figure 11 (track 3) shows that when a = 1.0, m must be as high as 2.5 to satisfy the defined criteria for the water line and NMR-derived gas hydrate saturation line. Such a high m value suggests that the rocks are highly consolidated. Although gas hydrates have been shown in the Mount Elbert well to be “load-bearing” and act as part of the matrix frame, it does not appear that gas hydrates play a major role in making the sediment matrix more rigid [30]. Therefore, we would not expect highly consolidated rocks in the Iġnik Sikumi well, and the value of 2.5 would be too high for accurate sediment representation. In the second scenario (Figure 11, track 4), where a = 1.6 and m = 2.0, the Archie-derived gas hydrate saturation log curve closely matches the saturation log derived from the NMR and demonstrates zero gas hydrate saturation values in non-reservoir sections. In the water-bearing unit B, both the Archie- and NMR-calculated curves match. Also, the Archie parameters fall within the range of conditions believed to be suitable for the gas hydrate reservoir in the Iġnik Sikumi well (Figure 10 and Figure 11). Clearly, many different combinations of the Archie a and m parameters can be used to generate gas hydrate saturation log curves that can be fit to various independent data sets, but the selected parameters must be physically meaningful and accurately predict the physical conditions of the reservoir being examined. In this example, the parameter a was adjusted to keep the value for m within a reasonable range of values for the expected physical properties of the reservoir.
The results of the previously described integrated log display method are tested on the modified Pickett plots in Figure 9A–E. The water line (red line) representing the Archie parameters of a = 1.6 and m = 2.0 (Figure 9A–E) for the most part intercepts the cluster of water-bearing data points for units B and C. The analysis of the resistivity and acoustic sonic log data from the Iġnik Sikumi well also indicates that the reservoir intervals within unit B and a portion of the reservoir intervals within unit C were confirmed to be water-saturated [30]. Thus, the visual log display method used in this study appears to yield reasonable values that correlate with other approaches. Understanding the physical properties that control the selection of the Archie parameters allows the log display method to be used for wells without NMR- or core-derived saturations. This method was also applied to three additional wells (Table 2) in the area of the PBU-L Pad of the Eileen Gas Hydrate Trend (Figure 12A–D).
One of the goals in calculating gas hydrate saturations was to determine whether one set of Archie parameters could be used for multiple units in the same well. The Pickett plot approach alone did not yield definitive results. The new log display method, however, allowed for greater flexibility in the calculation of gas hydrate saturations, and one set of derived Archie parameters was able to reasonably predict gas hydrate saturations throughout all of the hydrate-bearing units in each of the wells examined in this study (Table 2). It was also noted that the well log-derived gas hydrate saturations varied between the three gas hydrate-bearing sands within units C, D, and E in all four wells examined in this study. The highest gas hydrate saturations were observed in the upper reservoir in unit C, with generally lower saturations in the unit D and lower unit C reservoirs and much lower values in unit E. These variations in calculated gas hydrate saturations are not assumed to be an indication of partial filling of available pore space but are believed to be the product of the petrophysical properties of each unit. The water-saturated reservoir sand units (i.e., reservoir units with no gas hydrates), however, are likely the result of larger-scale structural and stratigraphic controls on the source of the gas to charge the available reservoir sand units.

3.1.4. Reservoir Fluid Content and Permeability

The permeability of the reservoir system to the migration of water and gas is an important control on the formation of gas hydrates in nature. Most field studies show that the occurrence of concentrated gas hydrate accumulations is mostly controlled by the presence of fractures and/or coarse-grained sediments in which gas hydrates fill fractures or are disseminated in the pores of the sand-rich reservoirs [12,15,37,38,46,47,53,54,86,87]. It has been shown that hydrates grow preferentially in coarse-grained sediments because the higher permeability and lower capillary pressures in these sediments permit the migration of gas and the nucleation of hydrates [88].
Advances in NMR logging, formation wireline testing, and conventional formation testing yielded important information on how gas hydrates are physically distributed at the pore scale and the type and concentration of the pore-filling substances (i.e., gas hydrates, free water, clay-bound water, and capillary-bound water). Within the Eileen Gas Hydrate Trend, the hydrate-bearing reservoirs in the Mount Elbert, Iġnik Sikumi, and Hydrate-01 test wells were NMR logged, and the formation was tested by a combination of wireline deployed tools and flow testing [2,15,17,29,30,35,36,37]. Sediment cores recovered from the Mount Elbert and Hydrate-01 wells also yielded additional information on the petrophysical properties of the hydrate-bearing reservoir units in the Eileen trend. Porosity in the low-shale content sand reservoir sections of units C, D, and E averages about 40%. Core-derived estimates of intrinsic permeabilities in the hydrate-bearing reservoirs of the Mount Elbert well were high, with peak values measuring as high as 1000 mD [15,16]. Sediment cores from the Mount Elbert sand-rich, hydrate-bearing units are generally fine-grained [15,16]. Small changes in porosity (~4%), caused by going from poorly sorted to well-sorted intervals or due to modest decreases in grain size, result in substantial changes in reservoir intrinsic permeability, thus limiting the ability of gas and water to migrate into the potential reservoir sedimentary faces [15,16]. Clay-dominated layers bounding the sand bodies also serve as low-permeability seals or barriers to the vertical flow of gas and water.
The in situ NMR log measurements of effective permeabilities in the Mount Elbert hydrate-bearing reservoirs yield low values (0.01 to 0.1 mD), which have been attributed to the presence of gas hydrates filling the larger pores and impeding fluid flow in the reservoir section [15,16]. Evaluation of wireline formation tests of the upper unit C in the Mount Elbert well also yielded low effective permeability estimates in the range of 0.12 to 0.17 mD [15,16]. The NMR log in the Mount Elbert well also indicates the presence of both bound and free (mobile) water in the hydrate-bearing portion of the reservoir units, with the free water phase in the upper unit C exceeding 15% of measured pore volume. The successful depressurization of the upper unit C by fluid withdrawal during the formation wireline testing confirms the observation that even at low effective permeabilities, hydrate-bearing reservoirs contain moveable water. The NMR log in the Iġnik Sikumi well (Figure 13) also indicated the presence of clay-bound (~6%), capillary-bound (~7%), and free water (~6%) in the upper homogeneous and highly saturated hydrate-bearing portions of unit C [30]. Estimates of sediment permeabilities based on NMR measurements were calculated by the Schlumberger-Doll Research and Timur/Coates methods [89,90]. Both approaches generated permeability values greater than 1000 mD in the water-bearing portion of the unit C and B sands, but effective permeabilities were calculated to be less than 1 mD in the hydrate-bearing portion of the upper unit C.
The Schlumberger wireline deployed Pressure Express Tool (XPT) and the Modular Dynamic Tool (MDT) [91,92] for formation testing were used in the Iġnik Sikumi well to measure formation pressures and estimate fluid mobility (i.e., permeability) in units C and D [30]. Estimated XPT- and NMR-derived effective permeabilities were, in most cases, < 0.1 mD, similar to the values predicted from the NMR log. During the injection phase of the Iġnik Sikumi production test, where 6113.6 m3 (215,900 Mcf) of N2 and CO2 gas were injected into upper unit C, the effective permeability at the start of the test was estimated at 5.5 mD, and it decreased to values as low as 0.6 mD by the end of the injection phase [29].
The analysis of recovered pressure core samples from offshore Japan [48,52], India [54,55], and the Gulf of Mexico [38] has shown that the effective permeabilities within gas hydrate-bearing reservoirs may be higher than values predicted from analysis of NMR log and MDT testing data from both arctic terrestrial and marine gas hydrate research wells (as reviewed by Boswell et al. [17]). Recent studies of sidewall pressure cores acquired from the Hydrate-01 well [17,36] have also shown that the effective permeability of hydrate reservoir systems may be more variable and range from less than 1 mD to several 10s of mD. The analysis of the Iġnik Sikumi production test injection data also indicated relatively higher initial reservoir permeability with a reported value of 5.5 mD. For the analysis of the permeability controls on the occurrence of gas hydrates in this study, we have assumed that the NMR log-derived permeabilities can still be used to assess the relative petrophysical controls on the occurrence of gas hydrates in the hydrate-bearing reservoirs encountered within the Eileen trend.
The well log-derived gas hydrate saturations vary between the unit C, D, and E reservoirs in the Eileen Gas Hydrate Trend (Figure 12A–D). The non-hydrate-bearing portion of the pore volume in each reservoir is occupied by a combination of clay-bound, capillary-bound, and free water. We infer that each hydrate-bearing reservoir is filled to its “petrophysically defined capacity,” with the gas hydrate content varying with grain size, clay content, and bound and free water content. The dependency between petrophysical properties and gas hydrates and water content in a reservoir can be seen in the Iġnik Sikumi well display (Figure 13), where despite the fact that upper unit C has the lowest observed water saturations (or highest Sh), this unit actually contains relatively more free water and less bound water because of the low shale volume.
The concept of a “petrophysically defined capacity” for a gas hydrate occurrence was first developed in the 2008 U.S. Department of the Interior Minerals Management Service (now known as the Bureau of Ocean Energy Management) assessment of in-place gas hydrate resources in the Gulf of Mexico [58]. In that assessment study, the fraction of a particular rock volume, identified by lithology type, that contains “effective” void space (i.e., porosity) and can host gas hydrates was first calculated. For the next step in this process, the percent of the porosity that can be occupied by gas hydrates as a function of lithology and porosity type (sand, shale, and fractured reservoirs in this case) was derived from a database of wells where well logs and core data had been used to estimate gas hydrate saturations for a wide range of reservoir conditions.

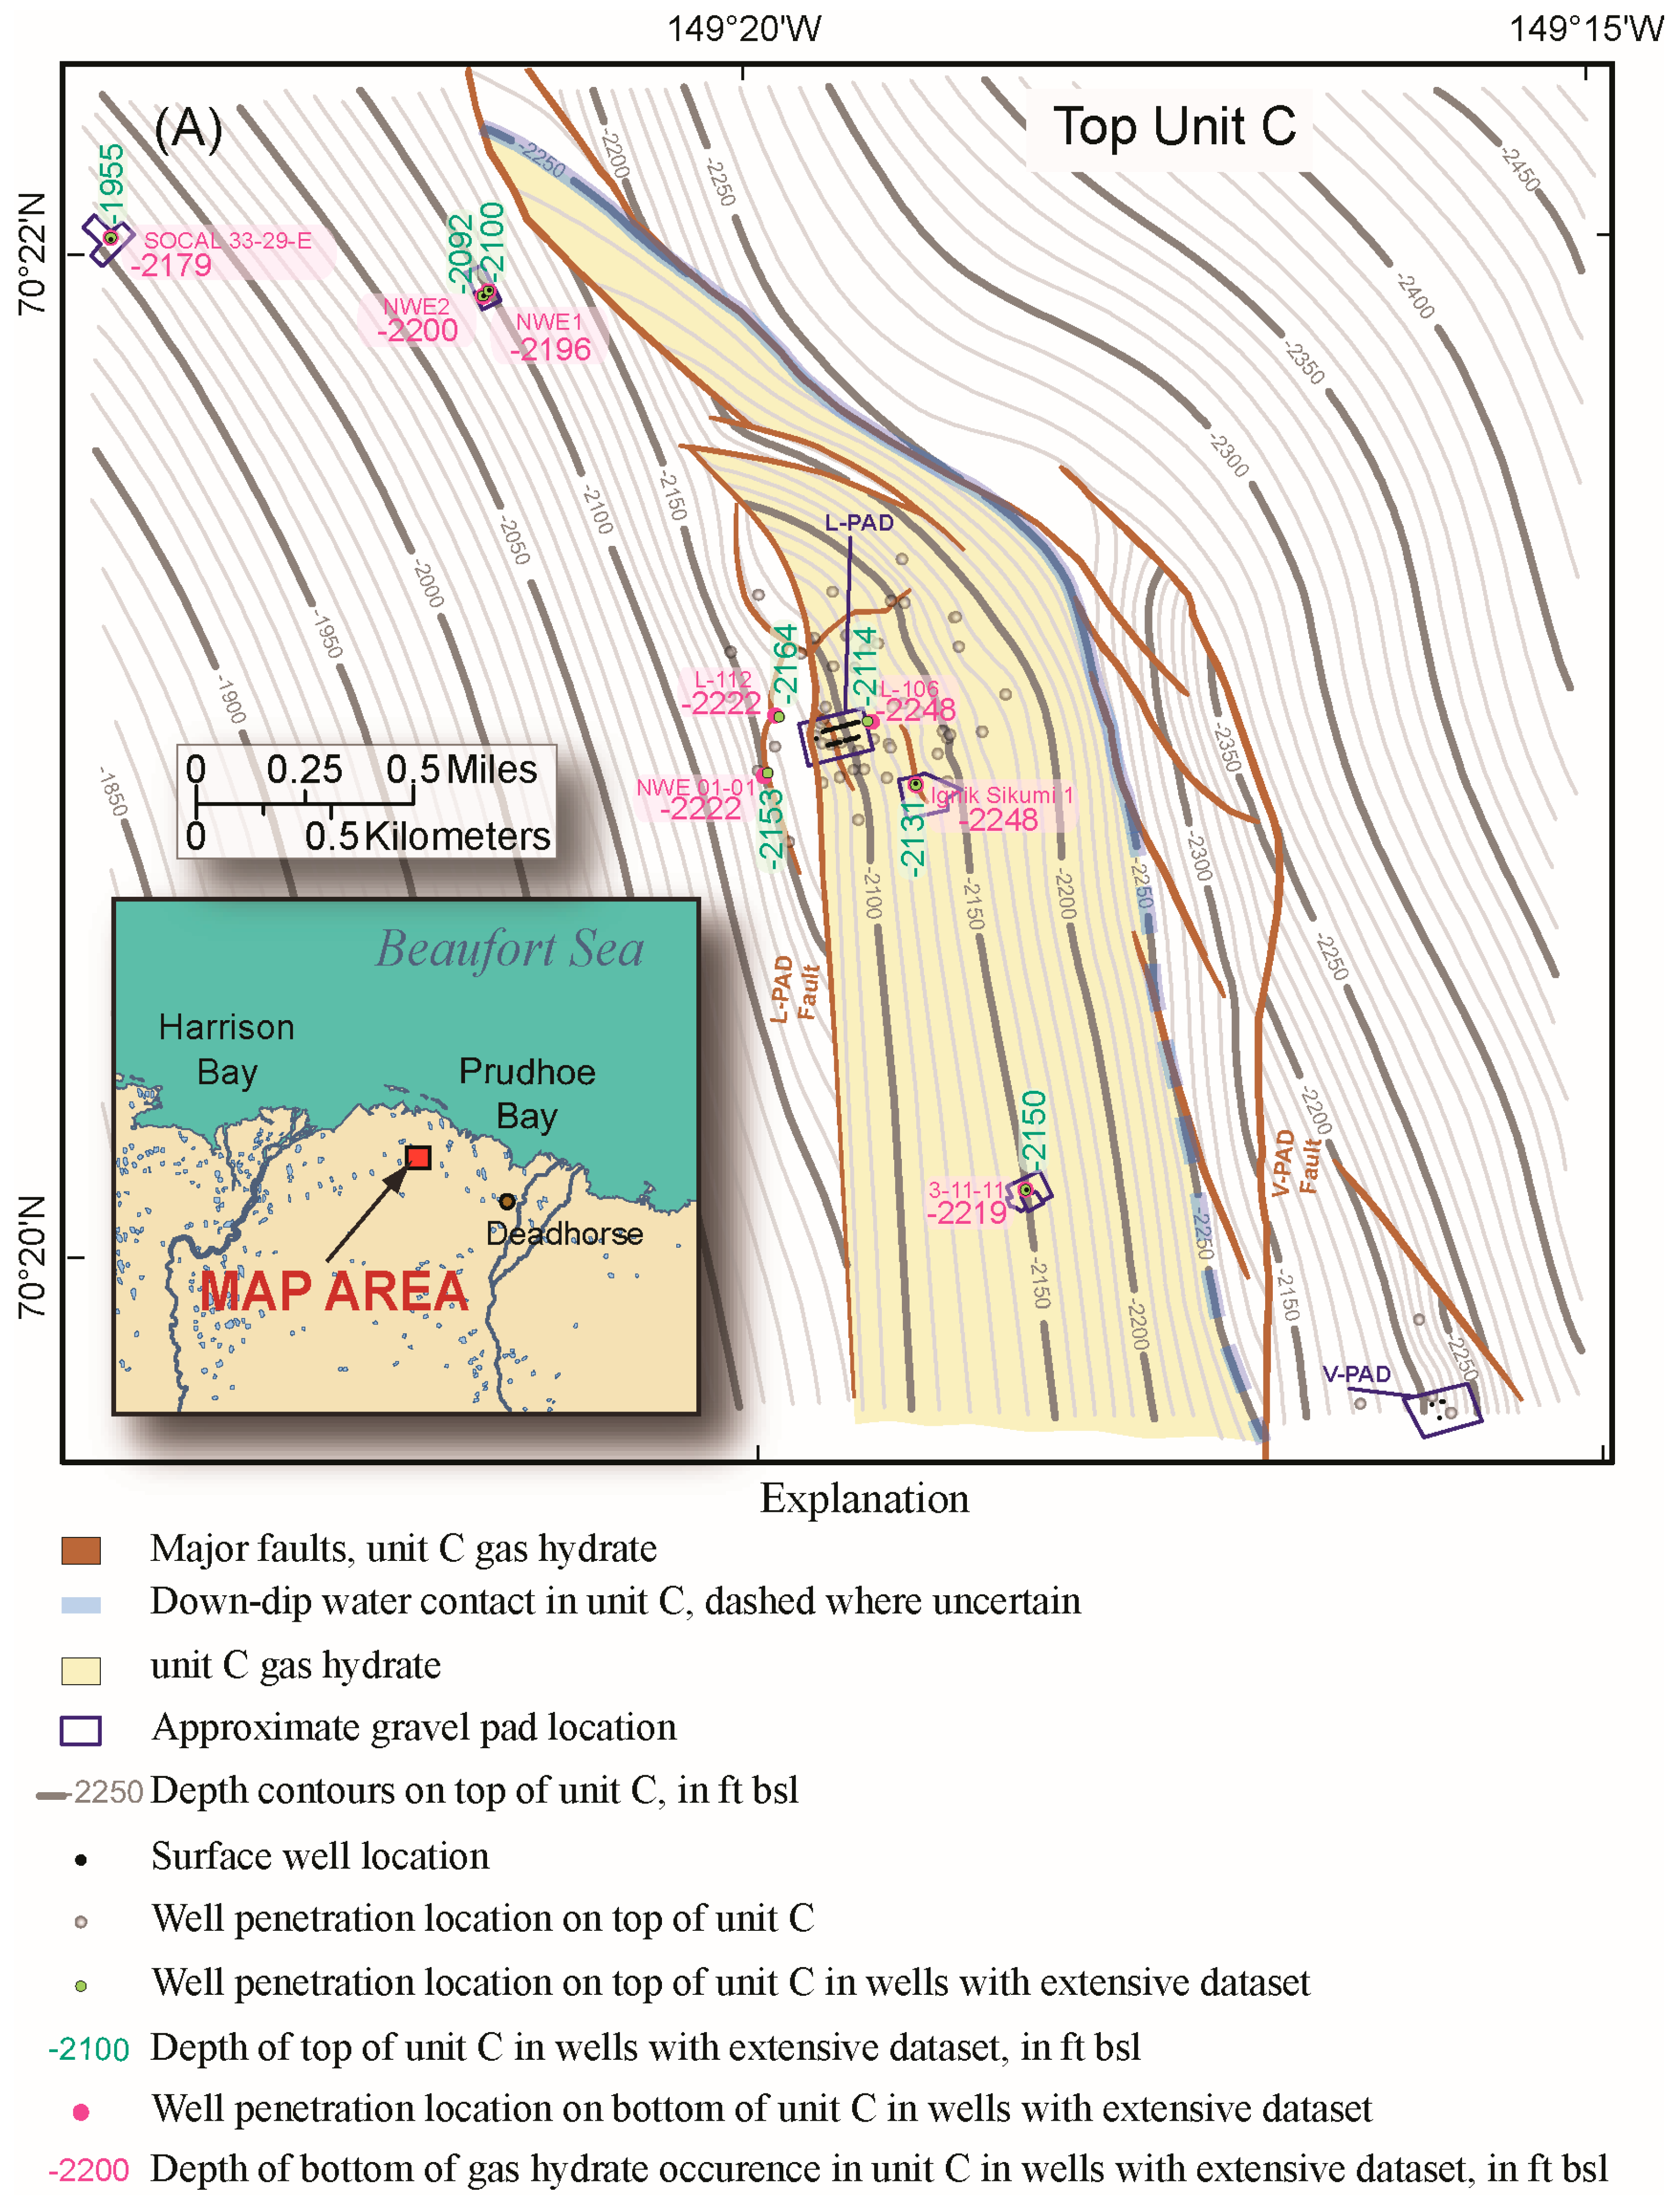
3.2. The Eileen Gas Hydrate Trend—Structural and Stratigraphic Controls on the Occurrence of Gas Hydrates

In order to examine the structural and stratigraphic controls on the occurrence of gas hydrates within the Eileen Gas Hydrate Trend, we combine information from well log-determined gas hydrate occurrences and reservoir saturations along with a refined structural and stratigraphic framework for the hydrate-bearing sand units.

3.2.1. Pre-Iġnik Sikumi Test Geological Framework Studies

One of the first critical steps in the Iġnik Sikumi test well project was the selection of a suitable production test site, which was conducted as a cooperative effort by geoscientists from the U.S. Department of Energy, ConocoPhillips, and the USGS [28,29,30]. Initially, seven sites thought to contain gas hydrates within the Eileen trend were examined based on criteria of infrastructure access and geologic risk of encountering gas hydrates. Two sites were selected for further detailed evaluation at the west end of the PBU: (1) the PBU L-Pad and (2) the Kuparuk State 3-11-11 wellsite [28]. Based on available log data, both locations were inferred to contain gas hydrate-bearing sands at the unit C, D, and E levels, similar to the logged and cored gas hydrate occurrences in the NWE2 and Mount Elbert wells.
Seismic data were not available for our evaluation of gas hydrate prospects in the west end of the PBU. Gamma ray well logs from 55 development wells from the PBU L-Pad were available and were used in this study to remap the local distribution of potential gas hydrate reservoirs in and around the well pad. One well (PBU L-106) contained a full suite of well logs for gas hydrate saturation estimation. The Kuparuk State 3-11-11 well site was less developed, with only one well penetration and a relatively thinner gas hydrate reservoir section in comparison to other well penetrations in the area (Figure 12E). Therefore, the PBU L-Pad became the focus of the Iġnik Sikumi test planning effort [28,30,32] (Figure 4, Figure 6, and Figure 7).
As part of the initial PBU L-Pad area test site review process, a numerical simulator was run based on the PBU L-106 data to predict how a gas hydrate production test well would perform at this site. Subsequent modeling studies have used gamma ray logs from 43 PBU L-Pad wells to develop a three-dimensional (3-D) geologic model that was used to model the potential gas hydrate reservoir response in the PBU L-Pad area [28]. Scheihing [93] also used available well log data and a 3-D seismic data volume to build a highly generalized structural map of several of the potential gas hydrate-bearing stratigraphic units in the area of the PBU L-Pad (Figure 14A–B). The structure map of the top of the youngest known gas hydrate-bearing unit (i.e., unit F) in Scheihing [93] was used by ConocoPhillips to construct a 3-D structural model for the PBU L-Pad gas hydrate accumulation. The resulting map and reservoir model showed that the gross interval thicknesses of the sand-dominated sections are fairly consistent across the area. Based on previous studies, Scheihing [93] described sands within units C, D, and E as gas hydrate-bearing and sands within units B and F as water-saturated.

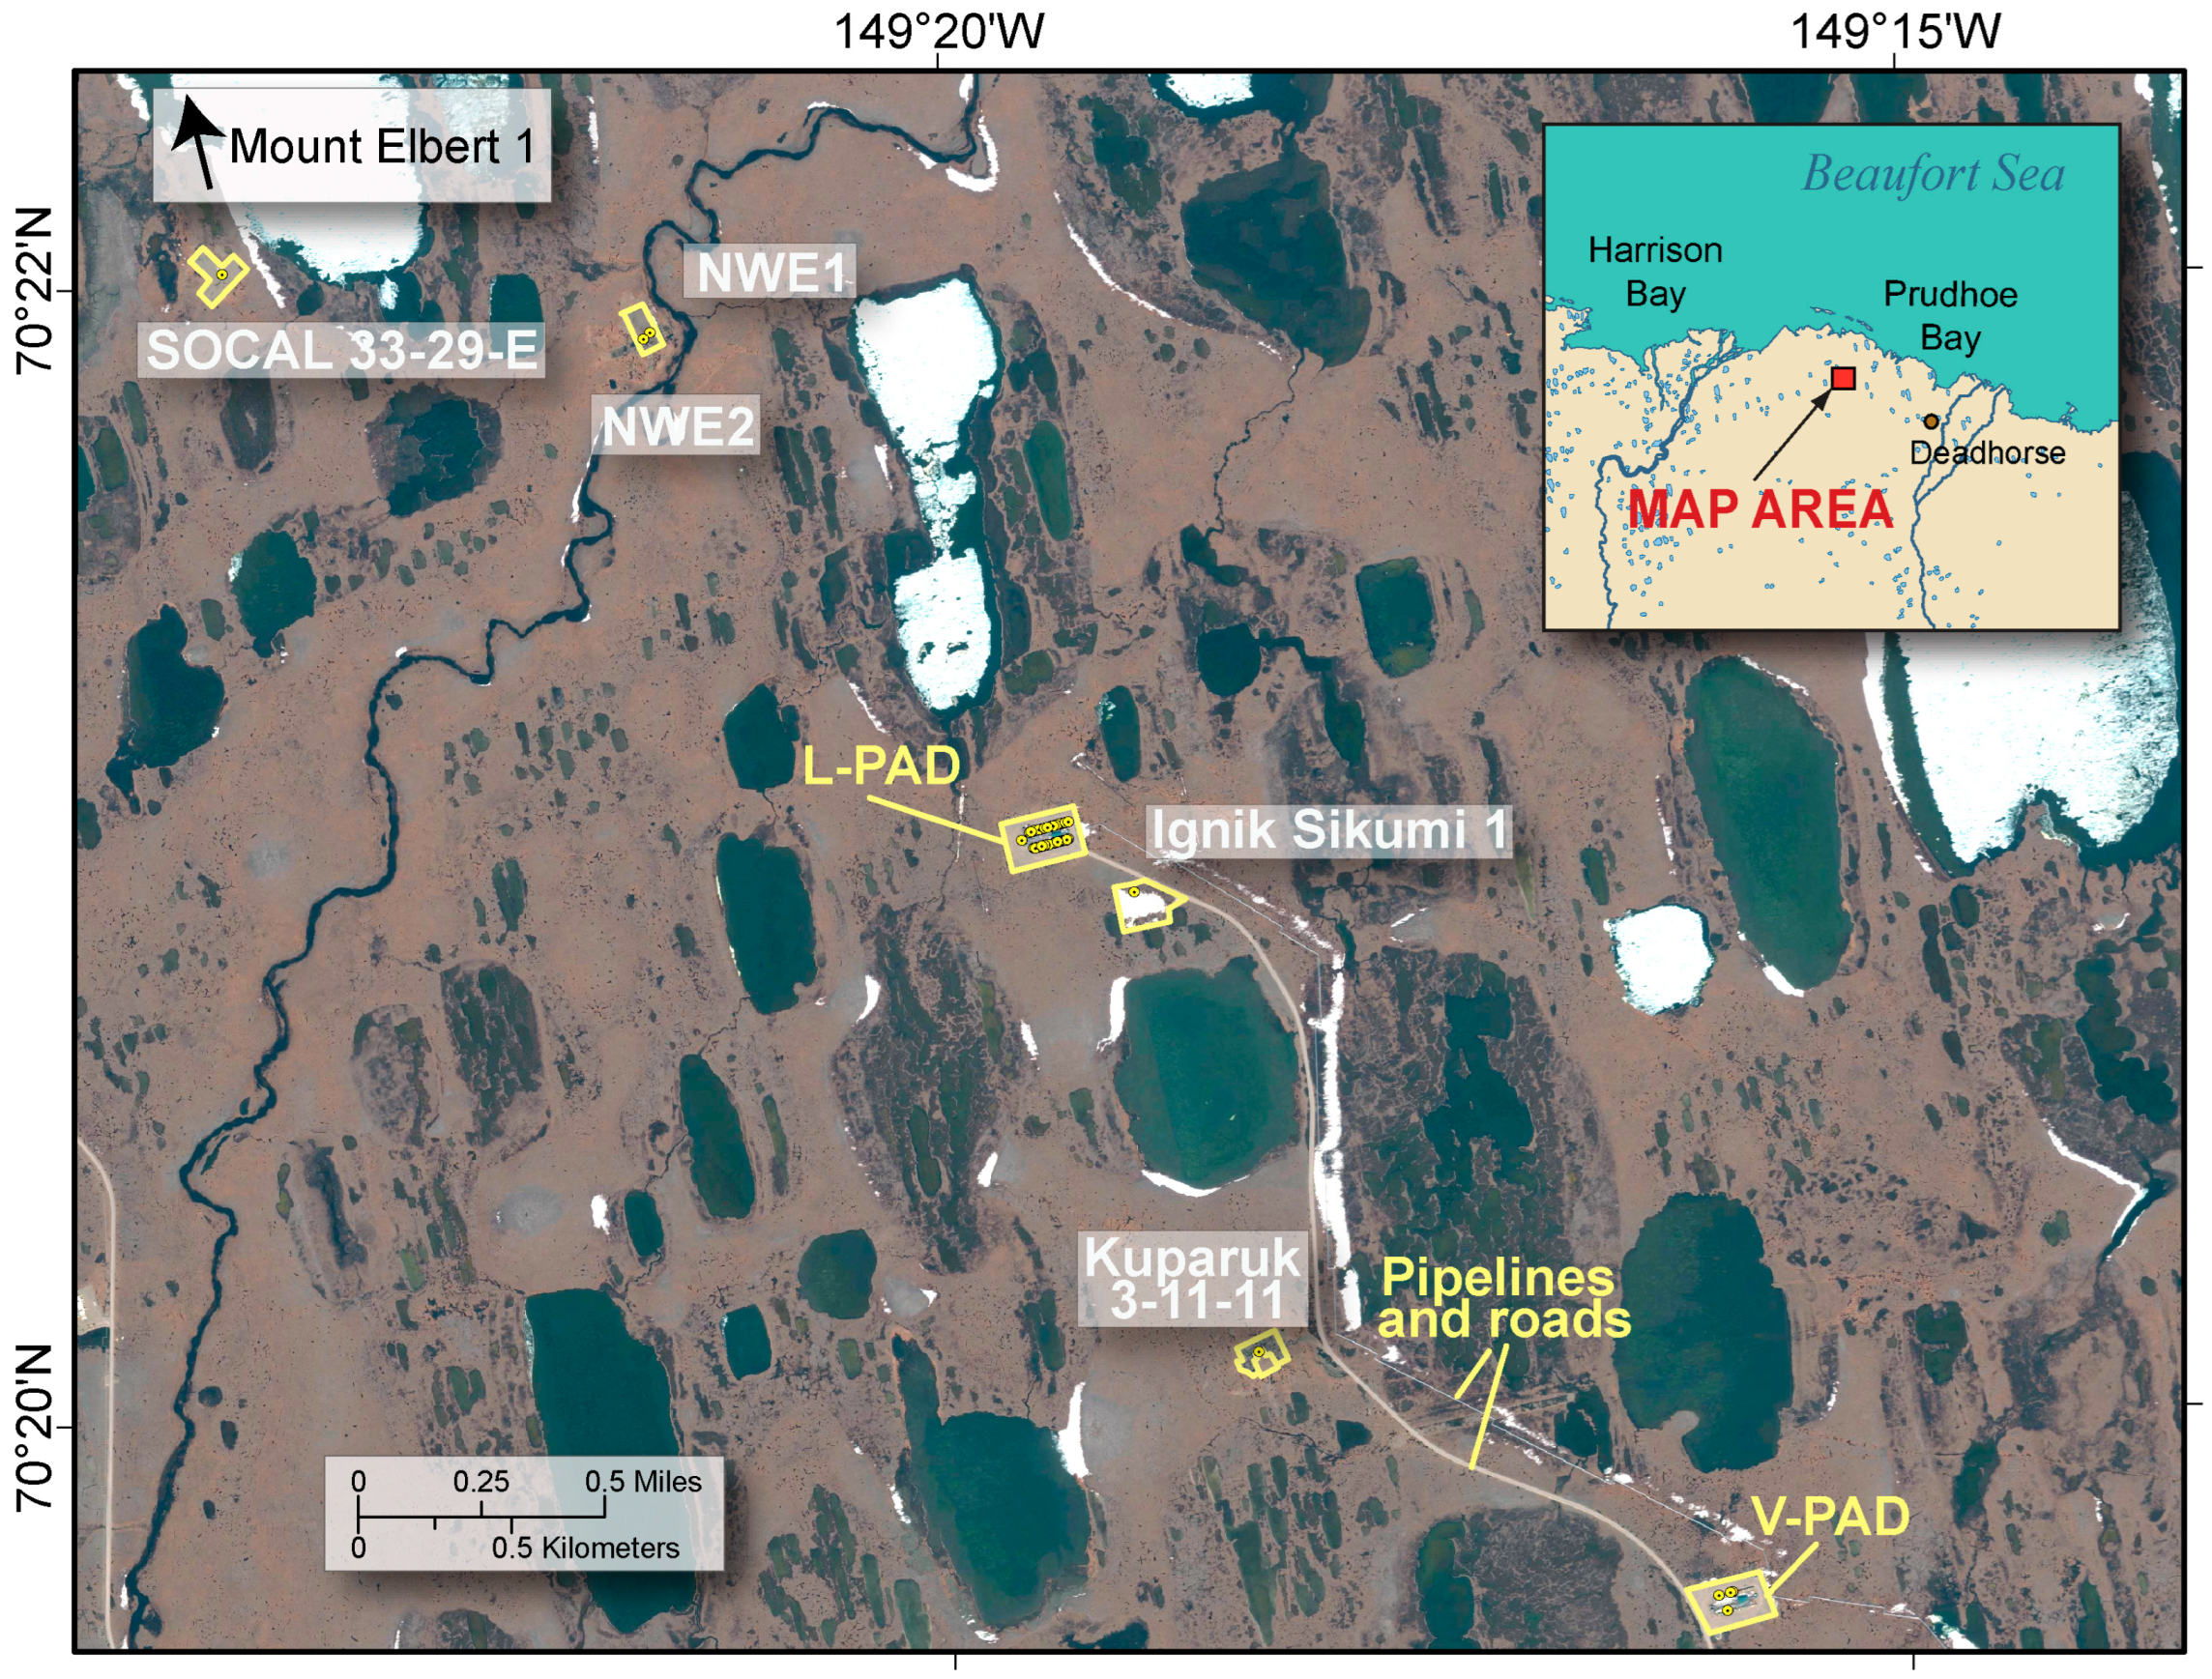
3.2.2. Post-Iġnik Sikumi Test Geological Framework Studies

In support of the analysis of the Iġnik Sikumi test results, we conducted an expanded and more detailed field study of the gas hydrate occurrences both in and around the PBU L-Pad. This new effort refined our understanding of the geologic controls on the occurrence of gas hydrates within the greater Eileen Gas Hydrate Trend, supported gas hydrate production modeling studies [20,21,28,29], and contributed to gas hydrate assessment efforts by the USGS.
Well log data from a total of 112 wells in the west end of the PBU and surrounding areas, including the SOCAL 33-29-E, Northwest Eileen State 1 (NWE1) and 2, PBU L-112, Northwest Eileen 01-01, PBU L-106, Iġnik Sikumi, Kuparuk 3-11-11, PBU V-107, and Mount Elbert wells, along with additional oil field development wells drilled from the PBU L-Pad and the PBU V-Pad (Figure 4, Figure 6, and Figure 7), were acquired from public files maintained by the Alaska Oil and Gas Conservation Commission [94]. A total of 90 wells that had sufficient gamma ray log data through the target interval of interest (units B through E) were used to map the geologic structure and determine the reservoir properties of the gas hydrate-bearing reservoirs (Figure 6 and Figure 7). Most of the wells in the study area are located on oil field development gravel pads and were drilled as deviated wells from the gravel pads to penetrate the deeper oil reservoirs some distance from the pads (Figure 6 and Figure 7).
Characterizing and mapping the geologic structure, the distribution of the major reservoir sand units, and the occurrence of gas hydrates within them was challenging due to the availability of only a limited number of published seismic interpretation images [30,95] and the limited nature of the well data in the study area. Previous studies on the ANS indicated that the general orientation of the regional deep faults in the oil-bearing sandstone of the Sadlerochit Group is northwest to southeast (Figure 14A–B) [29,30,32,65]. Deep faults in the vicinity of the PBU L-Pad also have a nearly north-south orientation [65]. Additional structural studies along the western margin of the Prudhoe Bay oil field have described the local faults as near-vertical, connecting deep and shallow sediments that have served as migration conduits and, in some cases, seals [13,18,28,29,30,32,65,95]. Because of the highly deviated nature of most of the wells utilized in this study, the well log data were analyzed for distortions related to high-angle penetrations of both geologic units and faults. As a starting point, all the available well log gamma ray signatures were converted to true vertical depth displays and correlated across the study area (Figure 15A,B). Evidence of fault-related displacements was inferred where wells showed repeated (or anomalously thickened) or missing (or anomalously thinned) sections. Discontinuities along some of the shallow mapped horizons were attributed to sediment erosion rather than faulting.
The stratigraphic framework as shown on north-south- and west-east-oriented cross sections (Figure 15A,B), through the approximate center of the study area, showed the presence of potential multiple thick sand reservoir units. Gross interval thicknesses are generally consistent across the study area. The upper boundaries of the major gas hydrate-bearing sand reservoir units (units A–F) appear as well-defined, continuous features on the well log correlation sections and are indicated by low gamma ray log values associated with increased sand volume.
The seismically defined geologic structure map of the top of unit F [95] (Figure 14A) was georeferenced with maps created in our study for units C and D (Figure 16A,B) to verify and extend the well log-derived structural framework. The locations of the faults as determined from the well log interpretation agree with the seismically imaged faults mapped by Silpngarmlert [95]. The well log-inferred faults in the area of the PBU L-Pad are mostly high-angle normal faults, and their mapped locations are nearly coincident with the published seismically mapped location of the faults at the top of unit F. The more deeply buried, nearly vertical fault systems mapped by Chatterton [65] were also georeferenced with the structures defined in this study and showed close spatial correlation between the two mapped systems. The close correlation between the well log- and seismic-inferred structural framework in the area of available overlapping data allowed the well log-inferred structural framework to be projected beyond the limits of the well log database. Seismically imaged, large-displacement faults, as shown by Silpngarmlert [95], were included in the composite structural–stratigraphic map (Figure 16A,B). The maps of the top of units C and D developed in this study reveal a monoclinal structure with a dip of about 3–5° to the east-northeast. This monocline is disrupted by several large arcuate, down-to-the-east, normal faults that trend roughly northwest-southeast.
A stratigraphic cross section using select wells with enough log data to distinguish the presence of gas hydrates has been plotted in Figure 17 through a portion of the Eileen Gas Hydrate Trend and shows the location of the PBU L-Pad and the Iġnik Sikumi well. Figure 17 also depicts the relationship of the delineated reservoir sections to the base of ice-bearing permafrost (BIBPF) and the predicted base of the GHSZ. In the area of the PBU L-Pad (Figure 17), the available porosity in upper unit C in the Iġnik Sikumi and PBU L-106 wells is inferred to be occupied fully by gas hydrates at high concentrations (~60–80%) (Figure 12A,B). The lower unit C, however, is only partially filled with gas hydrates, with a gas hydrate/water contact occurring at a depth of approximately 685 m (2248 ft) below sea level in both the PBU L-106 and Iġnik Sikumi wells. Considering the common gas hydrate/water contact depth in both the PBU L-106 and Iġnik Sikumi wells and the fact that both wells are located in the same mapped fault block (Figure 16A), the hydrate/water contact likely extends throughout the mapped fault bock. The apparent lack of gas hydrates in the lower unit C at the 3-11-11 well farther south suggests that other stratigraphic or structural heterogeneities may exist to the south of the L-pad. Assuming the occurrence of gas hydrates in unit C conforms to the structure map of the top of unit C, the likely minimum extent of the “PBU-L pad gas hydrate accumulation” can be mapped (yellow shading in Figure 16A).
The major PBU L-Pad “west bounding fault” showed more than 30 m (~100 ft) of throw at the depths of units C and D (Figure 16A and Figure 17) and is interpreted to act as the lateral trap to the gas hydrate-filled portions of units C and D in the mapped structure. The eastern limit of the lower unit C gas hydrate accumulation at the PBU L-Pad is defined by the hydrate/water contact observed in the PBU L-106 and Ignik Sikumi wells at a common depth of 685 m (2248 ft). The closure along the northern part of the structure appears to be against a series of northwest to southeast-trending arcuate faults. The control on the occurrence of gas hydrates in unit C to the south is less clear. In Figure 16A, the PBU L-Pad “west bounding fault” and the top of unit C structural contours are shown extending to the south; the southern limit of the gas hydrate accumulation in this fault block is depicted as unknown. The map of unit C (Figure 16B) and the well log cross section (Figure 17) indicate that the Kuparuk 3-11-11 well is inferred to be located in the same fault block with the PBU L-106 and Ignik Sikumi wells; as such, the gas hydrate/water contact would be at the same depth in all three wells. In the Kuparuk 3-11-11 well, however, the occurrence of gas hydrates is limited to upper unit C (the base of which is at a depth of 676 m (2219 ft)), with no gas hydrates in lower unit C (Figure 12E, Figure 16A, and Figure 17).
The PBU L-112 and Northwest Eileen 01-01 wells also penetrated gas hydrate-bearing sediments in the upper unit C in a down-thrown fault block west of the PBU L-Pad “west bounding fault” (Figure 16A and Figure 17). In both wells, upper unit C is only partially filled with gas hydrates, with a gas hydrate/water contact occurring at a common depth of approximately 677 m (2222 ft). The NWE2 and SOCAL 33-29-E wells are located to the northwest of the PBU L-112 and Northwest Eileen 01-01 wells and are separated from them by an up-to-the-northwest normal fault (Figure 17). Unit C in the NWE2 (Figure 12D) and SOCAL 33-29-E wells appears to be partially filled with gas hydrates, with the well log-inferred gas hydrate/water contacts at depths of 670 m (2196 ft) and 664 m (2179 ft), respectively.
At the far down-dip end of the cross section (Figure 17), the PBU V-107 well is separated from the units C, D, and E gas hydrate occurrences in the greater PBU L-Pad area by a series of north-south trending faults (Figure 16A,B). Well logs from the PBU V-107 well do not indicate the presence of gas hydrates at any depth in the area of the PBU V-pad. Thus indicating possible structural controls on the occurrence of gas hydrates in that area.
The structure map of the top of unit D closely matches that of the top of unit C (Figure 16A,B). The top of unit D is marked by an abrupt contact from what appears to be a high-quality sand reservoir section into an overlying high-gamma ray shale (Figure 17). Unit D appears to be gas hydrate-bearing throughout most of the area examined in this study (Figure 16B). Within the fault block penetrated by the PBU L-106, Iġnik Sikumi, and Kuparuk 3-11-11 wells, the depth to the base of the gas hydrate occurrence in unit D varies between wells and conforms to the stratigraphic dip, unlike that for unit C. In addition, the reservoir portion of unit D is inferred to be fully occupied by gas hydrates at high concentrations (i.e., to its “petrophysically defined capacity”) in the immediate area of the PBU L-Pad. Thus, the occurrence of gas hydrates in unit D appears to be controlled in part by stratigraphy and reservoir quality.
The arealnature of gas hydrate occurrence in the shallower unit E could not be determined with certainty due to the poor data quality and distribution of the wells at shallow depths around the PBU L-Pad. The unit E reservoir section is entirely filled with gas hydrates, much like unit D in the PBU L-Pad fault block (Figure 17). However, both units D and E were determined to be void of or only partially filled with gas hydrates in the wells drilled up-dip of the PBU L-Pad.
Finally, the more deeply buried, massively bedded, high porosity, sand-rich unit B in the PBU L-Pad area wells was interpreted to be a water-bearing unit with no gas hydrates [28,29,30], which has been attributed to the lack of trap development in this potential reservoir section.

4. Discussion—The Eileen Gas Hydrate Trend—Controls on the Occurrence of Gas Hydrates

This study, along with contributions from Collett et al. [13], Hunter et al. [15], Boswell et al. [16,17,29], Tamaki et al. [18], and Yoneda et al. [36,37], documented that gas hydrates in the Eileen Gas Trend occur over a wide range of conditions. One of the most distinct observations relative to the nature of the gas hydrate occurrences in the Eileen Gas Trend is the fact that all of the seismic, well log, and cored gas hydrates are found within coarse-grained sedimentary units. In most cases, the lower boundary of the inferred gas hydrate occurrences is often marked by sharp contacts (Figure 17). In some cases, this sharp contact appears despite the fact that there are additional sand-rich, water-saturated reservoir units below the base of the deepest gas hydrate occurrence [13,17,18,29,36,37]. This suggests that the reservoir intervals were only partially filled by gas hydrates, as seen in lower unit C in the Iġnik Sikumi (Figure 12A), PBU L-106 (Figure 12B), PBU L-112 (Figure 12C), NWE2 (Figure 12D), and Northwest Eileen 01-01 wells. Further analysis of gas hydrates and water contacts across the study area suggests the presence of laterally extensive hydrate- and water-bearing reservoir sections along with a series of major north-south trending faults that compartmentalize the reservoirs into several discrete structural fault blocks. These fault blocks contain thick gas hydrate accumulations, often in contact with underlying water-bearing reservoir sections. The occurrence of gas hydrates in distinct, mappable reservoir sand units that are only partially filled with gas hydrates further supports the model that the formation of gas hydrate accumulations in northern Alaska is closely associated with the onset of cold Arctic conditions and the formation of permafrost [13,17,18,29], with the onset glaciation at the end of the Pliocene (about 1.88 Ma). In this model, migrating gas from below was initially trapped as conventional gas accumulations within sand-rich reservoirs, and with cooling, the gas within the shallow reservoirs was taken up into gas hydrates. At the depth (pressure conditions) of the Eileen Gas Hydrate Trend, the conversion of free gas to a gas hydrate would lead to a volumetric reduction in the reservoir fill and the establishment of partially filled gas hydrate-bearing reservoir systems. As described by Dallimore and Collett [12], the partially filled gas hydrate sand-rich reservoirs positioned near the top of a large structural dome-like feature at the Mallik site in the Mackenzie Delta of Canada also support the model for terrestrial Arctic gas hydrate accumulations being the product of older converted conventional free gas accumulations.
The occurrence of gas hydrates in the Eileen Gas Hydrate Trend is also controlled in part by the “quality” or clay content (Vsh) of the potential reservoir sections (Figure 12A–E and Figure 17). For example, the unit D reservoir section, with Vsh values of < 30%, in the PBU L-106 (Figure 12B) and Iġnik Sikumi (Figure 12A) wells appears to be entirely filled with gas hydrates at high saturations (~70%). However, the gas hydrate-bearing portion of the unit C reservoir section in the same two wells is underlain and in direct contact with a water-saturated reservoir section (i.e., with Vsh values of < 30%). Along the well log correlation section in Figure 17, the unit C gas hydrate-bearing reservoirs in the Kuparuk 3-11-11 well (Figure 12E) thin to about half the thickness of the reservoir section observed in the PBU L-106 and Iġnik Sikumi wells (Figure 12A,B), and the gas hydrate-bearing reservoir section appears to be underlain by both thinly bedded non-reservoir Vsh-rich sections and water-saturated reservoir sections. A critical question reviewed here is: What are the geologic and reservoir controls on these two very different gas hydrate occurrences in the same stratigraphic section?
A closer examination of the well log data (Figure 12A–B) reveals that the hydrate- and water-bearing reservoir sections in unit C of the PBU L-106 and Iġnik Sikumi wells are about 91 and 62 m (297 and 203 ft) thick, respectively. However, the hydrate- and water-bearing reservoir section in unit C of the Kuparuk 3-11-11 (Figure 12E) is only about 46 m (151 ft) thick. In comparison, the lower unit C in Kuparuk 3-11-11 consists mostly of a series of thinly bedded non-reservoir shale-rich sections and interbedded water-saturated sands. Unit C sands contain only minor gas hydrates further to the south at the Hydrate-01 location [17].
As previously discussed, the petrophysical properties of the sedimentary section are important controls on the occurrence of gas hydrates. The well log displays (Figure 12A–D and Figure 13) indicate that the occurrence of gas hydrates within the stratigraphic section (Figure 17) at a given site is controlled in part by the “quality” of the reservoir, or in this case, the Vsh within the stratigraphic section. Most of the well log-inferred gas hydrate-bearing reservoir sections in the Eileen Gas Hydrate Trend exhibit well log-inferred Vsh values of < 30%. It is assumed that clays dispersed in the coarse-grained sediment matrix in each potential reservoir section limit the entry of gas into the available pore space and subsequent nucleation of gas hydrates, thus limiting the “petrophysically defined capacity” of the fine sand and coarse silt reservoirs to contain gas hydrates. In the case where the sedimentary section has Vsh values of < 30%, either gas hydrates and/or water are found nearly completely filling the available reservoir section.
The analysis of the log and core data acquired from the Mount Elbert and Hydrate-01 gas hydrate stratigraphic test wells [15,16,17,18,36,37] has yielded additional information on the petrophysical controls on the occurrence of gas hydrates in the Eileen Gas Hydrate Trend. For example, the B1 sand in the Hydrate-01 reservoir section clearly shows that reservoir quality (i.e., Vsh) is likely the primary control on the log- and core-inferred gas hydrate saturations. The derived gas hydrate saturation in the Hydate-01 B1 sand reaches a maximum value of about 80% near the top of the section and steadily decreases with depth in the unit. The reservoir quality (i.e., Vsh) also decreases with depth over the entire length of the Hydrate-01 B1 sand, which again indicates a direct connection between reservoir properties such as porosity and Vsh content and the log- and core-inferred gas hydrate saturations.
If we look beyond what we have learned from the Arctic terrestrial permafrost environment, our experience associated with the analysis of the gas hydrate system concept has been extended to numerous marine-related gas hydrate systems [6,7,23,24,25,26,27,42,43,44,45,46,47,48,49,50,51,52,53,54,86,87]. In the case of the marine gas hydrate occurrences discovered during the India National Gas Hydrate Program Expedition 02 (NGHP-02) [54], this expedition had the singular goal of finding and characterizing the geologic controls responsible for the formation of highly concentrated gas hydrate accumulations. Much like in Alaska, the analysis of well log and core data confirmed the occurrence of extensive sand-rich depositional systems in the Krishna–Godavari Basin that range from fully to partially filled with gas hydrates. Despite the existence of extensive reservoir capacity, it was shown that the supply (i.e., source) of gas at some of the NGHP-02 sites was insufficient to charge the reservoirs with the gas needed for gas hydrate formation. These discoveries further highlighted the value of applying the gas hydrate system concept to both terrestrial Arctic and permafrost settings.
The ever-growing list of marine gas hydrate system studies [42], including millstone accumulation scale system modeling studies, in the Nankai Trough [51,52], Gulf of Mexico [23,24], Hikurangi margin off New Zealand [6,22], Danube Fan in the Black Sea [25], the continental margin of Norway [7], and Lake Baikal [27] have contributed greatly to our understanding of how the various components of a gas hydrate system can directly control the occurrence of gas hydrates over a wide range of physical scales and within an equally complex range of geologic conditions.
The information gained from this study, which focused mostly on the structural/stratigraphic and related reservoir-scale petrophysical conditions controlling the occurrence, distribution, and physical nature of gas hydrates in the ANS Eileen Gas Hydrate Trend, can also be applied and contrasted with the analysis of similar marine gas hydrate systems. This same information has also been used to advance our understanding of how the various components of a gas hydrate system impact the results of recent field gas hydrate production tests as reviewed by Yamamoto et al. [2].

5. Conclusions

The long history of conventional petroleum exploration and production in northern Alaska, along with the insight gained from the Mount Elbert, Iġnik Sikumi, and Hydrate-01 dedicated gas hydrate test well projects, have yielded the geologic and reservoir engineering data needed to thoroughly characterize the occurrence of gas hydrates within the Eileen Gas Hydrate Trend on the ANS. Previous studies have yielded proven exploration targets and confirmed the presence of definable gas hydrate accumulations associated with the Eileen Gas Hydrate Trend. Building on this work, we have established a more complete understanding of structural–stratigraphic and reservoir controls on the occurrence of gas hydrates.
We have shown that the occurrence of gas hydrates in the Eileen Gas Hydrate Trend at the accumulation or prospect scale is controlled by the availability of gas (i.e., gas charge) and favorable structural and stratigraphic conditions that allow for the migration and trapping (i.e., storage) of gas that is ultimately converted into gas hydrate accumulations.
At the reservoir scale, we have shown that the petrophysical properties (i.e., porosity, permeability, Vsh) of the host reservoir are one of the most important controls on the accumulation and formation of highly concentrated gas hydrates over a wide range of scales. Lateral and vertical stratigraphic variations in reservoir petrophysical properties and other related geologic properties (i.e., reservoir mineralogy and sedimentology) have also been shown to control the occurrence and distribution of gas hydrates in the Eileen Gas Hydrate Trend. As discussed above for unit C both in and around the wells associated with the PBU L-Pad and for the B1 sand reservoir section in the Hydrate-01 well, we proposed that the petrophysical properties of the host reservoir (e.g., porosity, permeability, and Vsh) are the primary factors defining the “petrophysical capacity or limit” of a reservoir to host gas hydrates as a given saturation.
Finally, the interplay between the structural and stratigraphic relationships of the reservoir unit and the efficiency of gas delivery to the reservoir is collectively one of the most important fundamental controls on the occurrence of gas hydrates in the Eileen Gas Hydrate Trend.
The combined analysis of well log- and core-derived data and insights gained from previous seismic data studies demonstrates the occurrence of gas hydrates in the Eileen Gas Hydrate Trend is controlled by a series of interrelated petrophysical, stratigraphic, and structural controls. Thus, further establishing the utility of the petroleum system concept as it was applied here for gas hydrate system analysis has provided an important analytical approach for the characterization of the geologic controls on the occurrence of similar gas hydrate systems in both Arctic permafrost and deep marine environments.
With the successful confirmation of the presence of gas hydrate-bearing reservoirs at the Hydrate-01 Stratigraphic Test well site, additional work is required to determine the suitability of this site for future production testing. Most of these concerns go far beyond geologic-related issues and deal mostly with engineering concerns such as well configuration and related completion designs. The completion design efforts will need to address a host of poorly constrained concerns, such as unknown rates of produced gas, water, and solids (formation sediment). The design of the artificial lift system and surface production facilities to effectively deal with co-produced formation water and gas will be a critical concern. The establishment of a test site monitoring system to track the impact of gas hydrate production on the environment will also be required to allow the implementation of a safe scientific gas hydrate production test.

Author Contributions

Considering the multiauthor nature of this contribution we want to acknowledge the following specific contributions of each author: Conceptualization, M.Z., T.C., and R.B.; methodology, M.Z., and T.C.; formal analysis, M.Z. and T.C.; writing—original draft preparation, M.Z., and T.C.; writing—review and editing, M.Z., T.C., and R.B. All authors have read and agreed to the published version of the manuscript.

Funding

This work was funded by the U.S. Department of Energy (Award Number: DE-FE0022898; 01-Septembet-2014–31-December-2015), the U.S. Bureau of Land Management (Award Number: L08PG04260; 01-October-2015–31-September-2018), and the Energy Resources Program of the U.S. Geological Survey.

Institutional Review Board Statement

Not applicable.

Informed Consent Statement

Not applicable.

Data Availability Statement

Data used in this study is available upon request to T. Collett the corresponding author associated with this publication. In addition, the well log data used in this study are also available from State of Alaska (USA) public database that is maintained by the Alaska Oil and Gas Conservation Commission (https://www.commerce.alaska.gov/web/aogcc/).

Acknowledgments

We acknowledge the very helpful peer reviews provided by Kristen Lewis and Stanley Paxton. Any use of trade, firm, or product names is for descriptive purposes only and does not imply endorsement by the U.S. Government.

Conflicts of Interest

The authors declare no conflict of interest.

References

  1. Yamamoto, K.; Nagakubo, S. Review of Energy Efficiency of the Gas Production Technologies from Gas Hydrate-Bearing Sediments. Front. Energy Res. 2021, 9, 741715. [Google Scholar] [CrossRef]
  2. Yamamoto, K.; Boswell, R.; Collett, T.S.; Dallimore, S.R.; Lu, H. Review of past gas production attempts from subsurface gas hydrate deposits and necessity of long-term production testing. Energy Fuels 2022, 36, 5047–5062. [Google Scholar] [CrossRef]
  3. Khabibullin, T.; Falcone, G.; Teodoriu, C. Drilling through gas-hydrate sediments: Managing wellbore-stability risks. SPE Drill. Complet. 2011, 26, 287–294. [Google Scholar] [CrossRef]
  4. Nixon, M.F.; Grozic, J.L.H. A simple model for submarine slope stability analysis with gas hydrates. Nor. J. Geol. 2006, 86, 309–316. [Google Scholar]
  5. Crutchley, G.J.; Gorman, A.R.; Fohrmann, M. Investigation of the role of gas hydrates in continental slope stability west of Fiordland, New Zealand, New Zealand. J. Geol. Geophys. 2010, 50, 357–364. [Google Scholar] [CrossRef]
  6. Barnes, P.M.; Lamarche, G.; Bialas, J.; Henrys, S.; Pecher, I.; Netzeband, G.L.; Greinert, J.; Mountjoy, J.J.; Pedley, K.; Crutchley, G. Tectonic and geological framework for gas hydrates and cold seeps on the Hikurangi subduction margin, New Zealand. Mar. Geol. 2010, 272, 26–48. [Google Scholar] [CrossRef]
  7. Bünz, S.; Mienert, J.; Berndt, C. Geological controls on the Storegga gas-hydrate system of the mid-Norwegian continental margin. Earth Planet. Sci. Lett. 2003, 209, 291–307. [Google Scholar] [CrossRef]
  8. Ruppel, C.D.; Kessler, J.D. The interaction of climate change and methane hydrates. Rev. Geophys. 2017, 55, 126–168. [Google Scholar] [CrossRef]
  9. Collett, T.S.; Johnson, A.H.; Knapp, C.C.; Boswell, R. Natural gas hydrates: A review. Am. Assoc. Pet. Geol. Mem. 2009, 89, 146–219. [Google Scholar]
  10. Johnson, A.H. Global Resource Potential of Gas Hydrate—A New Calculation. Fire Ice 2011, 11, 1–4. [Google Scholar]
  11. Cherskiy, N.V.; Tsarev, V.P.; Nikitin, S.P. Investigation and prediction of conditions of accumulation of gas resources in gas-hydrate pools. Pet. Geol. 1985, 21, 65–89. [Google Scholar]
  12. Dallimore, S.R.; Wright, J.F.; Yamamoto, K.; Bellefleur, G. Proof of concept for gas hydrate production using the depressurization technique, as established by the JOGMEC/NRCan/Aurora Mallik 2007−2008 Gas Hydrate Production Research Well Program. Geol. Surv. Can. Bull. 2012, 601, 1–15. [Google Scholar]
  13. Collett, T.; Lee, M.; Agena, W.; Miller, J.; Lewis, K.; Zyrianova, M.; Boswell, R.; Inks, T. Permafrost-associated natural gas hydrate occurrences on the Alaska North Slope. J. Mar. Pet. Geol. 2011, 28, 279–294. [Google Scholar] [CrossRef]
  14. Collett, T.S.; Lee, M.W. Well log characterization of natural gas hydrates. Petrophysics 2012, 53, 348–367. [Google Scholar]
  15. Hunter, R.; Collett, T.; Boswell, R.; Anderson, B.; Digert, S.; Pospisil, G.; Baker, R.; Weeks, M. Mount Elbert gas hydrate stratigraphic test well, Alaska North Slope: Overview of scientific and technical program. J. Mar. Pet. Geol. 2011, 28, 295–310. [Google Scholar] [CrossRef]
  16. Boswell, R.; Collett, T.S.; Anderson, B.; Hunter, R. (Eds.) Thematic Set on Scientific Results of the Mount Elbert Gas Hydrate Stratigraphic Test Well, Alaska North Slope. In Marine and Petroleum Geology; Elsevier: Amsterdam, The Netherlands, 2011; Volume 28, pp. 279–608. [Google Scholar]
  17. Boswell, R.; Collett, T.S.; Yamamoto, K.; Okinaka, N.; Hunter, R.; Suzuki, K.; Tamaki, M.; Yoneda, J.; Itter, D.; Haines, S.; et al. Scientific results of the Hydrate-01 Stratigraphic Test Well Program, western Prudhoe Bay Unit, Alaska North Slope. Energy Fuels 2022, 36, 5167–5184. Available online: https://pubs.acs.org/doi/10.1021/acs.energyfuels.2c00327?ref=pdf (accessed on 10 February 2024).
  18. Tamaki, M.; Fujimoto, A.; Boswell, R.; Collett, T.S. Geological reservoir characterization of a gas hydrate prospect associated with the Hydrate-01 Stratigraphic Test Well, Alaska North Slope. Energy Fuels 2022, 36, 8128–8149. [Google Scholar] [CrossRef]
  19. Moridis, G.J.; Kowalsky, M.B.; Pruess, K. Depressurization induced gas production from class 1 hydrate deposits. SPE Res. Eval. Eng. 2007, 10, 458–481. [Google Scholar] [CrossRef]
  20. Nakajima, C.; Ouchi, H.; Tamaki, M.; Akamine, K.; Sato, M.; Ohtsuki, S.; Naiki, M. Sensitivity and uncertainty analysis for natural gas hydrate production testing in Alaska. Energy Fuels 2022, 36, 7434–7455. [Google Scholar] [CrossRef]
  21. McGuire, D.; Runyon, S.; Sigal, R.; Liddel, B.; Williams, T.; Moridis, G. Methane Hydrate Production form Alaskan Permafrost – Hydrate Reservoir Characterization and Modeling; U.S. DOE-NETL Topical Report, DOE Award No. DE-FC26-01NT41331; US DOE/NETL: Washington, DC, USA, 2005; 139p. Available online: https://netl.doe.gov/sites/default/files/netl-file/A013105_hydrate_reservoir_characterization_and_modeling.PDF (accessed on 10 February 2024).
  22. Burton, Z.; Kroeger, K.F.; Hosford Scheirer, A.; Seol, Y.; Burgreen-Chan, B.; Graham, S.A. Tectonic uplift destabilizes subsea gas hydrate: A model example from Hikurangi margin, New Zealand. Geophys. Res. Lett. 2020, 47, e2020GL087150. [Google Scholar] [CrossRef]
  23. Burton, Z.F.M.; Dafov, L.N. Salt Diapir-Driven Recycling of Gas Hydrate. Geochem. Geophys. Geosystems 2023, 24, e2022GC010704. [Google Scholar] [CrossRef]
  24. Burwicz, E.; Reichel, T.; Wallmann, K.; Rottke, W.; Haeckel, M.; Hensen, C. 3-D basin- scale reconstruction of natural gas hydrate system of the Green Canyon, Gulf of Mexico. Geochem. Geophys. Geosystems 2017, 18, 1959–1985. [Google Scholar] [CrossRef]
  25. Hillman, J.I.; Burwicz, E.; Zander, T.; Bialas, J.; Klaucke, I.; Feldman, H.; Drexler, T.; Awwiller, D. Investigating a gas hydrate system in apparent disequilibrium in the Danube Fan, Black Sea. Earth Planet. Sci. Lett. 2018, 502, 1–11. [Google Scholar] [CrossRef]
  26. Piñero, E.; Hensen, C.; Haeckel, M.; Rottke, W.; Fuchs, T.; Wallmann, K. 3-D numerical modelling of methane hydrate accumulations using PetroMod. Mar. Pet. Geol. 2016, 71, 288–295. [Google Scholar] [CrossRef]
  27. Naudts, L.; Khlystov, O.; Granin, N.; Chensky, A.; Poort, J.; De Batist, M. Stratigraphic and structural control on the distribution of gas hydrates and active gas seeps on the Posolsky Bank, Lake Baikal. Geo-Mar. Lett. 2012, 32, 395–406. [Google Scholar] [CrossRef]
  28. Collett, T.S.; Boswell, R.; Lee, M.W.; Anderson, B.J.; Rose, K.; Lewis, K.A. Evaluation of long-term gas hydrate-production testing locations on the Alaska North Slope. Soc. Pet. Eng. Reserv. Eval. Eng. 2012, 15, 243–264. [Google Scholar] [CrossRef]
  29. Boswell, R.; Schoderbek, D.; Collett, T.S.; Ohtsuki, S.; White, M.; Anderson, B.J. The Iġnik Sikumi Field Experiment, Alaska North Slope: Design, operations, and implications for CO2−CH4 exchange in gas hydrate reservoirs. Energy Fuels 2017, 31, 140–153. [Google Scholar] [CrossRef]
  30. Schoderbek, D.; Farrel, H.; Hester, K.; Howard, J.; Raterman, K.; Silpngarmlert, S.; Martin, K.L.; Smith, B.; Klein, P. ConocoPhillips Gas Hydrate Production Test Final Technical Report; National Energy Technology Laboratory, United States Department of Energy: Pittsburgh, PA, USA, 2013; 204p.
  31. Moridis, J.; Reagan, M.T.; Liu, Y. Numerical Simulations in Support of a Long-Term Test of Gas Production from Hydrate Accumulations on the Alaska North Slope: Reservoir Response to Interruptions of Production (Shut-Ins). Energy Fuels 2022, 36, 3496–3525. [Google Scholar] [CrossRef]
  32. Schoderbek, D.; Martin, K.; Howard, J.; Silpngarmlert, S.; Hester, K. North Slope hydrate field trial: CO2/CH4 exchange. In Proceedings of the Arctic Technology Conference, Houston, TX, USA, 3–5 December 2012. [Google Scholar]
  33. Hanor, J.S.; Nunn, J.A.; Lee, Y. Salinity structure of the central north slope foreland basin, Alaska, USA: Implications for pathways of past and present topographically driven regional fluid flow. Geofluids 2004, 4, 152–168. [Google Scholar] [CrossRef]
  34. Patil, S.L.; Dandekar, A.Y.; Khataniar, S. Alaska Gas Hydrate Research and Field Studies. In Encyclopedia of Sustainability Science and Technology; Meyers, R.A., Ed.; Springer: New York, NY, USA, 2012. [Google Scholar] [CrossRef]
  35. Uchida, S.; Seol, Y.; Yamamoto, K. Sand migration simulation during gas production from gas hydrate reservoir at Kuparuk State 7-11-12 site in the Prudhoe Bay Unit, Alaska. Energy Fuels 2022, 36, 7382–7390. [Google Scholar] [CrossRef]
  36. Yoneda, J.; Jin, Y.; Muraoka, M.; Oshima, M.; Suzuki, K.; Walker, M.; Westacott, D.; Otsuki, S.; Kumagai, K.; Collett, T.S. Multiple physical properties of gas hydrate-bearing sediments recovered from Alaska North Slope 2018 Hydrate-01 Stratigraphic Test Well. J. Mar. Pet. Geol. 2021, 123, 1–43. [Google Scholar] [CrossRef]
  37. Yoneda, J.; Suzuki, K.; Jin, Y.; Ohtsuki, S.; Collett, T.S.; Boswell, R.; Maehara, Y.; Okinaka, N. Permeability measurement and prediction with nuclear magnetic resonance analysis of gas hydrate-bearing sediments recovered from Alaska North Slope 2018 Hydrate-01 Stratigraphic Test Well. Energy Fuels 2022, 36, 2515–2529. [Google Scholar] [CrossRef]
  38. Yoneda, J.; Jin, Y.; Muraoka, M.; Oshima, M.; Waite, W.; Suzuki, K.; Flemings, P. Comprehensive pressure core analysis for hydrate bearing sediments from Gulf of Mexico Green Canyon Block 955, including assessments of geomechanical viscous behavior and NMR permeability. AAPG Bull. 2022, 106, 1143–1177. [Google Scholar] [CrossRef]
  39. Archie, G.E. The electrical resistivity log as an aid in determining some reservoir characteristic. J. Pet. Technol. 1942, 5, 54–62. [Google Scholar] [CrossRef]
  40. U.S. Geological Survey Alaska Gas Hydrate Assessment Team. National Assessment of Oil and Gas Project: Geologic Assessment of Undiscovered Gas Hydrate Resources on the North Slope, Alaska; Data Series 69-CC; U.S. Geological Survey: Reston, VA, USA, 2013; pp. 1–100. [CrossRef]
  41. Magoon, L.B.; Dow, W.G. The Petroleum System. In The Petroleum System—From Source to Trap; Magoon, L.B., Dow, W.G., Eds.; American Association of Petroleum Geologists: Tulsa, OK, United States, 1994; Volume 60, pp. 3–24. [Google Scholar]
  42. Burton, Z.F.M.; Dafov, L.N. Testing the sediment organic contents required for biogenic gas hydrate formation: Insights from synthetic 3-D basin and hydrocarbon system modelling. Fuels 2022, 3, 555–562. [Google Scholar] [CrossRef]
  43. Portnov, A.; Santra, M.; Cook, A.E.; Sawyer, D.E. The Jackalope Gas Hydrate System in the Northeastern Gulf of Mexico. Mar. Pet. Geol. 2020, 111, 261–278. [Google Scholar] [CrossRef]
  44. Meazell, K.; Flemings, P.; Santra, M.; Johnson, J. Sedimentology and stratigraphy of a deep-water gas hydrate reservoir in the northern Gulf of Mexico. AAPG Bull. 2020, 104, 1945–1970. [Google Scholar] [CrossRef]
  45. Santra, M.; Flemings, P.; Scott, E.; Meazell, K. Evolution of gas hydrate-bearing deep-water channel-levee system in abyssal Gulf of Mexico: Levee growth and deformation. AAPG Bull. 2020, 104, 1921–1944. [Google Scholar] [CrossRef]
  46. Yamamoto, K. Overview and introduction: Pressure core-sampling and analysis in the 2012-2013 MH21 offshore test of gas production from methane hydrates in the Nankai Trough. J. Mar. Pet. Geol. 2015, 66, 296–309. [Google Scholar] [CrossRef]
  47. Konno, Y.; Fujii, T.; Sato, A.; Akamine, K.; Naiki, M.; Masuda, Y.; Yamamoto, K.; Nagao, J. Key findings of the world’s first offshore methane hydrate production test off the coast of Japan. Toward future commercial production. Energy Fuels 2017, 31, 2607–2616. [Google Scholar] [CrossRef]
  48. Konno, Y.; Yoneda, J.; Egawa, K.; Ito, T.; Jin, Y.; Kida, M.; Suzuki, K.; Fujii, T.; Nagao, J. Permeability of sediment cores from methane hydrate deposit in the Eastern Nankai Trough. J. Mar. Pet. Geol. 2015, 66, 487–495. [Google Scholar] [CrossRef]
  49. Fujii, T.; Suzuki, K.; Takayama, T.; Tamaki, M.; Komatsu, Y.; Konno, Y.; Yoneda, J.; Yamamoto, K.; Nagao, J. Geological setting and characterization of a methane hydrate reservoir distributed at the first offshore production test site on the Daini-Atsumi knoll in the eastern Nankai Trough, Japan. Mar. Pet. Geol. 2015, 66, 310–312. [Google Scholar] [CrossRef]
  50. Tamaki, M.; Suzuki, K.; Fujii, T.; Sato, A. Prediction and validation of gas hydrate saturation distribution in the eastern Nankai Trough, Japan: Geostatistical approach integrating well-log and 3D seismic data. Interpretation 2016, 4, SA83–SA94. [Google Scholar] [CrossRef]
  51. Tamaki, M.; Fujii, T.; Suzuki, K. Characterization and prediction of the gas hydrate reservoir at the second offshore gas production test site in the eastern Nankai Trough. Energies 2017, 10, 1678. [Google Scholar] [CrossRef]
  52. Yamamoto, K.; Wang, X.-X.; Tamaki, M.; Suzuki, K. The second offshore production of methane hydrate in the Nankai Trough and gas production behavior from a heterogeneous methane hydrate reservoir. R. Soc. Chem. Adv. 2019, 9, 25987–26013. [Google Scholar] [CrossRef] [PubMed]
  53. Shukla, K.M.; Kumar, P.; Yadav, U.S. Gas Hydrate Reservoir Identification, Delineation, and Characterization in the Krishna-Godavari Basin Using Subsurface Geologic and Geophysical Data from the National Gas Hydrate Program 02 Expedition, offshore India. Mar. Pet. Geol. 2019, 108, 185–205. [Google Scholar] [CrossRef]
  54. Hsiung, K.H.; Saito, S.; Kanamatsu, T.; Sanada, Y.; Yamada, Y. Regional stratigraphic framework and gas hydrate occurrence offshore eastern India: Core-log-seismic integration of National Gas Hydrate Program Expedition 02 (NGHP-02) Area-B drill sites. Mar. Pet. Geol. 2019, 108, 206–215. [Google Scholar] [CrossRef]
  55. Yoneda, J.; Oshima, M.; Kida, M.; Kato, A.; Konno, Y.; Jin, Y.; Jang, J.; Waite, W.; Kumar, P.; Tenma, N. Permeability variation and anisotropy of gas hydrate-bearing pressure-core sediments recovered from the Krishna-Godavari Basin, Offshore India. J. Mar. Pet. Geol. 2019, 108, 524–536. [Google Scholar] [CrossRef]
  56. Li, J.; Ye, J.; Qin, X.; Qiu, H.; Wu, N.; Lu, H.; Xie, W.; Lu, J.; Peng, F.; Xu, Z.; et al. The first offshore natural gas hydrate production test in South China Sea. China Geol. 2018, 1, 5–16. [Google Scholar] [CrossRef]
  57. Ye, J.; Qin, X.; Xie, W.; Lu, H.; Ma, B.; Qiu, H.; Liang, J.; Lu, J.; Kuang, Z.; Lu, C.; et al. The second natural gas hydrate production test in the South China Sea. China Geol. 2020, 2, 197–209. [Google Scholar] [CrossRef]
  58. Frye, M. Preliminary Evaluation of In-Place Gas Hydrate Resources: Gulf of Mexico Outer Continental Shelf. OCS Report MMS 2008-004. 2008; 136p. Available online: https://netl.doe.gov/sites/default/files/netl-file/MMS2008-004.pdf (accessed on 10 February 2024).
  59. Brothers, L.L.; Hart, P.E.; Ruppel, C.D. Minimum distribution of subsea ice-bearing permafrost on the U.S. Beaufort Sea continental shelf. Geophys. Res. Lett. 2012, 39, L15501, 1–6. [Google Scholar] [CrossRef]
  60. Brothers, L.; Herman, B.; Hart, P.; Ruppel, C. Subsea ice-bearing permafrost on the U.S. Beaufort Margin: (1) Minimum seaward extent defined from multichannel seismic reflection data. J. Geochem. Geophys. Geosystems 2016, 17, 4354–4365. [Google Scholar] [CrossRef]
  61. Ruppel, C.; Herman, B.; Brothers, L.; Hart, P. Subsea ice-bearing permafrost on the U.S. Beaufort Margin: (2) Borehole constraints. J. Geochem. Geophys. Geosystems 2016, 17, 4333–4353. [Google Scholar] [CrossRef]
  62. Kvenvolden, K.A. Methane hydrate—A major reservoir of carbon in the shallow geosphere? Chem. Geol. 1988, 71, 41–51. [Google Scholar] [CrossRef]
  63. Kvenvolden, K.A. A. A Primer in Gas Hydrates. In The Future of Energy Gases; Howell, D.G., Ed.; U.S. Geological Survey Professional Paper 1570; U.S. Geological Survey: Reston, VA, USA, 1993; pp. 279–292. [Google Scholar]
  64. Ruckel, D.J. Summary of the Cirque-1 Blowout of February 12, 1992. Alaska Oil and Gas Conservation Commission. Public Record Report Well History: Anchorage, AK, USA, 1992; pp. 1–32. Available online: http://aogweb.state.ak.us/DataMiner4/Forms/Home.aspx (accessed on 10 February 2024).
  65. Chatterton, C.V. Statistical Report; Alaska Oil and Gas Conservation Commission: Anchorage, AK, USA, 1983; pp. 1–208.
  66. Werner, M.R. Tertiary and Upper Cretaceous Heavy Oil Sands, Kuparuk River Area, Alaskan North Slope. In Alaskan North Slope Geology: Pacific Section; Tailleur, I.L., Weimer, P., Eds.; Society of Economic Paleontologists and Mineralogists: Parkes, Australia; the Alaska Geological Society: Bakersfield, CA, USA, 1987; Volume 50, pp. 109–118. [Google Scholar]
  67. Mull, C.G.; Houseknecht, D.W.; Bird, K.J. Revised Cretaceous and Tertiary Stratigraphic Nomenclature in the Colville Basin, Northern Alaska; U.S. Geological Survey Professional Paper 1673; U.S. Geological Survey: Reston, VA, USA, 2003; 51p.
  68. Asquith, G.B.; Krygowski, D. Basic Well Log Analysis; American Association of Petroleum Geologists: Tulsa, Oklahoma, USA, 2004; pp. 1–244. [Google Scholar]
  69. Serra, O. Fundamentals of Well-Log Interpretation. In Developments in Petroleum Science; Elsevier Publishing: Amsterdam, The Netherlands, 1984; pp. 1–423. [Google Scholar]
  70. Kleinberg, R.L.; Flaum, C.; Collett, T.S. Magnetic resonance log of JAPEX/JNOC/GSC et al. Mallik 5L-38 gas hydrate production research well: Gas hydrate saturation, growth habit, and relative permeability. Geol. Surv. Can. Bull. 2005, 585, 1–23. [Google Scholar]
  71. Sloan, E.D.; Koh, C.A. Clathrate Hydrates of Natural Gases, 3rd ed.; CRC Press: New York, NY, USA, 2008; pp. 1–721. [Google Scholar]
  72. Winsauer, W.O.; Shearin, H.M.; Masson, P.H.; Williams, M. Resistivity of brine-saturated sands in relation to pore geometry. Am. Assoc. Pet. Geol. Bull. 1952, 36, 253–277. [Google Scholar]
  73. Pearson, C.F.; Halleck, P.M.; McGuire, P.L.; Hermes, R.; Mathews, M. Natural gas hydrate deposits: A review of in situ properties. J. Phys. Chem. 1983, 87, 4180–4185. [Google Scholar] [CrossRef]
  74. Spangenberg, E. Modeling of the influence of gas hydrate content on the electrical properties of porous sediments. J. Geophys. Res. Solid Earth 2001, 106, 6535–6548. [Google Scholar] [CrossRef]
  75. Cook, A.E.; Waite, W.F. Archie’s saturation exponent for natural gas hydrate in coarse-grained reservoirs. J. Geophys. Res. Solid Earth 2018, 123, 2069–2089. [Google Scholar] [CrossRef]
  76. Pickett, G.R. A review of current techniques for determination of water saturation from logs. J. Pet. Technol. 1966, 18, 1425–1433. [Google Scholar] [CrossRef]
  77. Arp, J.J. The effect of temperature on the density and electrical resistivity of sodium chloride solutions. Trans. Am. Inst. Min. Metall. Pet. Eng 1953, 198, 327–330. [Google Scholar] [CrossRef]
  78. Schlumberger Log Interpretation Charts; Schlumberger Wireline and Testing: Sugar Land, TX, USA, 1998; SMP-7006.
  79. Lachenbruch, A.H.; Galanis, S.P.; Moses, T.H. A Thermal Cross Section for the Permafrost and Hydrate Stability Zones in the Kuparuk and Prudhoe Bay Oil Fields. In Geological Studies in Alaska by the U.S. Geological Survey during 1987; Galloway, J.P., Hamilton, T.D., Eds.; USGS Circular; USGS: Reston, VA, USA, 1987; Volume 1017, pp. 1–4. [Google Scholar]
  80. Hilchie, D.W. Applied Openhole Log Interpretation for Geologists and Engineers; Douglas W. Hilchie Inc.: Flagstaff, AZ, USA; Colorado School of Mines: Golden, CO, USA, 1982; pp. 1–243. [Google Scholar]
  81. Maute, R.E.; Lyle, W.D.; Sprunt, E.S. Improved data-analysis method determines archie parameters from core data. JPT 1992, 44, 103–107. [Google Scholar] [CrossRef]
  82. Crain, E.R. The Log Analysis Handbook; PennWell Publishing Company: Tulsa, OK, USA, 1986; pp. 1–684. [Google Scholar]
  83. Kadhim, F.S.; Samsuria, A.; Kamal, A. A review in correlations between cementation factor and carbonate rocks properties. Life Sci. J. 2013, 10, 2451–2458. [Google Scholar]
  84. Chaouachi, M.; Falenty, A.; Sell, K.; Enzmann, F.; Kersten, M.; Haberthur, D.; Kuhs, W.F. Microstructural evolution of gas hydrates in sedimentary matrices observed with synchrotron X-ray computed tomographic microscopy. Geochem. Geophys. Geosystems 2015, 16, 1711–1722. [Google Scholar] [CrossRef]
  85. Collett, T.S.; Lee, M.W. Electrical-resistivity well-log analysis of gas hydrate saturations in the JAPEX/JNOC/GSC et al. Mallik 5L-38 gas hydrate production research well. Geol. Surv. Can. Bull. 2005, 585, 1–10. [Google Scholar]
  86. Park, K.-P. Gas Hydrate Exploration Activities in Korea. In Proceedings of the 6th International Conference on Gas Hydrates (ICGH6), Vancouver, BC, Canada, 6–10 July 2008. [Google Scholar]
  87. Yang, S.; Zhang, H.; Wu, N.; Su, X.; Schultheiss, P.; Holland, M.; Zhang, G.; Liang, J.; Lu, J.; Rose, K. High Concentration Hydrate in Disseminated Forms Obtained in Shenhu Area, North Slope of South China Sea. In Proceedings of the 6th International Conference on Gas Hydrates (ICGH6), Vancouver, BC, Canada, 6–10 July 2008. [Google Scholar]
  88. Clennell, M.B.; Hovland, M.; Booth, J.S.; Henry, P.; Winters, W.J. Formation of natural gas hydrates in marine sediments—Conceptual model of gas hydrate growth conditioned by host sediment properties. J. Geophys. Res. 1999, 104, 22985–23003. [Google Scholar] [CrossRef]
  89. Timur, A. Pulsed nuclear magnetic resonance studies of porosity, movable fluid, and permeability of sandstones. J. Pet. Technol 1969, 21, 775–786. [Google Scholar] [CrossRef]
  90. Kenyon, W.E.; Day, P.I.; Straley, C. A three-part study of NMR longitudinal relaxation properties of water-saturated sandstones. SPE Form. Eval. 1988, 3, 622–636. [Google Scholar] [CrossRef]
  91. Schlumberger, Pressure Express (XPT). Available online: https://www.slb.com/-/media/files/fe/brochure/pressurexpress-br.ashx (accessed on 25 April 2022).
  92. Schlumberger, Modular Dynamic Tool (MDT). Available online: https://www.slb.com/-/media/files/fe/brochure/mdt-br.ashx (accessed on 25 April 2022).
  93. Scheihing, M. ConocoPhillips Gas Hydrate Production Test, Appendix 3: Geocellular Model for Evaluation of Gas Hydrate Production Mechanism in Selected Sandstones of the Sagavanirktok Formation; Progress Report, First Half of 2010, DOE Award No.DE-NT0006553; US DOE/NETL: Washington, DC, USA, 2010.
  94. Alaska Oil and Gas Conservation Commission. Well File Images Database (Web Page): State of Alaska, Alaska Oil and Gas Conservation Commission. Available online: http://aogweb.state.ak.us/WebLink/Browse.aspx (accessed on 13 April 2020).
  95. Silpngarmlert, S. ConocoPhillips Gas Hydrate Production Test, Appendix 1 and 2: Thermal Effects of Hot Fluid Production/Injection in Existing Wells; Progress Report, First Half of 2010, DOE Award No.DE-NT0006553; US DOE/NETL: Washington, DC, USA, 2010.
Figure 1. Map of the Eileen and Tarn Gas Hydrate Trends overlying portions of the Prudhoe Bay, Kuparuk River, and Milne Point oil fields. Shown in red are the locations of the Northwest Eileen State 2 (NWE2), PBU L-106, Iġnik Sikumi 1 (Iġnik Sikumi), Mount Elbert 1 (Mount Elbert), and Hydrate-01 gas hydrate research wells, along with the outline of the Milne Point three-dimensional (3-D) seismic volume used to identify and map gas hydrate prospects. Red well symbols indicate important gas hydrate research wells. PBU = Prudhoe Bay Unit. This figure is modified from a previous USGS publication [40].
Jmse 12 00472 g001
Figure 2. Milne Point area gas hydrate prospects identified with three-dimensional seismic analysis (modified from Collett et al., [13]). As a condition of the seismic data use agreement, the latitude and longitude of the seismic data and the interpreted features cannot be shown on this map. Mt. = Mount.
Jmse 12 00472 g002
Figure 3. Lithostratigraphic column for the North Slope of Alaska (modified from Mull et al. [67]). The cored interval, as shown from the Mount Elbert 1 well, recovered lower to middle Eocene marine and nonmarine sediments of the Tertiary Sagavanirktok Formation. NPR-A = National Petroleum Reserve in Alaska; Fm = Formation; Plio = Pliocene; Olig = Oligocene; GRZ/Hue = GRZ gamma ray zone (at the base of Hue Shale).
Jmse 12 00472 g003
Figure 4. Satellite image of the study area location. Wells used in the study were drilled in the Prudhoe Bay Unit (PBU) L-Pad, PBU V-Pad, and Kuparuk 3-11-11 Pad. The Northwest Eileen State 1 (NWE1) and 2 (NWE2) and SOCAL 33-29-E wells were drilled from temporary ice pads. The direction to the Mount Elbert 1 well, also used in the study, is indicated by the arrow. Yellow circles are well surface locations on the pads (indicated by yellow rectangles).
Jmse 12 00472 g004
Figure 5. Well log display for the Iġnik Sikumi 1 test well indicating units B, C, D, and E. Grey shading highlights the occurrence of gas hydrates within reservoir-quality sands of the units C, D, and E. Data shown include the natural gamma ray (GR), caliper (CA), drill bit size (BS), electrical resistivity (RES), bulk density (RHOB), acoustic transit time (DT), porosity as nuclear magnetic resonance porosity (NMR) and calculated density porosity logs (DEN), NMR-density (NMR/DEN)-derived gas hydrate saturations, and Archie calculated gas hydrate saturations (Archie). API = American Petroleum Institute log value; IN = inches.
Jmse 12 00472 g005
Figure 6. Map of study area well paths to the depth of the top of unit B. Well surface locations and well paths (grey lines) for 90 wells with sufficient gamma ray data in the interval of interest. Well surface locations and well paths for nine wells with enough log data to determine the top and base of gas hydrate occurrence (green circles and lines). Log data from the Iġnik Sikumi 1, Northwest Eileen State 2 (NWE2), PBU L-106, and PBU L-112 wells were used to calculate gas hydrate saturations. Well data from the Mount Elbert 1 well, located 9 km (5.5 mi) northwest of this map (indicated by an arrow), were also used in the calculation of gas hydrate saturations (not shown). NMR-density method = nuclear magnetic resonance (NMR) density (DEN)-derived gas hydrate saturations.
Jmse 12 00472 g006
Figure 7. Map of data distribution at the tops of units C, D, and E. NWE = Northwest Eileen State.
Jmse 12 00472 g007
Figure 8. Example Pickett plot annotated to depict the cross-plot method used to derive Archie a and m parameters (modified from Serra [69]).
Jmse 12 00472 g008
Figure 9. Series of Pickett plots depicting the cross-plot methodology used to select the Archie a and m parameters for the water and gas hydrate-bearing units in the Iġnik Sikumi 1 well for (A) the unit B, C, D, and E reservoir sections; (B) the unit B reservoir section; (C) the unit C reservoir section; (D) the unit D reservoir section; and (E) the unit E reservoir section. Also shown in each plot is the water line corresponding to the Archie parameters of a = 1.0 and m = 1.5 (blue line) and the water line corresponding to the Archie parameters of a = 1.6 and m = 2.0 (red line).
Jmse 12 00472 g009aJmse 12 00472 g009bJmse 12 00472 g009c
Figure 10. Calculated gas hydrate saturations for the Iġnik Sikumi 1 well using different Archie parameters. Multiple calculated gas hydrate saturation log curves assuming different m values ranging from 1.3 to 2.5 are depicted in each of the tracks. Well log curves are grouped in each track by the Archie parameter a. Also displayed in each track is the water line (0% gas hydrate saturation, red dashed line) and the NMR-derived gas hydrate saturation curve (yellow curve). Sh = gas hydrate saturation; Sh NMR Hy. Sat. (%) = gas hydrate saturation derived from the NMR log; NMR = nuclear magnetic resonance (combinable magnetic resonance tool); API = American Petroleum Institute log value; Ohm-m = Ohm-meter; g/cm3 = gram per cubic centimeter; % = decimal percent.
Jmse 12 00472 g010
Figure 11. Iġnik Sikumi 1 well logs depicting two scenarios for the selection of the Archie a and m parameters from Figure 10. Track 3 shows the scenario when Archie parameters a = 1.0 and m = 2.5 satisfy the selection criteria defined in the text. Track 4 shows the scenario when Archie parameters a = 1.6 and m = 2.0 satisfy the same selection criteria. However, only the second scenario provides physically reasonable parameters for gas hydrate saturation for this well data. Grey shading indicates the gas hydrate-bearing portion of the units B, C, D, and E. Sh = gas hydrate saturation; API = American Petroleum Institute log value; GR = gamma ray; Ohm-m = Ohm-meter; Dec. per. = decimal percent; NMR = nuclear magnetic resonance.
Jmse 12 00472 g011
Figure 12. Logs from wells drilled in the Eileen Gas Hydrate Trend depicting the vertical distribution of reservoir and non-reservoir sections within the units B, C, D, and E and the reservoir fill type (i.e., gas hydrate or water). The “?” queries in several of the log displays note anomalous inferred gas hydrate occurrences, which are likely false indications of the presence of gas hydrate-based degraded well log data. The wells shown include (A) Iġnik Sikumi 1, (B) PBU L-106, (C) PBU L-112, (D) Northwest Eileen State 2, and (E) Kuparuk 3-11-11. GR = gamma ray; API = American Petroleum Institute log value; ohm-m = ohm-meter; g/cm3 = gram per cubic centimeter; usec/ft = microsecond per foot; NMR = nuclear magnetic resonance (combinable magnetic resonance tool); DEN = density.
Jmse 12 00472 g012aJmse 12 00472 g012bJmse 12 00472 g012cJmse 12 00472 g012dJmse 12 00472 g012e
Figure 13. Log display for the Iġnik Sikumi 1 well depicting NMR (CMR) log-derived sediment permeabilities and concentrations of the pore-filling substances, including gas hydrates, free water, and bound water. GR = gamma ray; API = American Petroleum Institute log value; RES = resistvity; ohm-m = ohm-meter; mD = miliDarcy; KTIM = Timur-Coates model; KDSR = Schlumberger-Doll-Research model; NMR = nuclear magnetic resonance (combinable magnetic resonance tool); DEN = density.
Jmse 12 00472 g013
Figure 14. (A) Seismically defined structure grid of the top of unit F in the area of the Prudhoe Bay Unit (PBU) L-Pad. The colors represent the relative depth range from the surface, where red is the shallowest and purple is the deepest. (B) Generalized stratigraphic cross section for units B–F in the area of the PBU L-Pad derived from available three-dimensional seismic data volumes. Faults are shown as near-vertical black lines. Both figures were modified from Schoderbek et al. [30].
Jmse 12 00472 g014
Figure 15. (A) North-south and (B) west-east cross sections through the Prudhoe Bay Unit (PBU) L-Pad. Wells PBU L-02 and PBU L-116 both show a missing section associated with faults. The index map indicates the locations of the cross sections relative to the PBU L-Pad and major faults depicted in Figure 16. GR = gamma ray in American Petroleum Institute log value (API).
Jmse 12 00472 g015
Figure 16. Structure map of the top of (A) unit C and (B) unit D (modified from Collett et al. [28]). The contour interval is 10 ft (3 m). Yellow shading indicates the inferred minimal gas hydrate occurrence for the immediate area of the Prudhoe Bay Unit (PBU) L-Pad. NWE = Northwest Eileen State; bsl = below sea level.
Jmse 12 00472 g016aJmse 12 00472 g016b
Figure 17. Well log cross section showing the lateral and vertical extent of the predominantly gas hydrate- and water-bearing reservoirs in the vicinity of Prudhoe Bay Unit (PBU) L-Pad (modified from Boswell et al. [29]). The gas hydrate-bearing units in the Eileen Gas Hydrate Trend are identified with the reference letters B through F (modified from Collett et al. [13]). The relationship of the gas hydrate-bearing portions of units F through B to nearby faults and the gas hydrate-water contact are also shown. The “?” queries in this well log cross section note uncertain stratigraphic correlations. The near-vertical bold black lines note the position of faults with the direction of the arrow depicting the direction of movement along each fault. BIBPF = approximate depth of the base of ice-bearing permafrost; API = American Petroleum Institute log value for gamma rays; Res = resistivity; Ohm-m = Ohm-meter units for resistivity; usec/ft = microsecond per foot units for acoustic.
Jmse 12 00472 g017
Table 1. Input parameters for gas hydrate porosity and saturation calculations using Equations (3), (6), and (8).
ParameterValue (Unit)Description
ρma2.65 (g/cm3)Matrix density
ρw1.02 (g/cm3)Formation water density
ρh0.9 (g/cm3)Gas hydrate density
Table 2. Archie parameters a, m, and n for the wells examined in this study. PBU = Prudhoe Bay Unit.
Wellamn
Mount Elbert 111.92
Iġnik Sikumi 11.622
PBU L-1061.62.12
PBU L-1121.62.12
Northwest Eileen State 21.62.12
Disclaimer/Publisher’s Note: The statements, opinions and data contained in all publications are solely those of the individual author(s) and contributor(s) and not of MDPI and/or the editor(s). MDPI and/or the editor(s) disclaim responsibility for any injury to people or property resulting from any ideas, methods, instructions or products referred to in the content.

