
Modal Parameter Identification of Jacket-Type Offshore Wind Turbines Under Operating Conditions

 ,
,  ,
,  and
and
Abstract
1. Introduction
2. Method
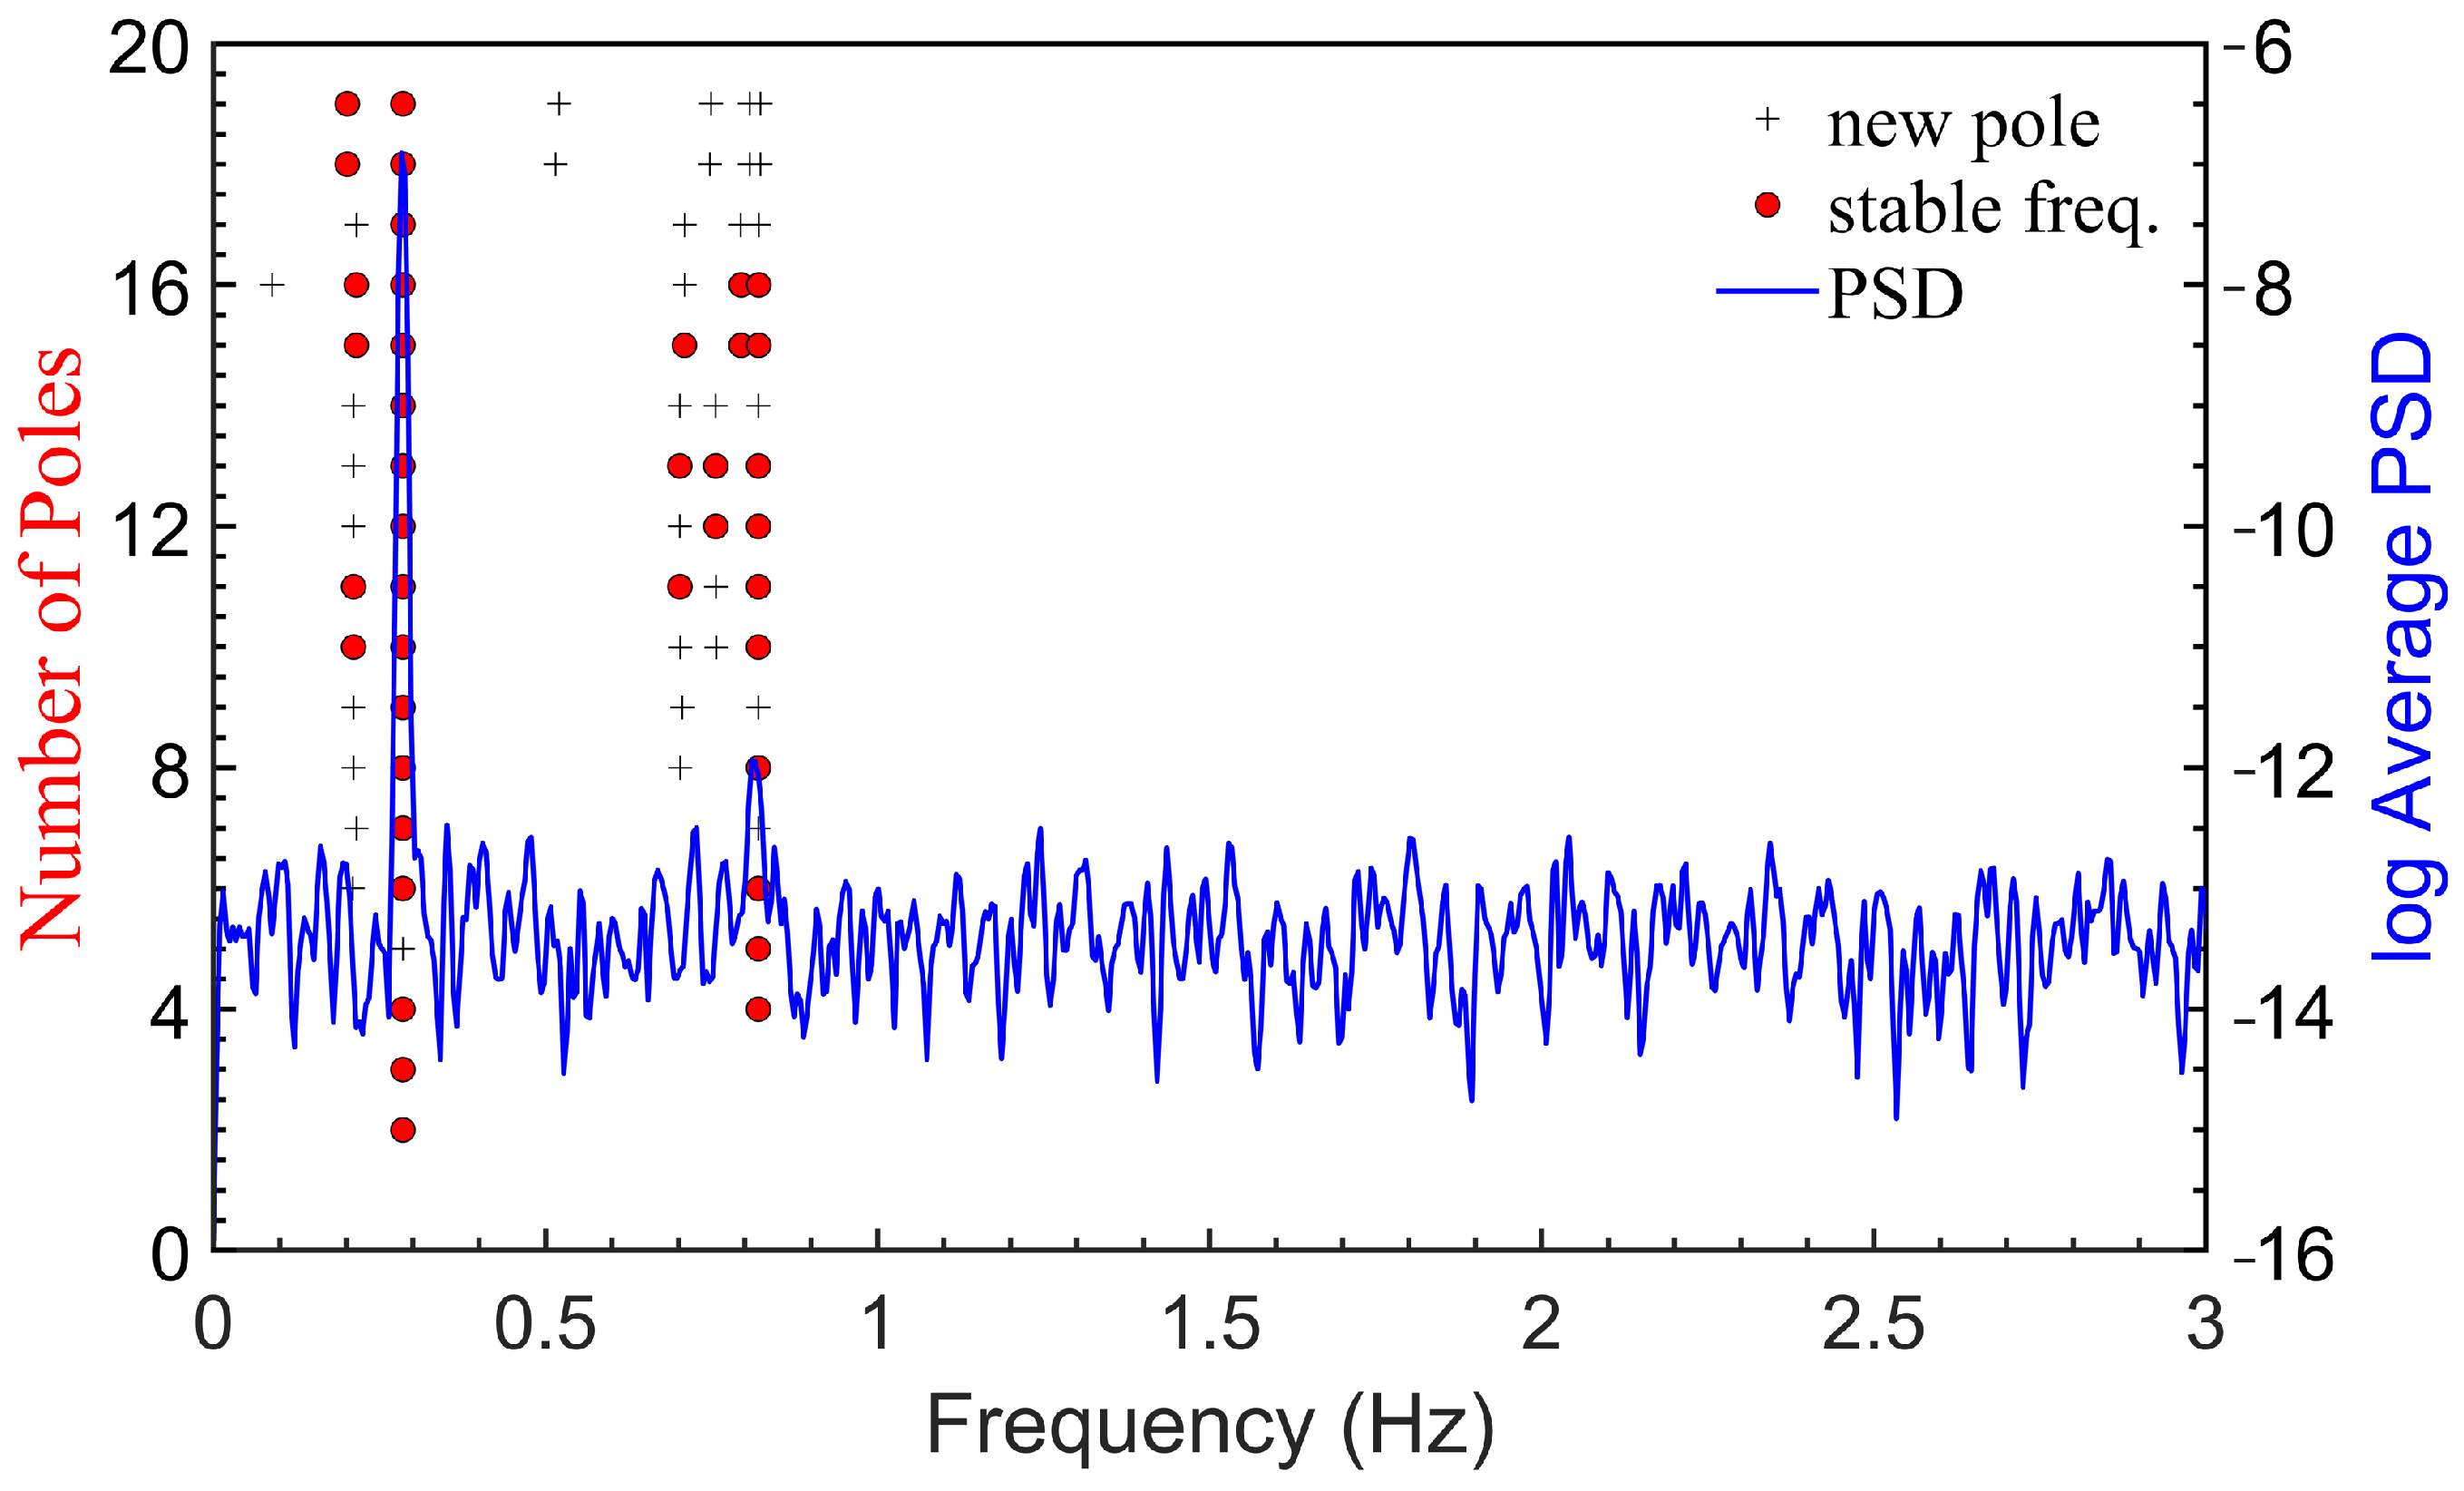
2.1. SSI-COV Method
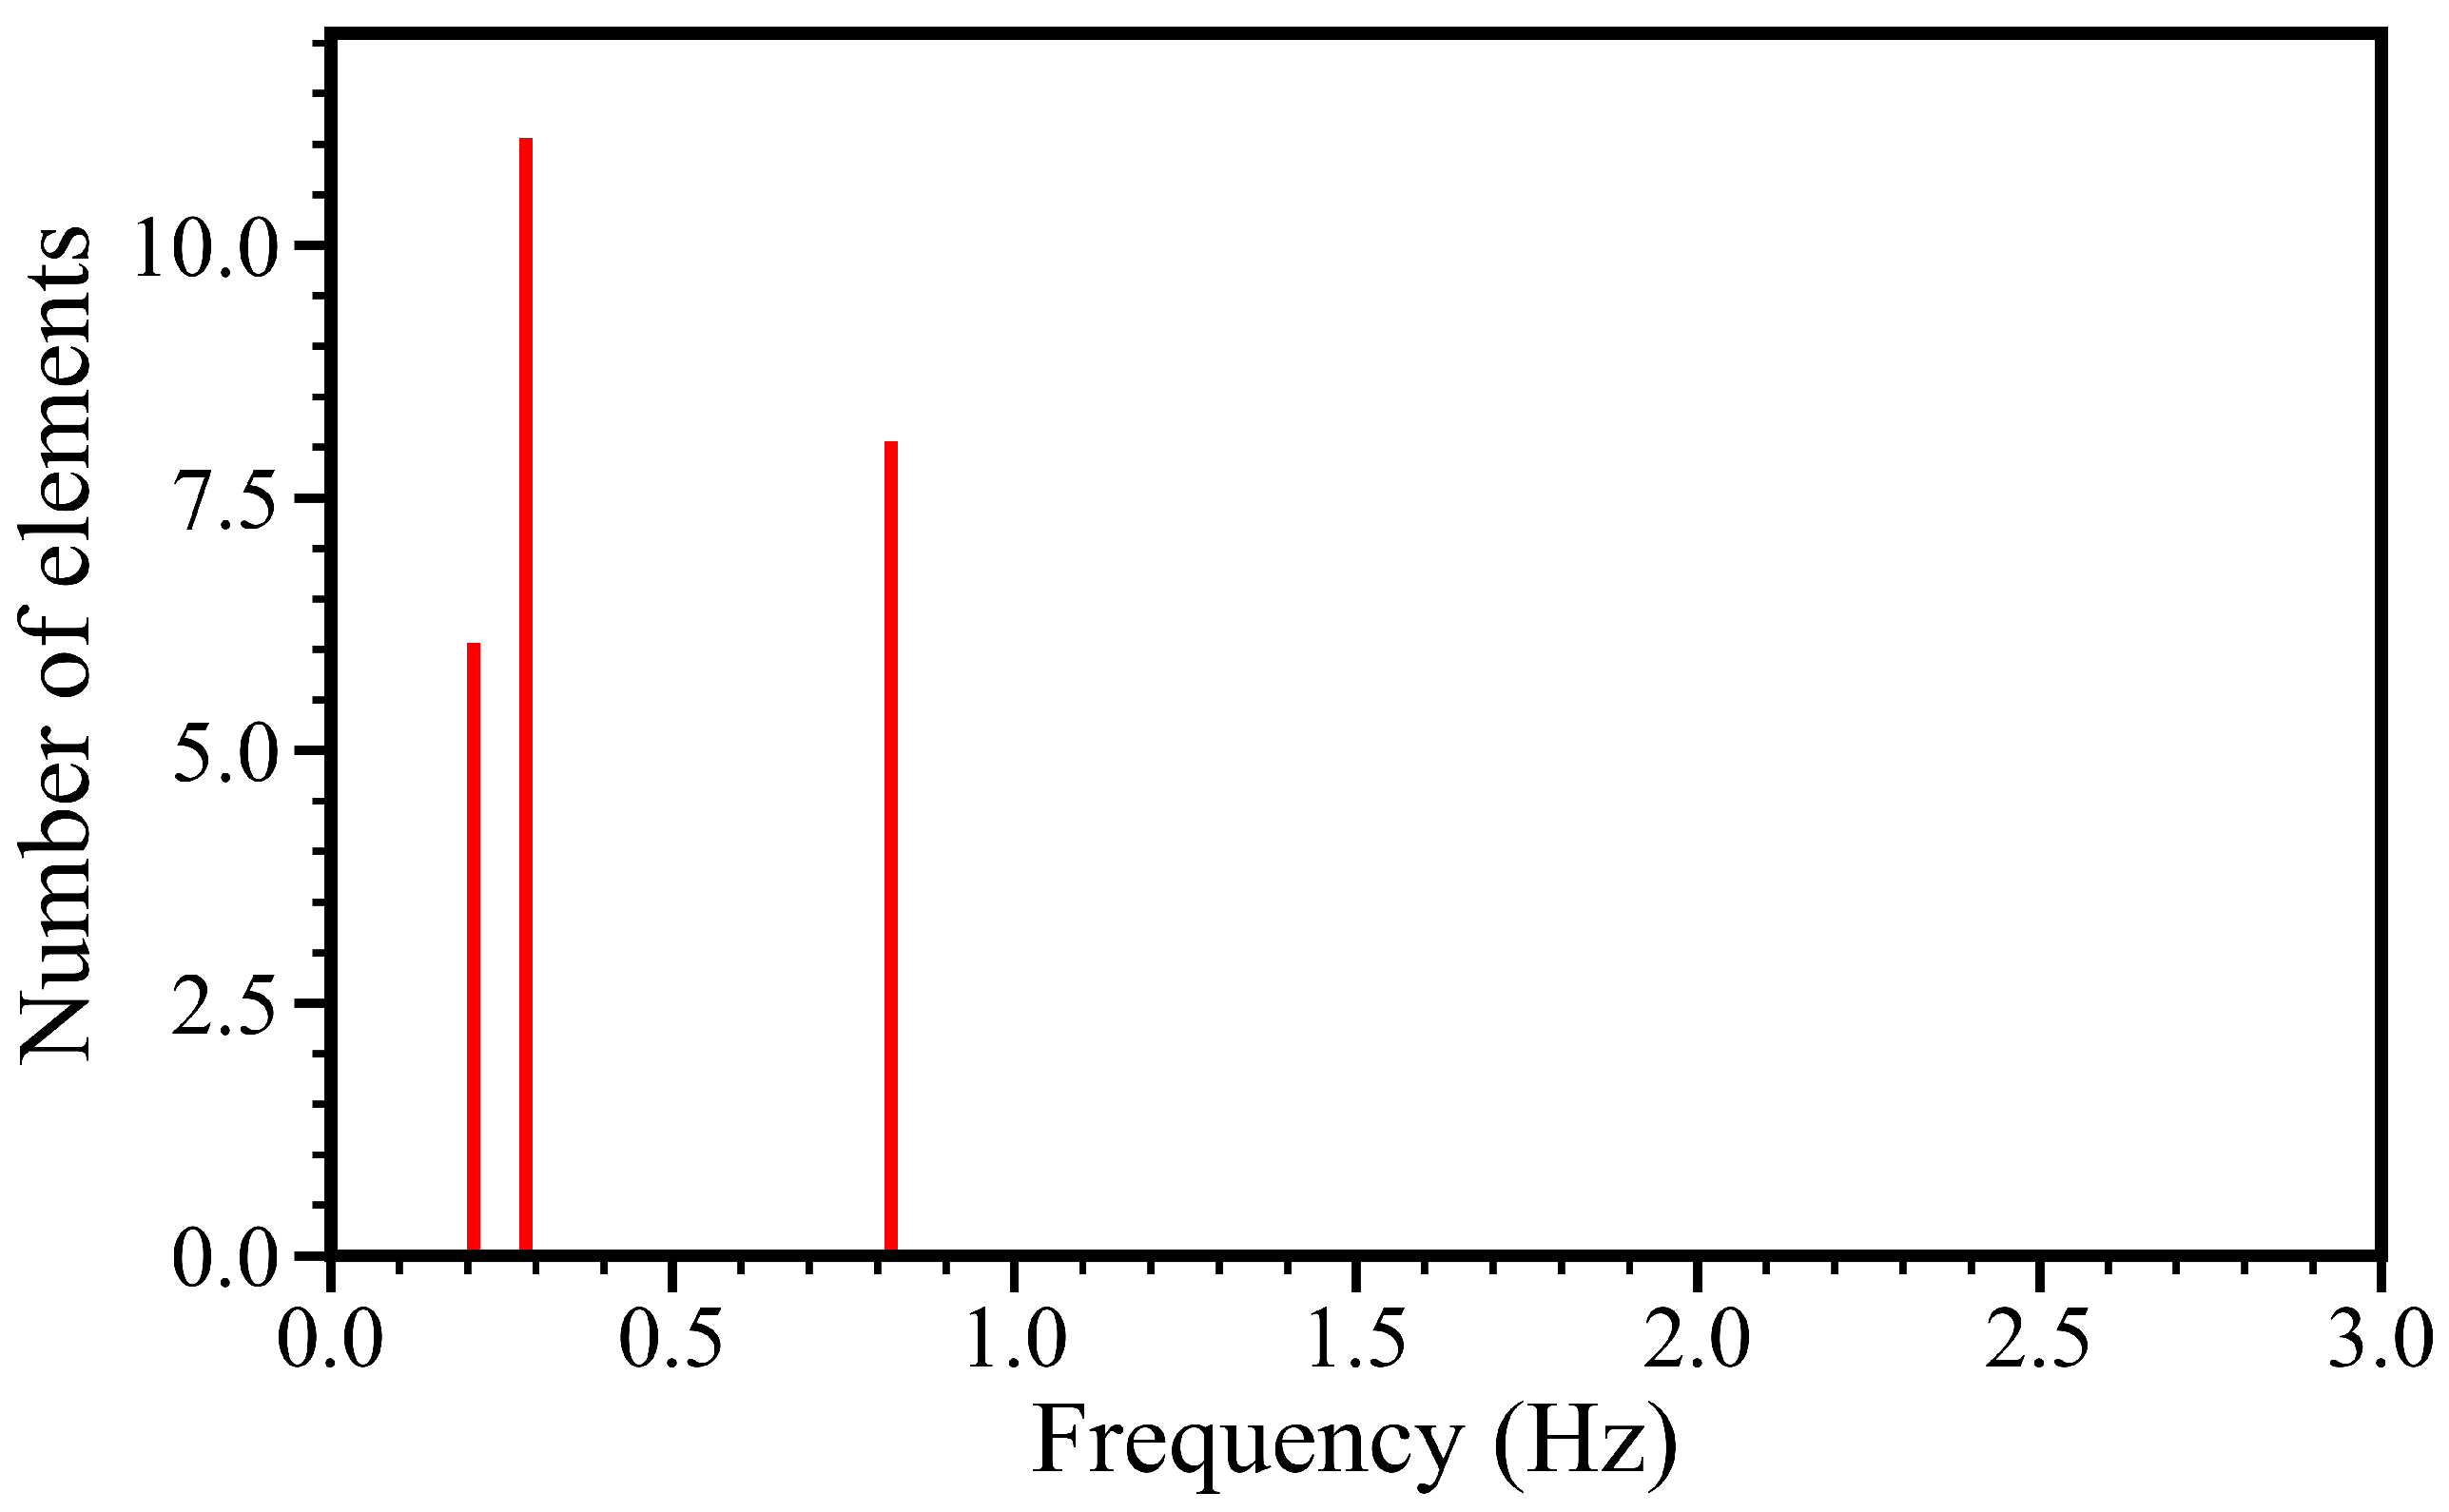
2.2. Automated Clustering Algorithm
3. Case Study for Jacket Offshore Wind Turbine
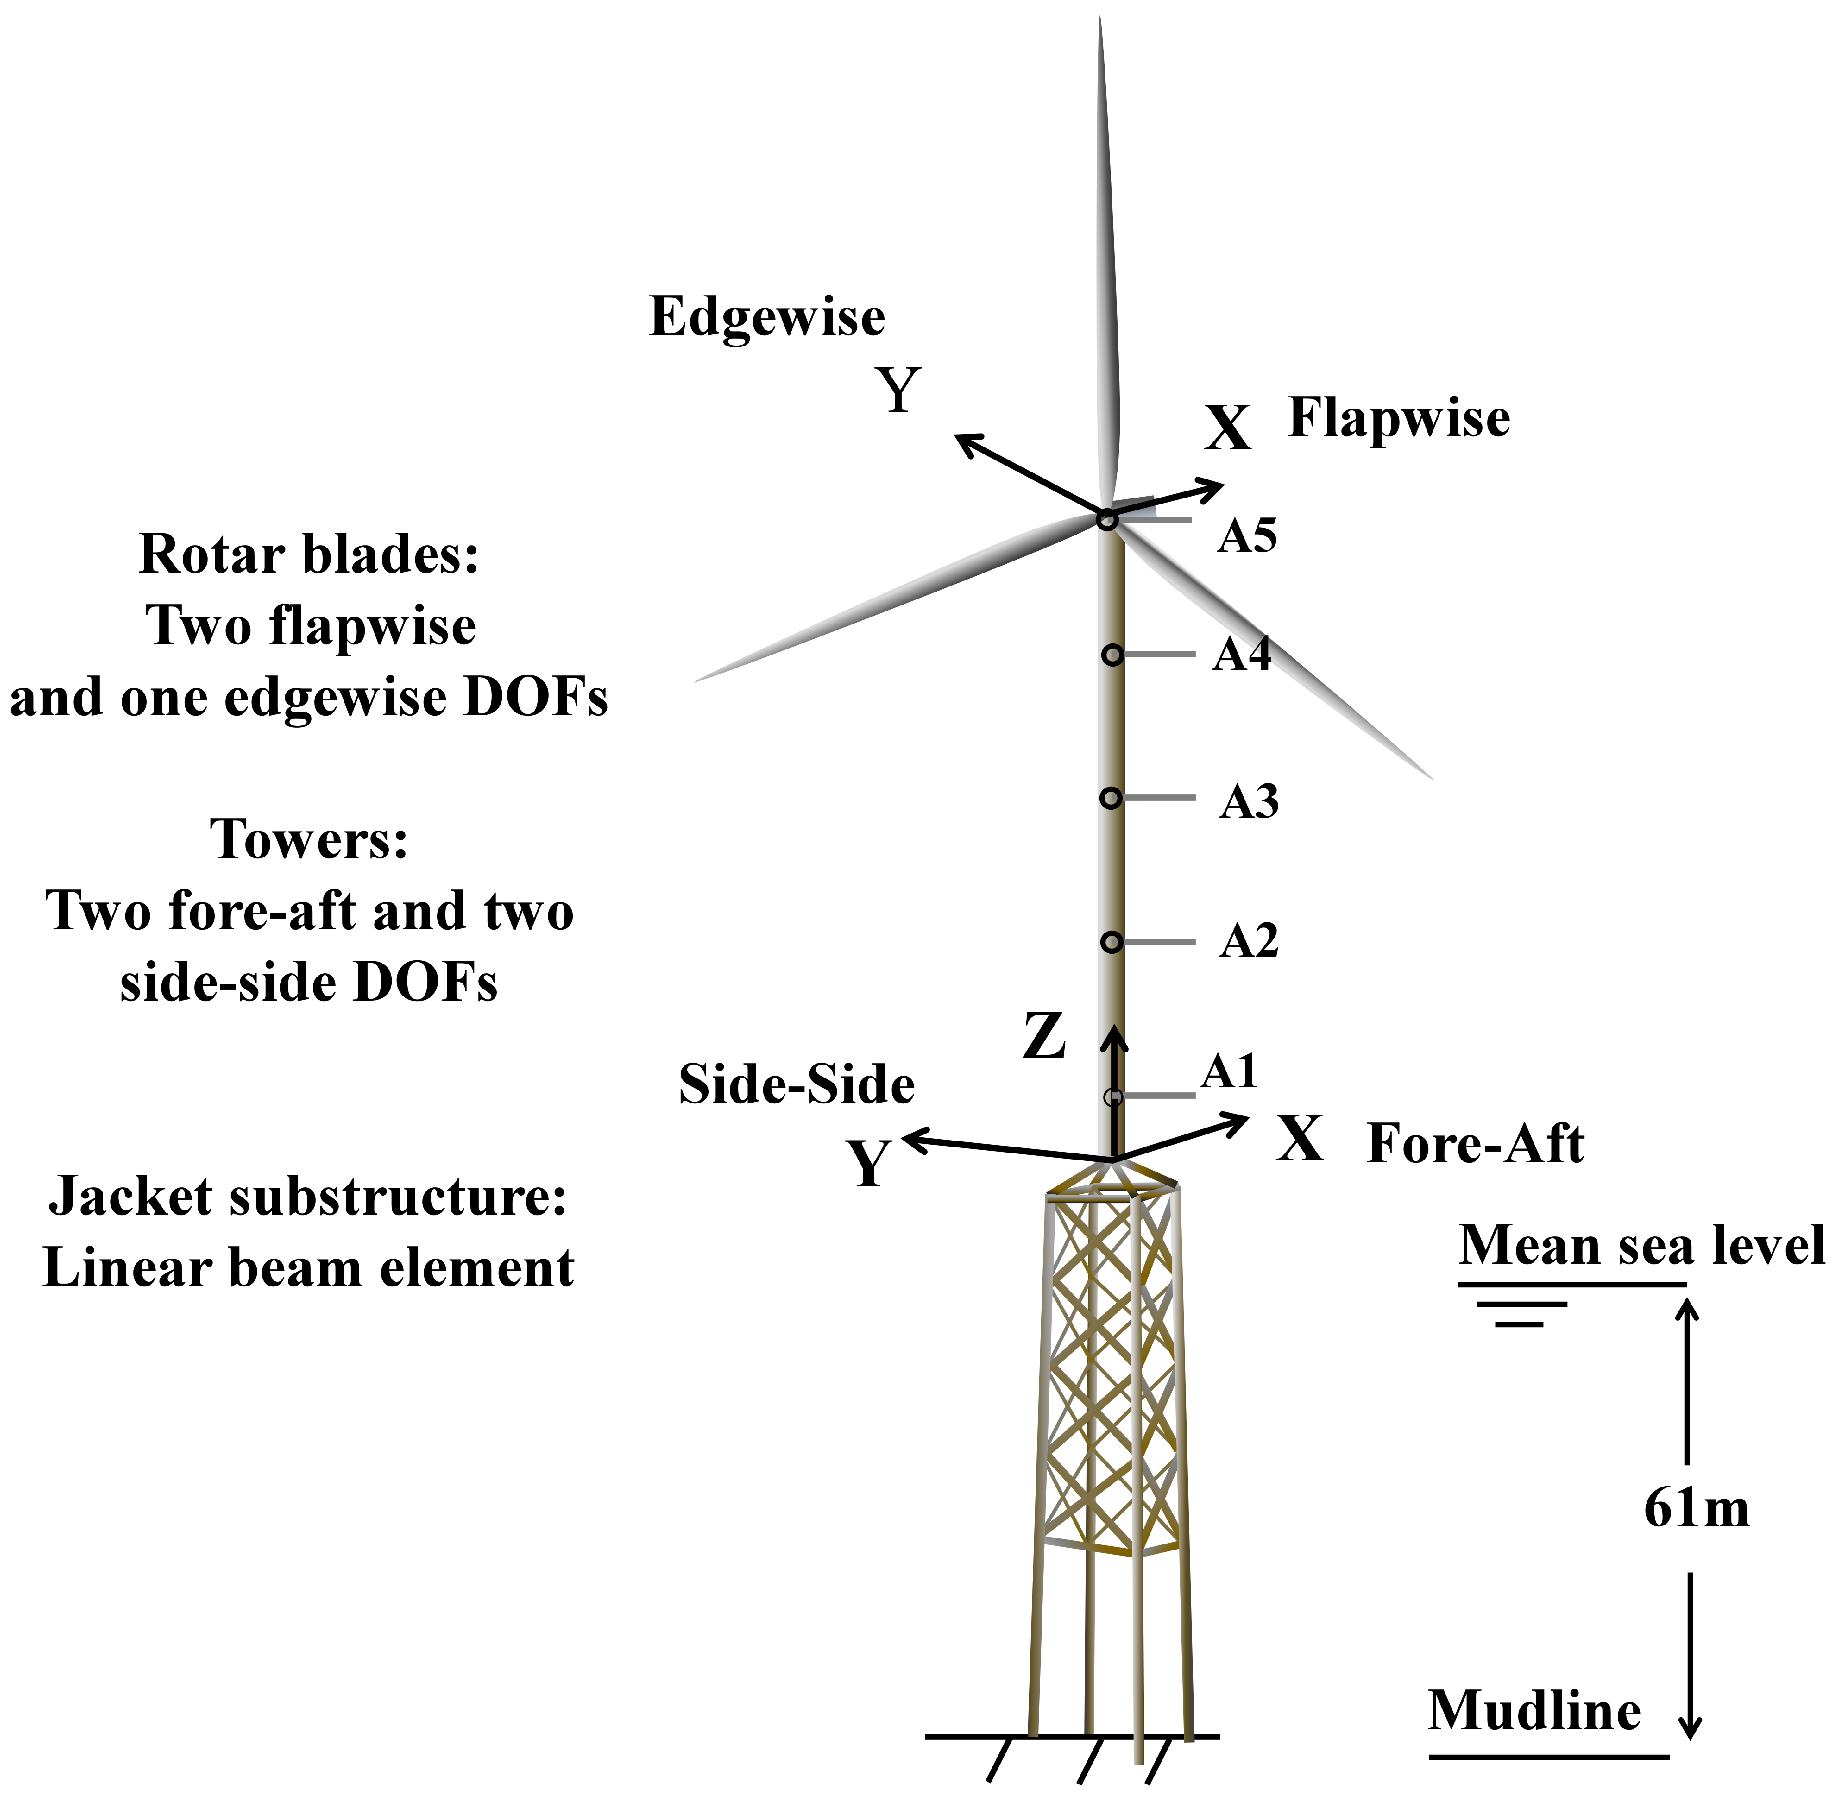
3.1. Model Description
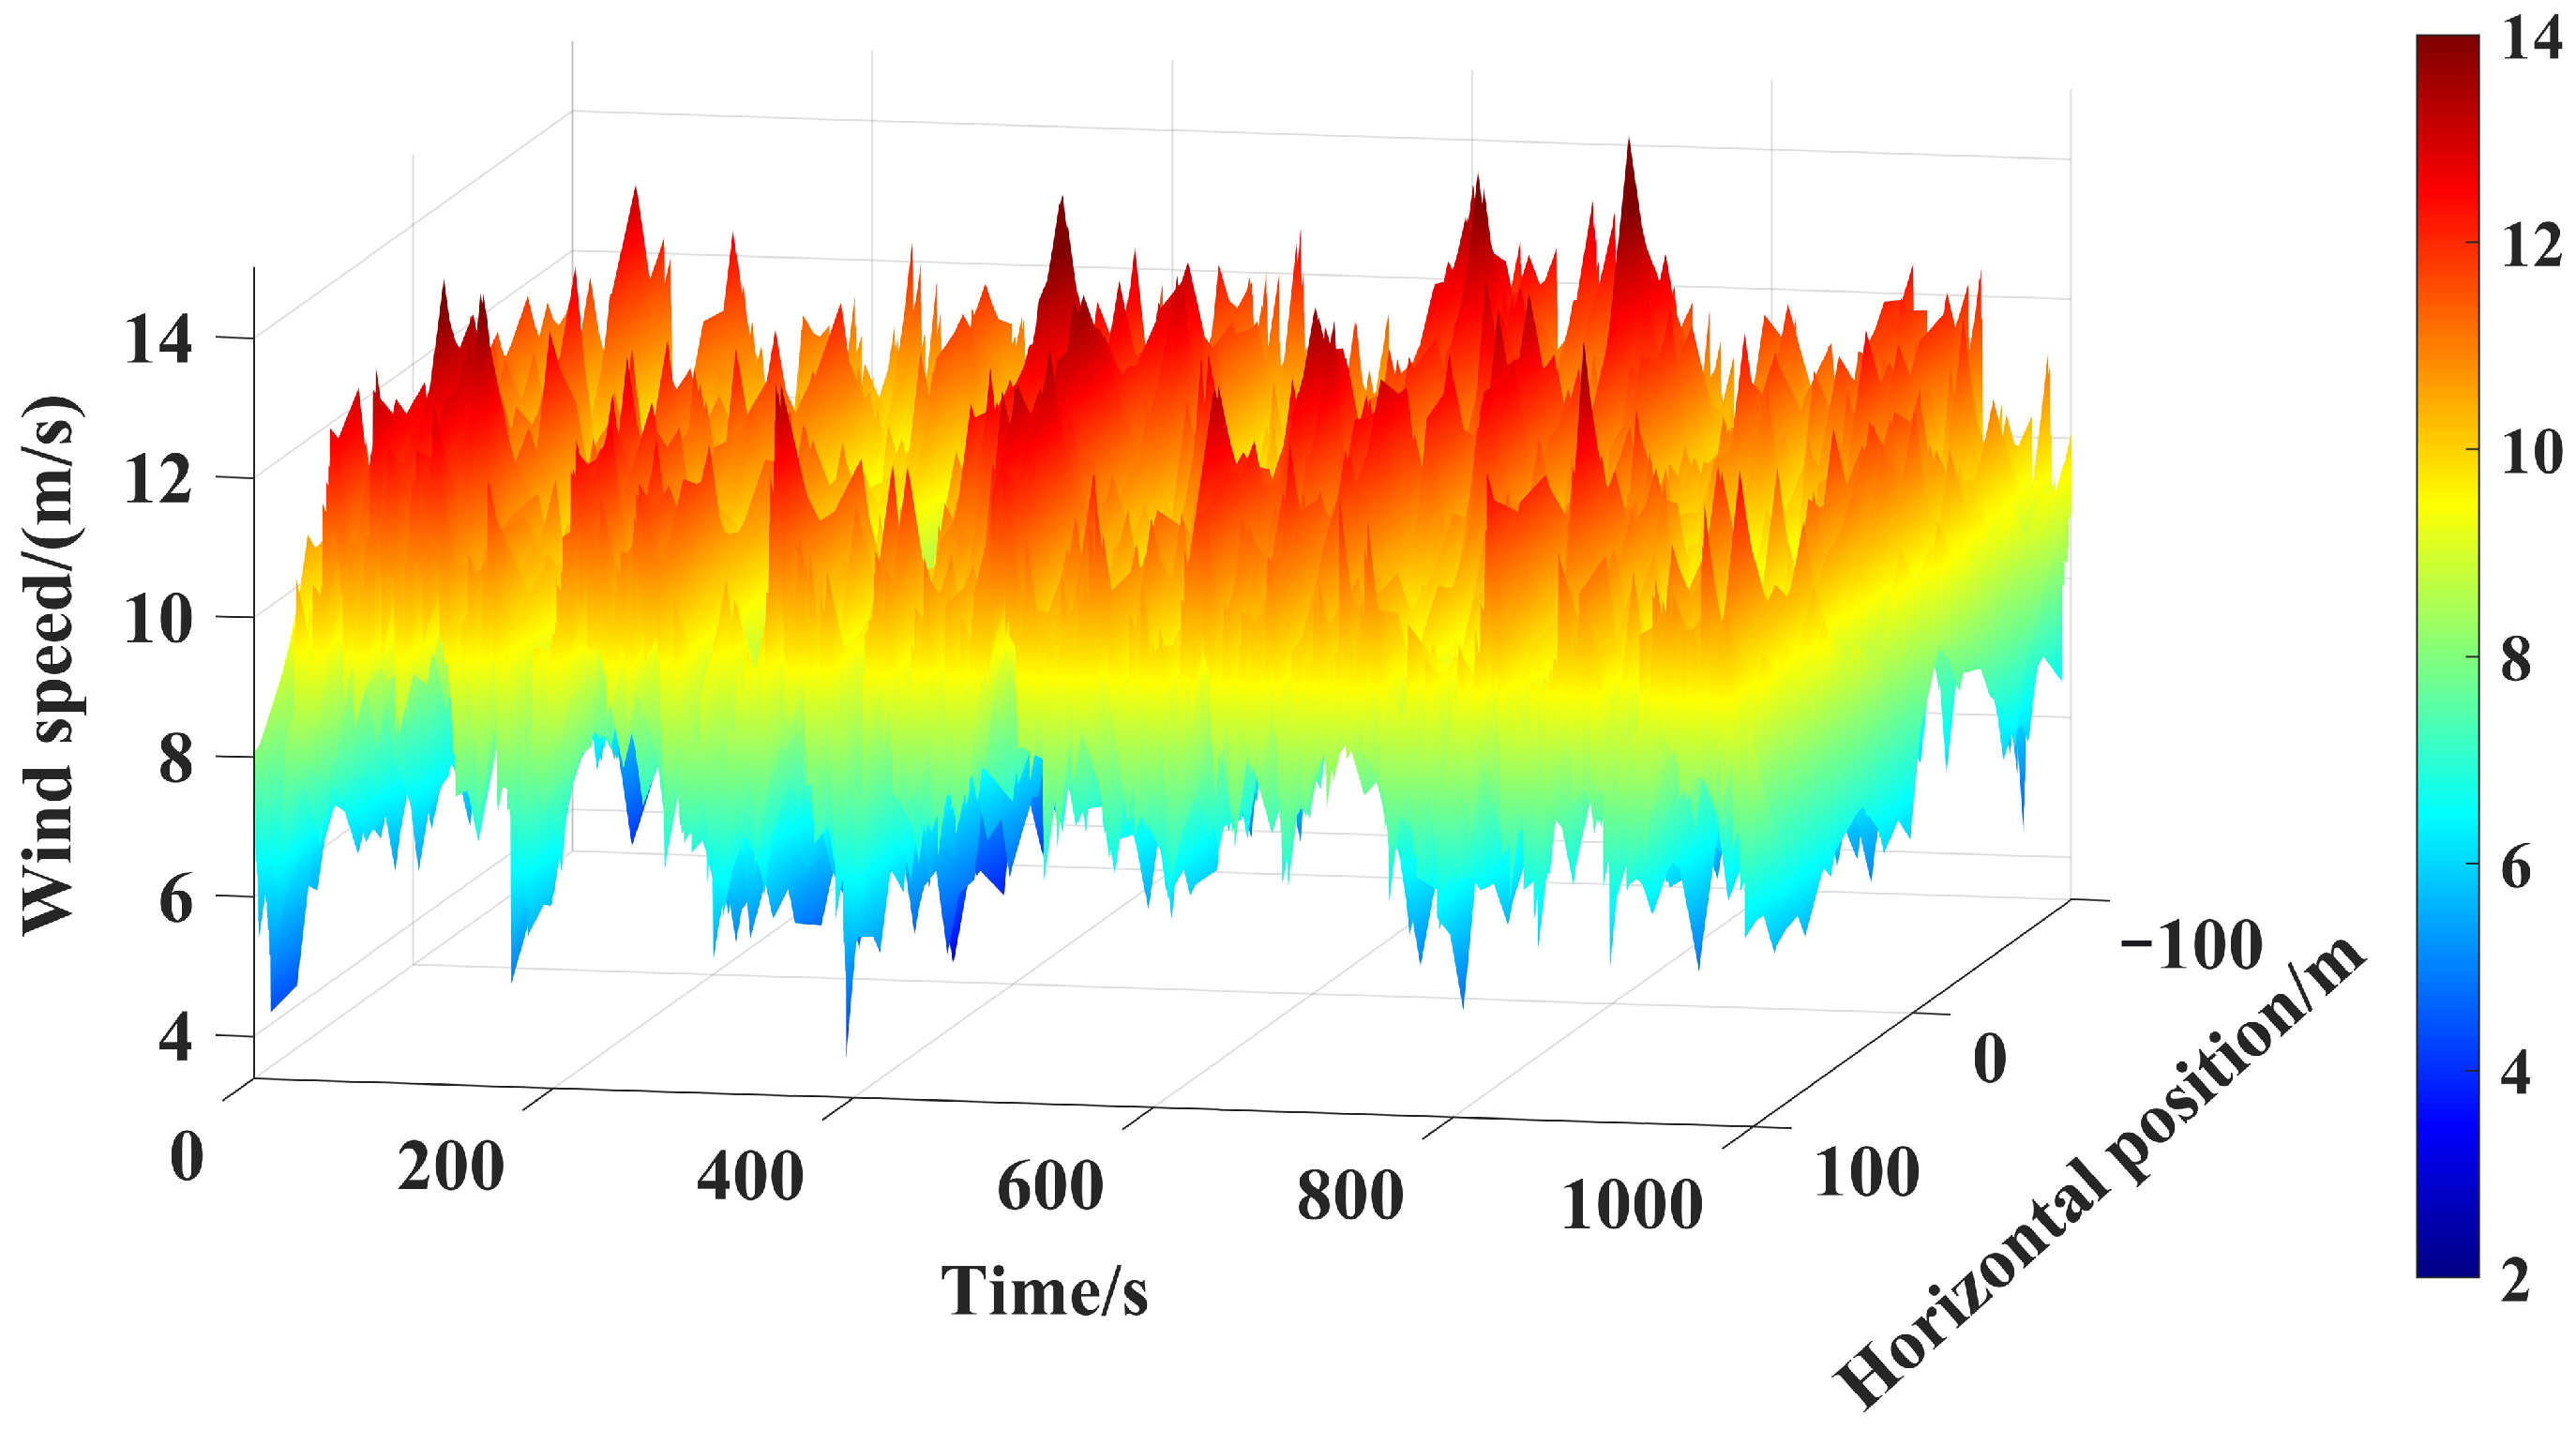
3.2. Description of the Operating Environmental Conditions
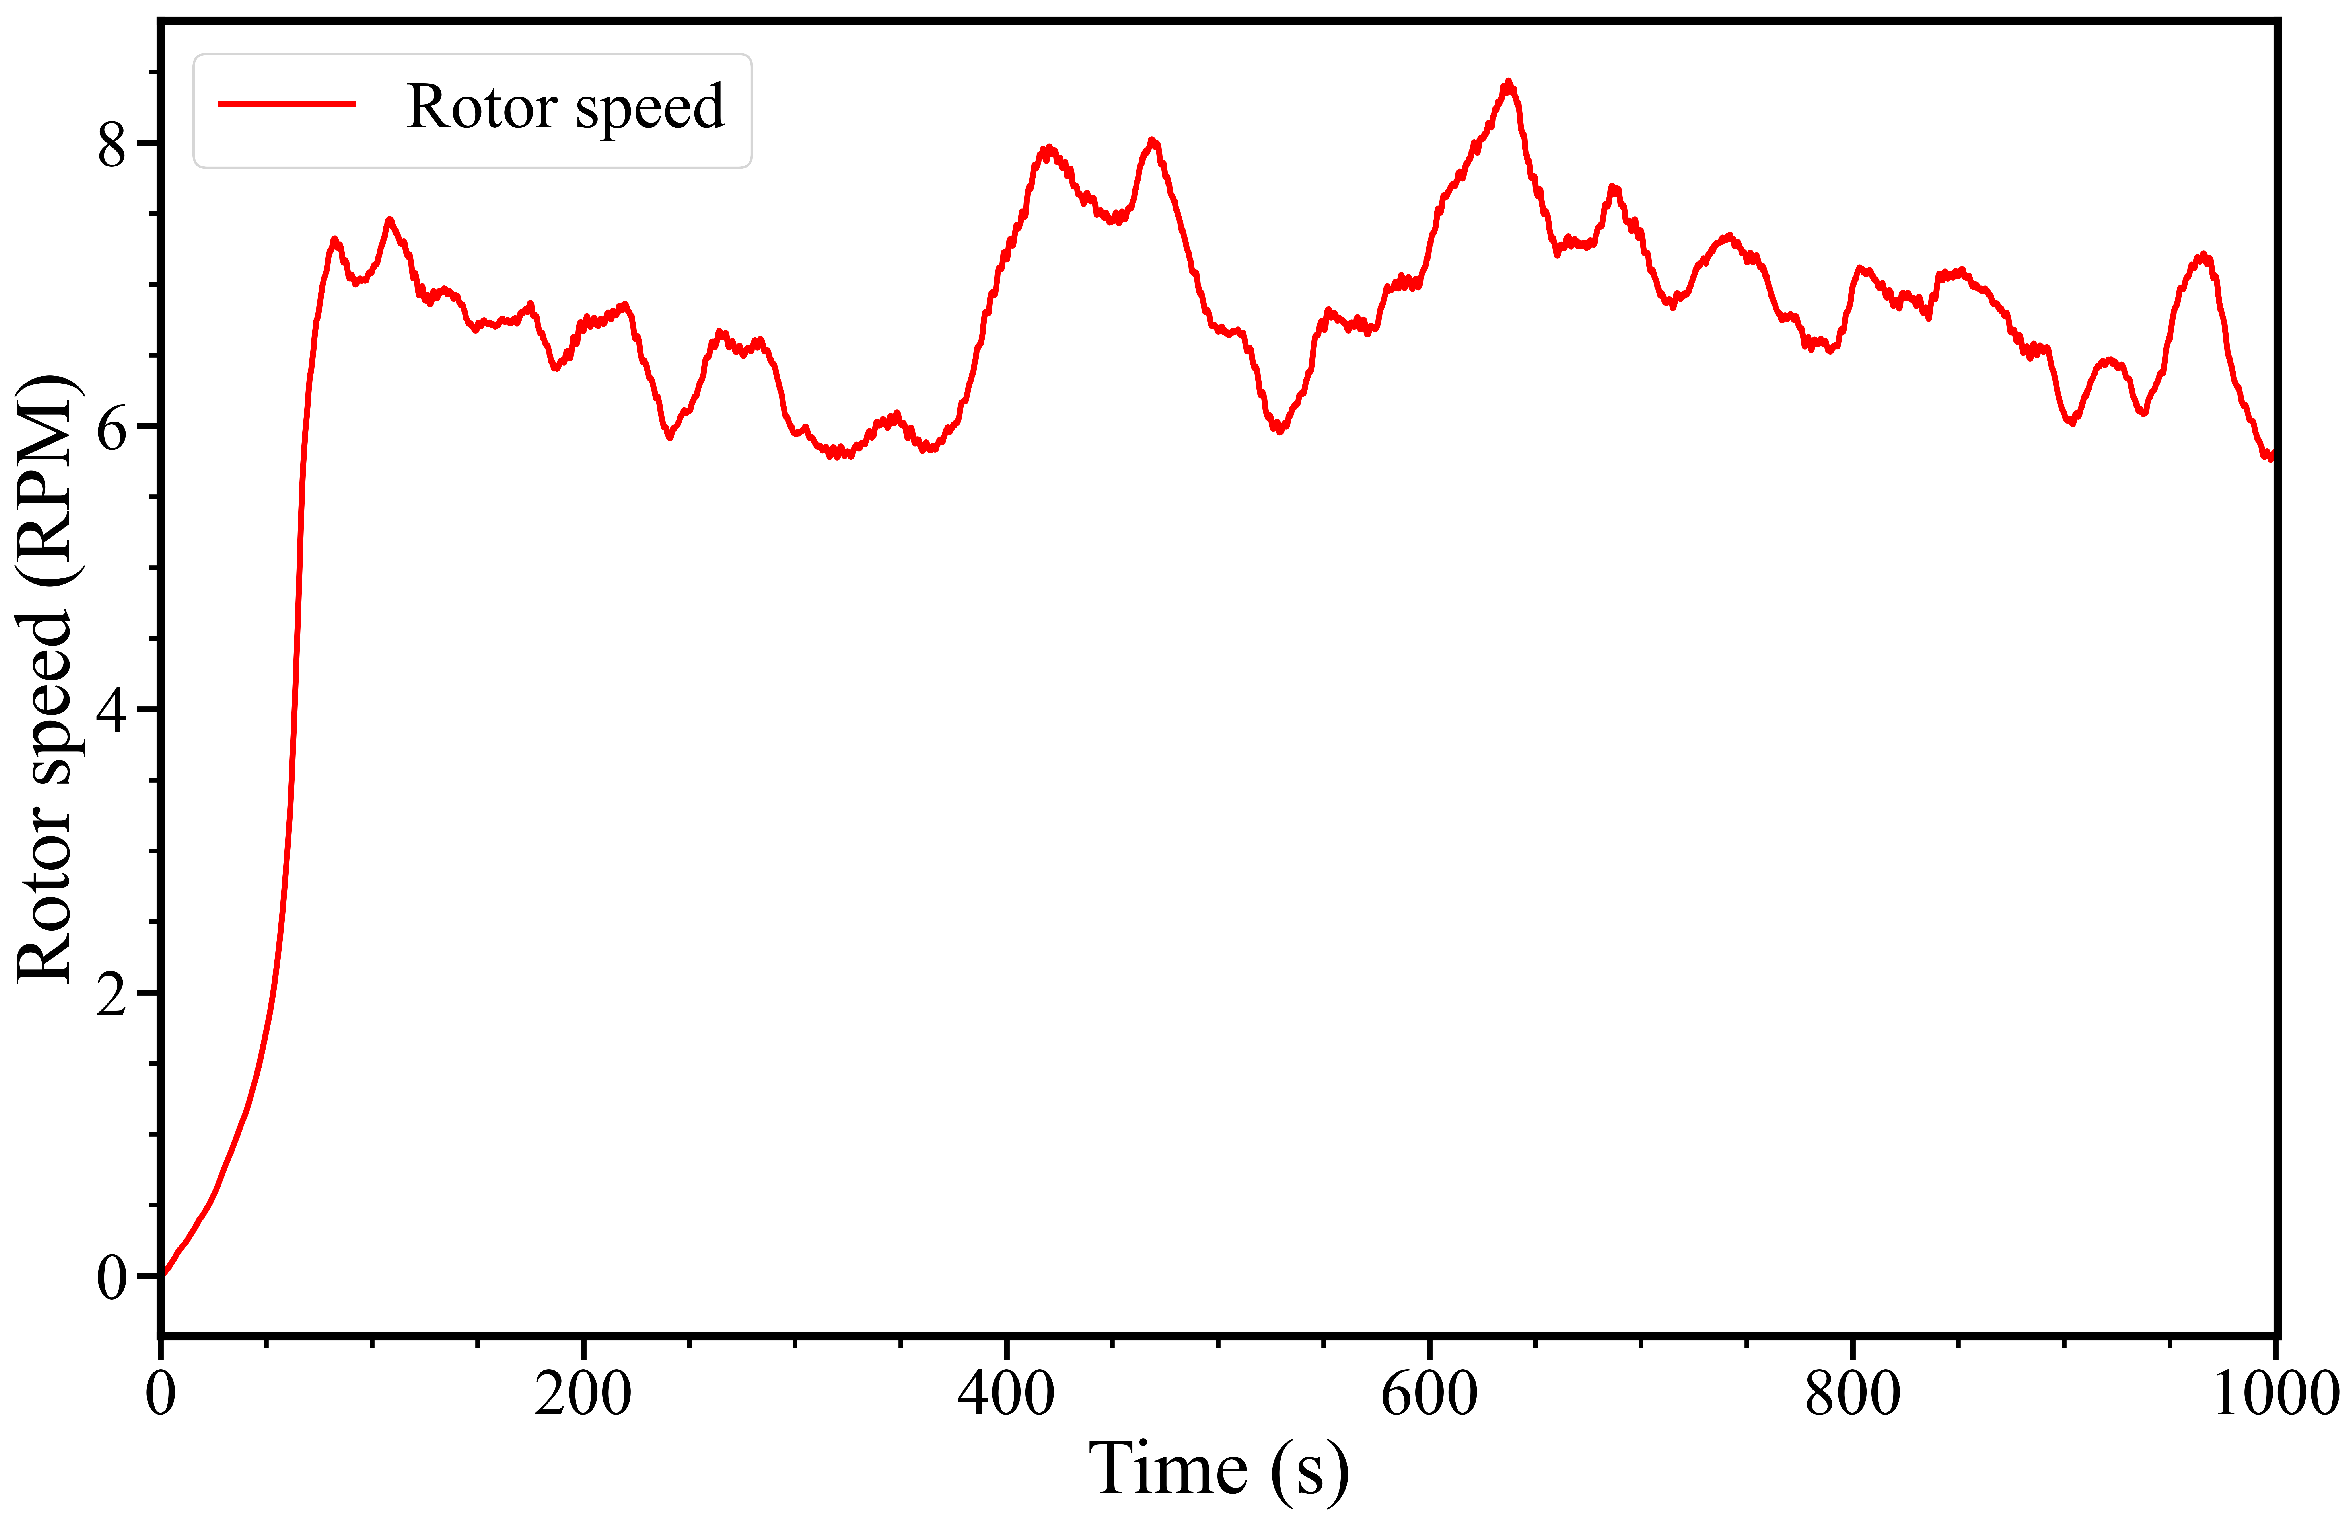
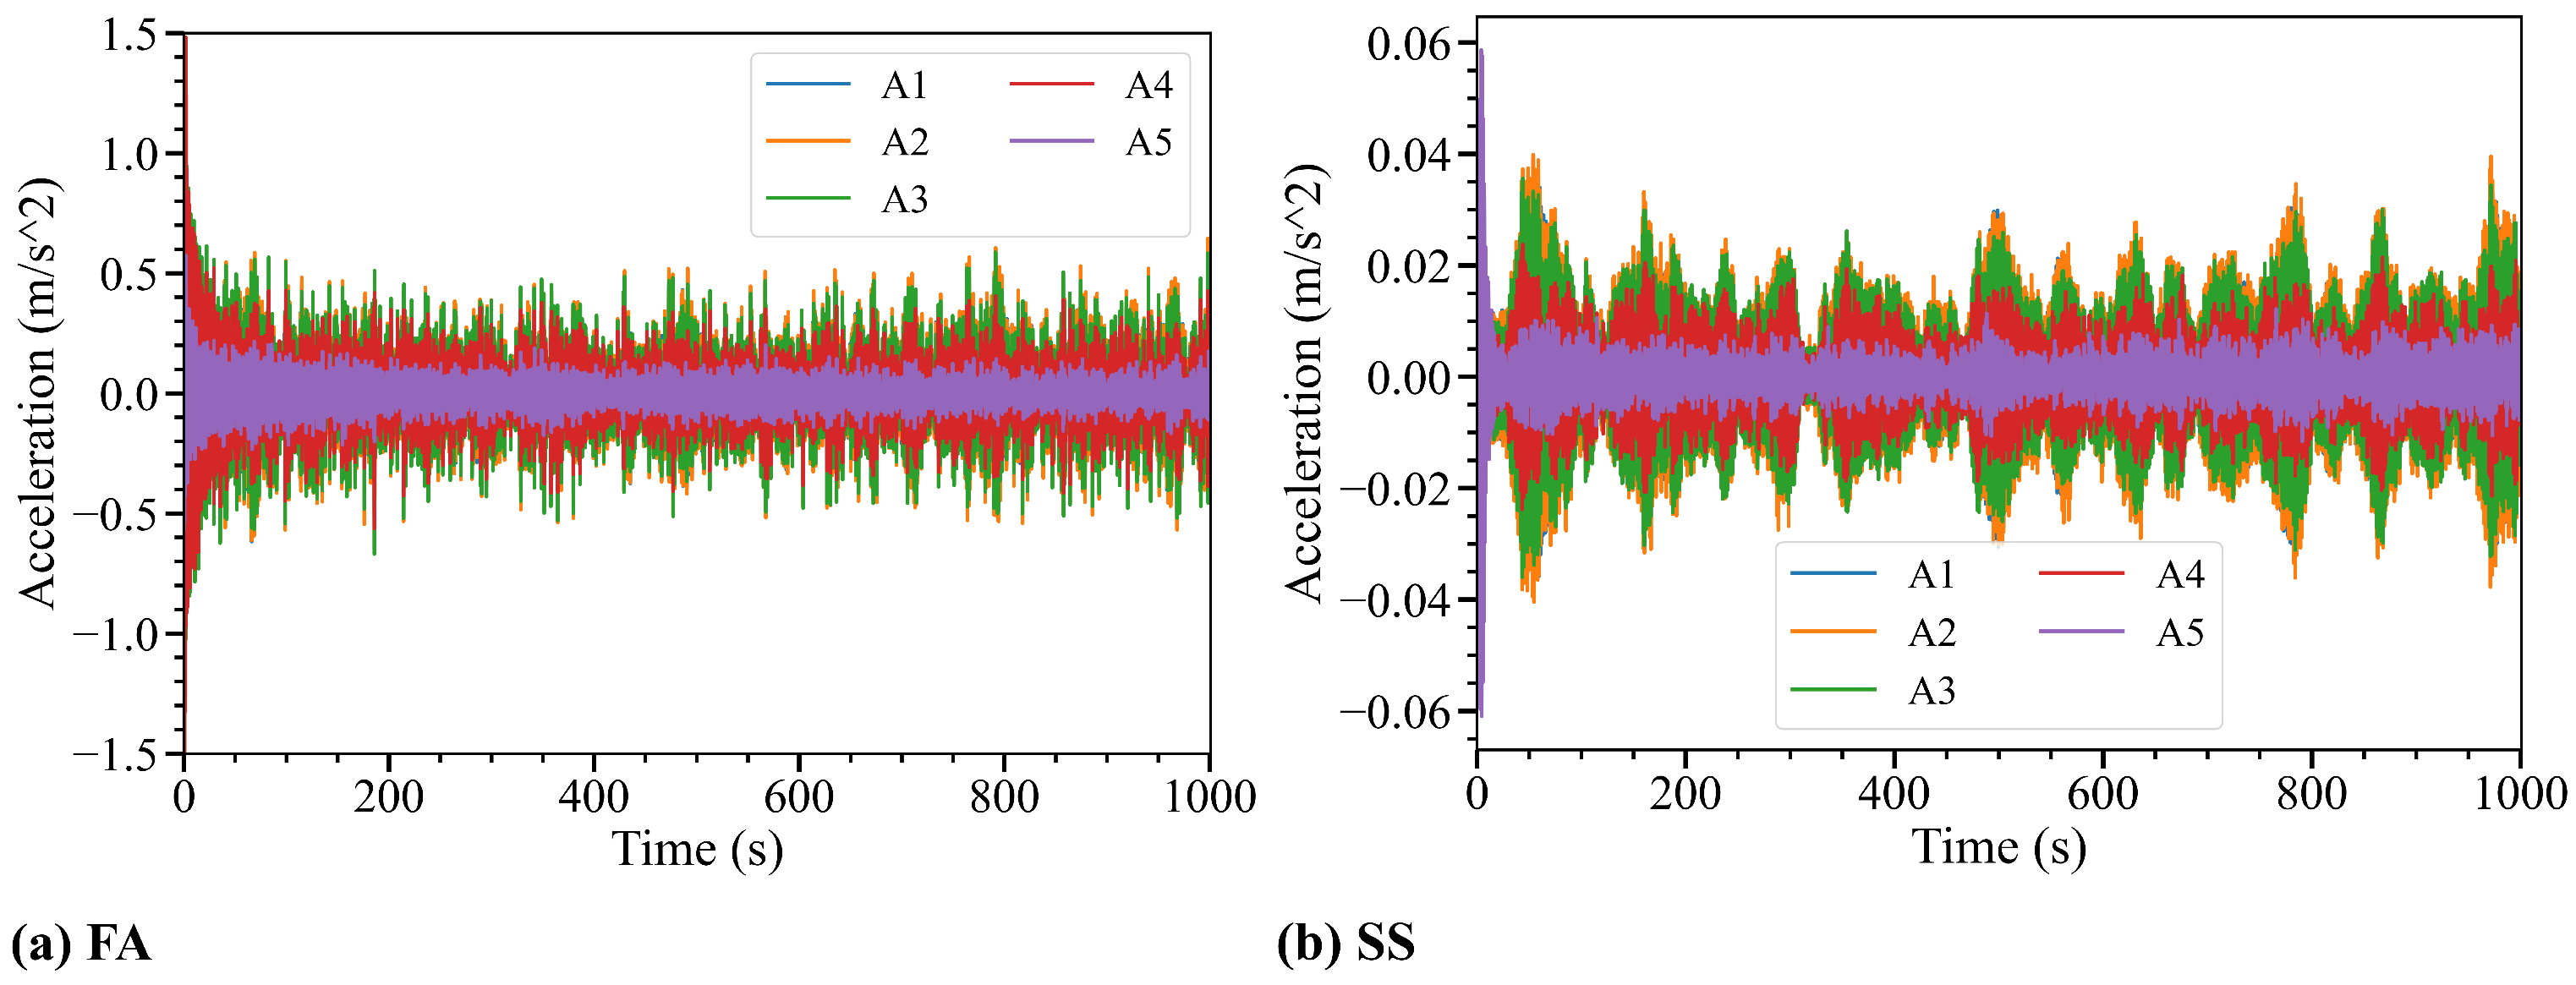
3.3. Vibration Response and Processing
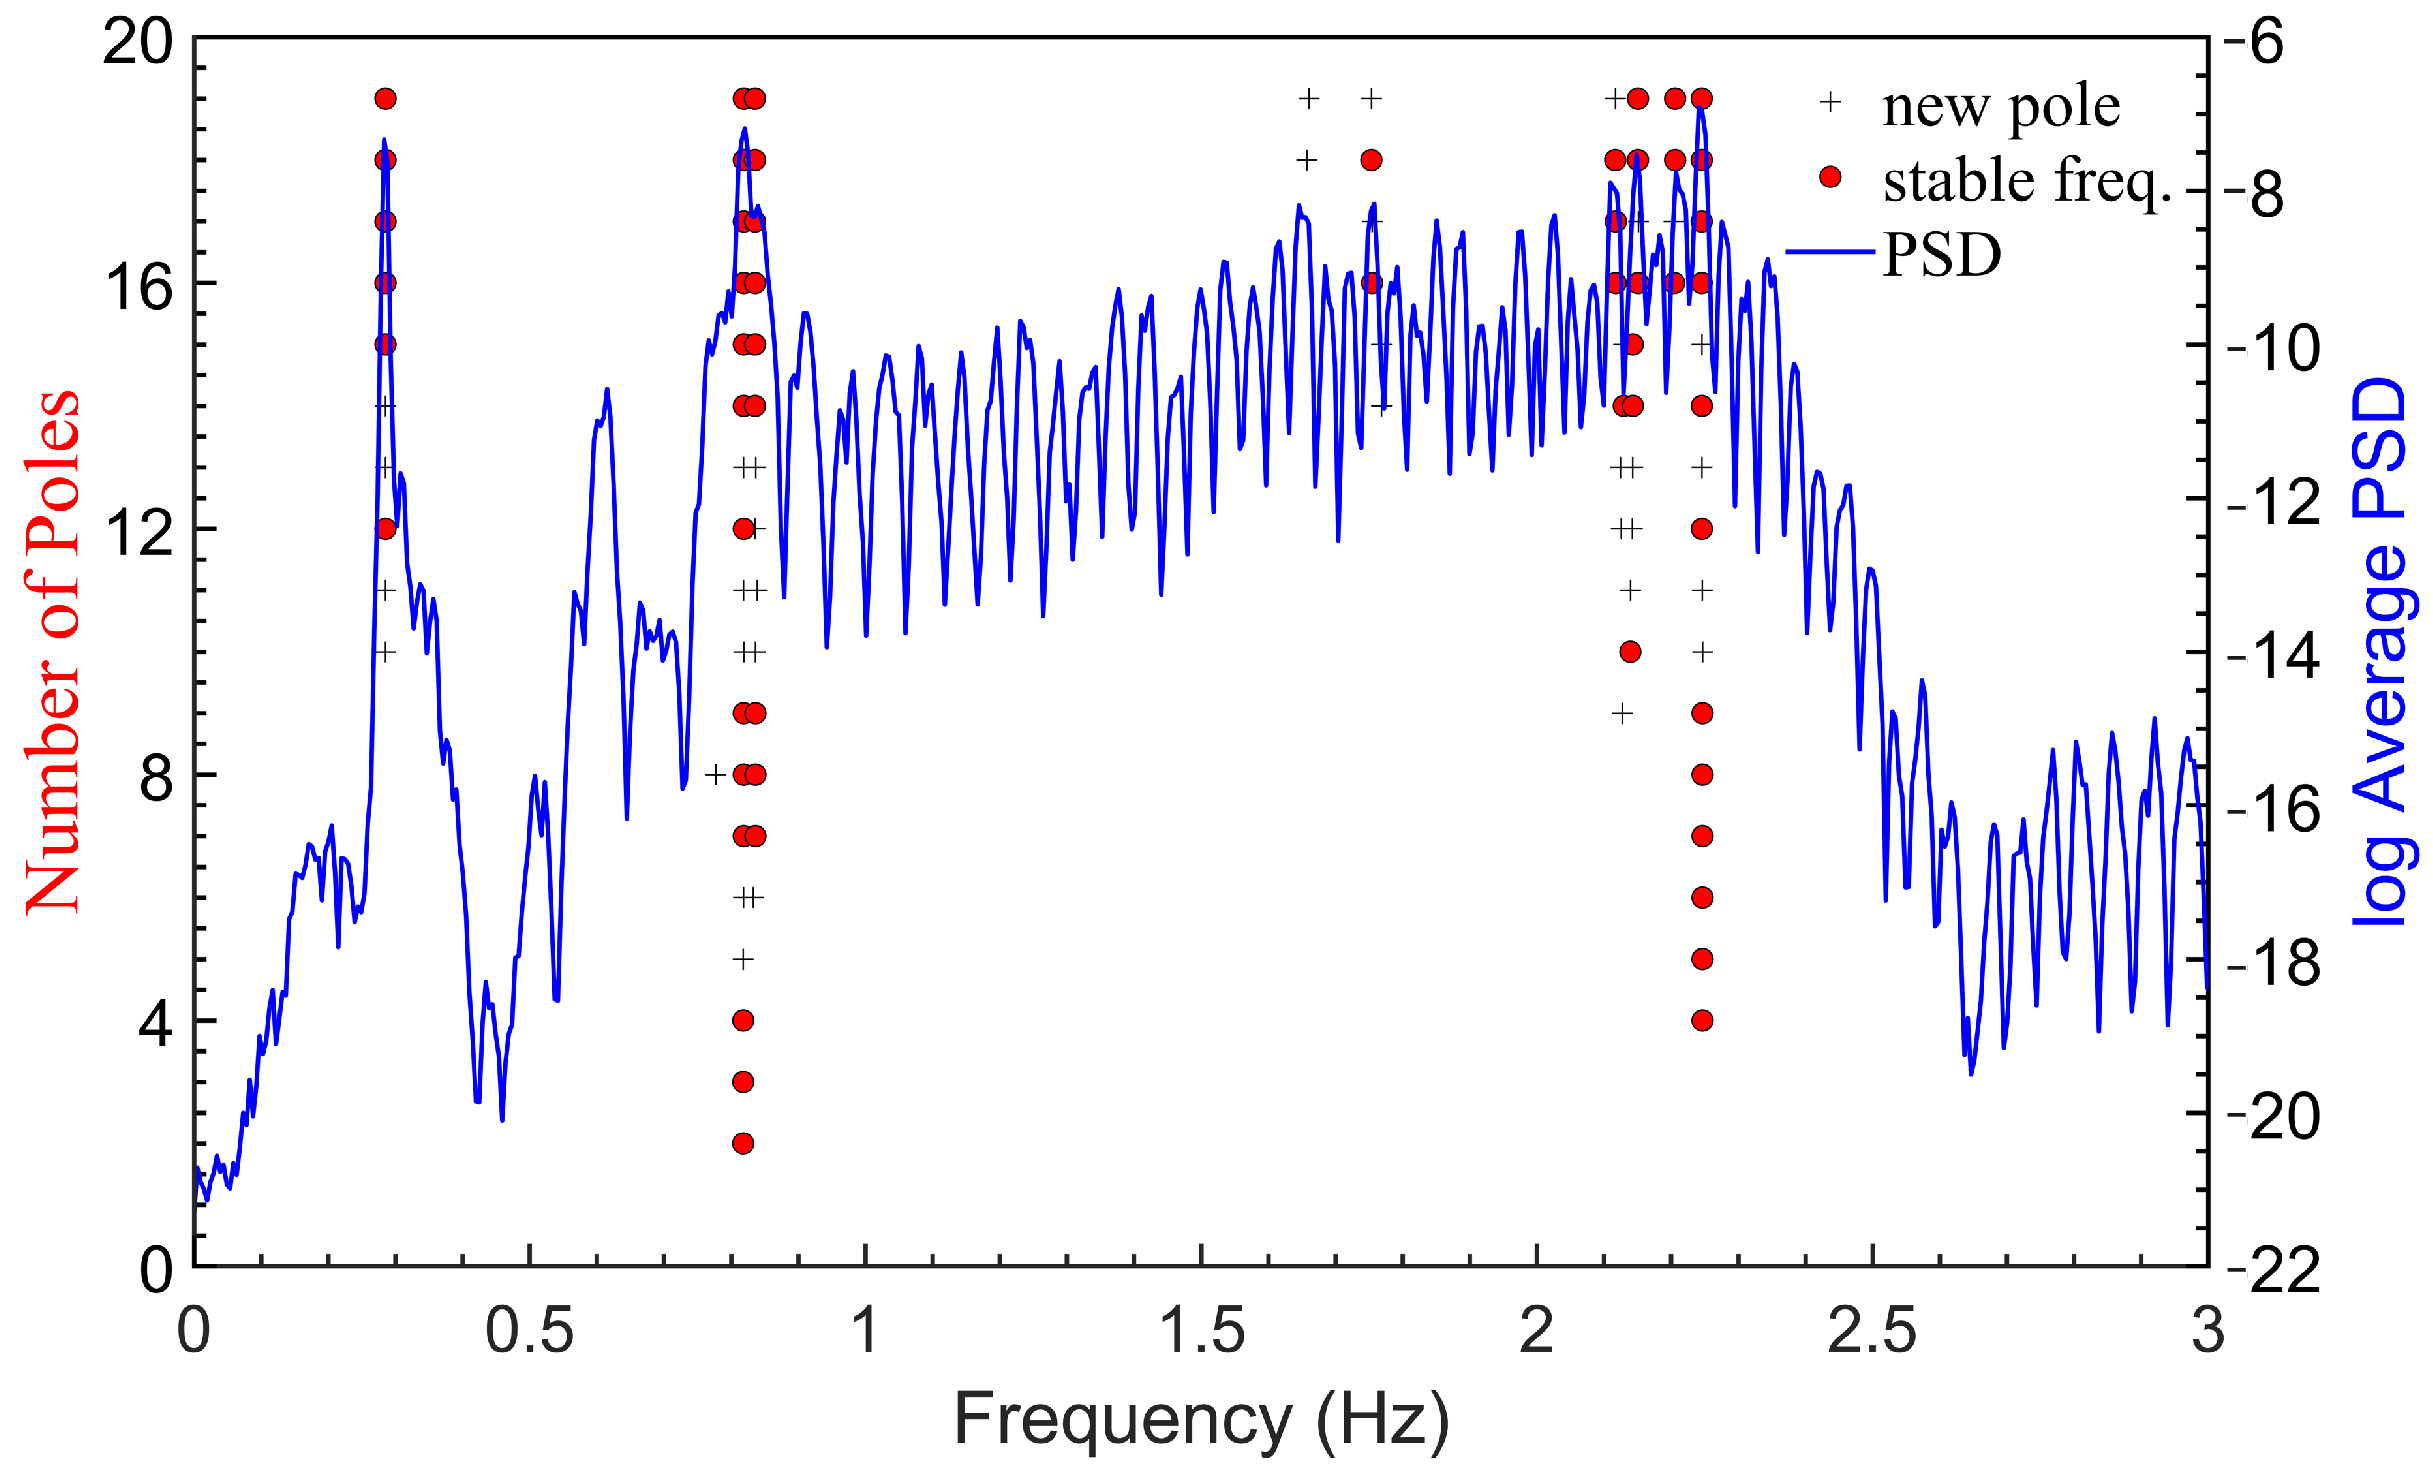
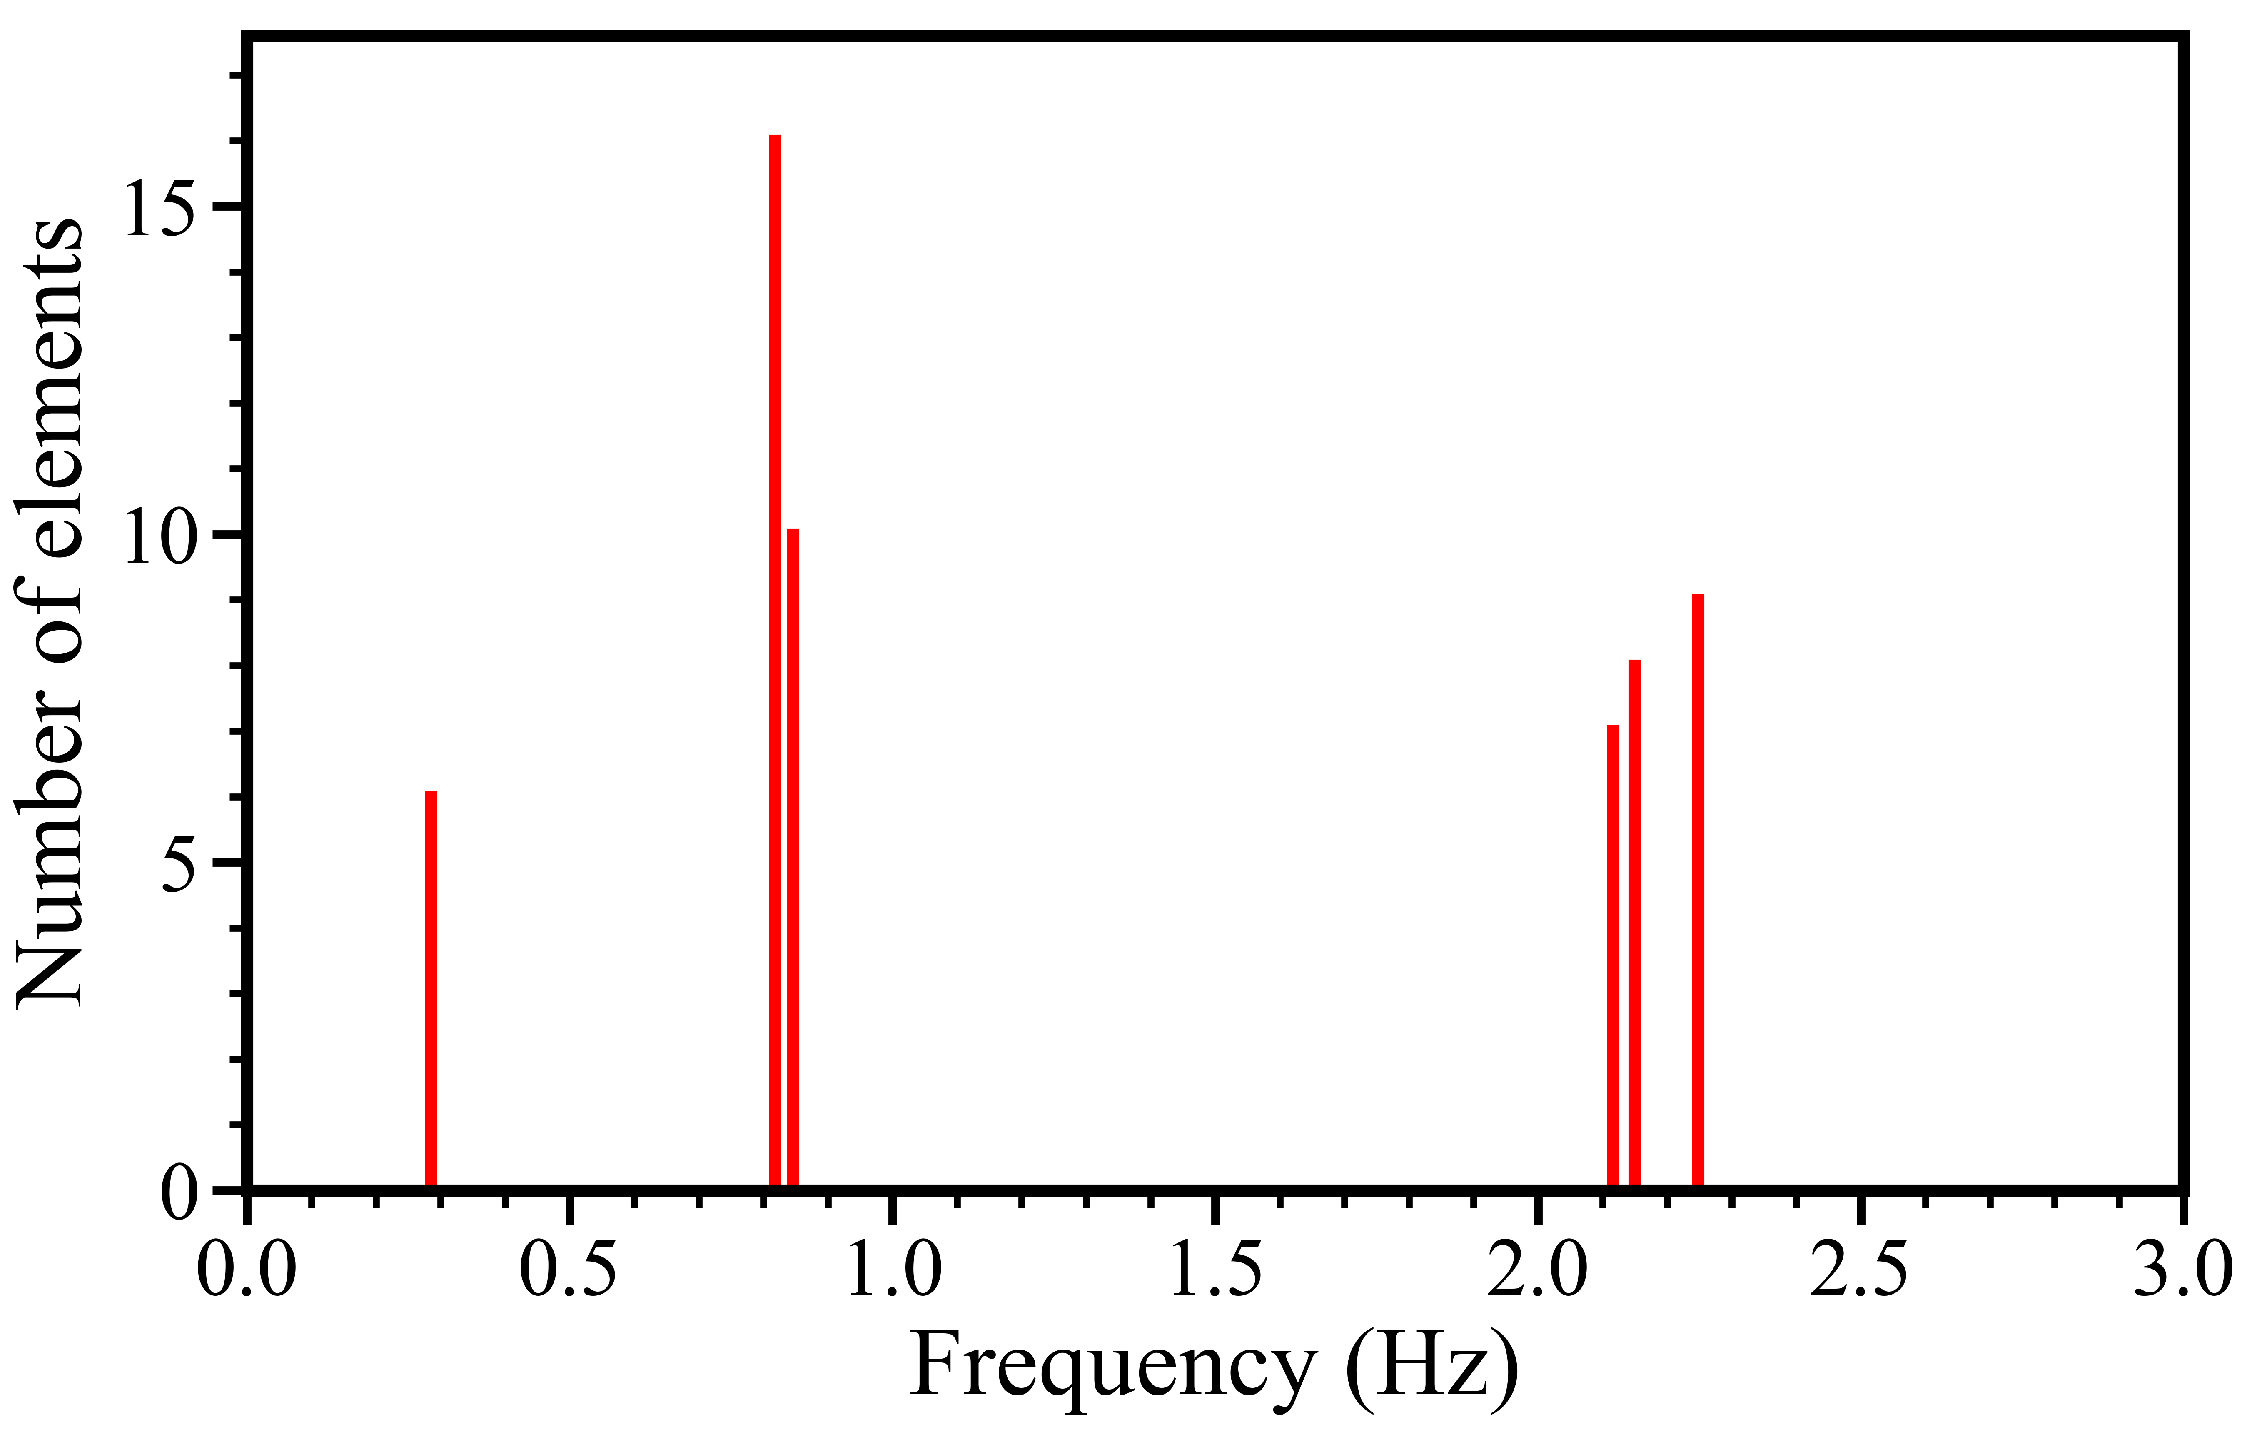
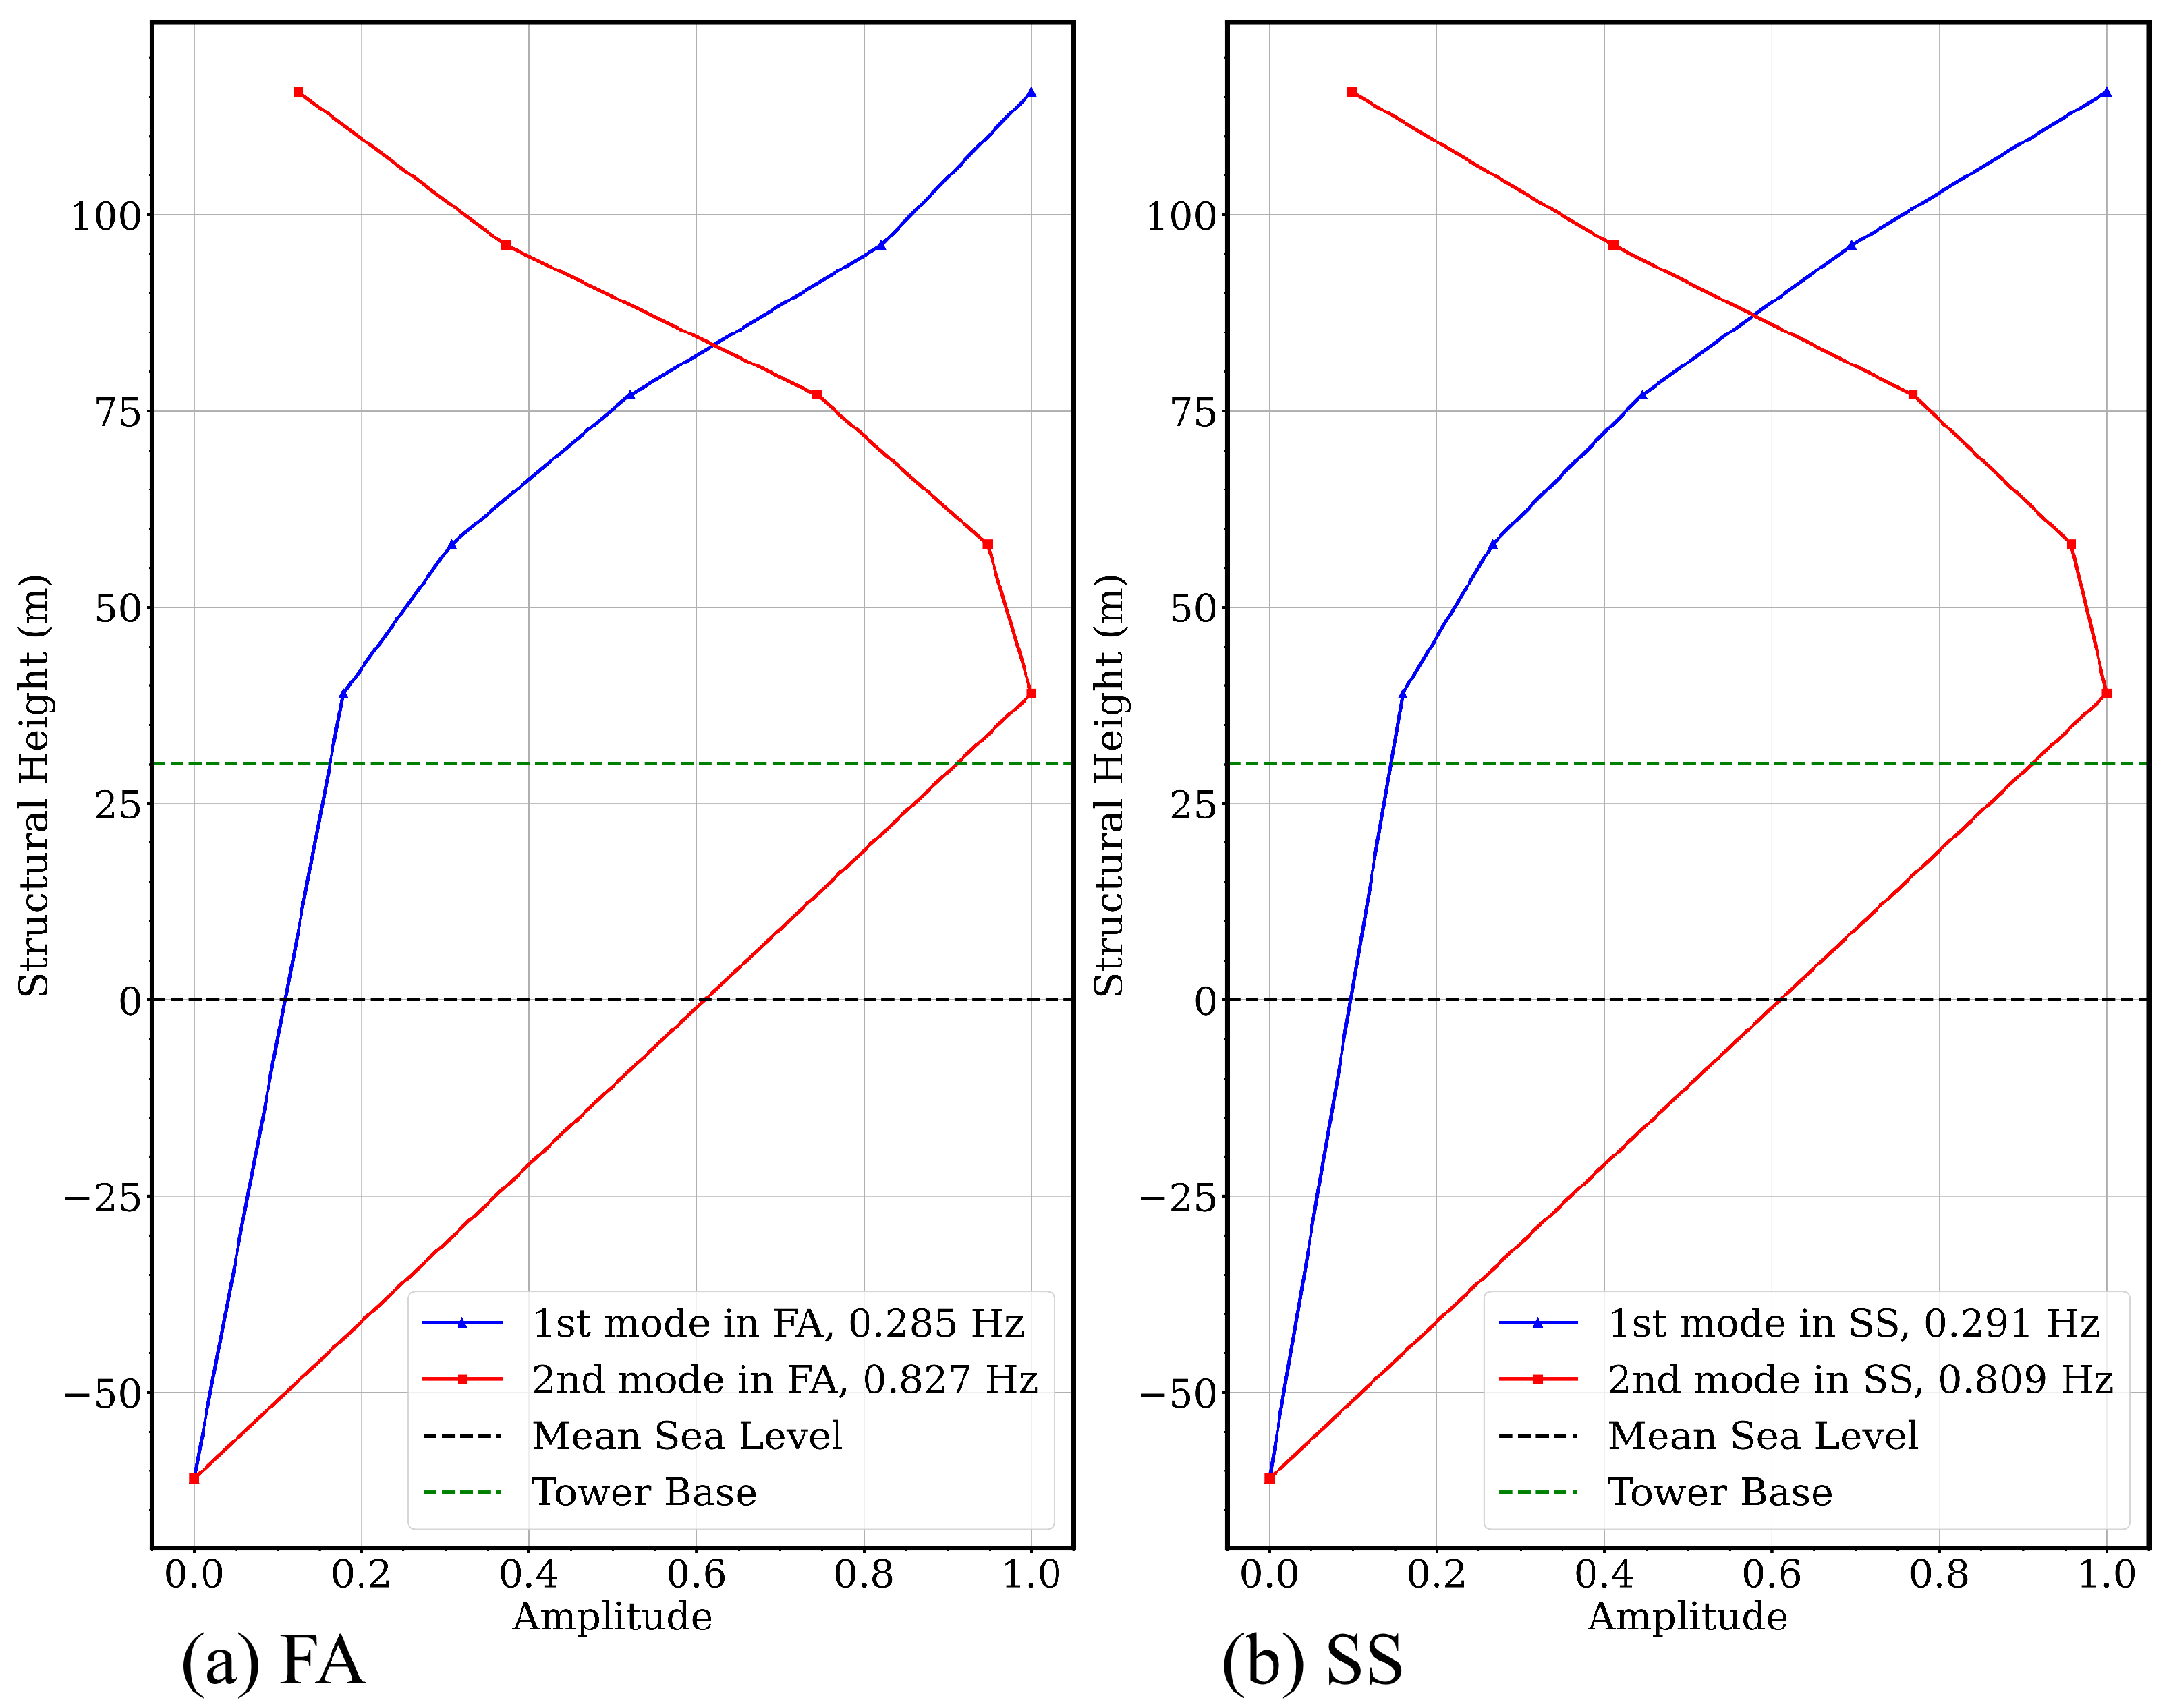
3.4. Validation of Modal Parameters Identification Method
4. Modal Parameter Identification Results
4.1. Identification Under Irregular Wave Excitation
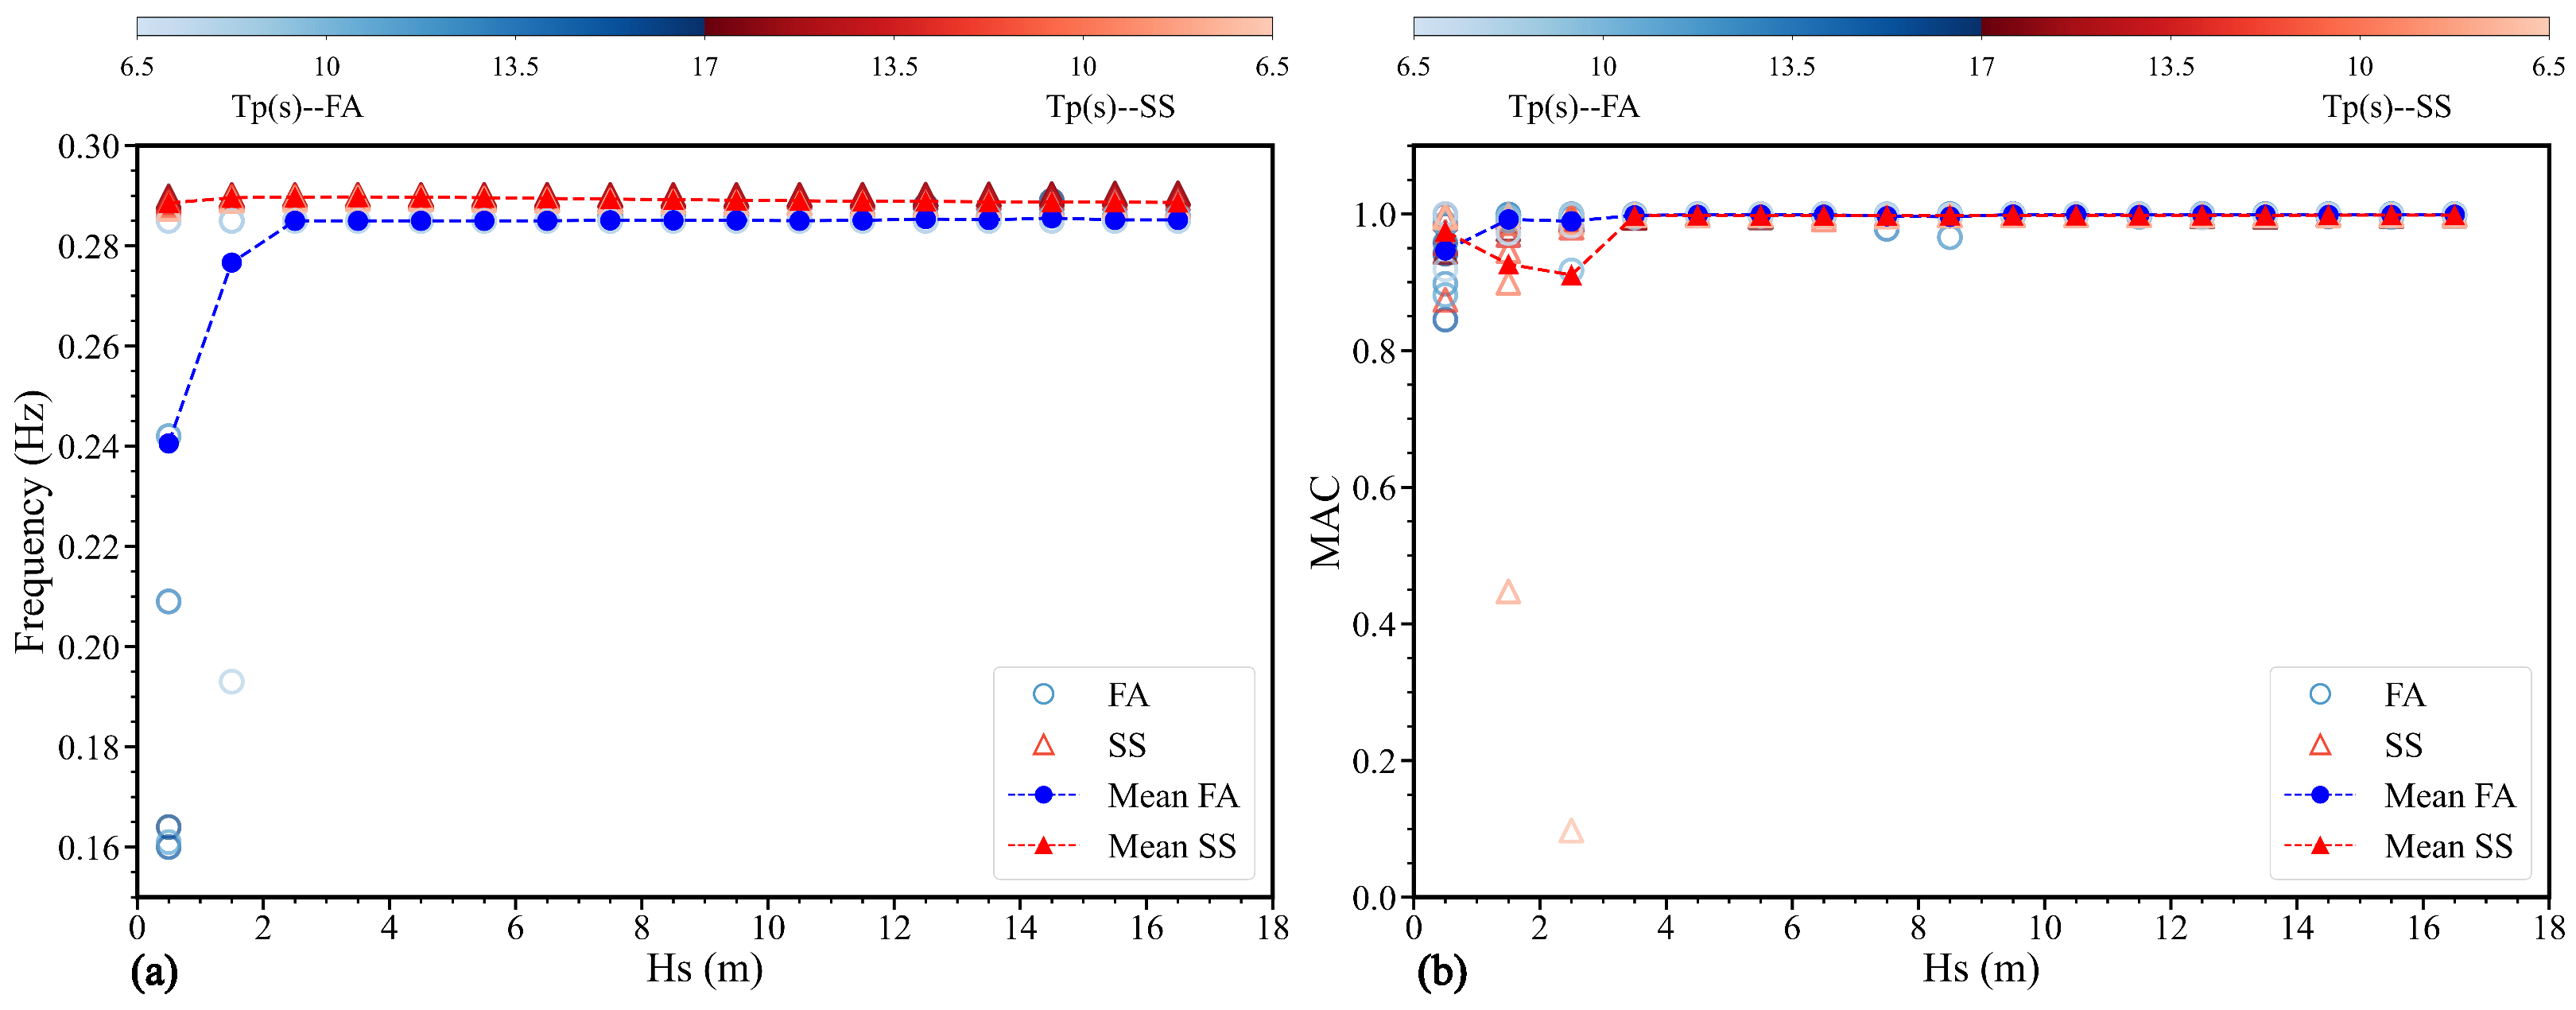
4.1.1. First FA/SS Modes
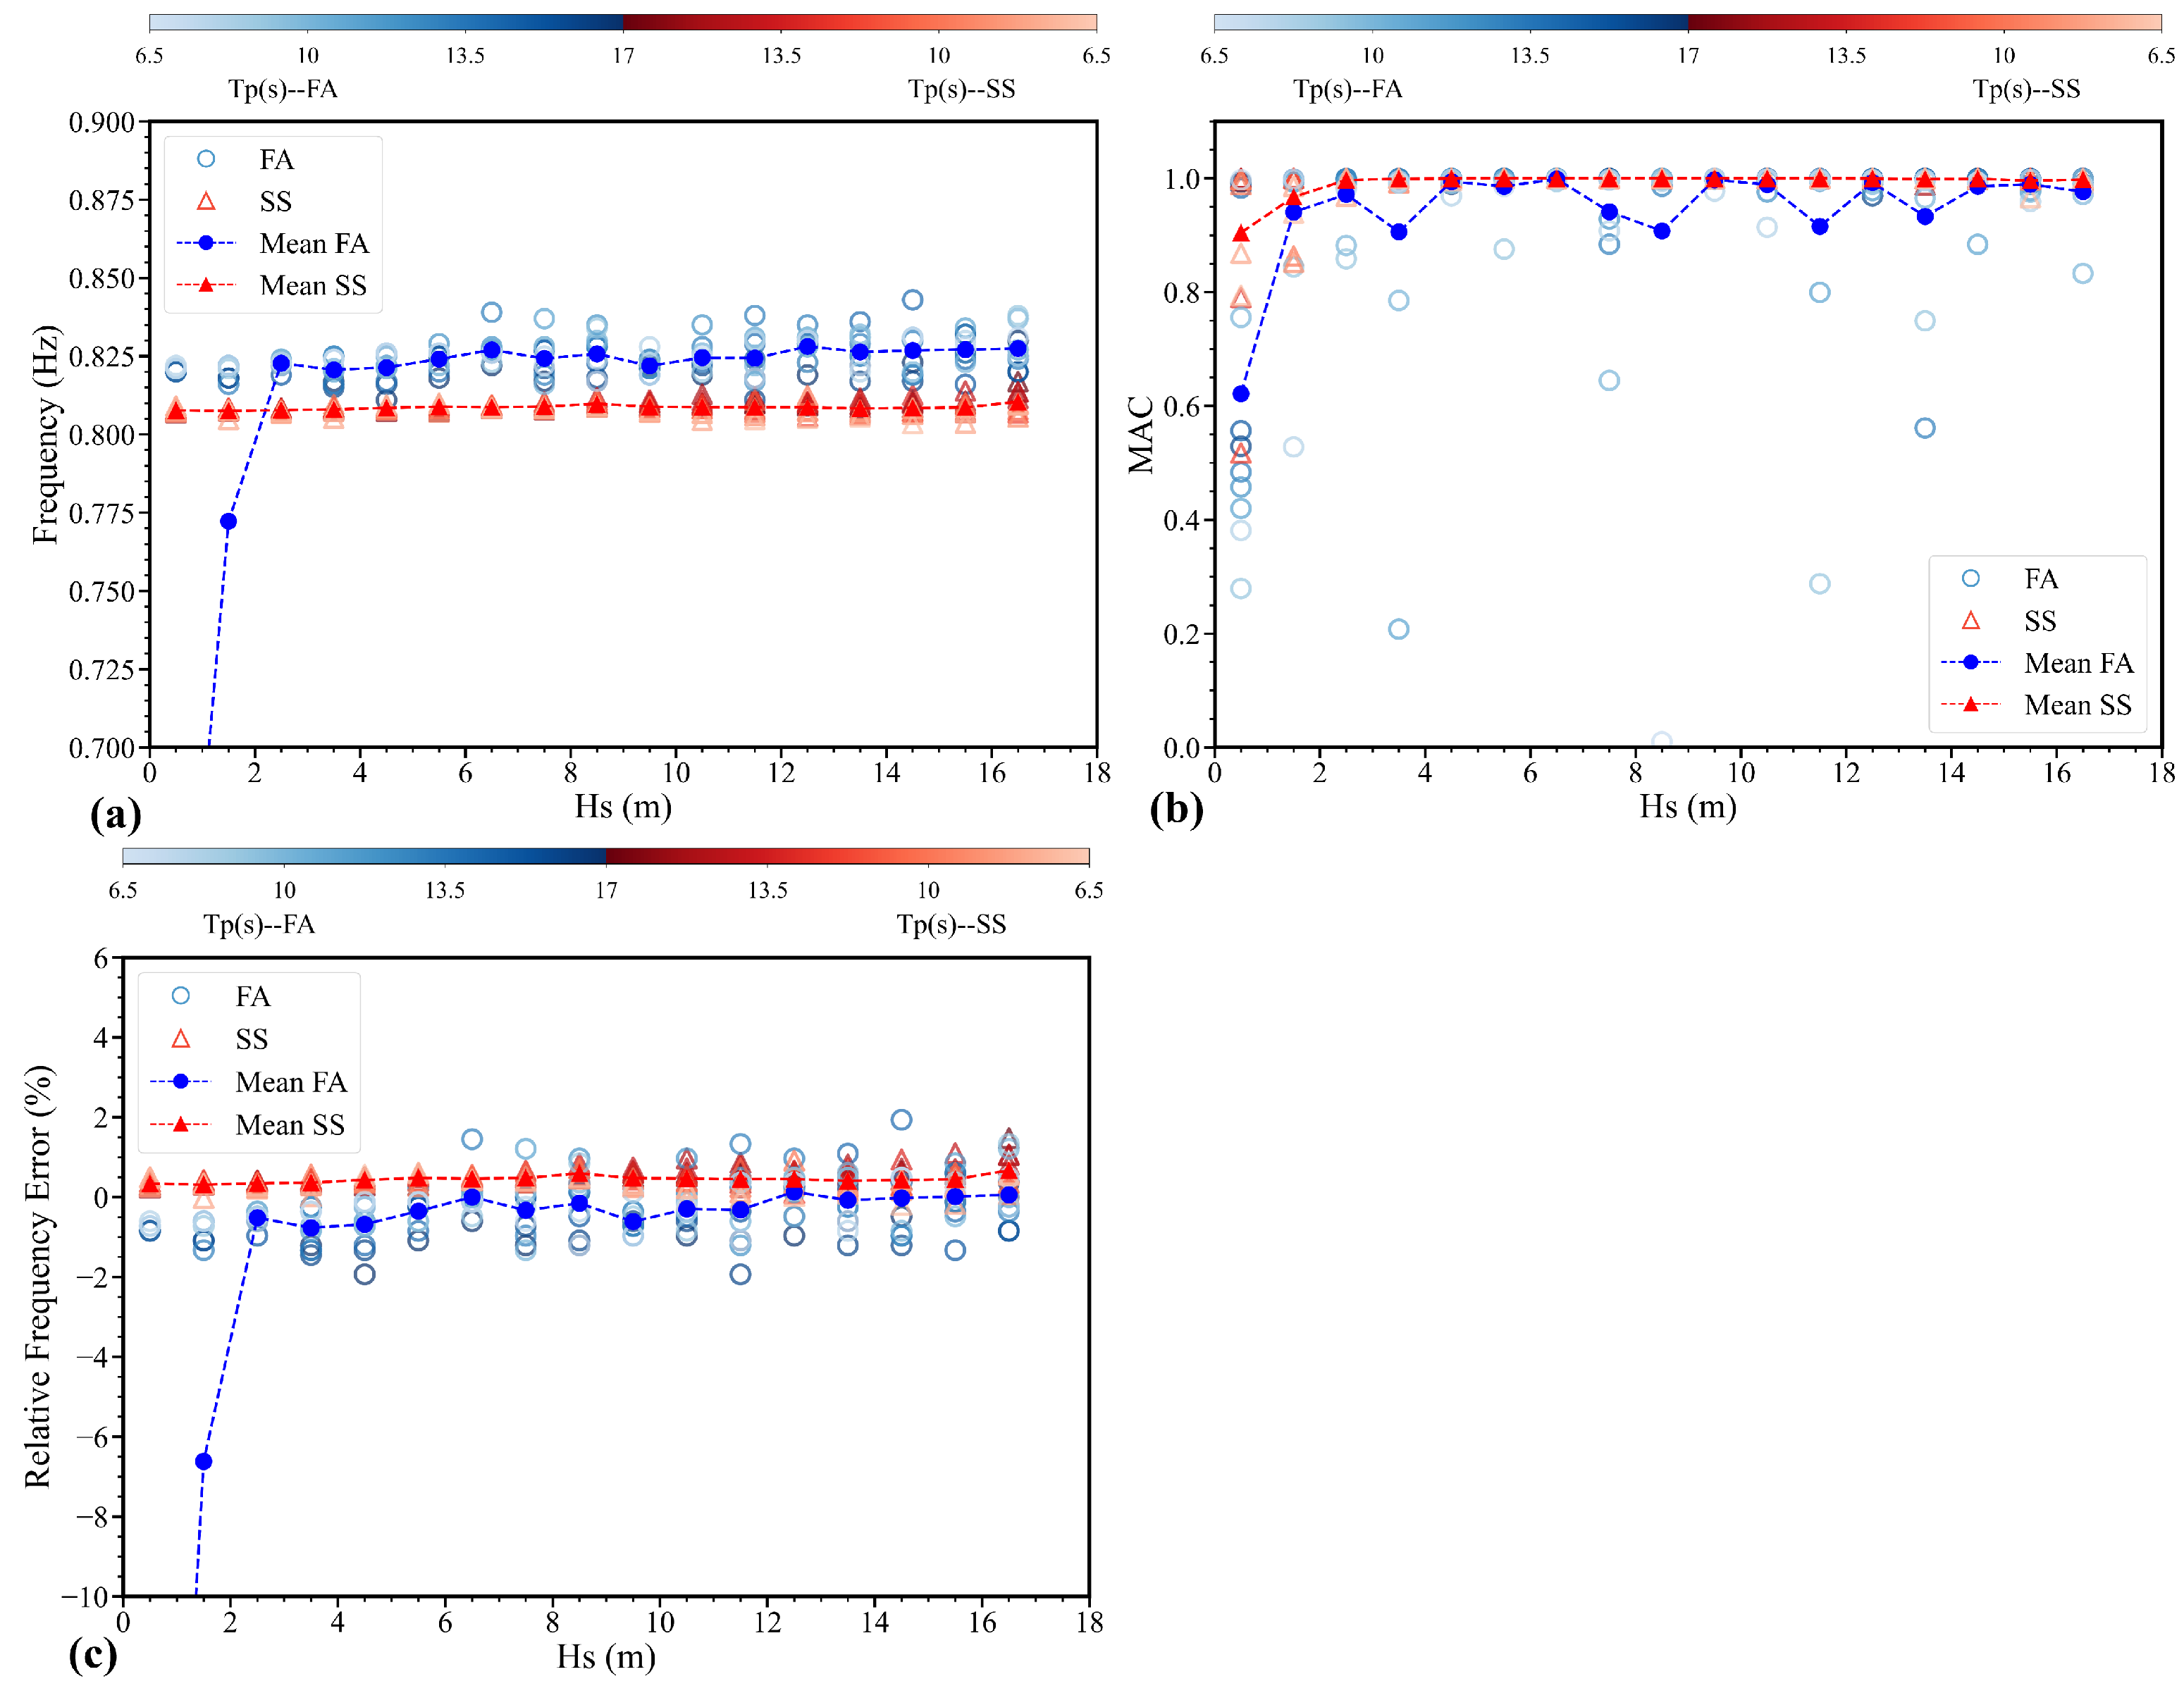
4.1.2. Second FA/SS Modes
4.2. Identification Under Turbulent Wind Excitation
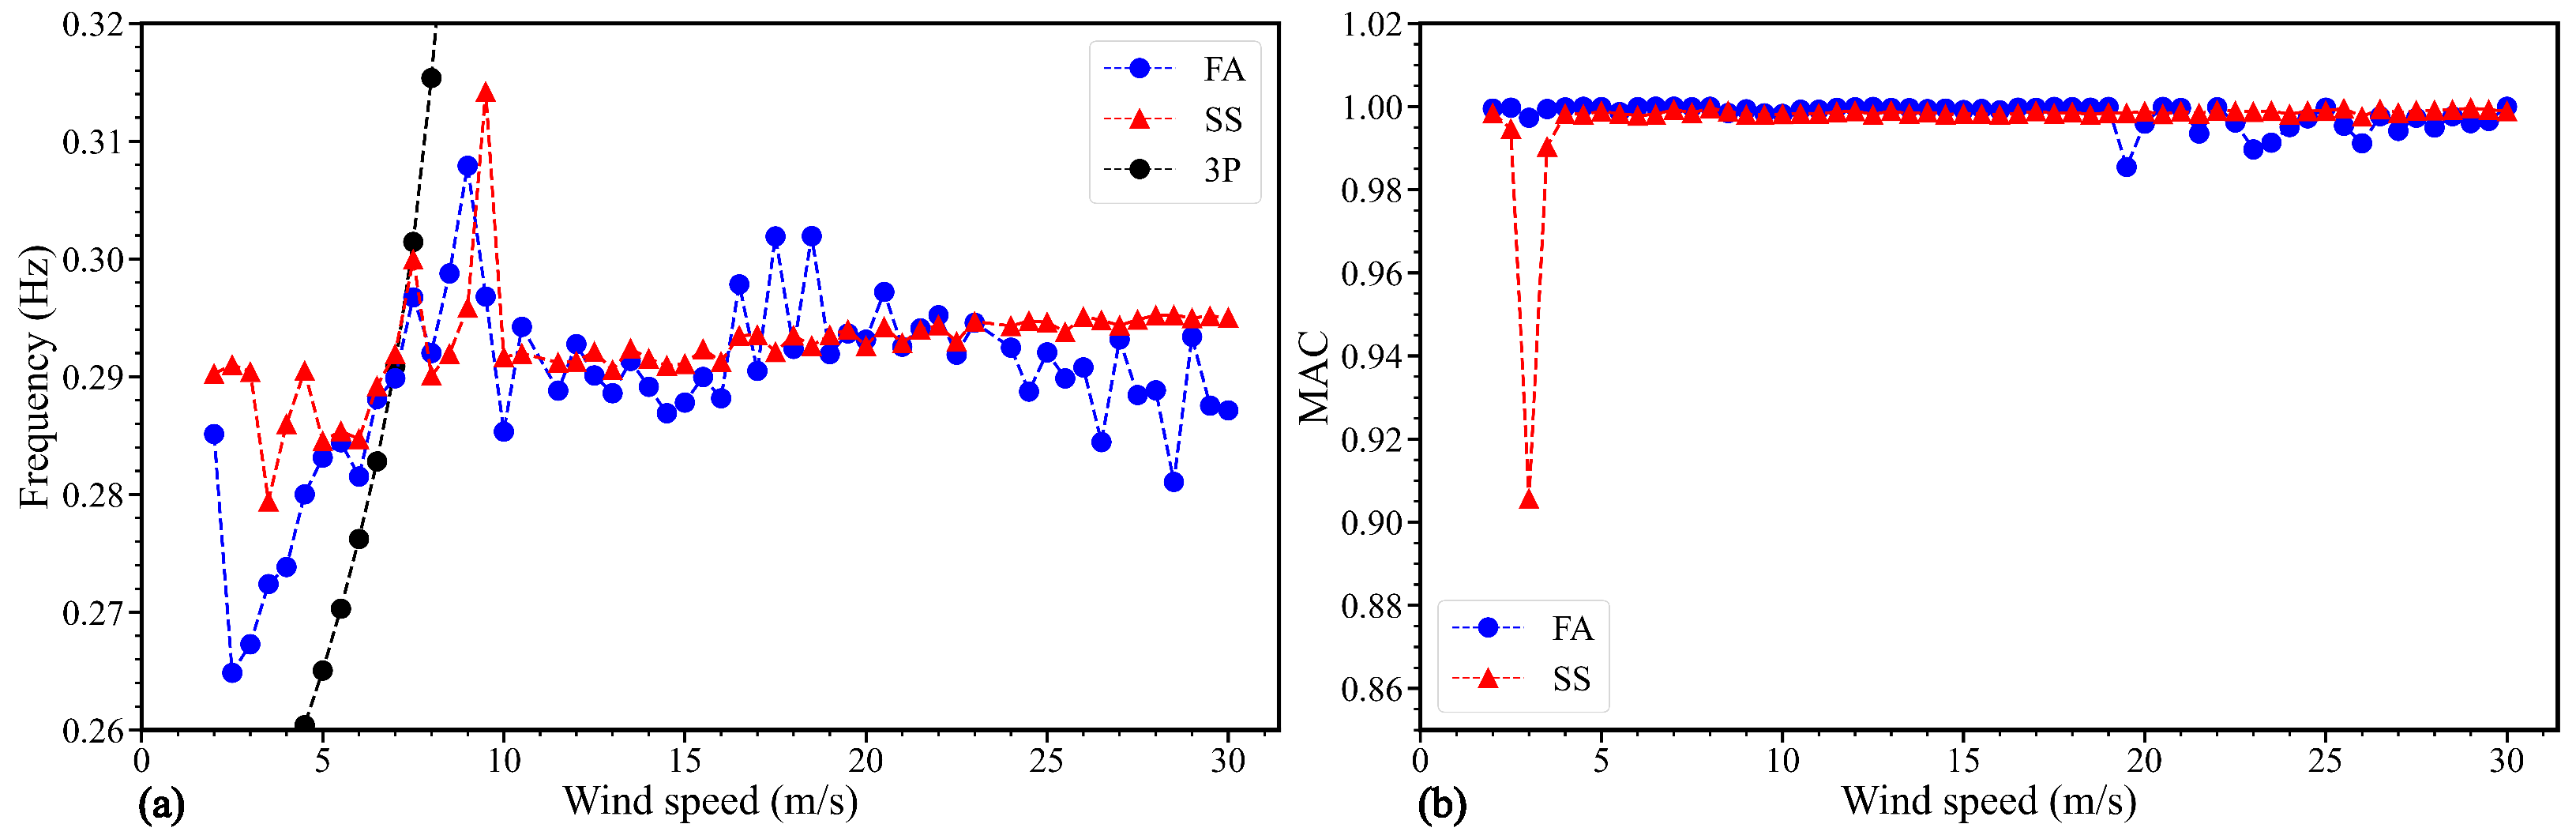
4.2.1. First FA/SS Modes
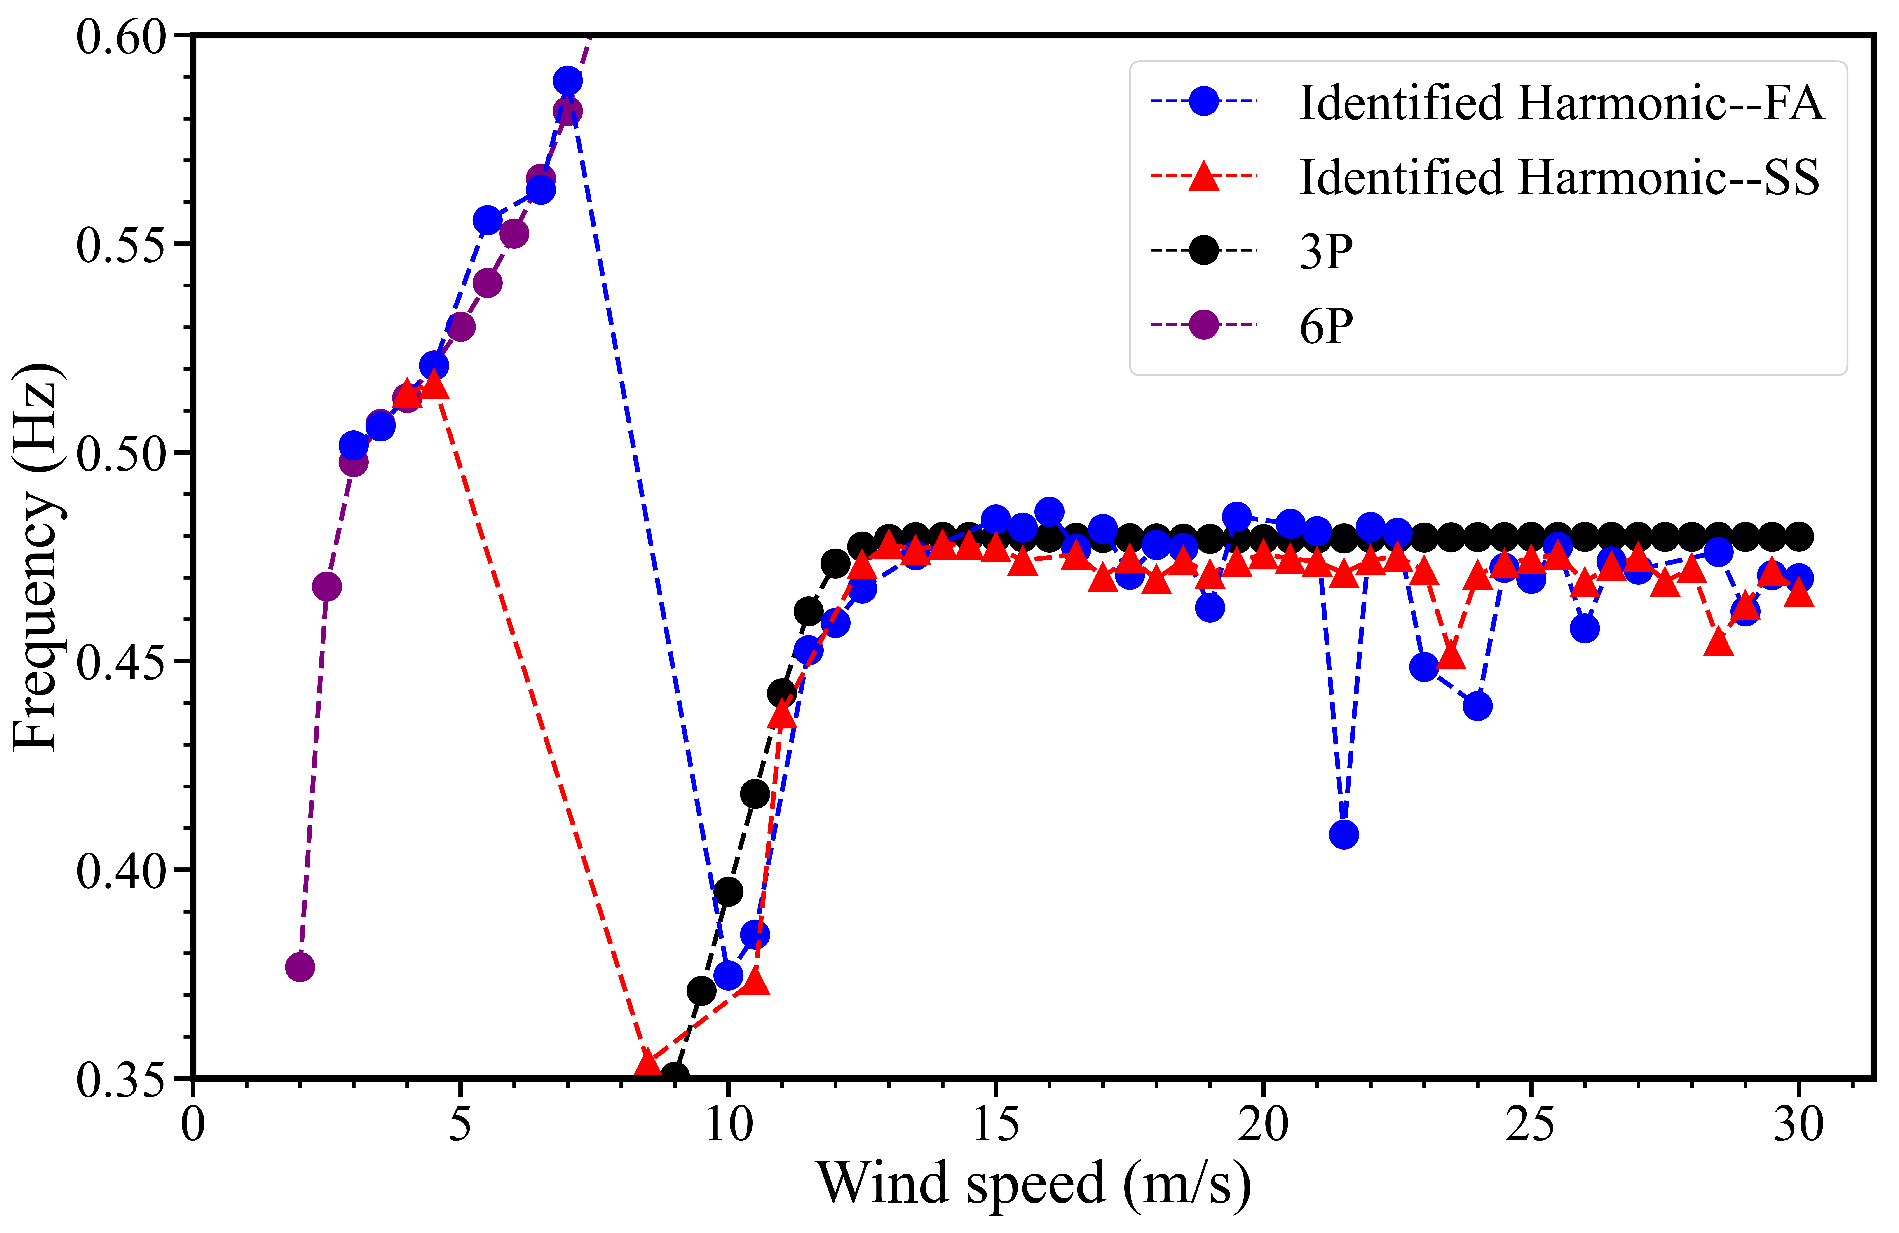
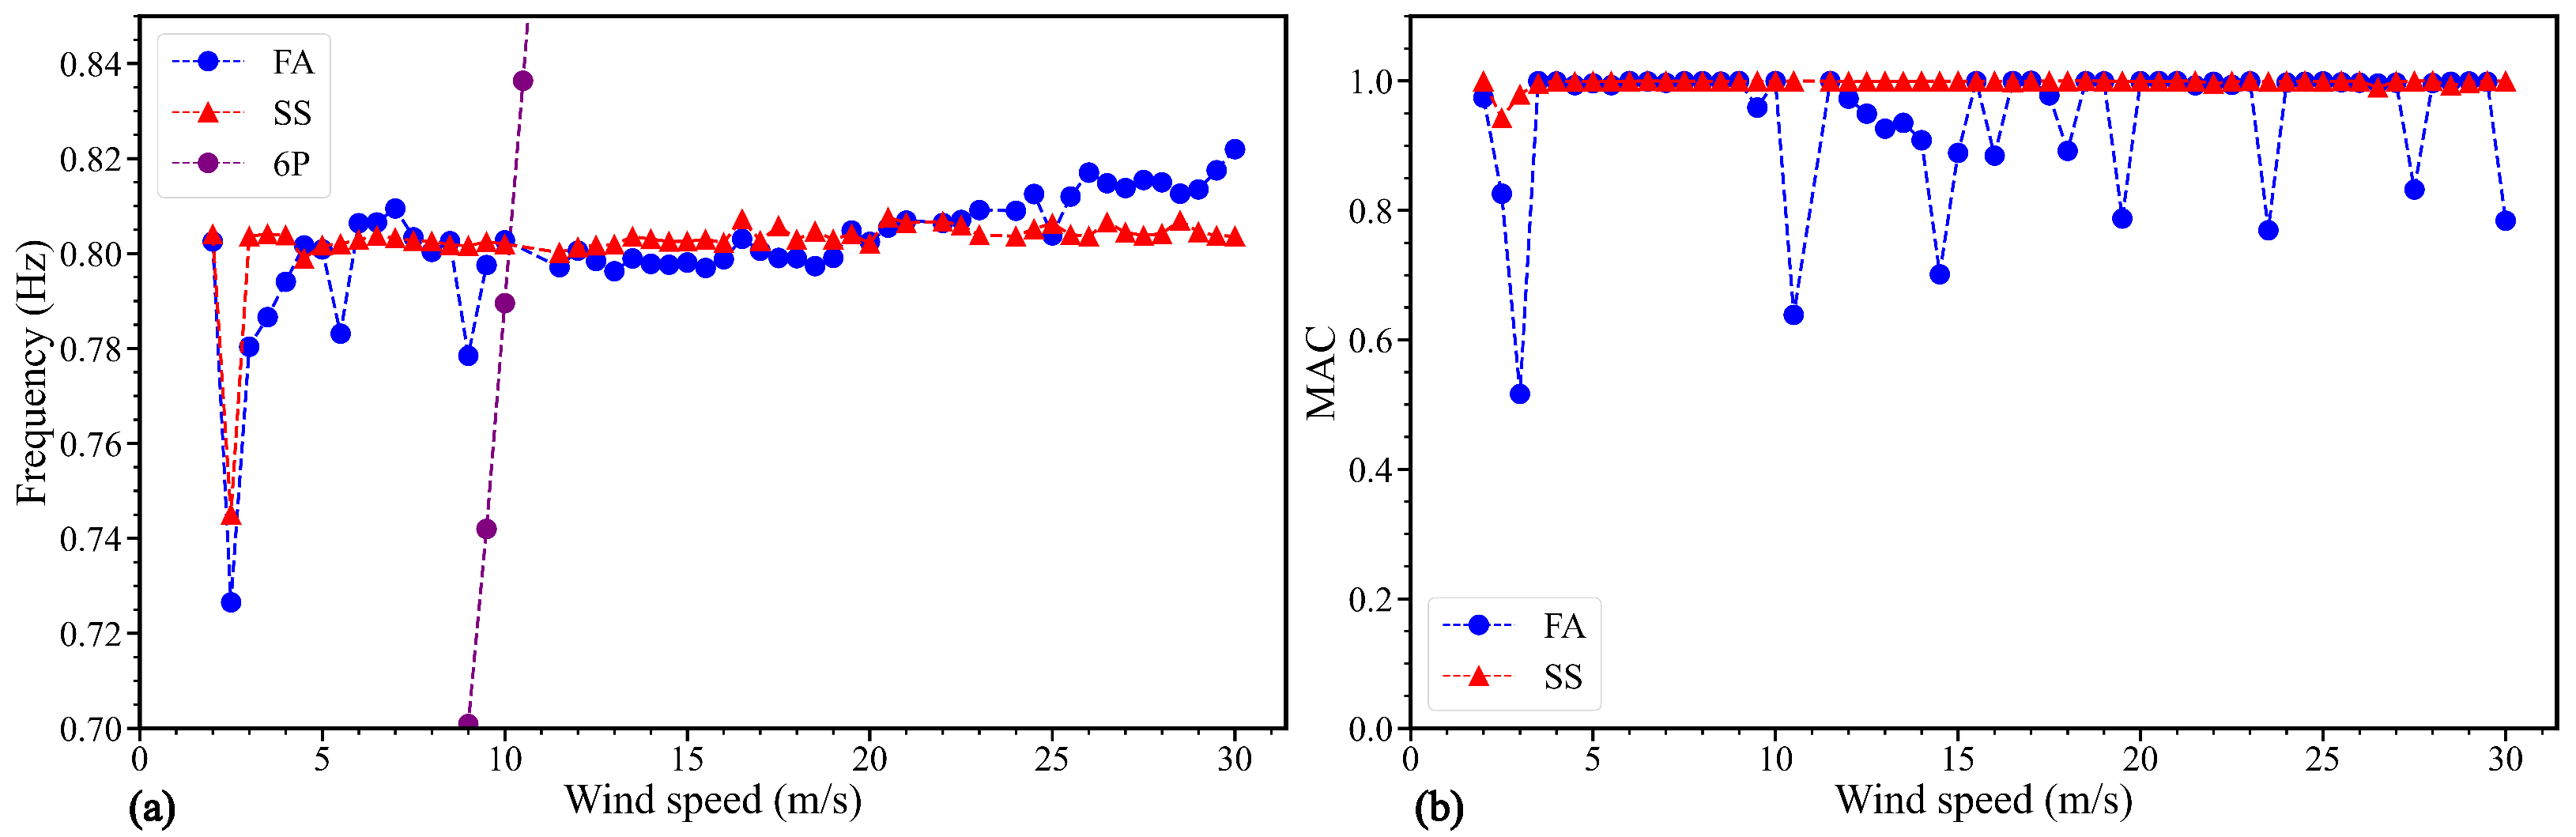
4.2.2. Second FA/SS Modes
4.3. Identification Under Combined Wind and Wave Excitation
4.3.1. First FA/SS Modes
4.3.2. Second FA/SS Modes
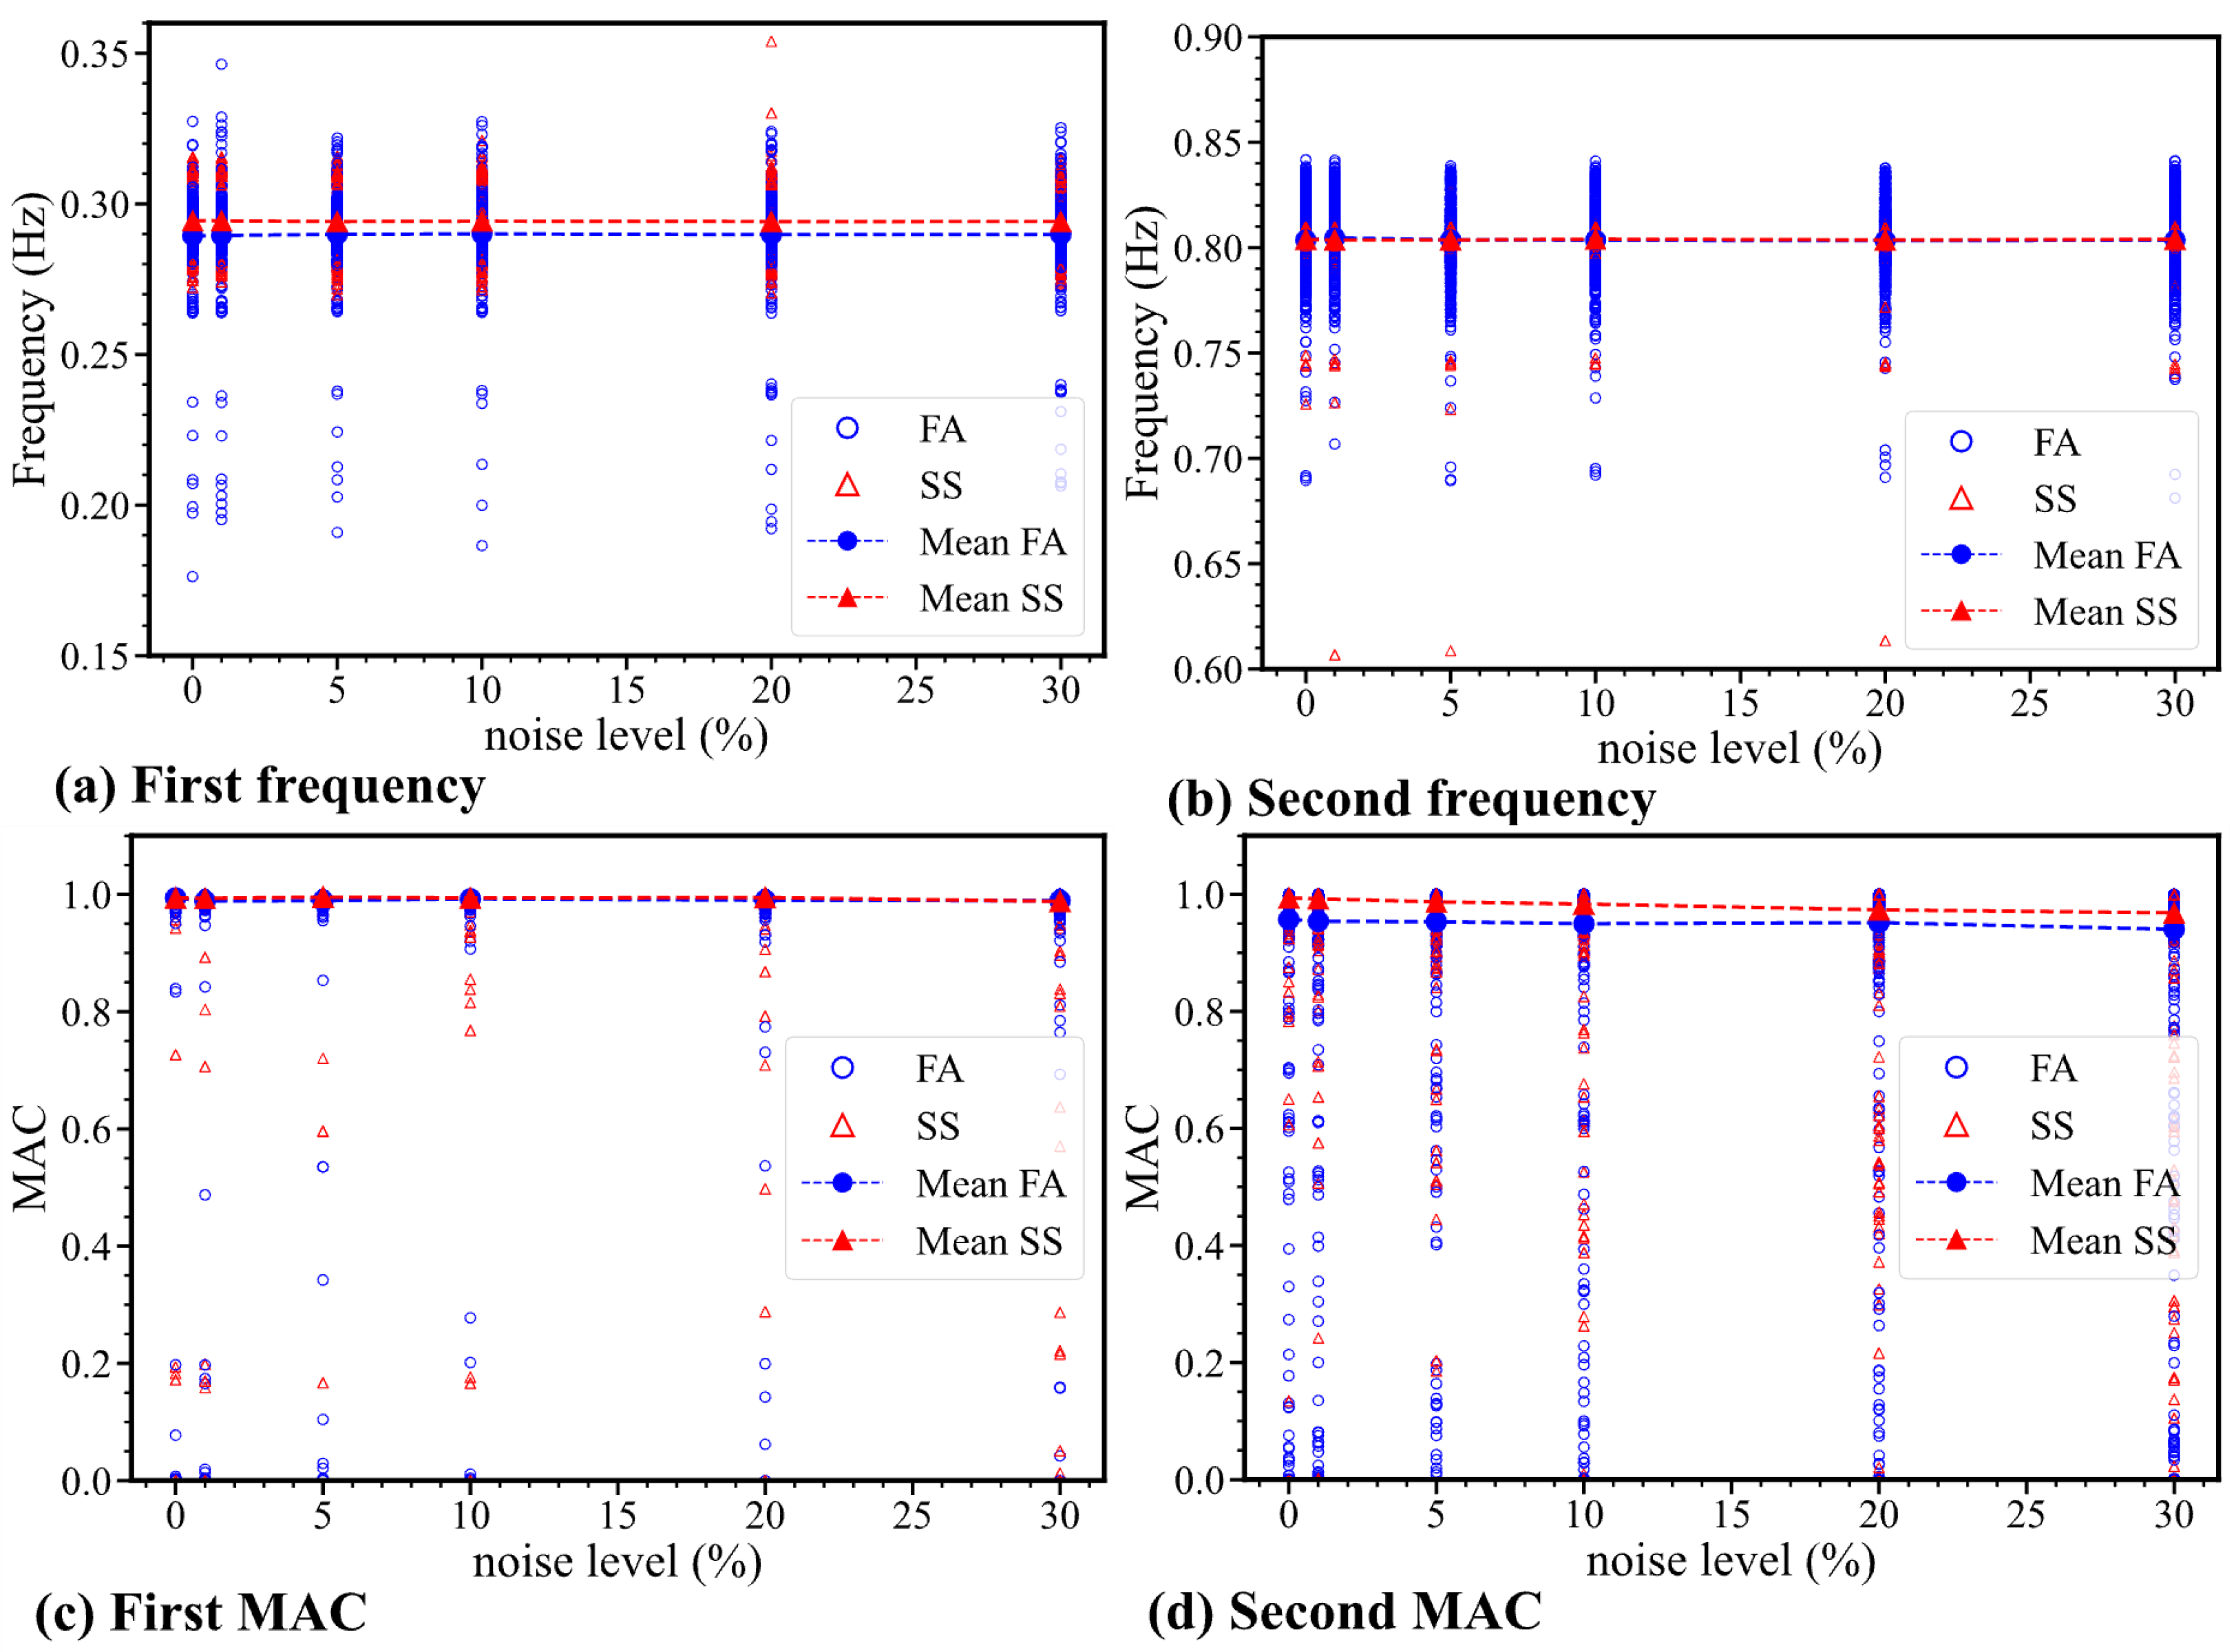
4.3.3. Effect of Signal Noise
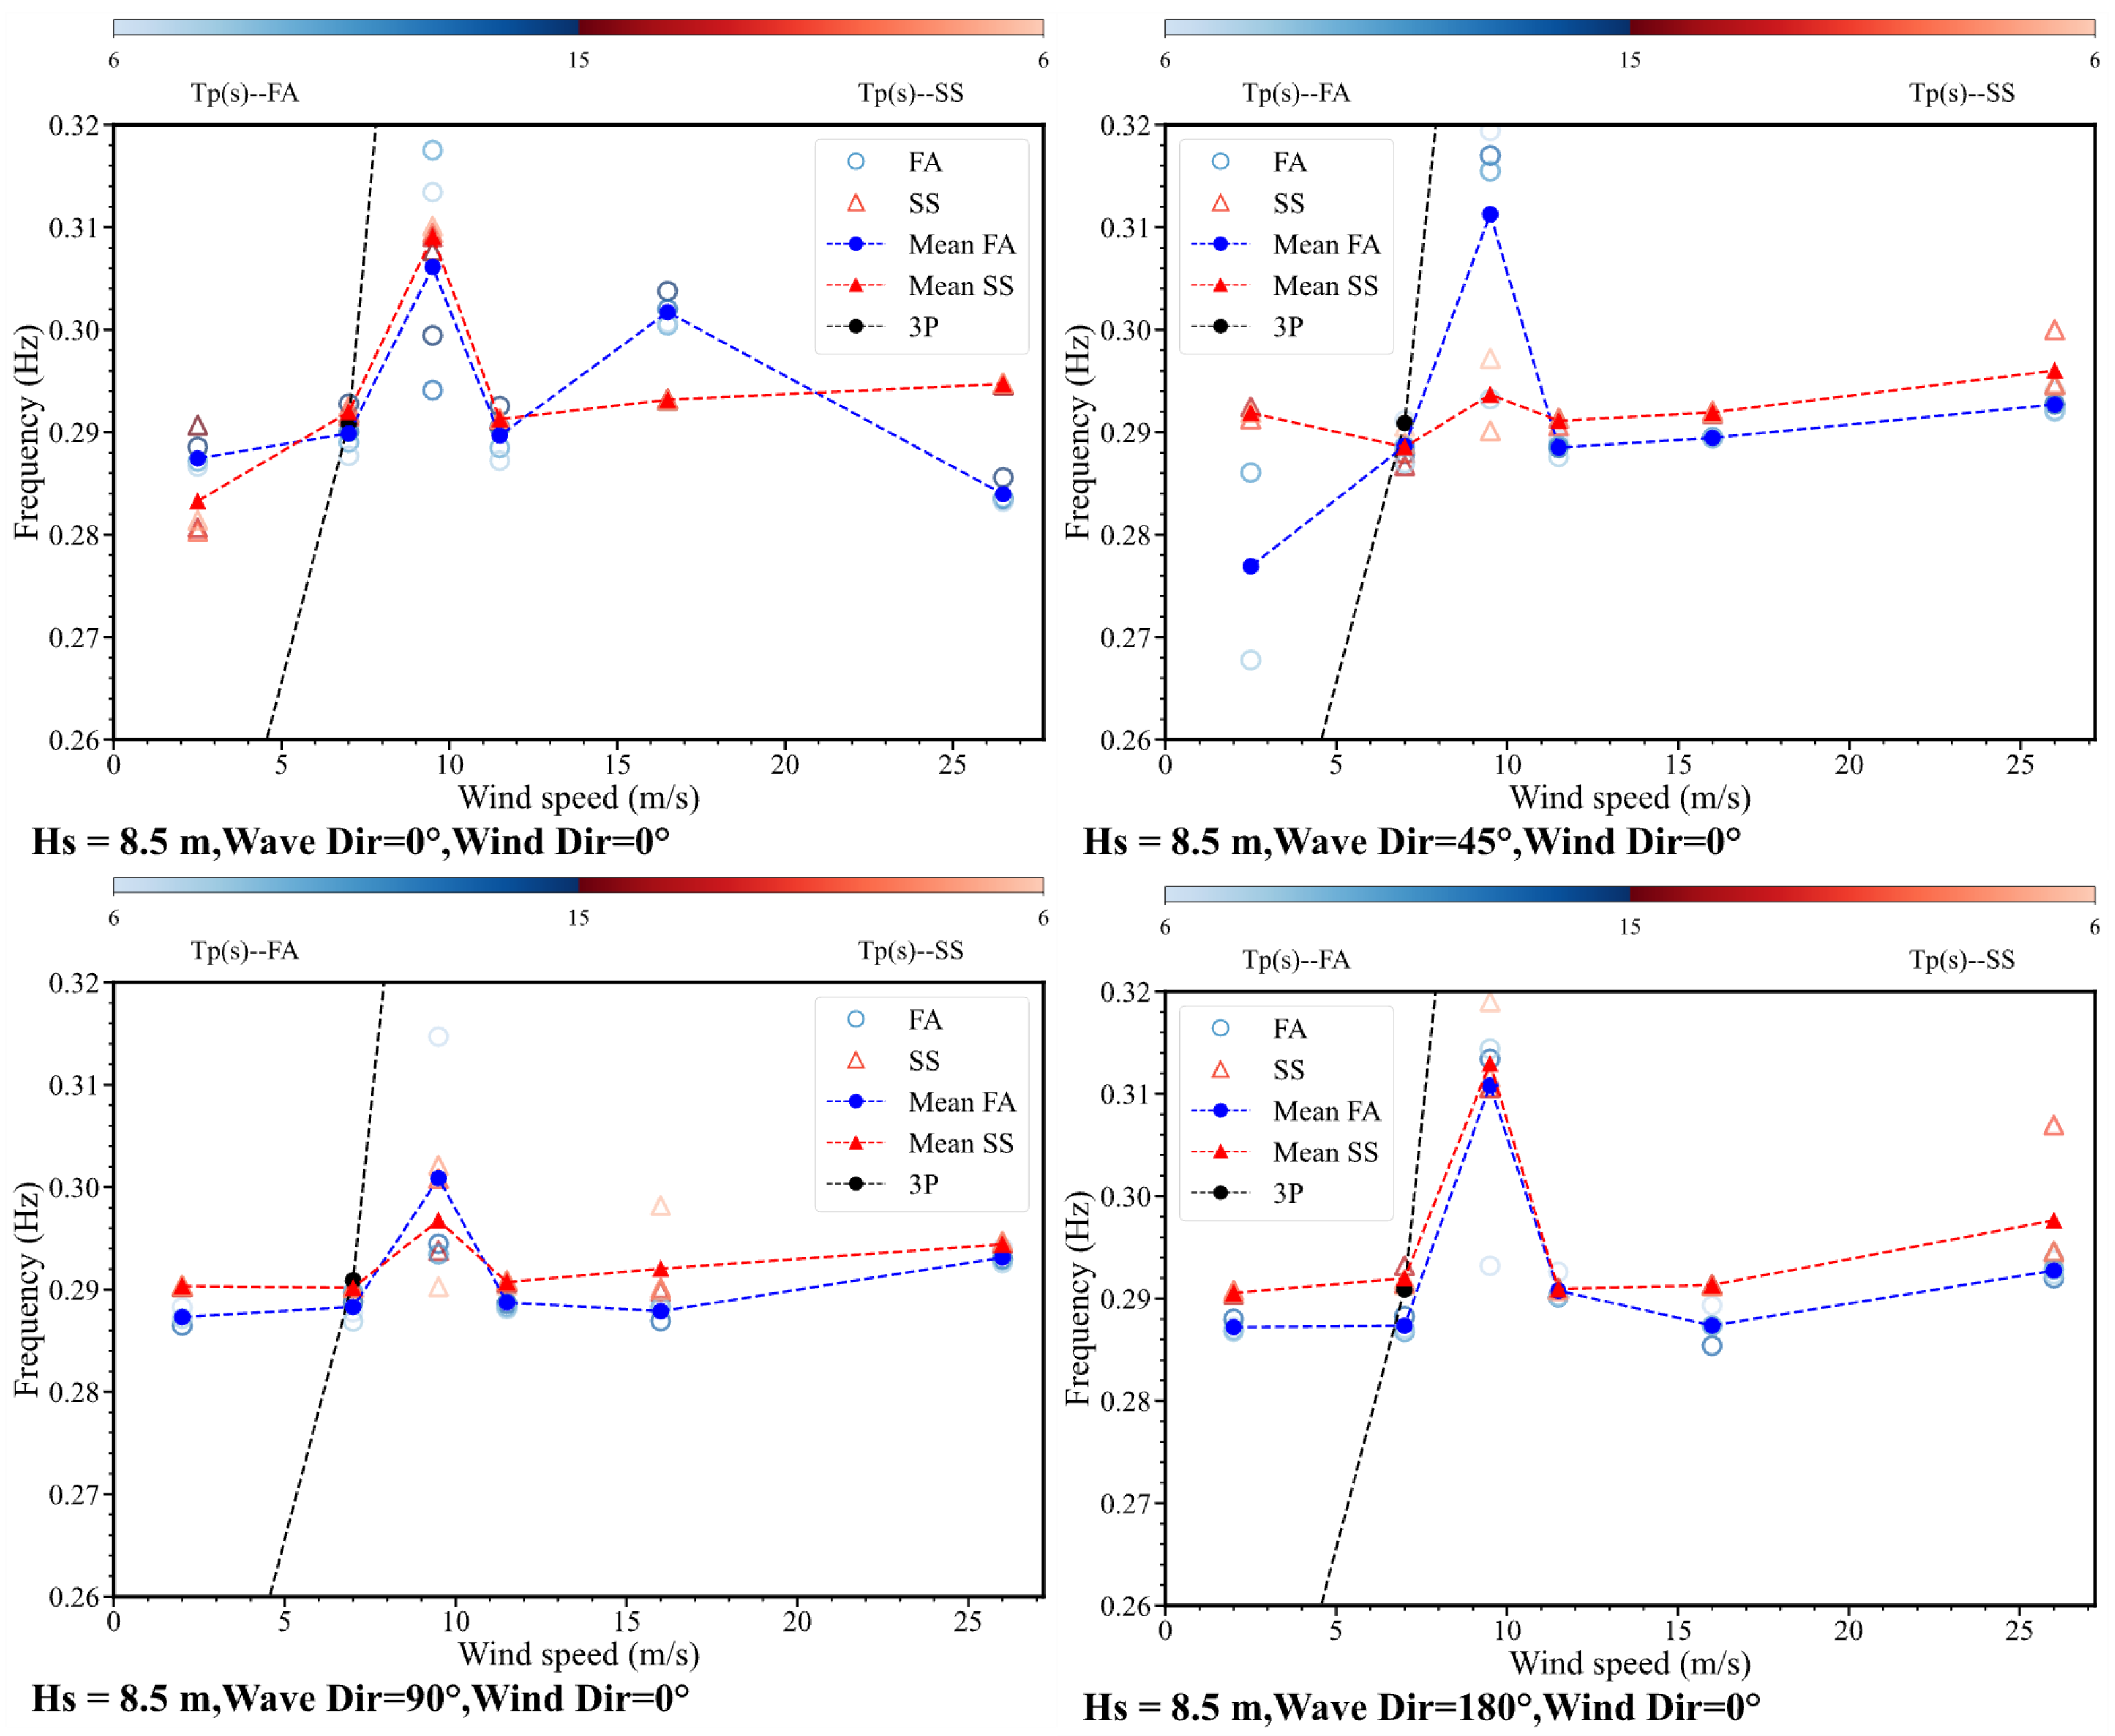
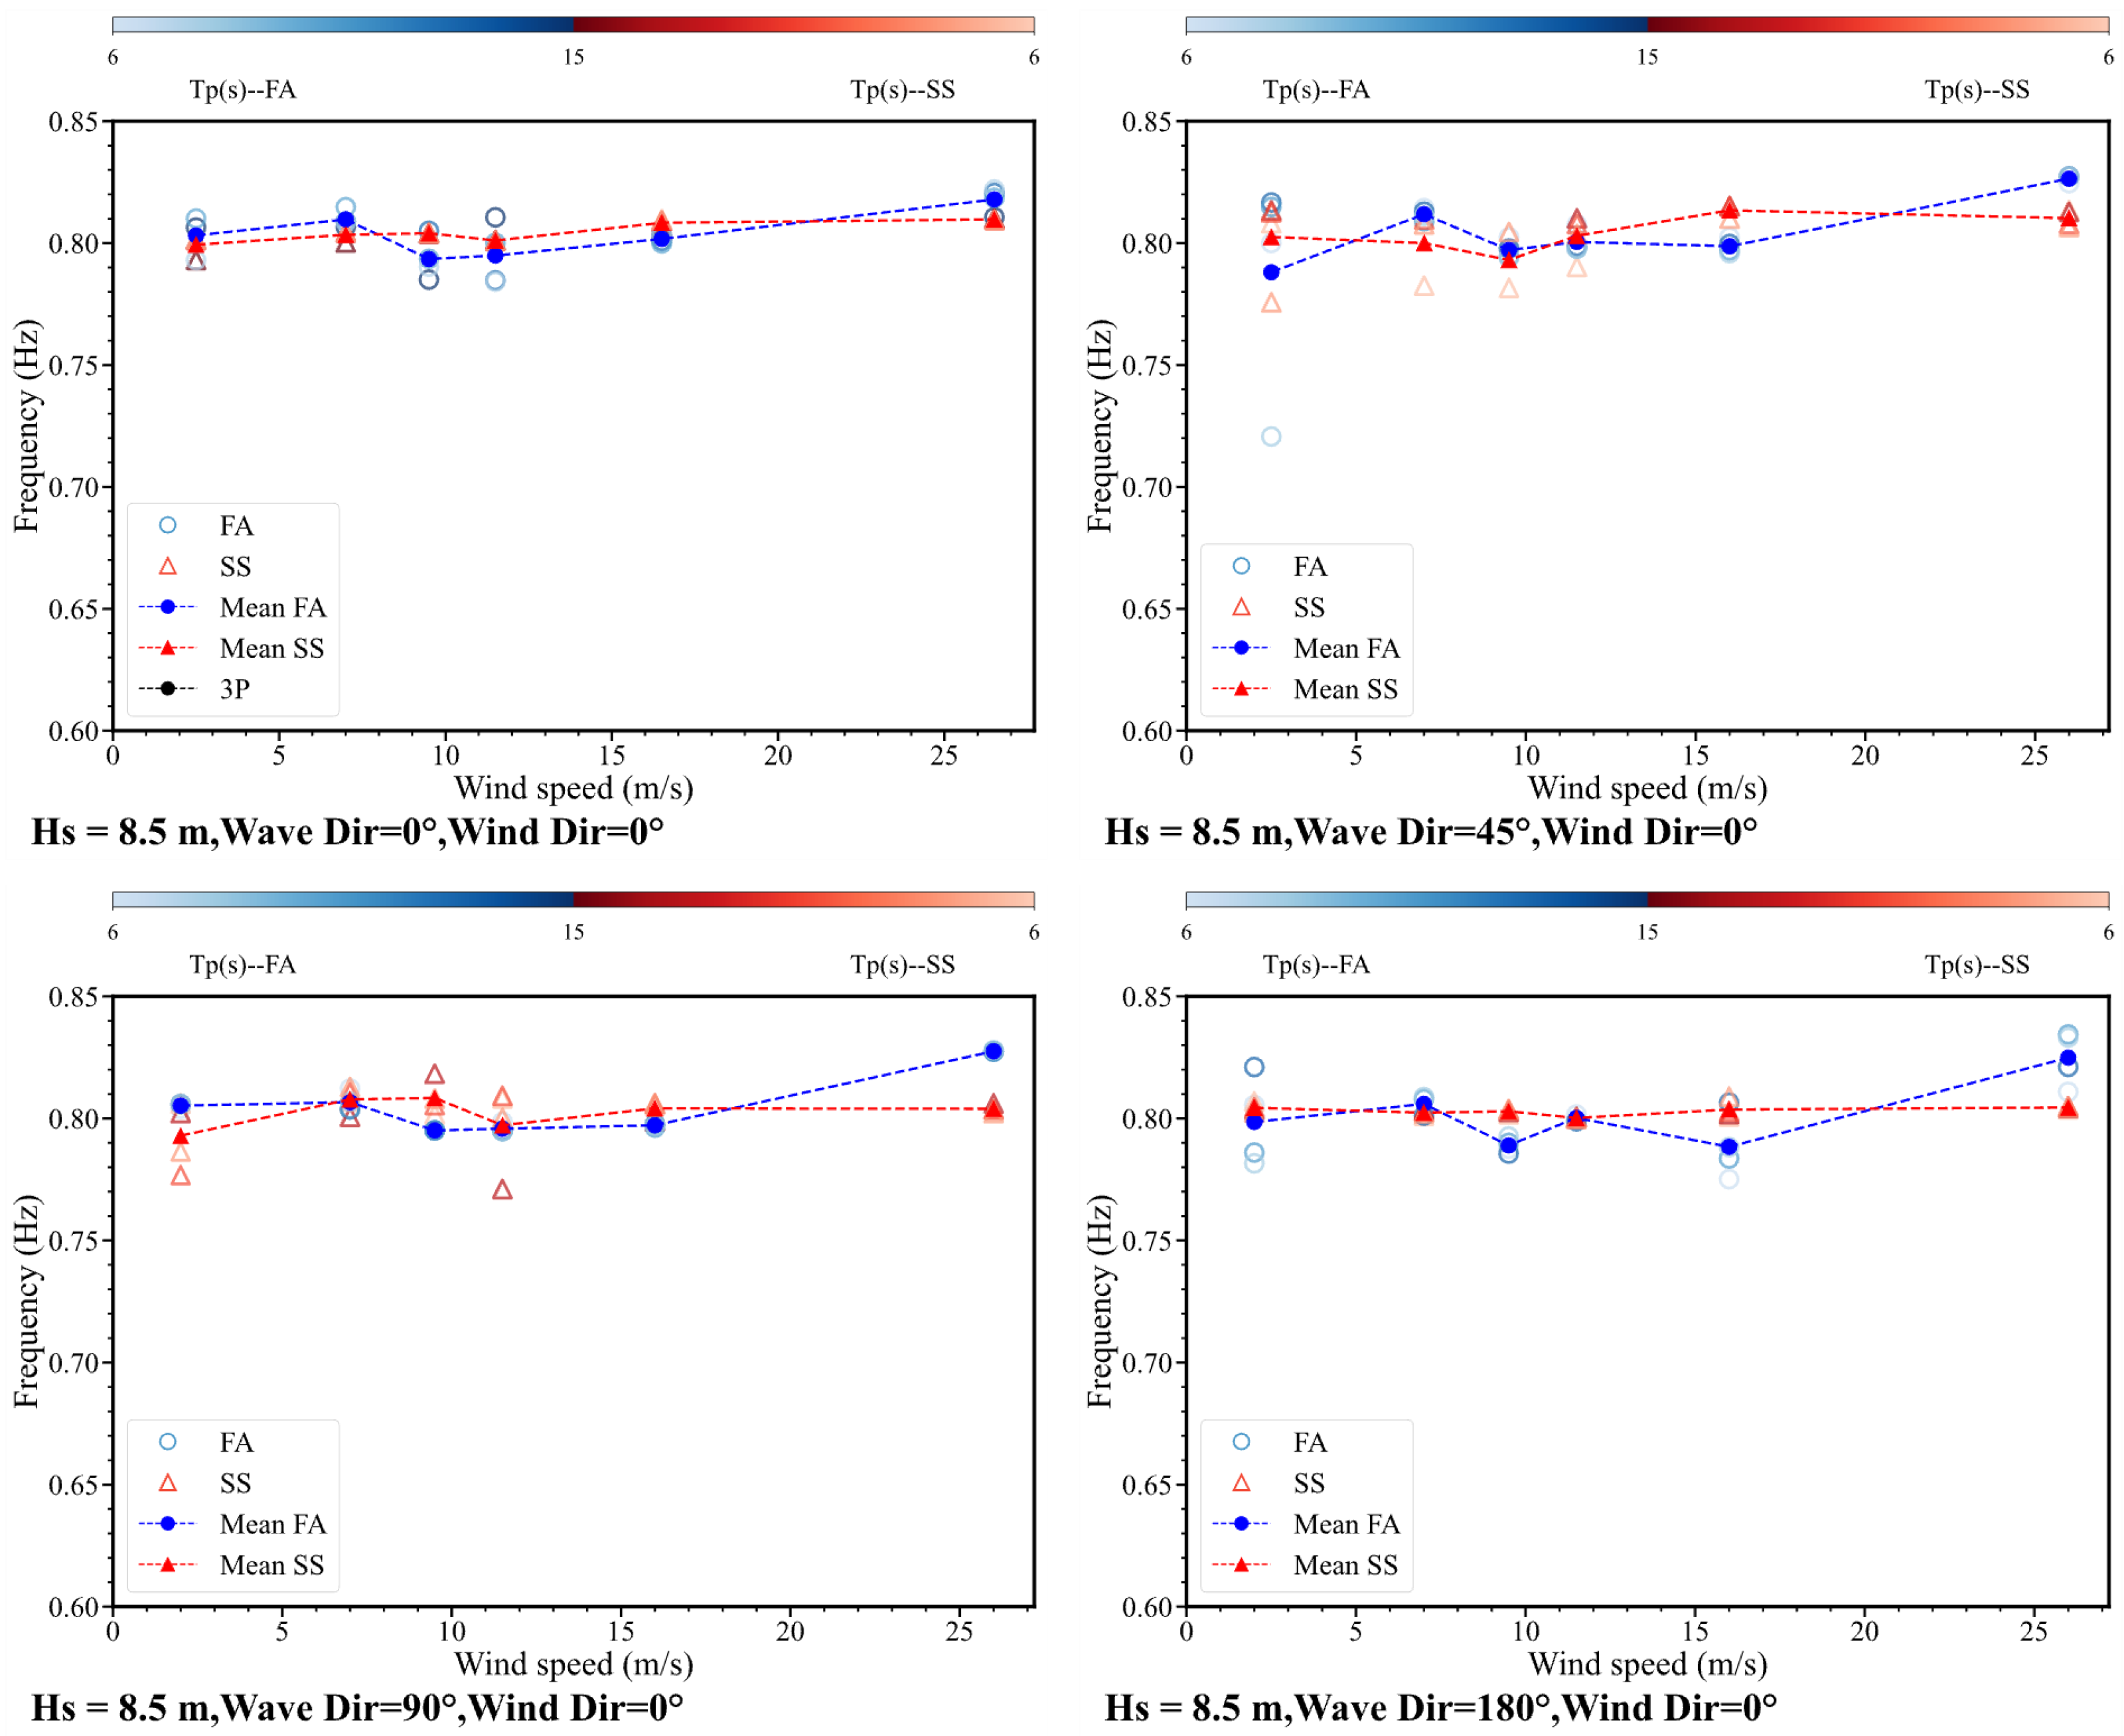
4.3.4. Effect of the Excitation Direction of the Wave and Wind
5. Modal Identification Based on Experimental Data
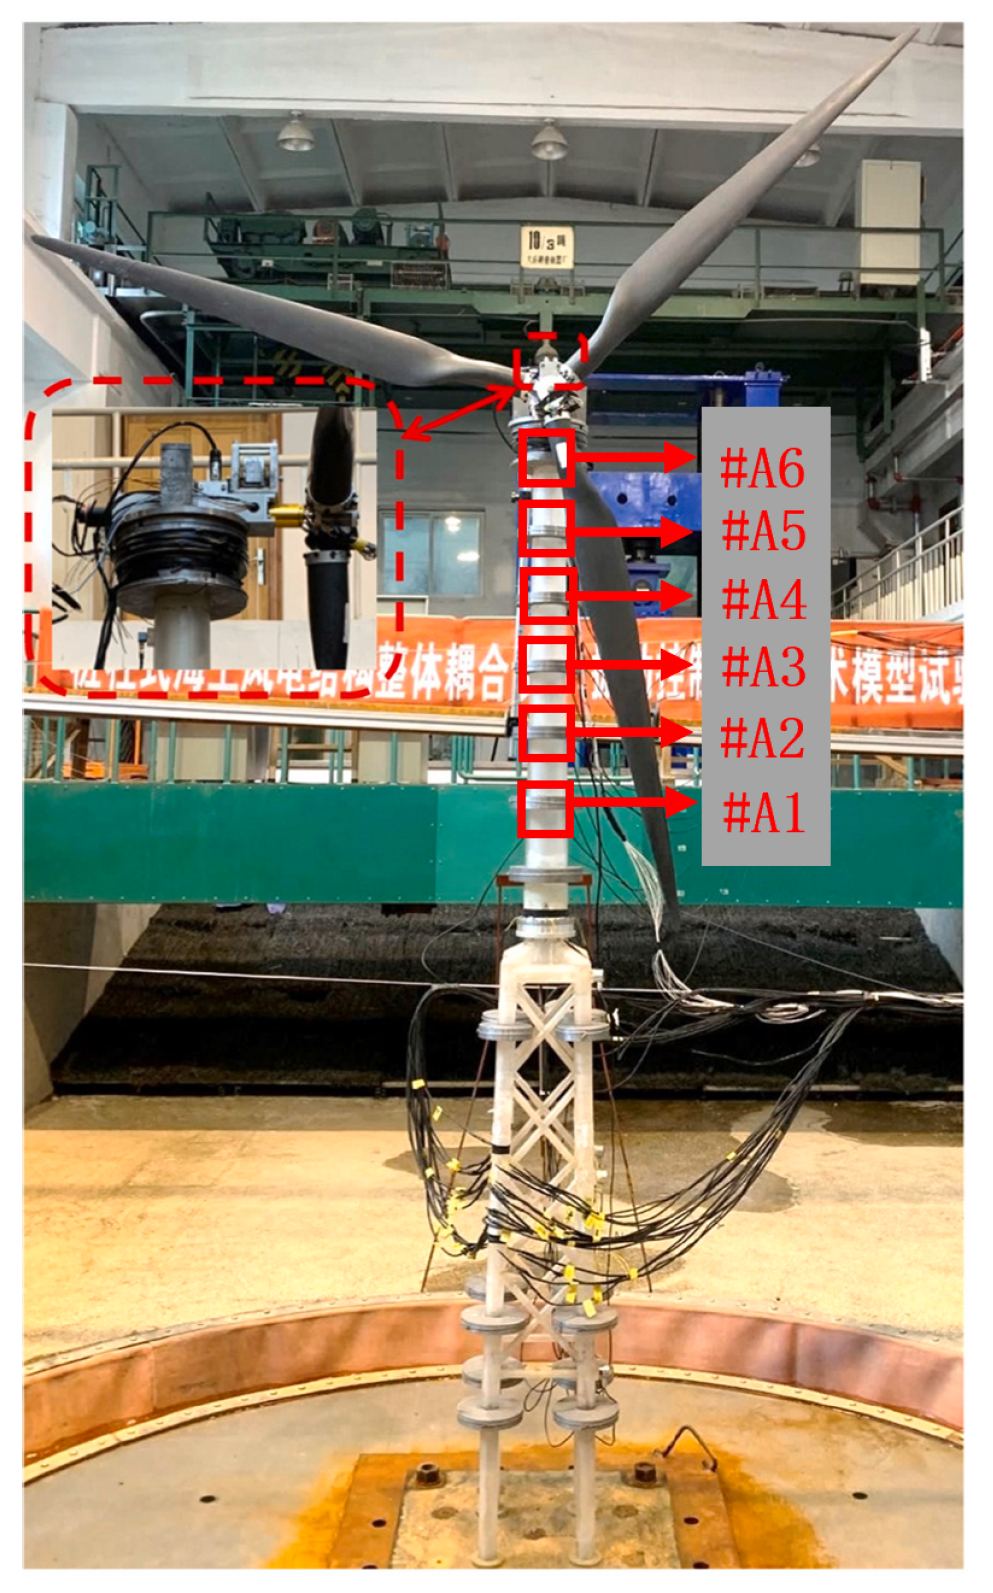
5.1. Description of the Scaled Model Test
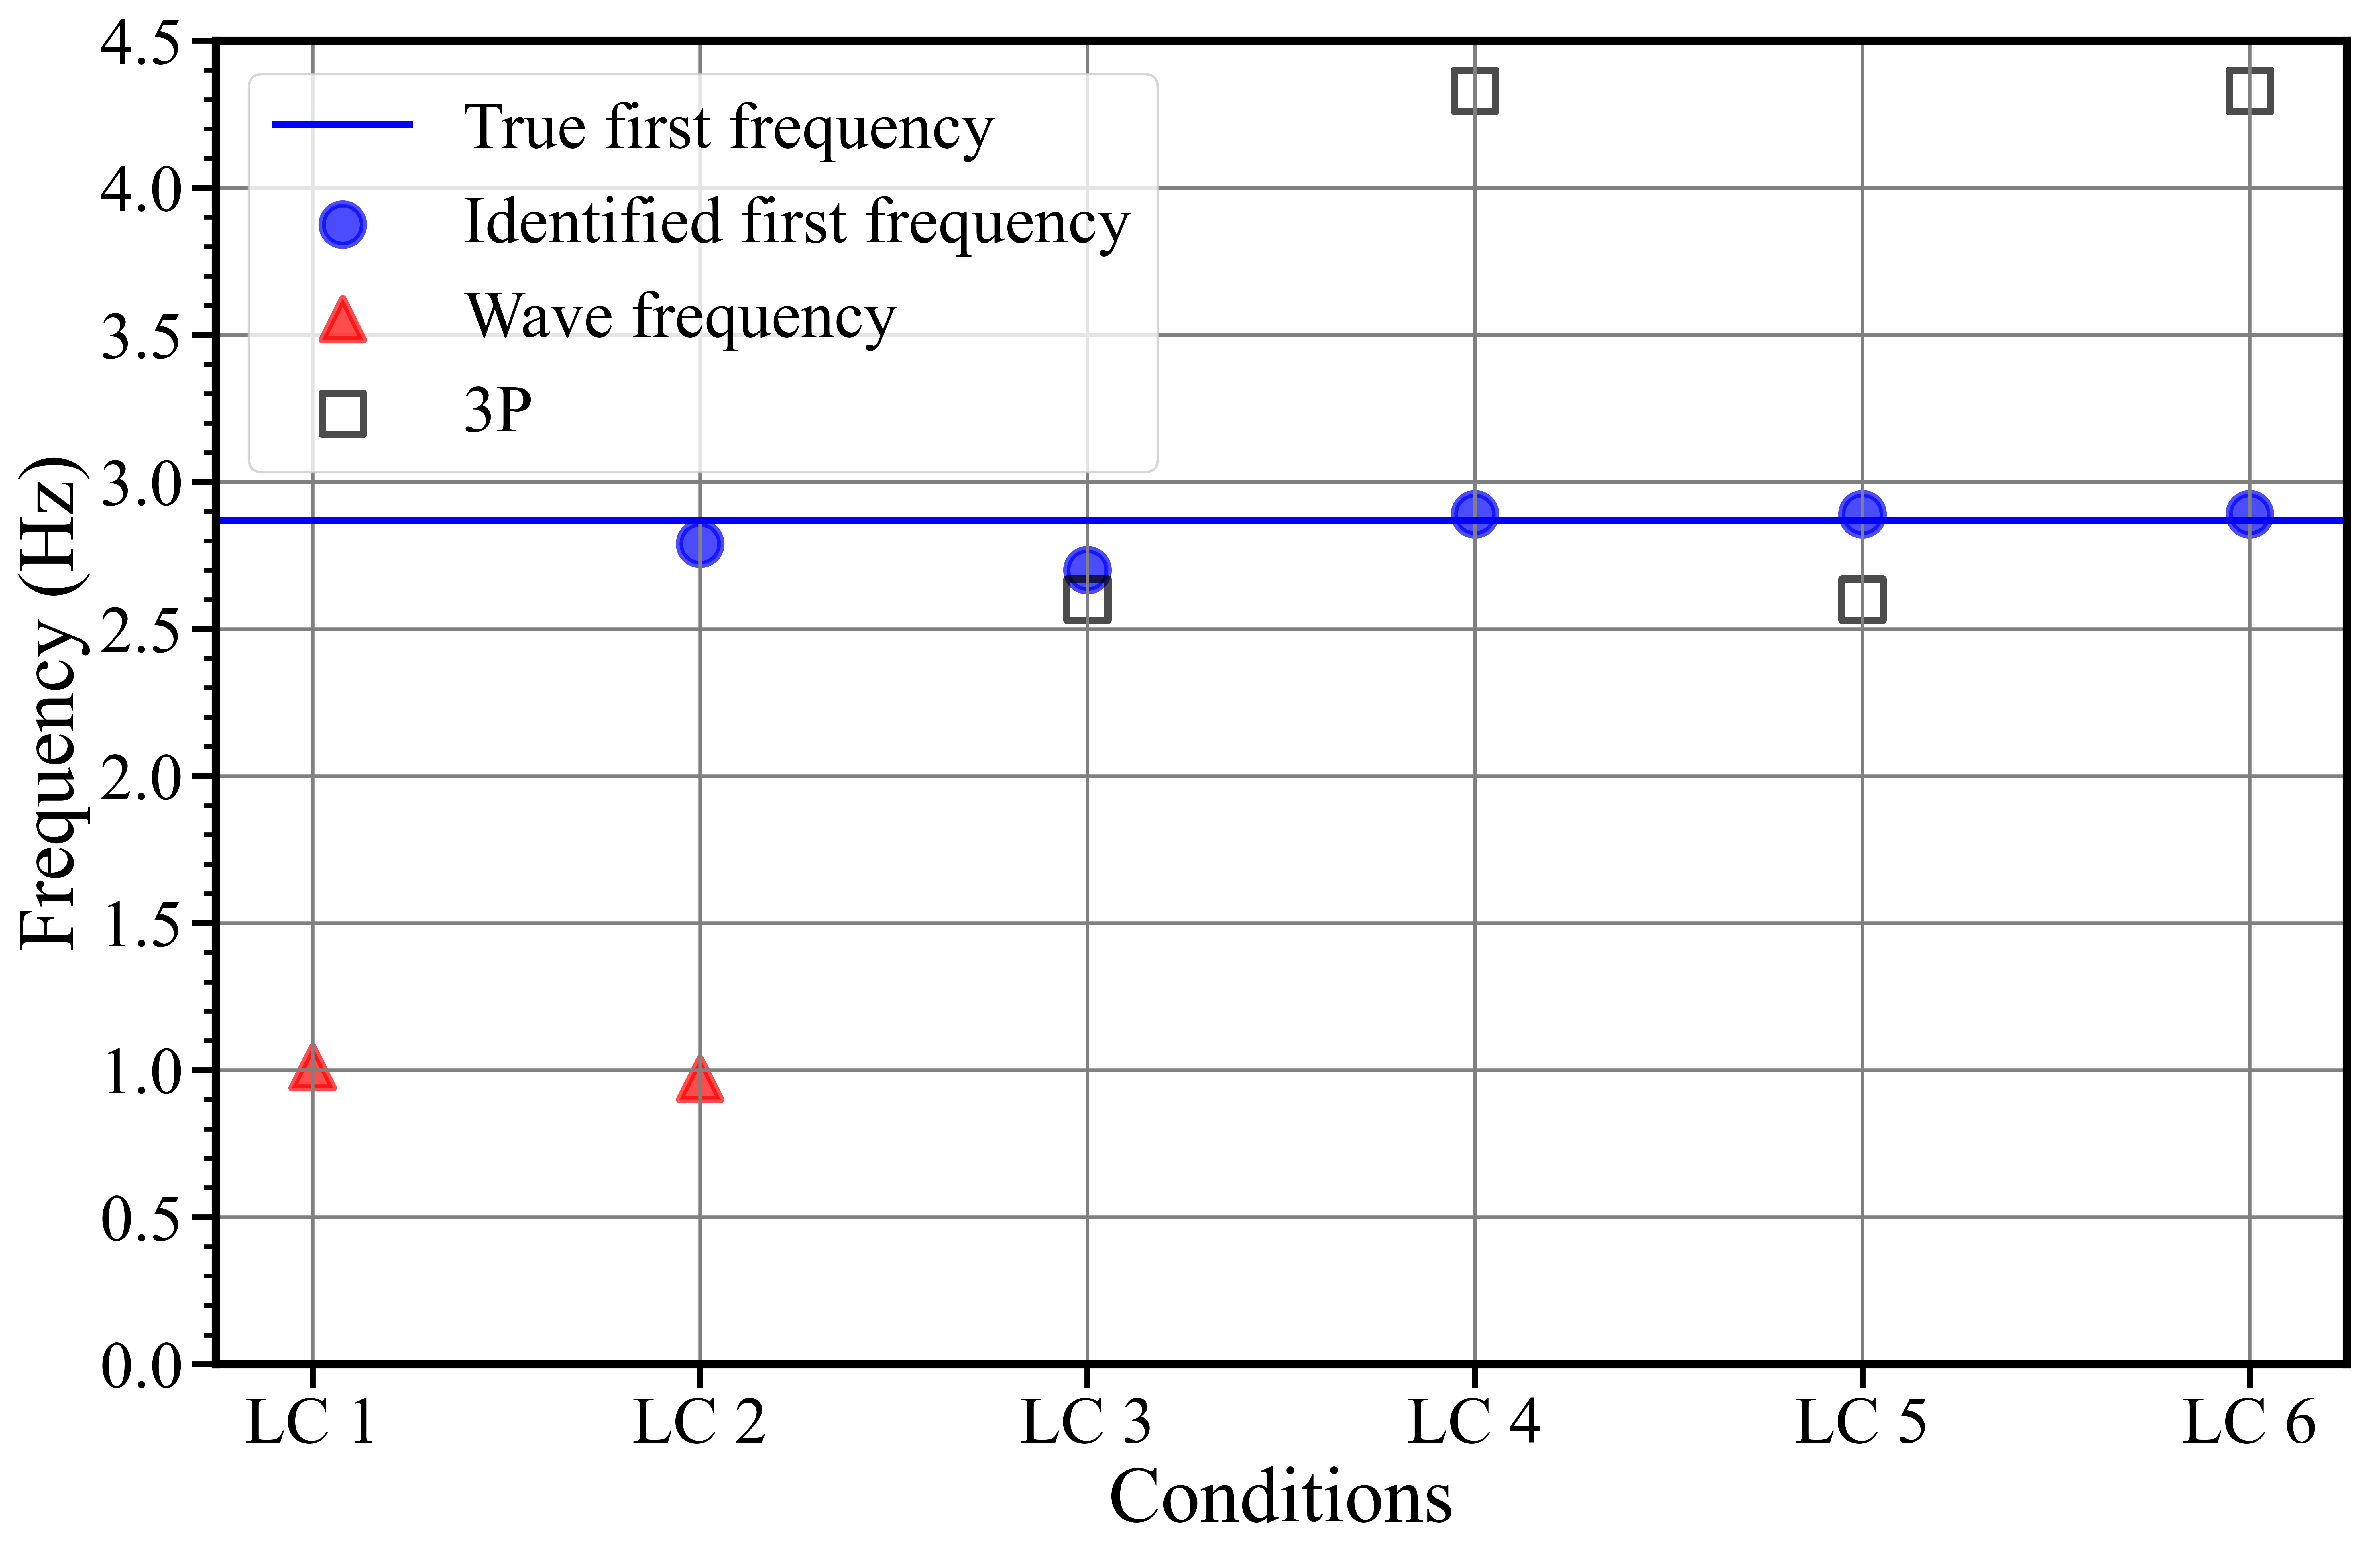
5.2. Modal Parameter Identification Results for the Scaled Test
6. Conclusions
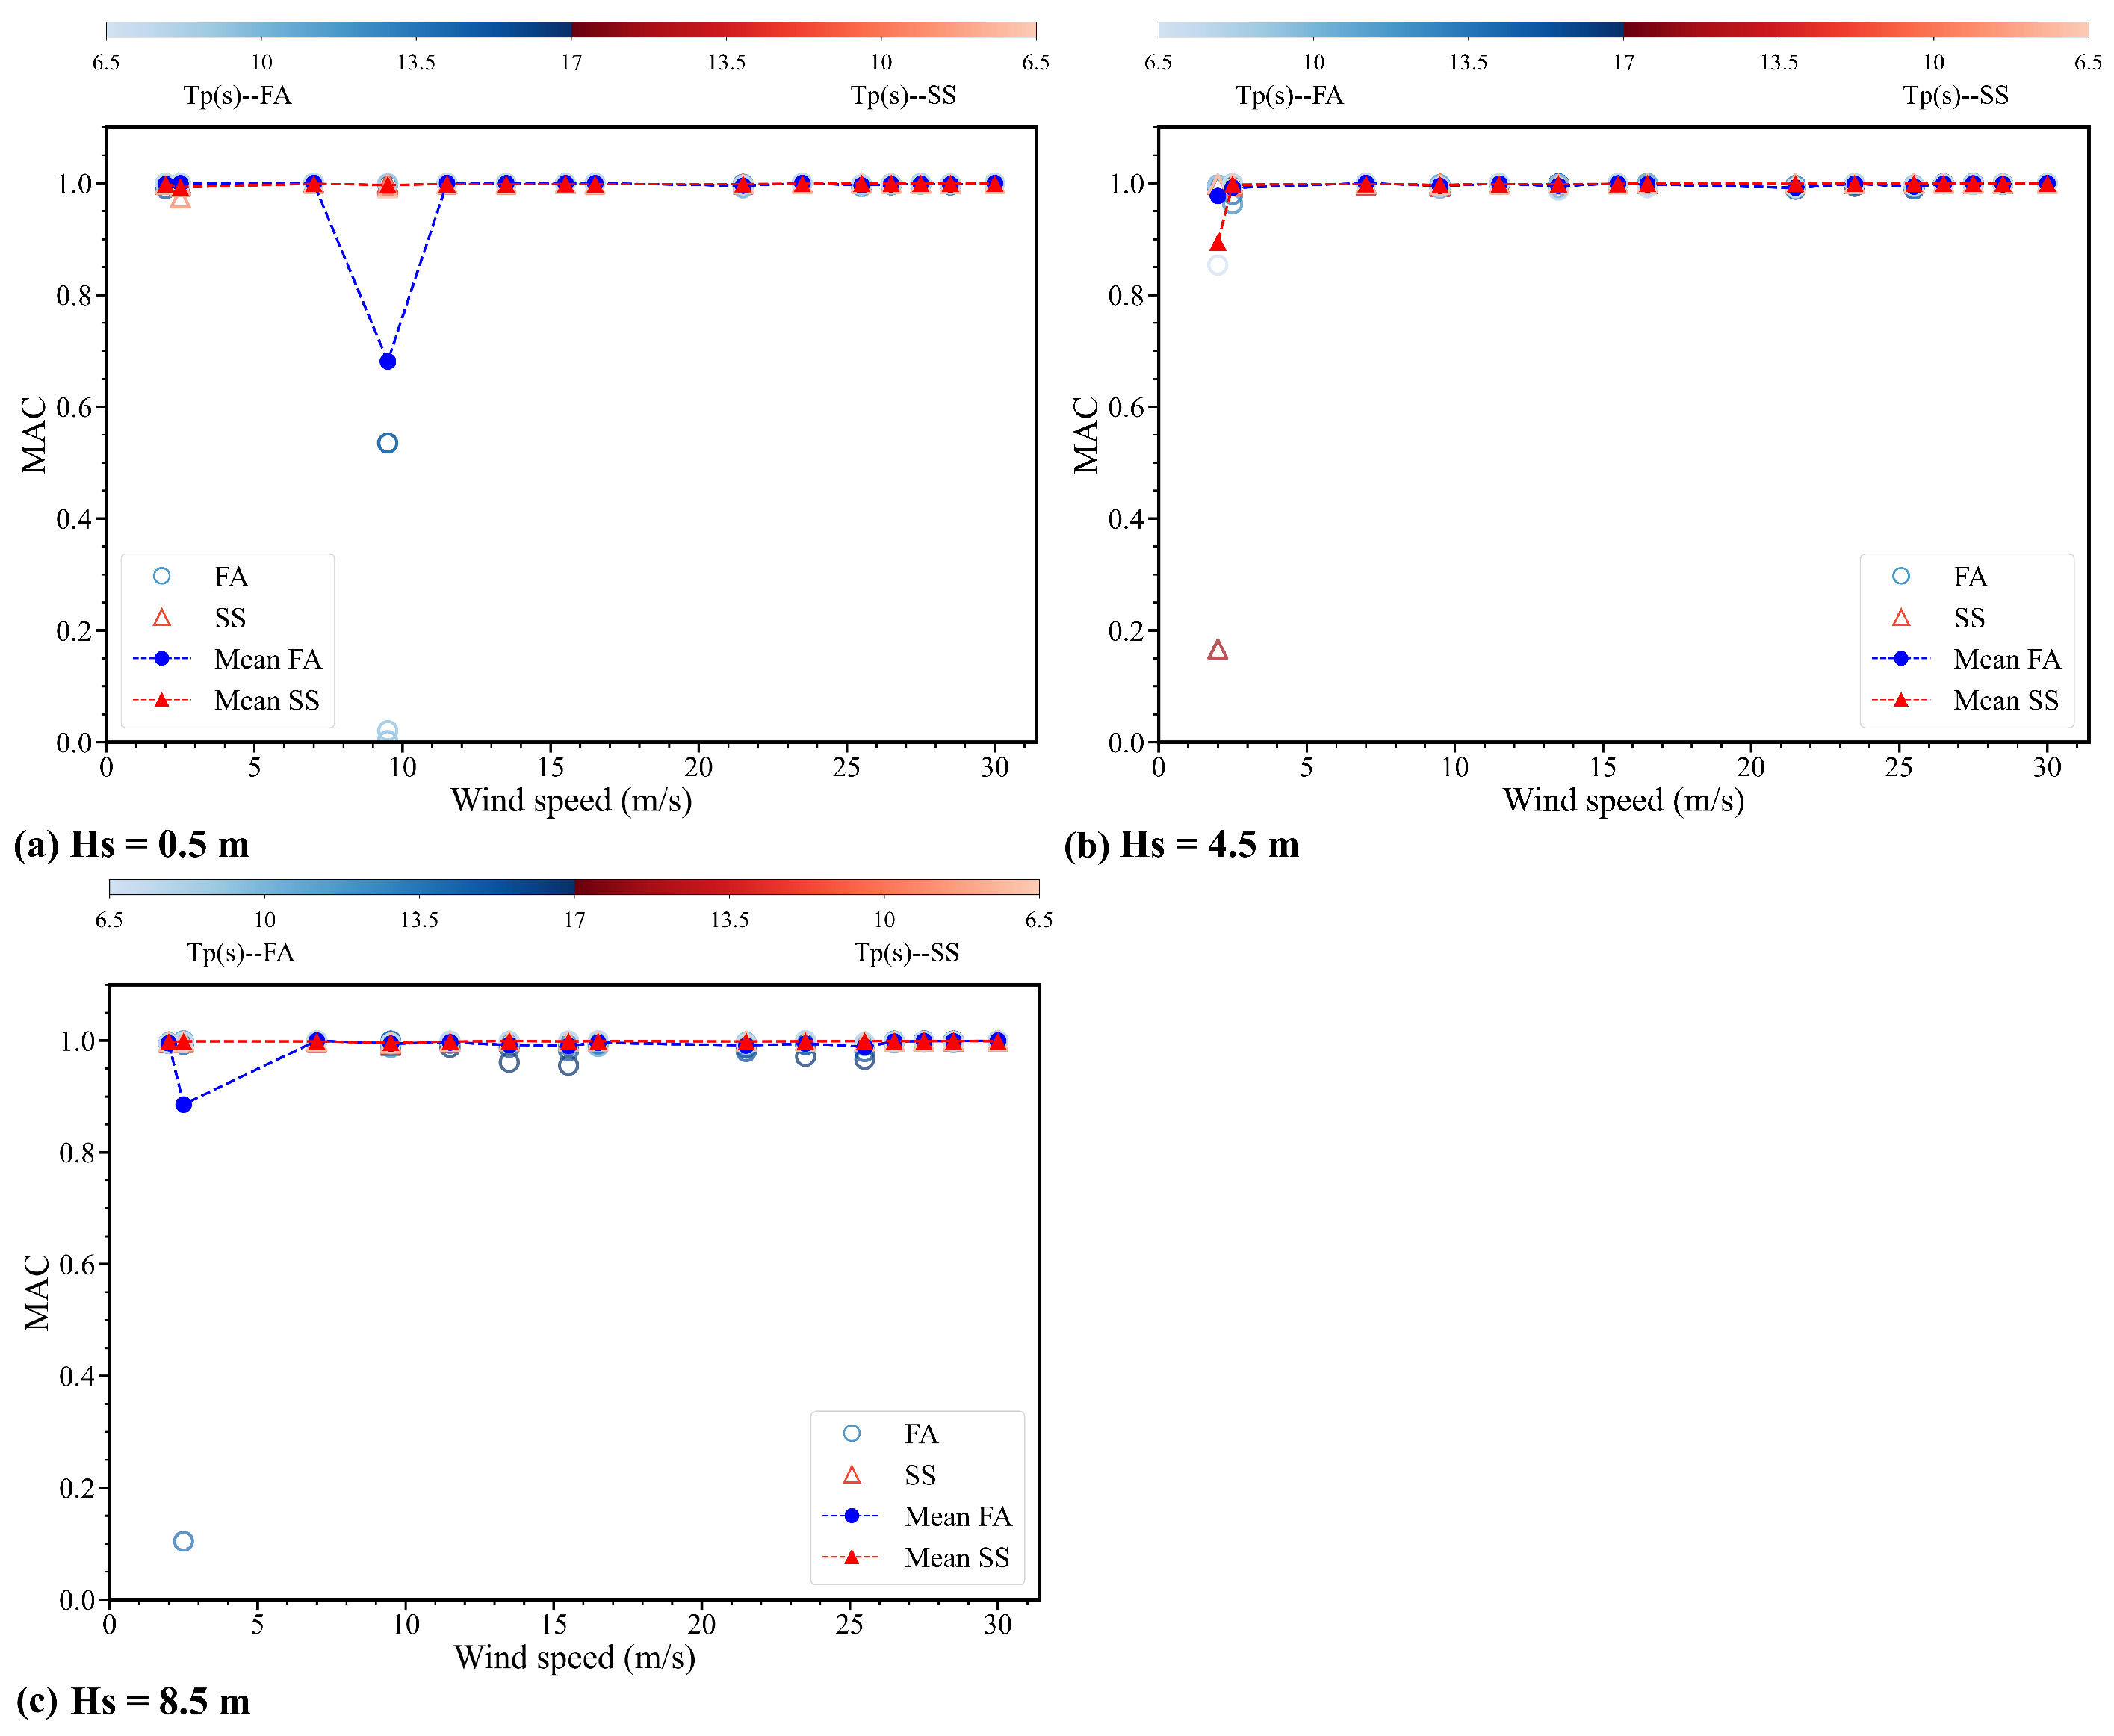
- The first two modal parameters of the OWT structure can be accurately obtained in the majority of irregular wave conditions, except for the cases with very small Hs. Only irregular wave excitation has limited influence on the identification accuracy but requires a sufficiently strong energy.
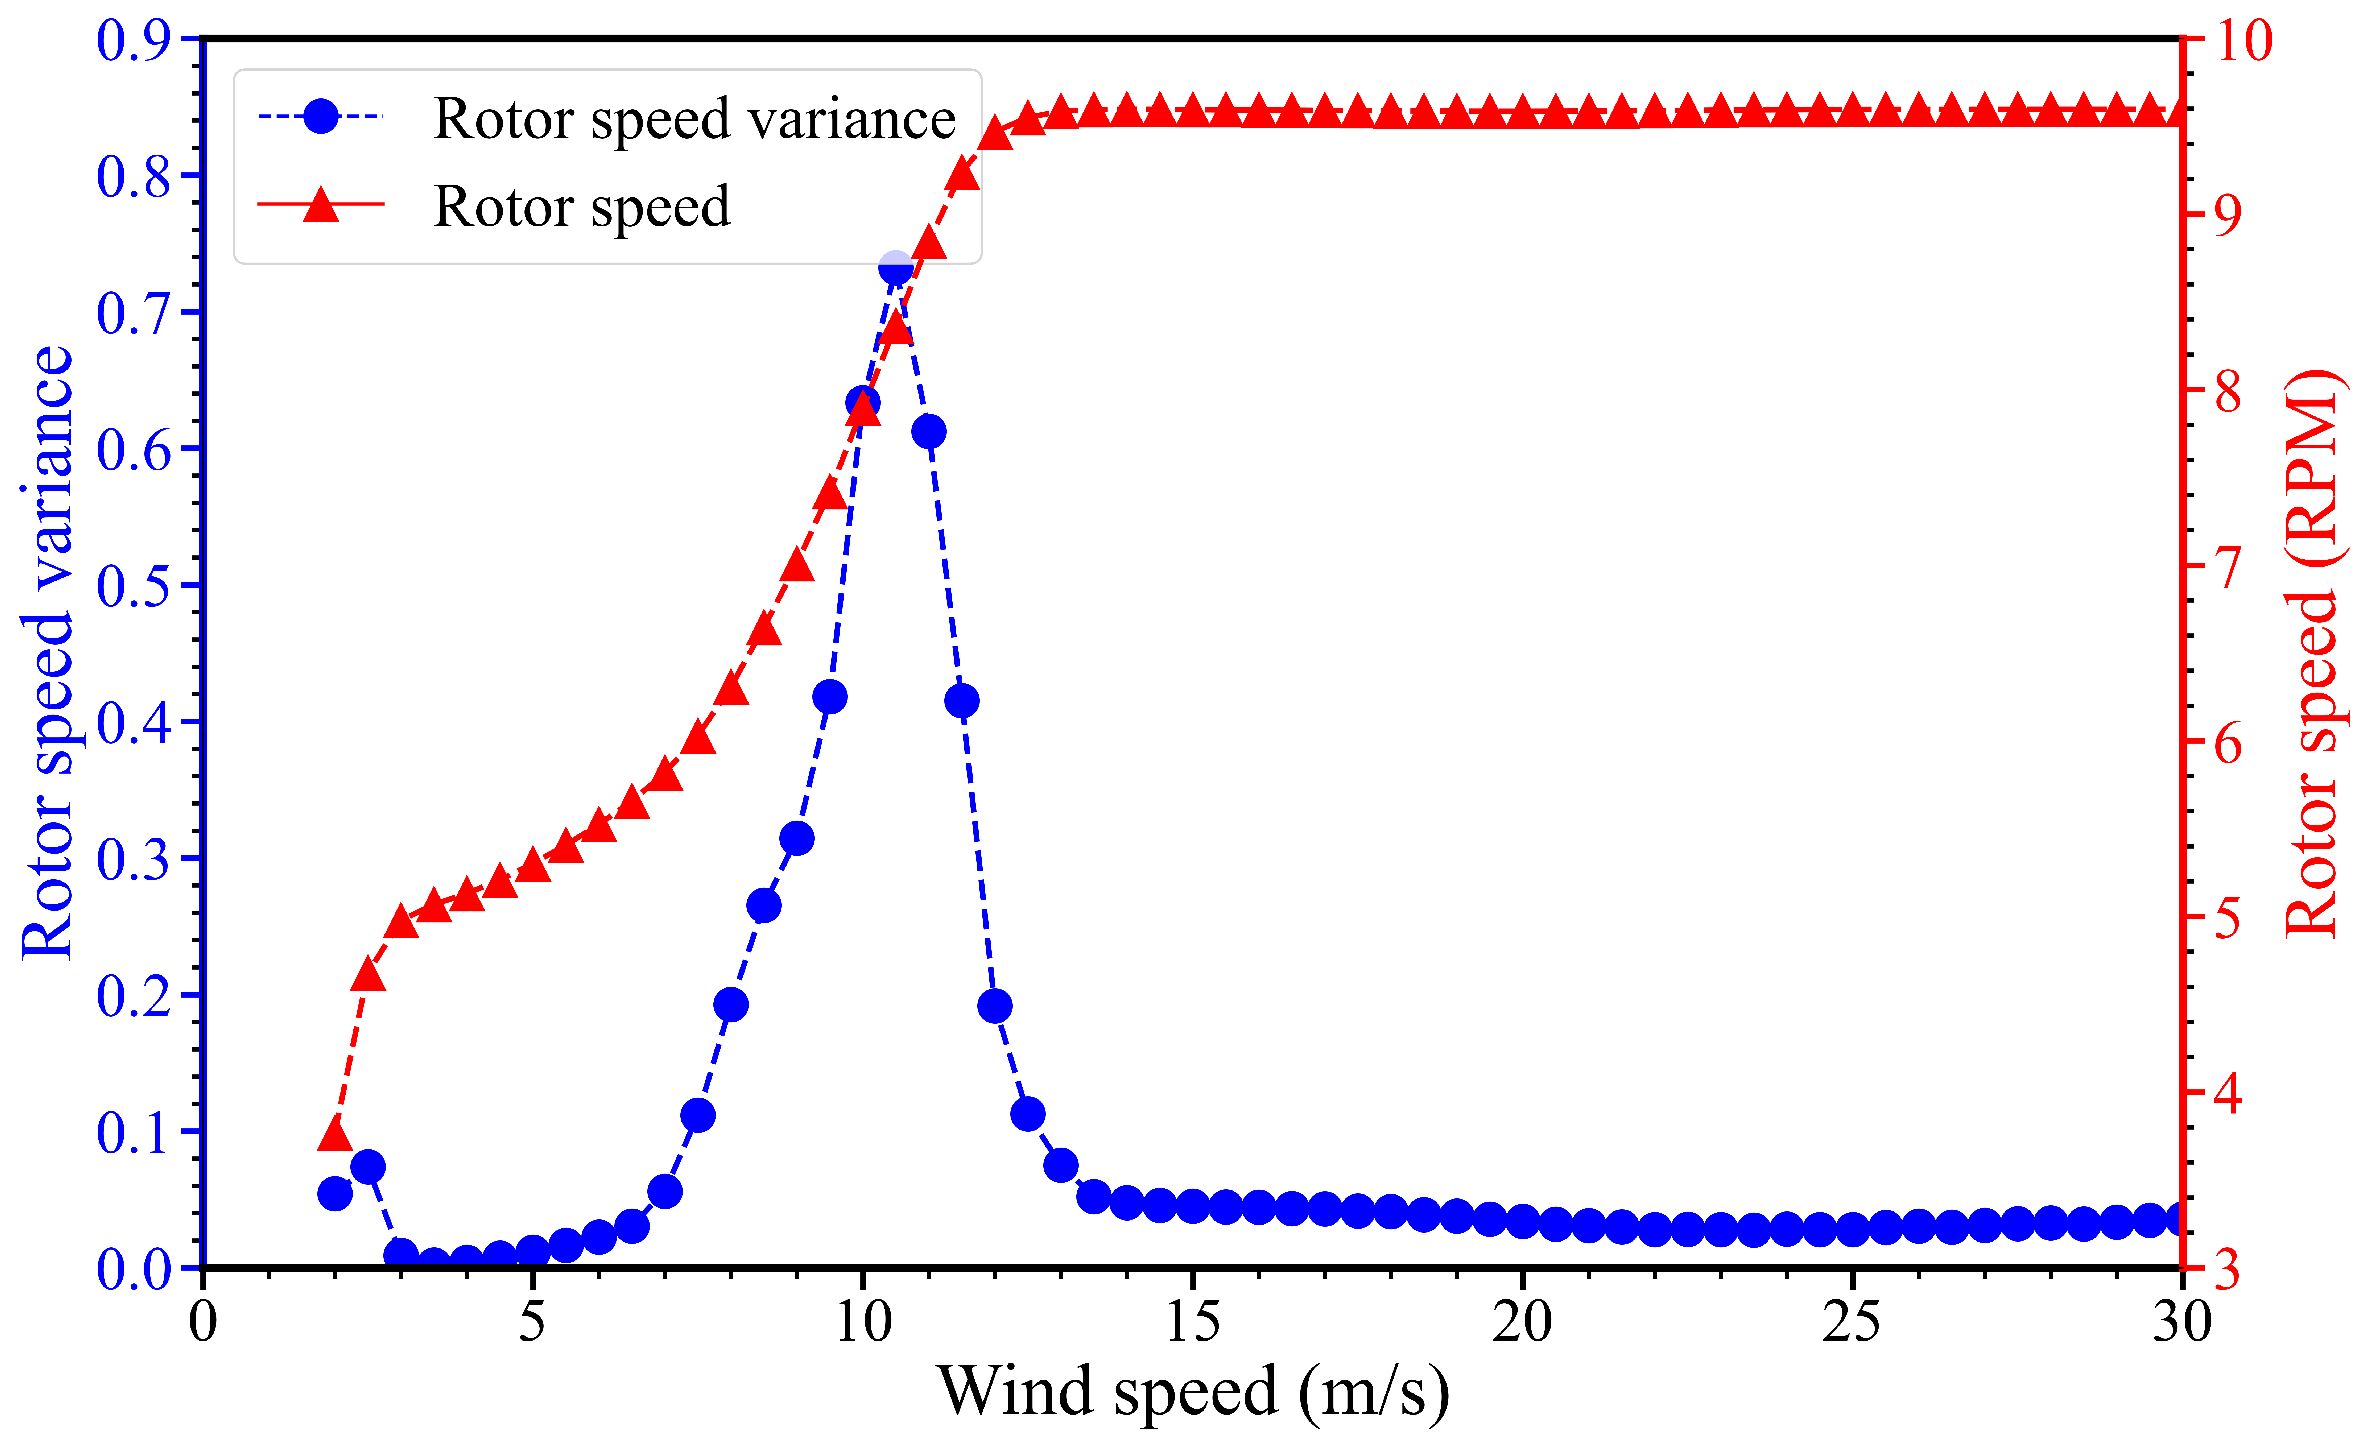
- Under gust wind conditions with different turbulence, the method performs well when wind speeds exceed the rated speed of 11.4 m/s. The 3P or 6P harmonic is between the first and second frequencies, which interfere with the identification results during the automatic identification process. But those 3P and 6P frequencies can be easily eliminated as they are known values. For wind speed near the rated value, the identification accuracy was highly affected due to the significant nonstationary effect, with the identified error reaching up to about 7%.
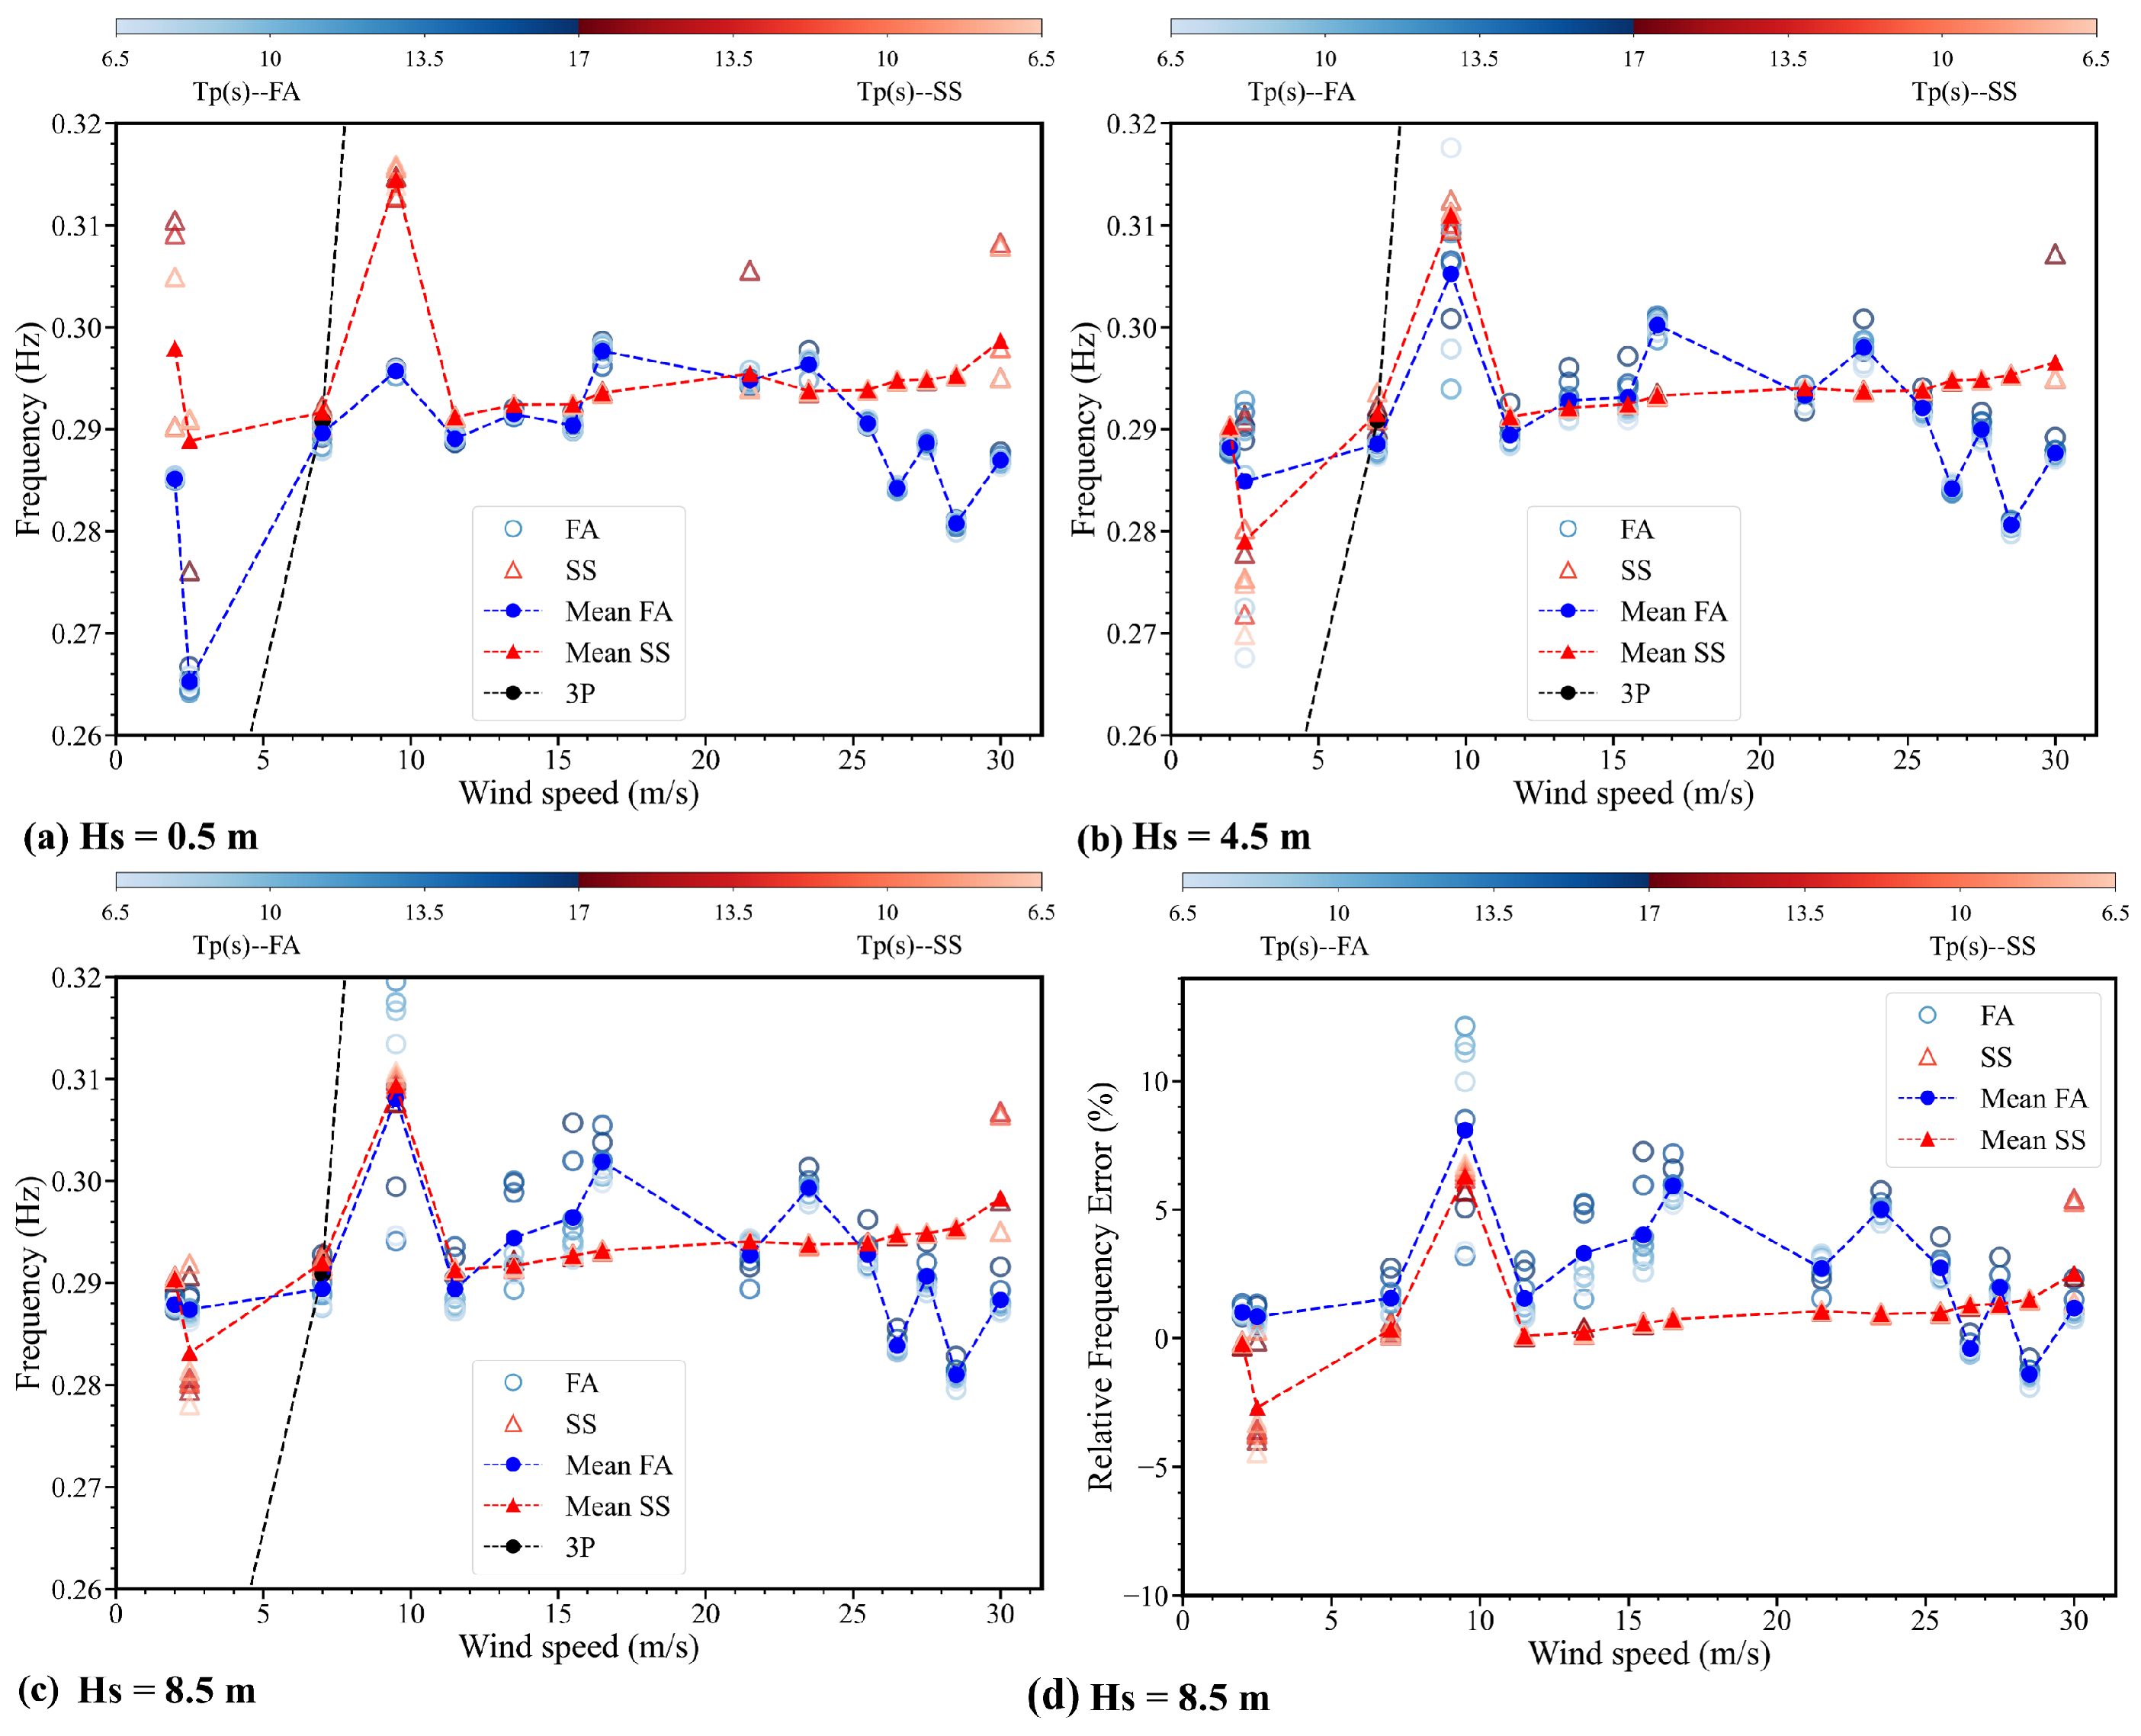
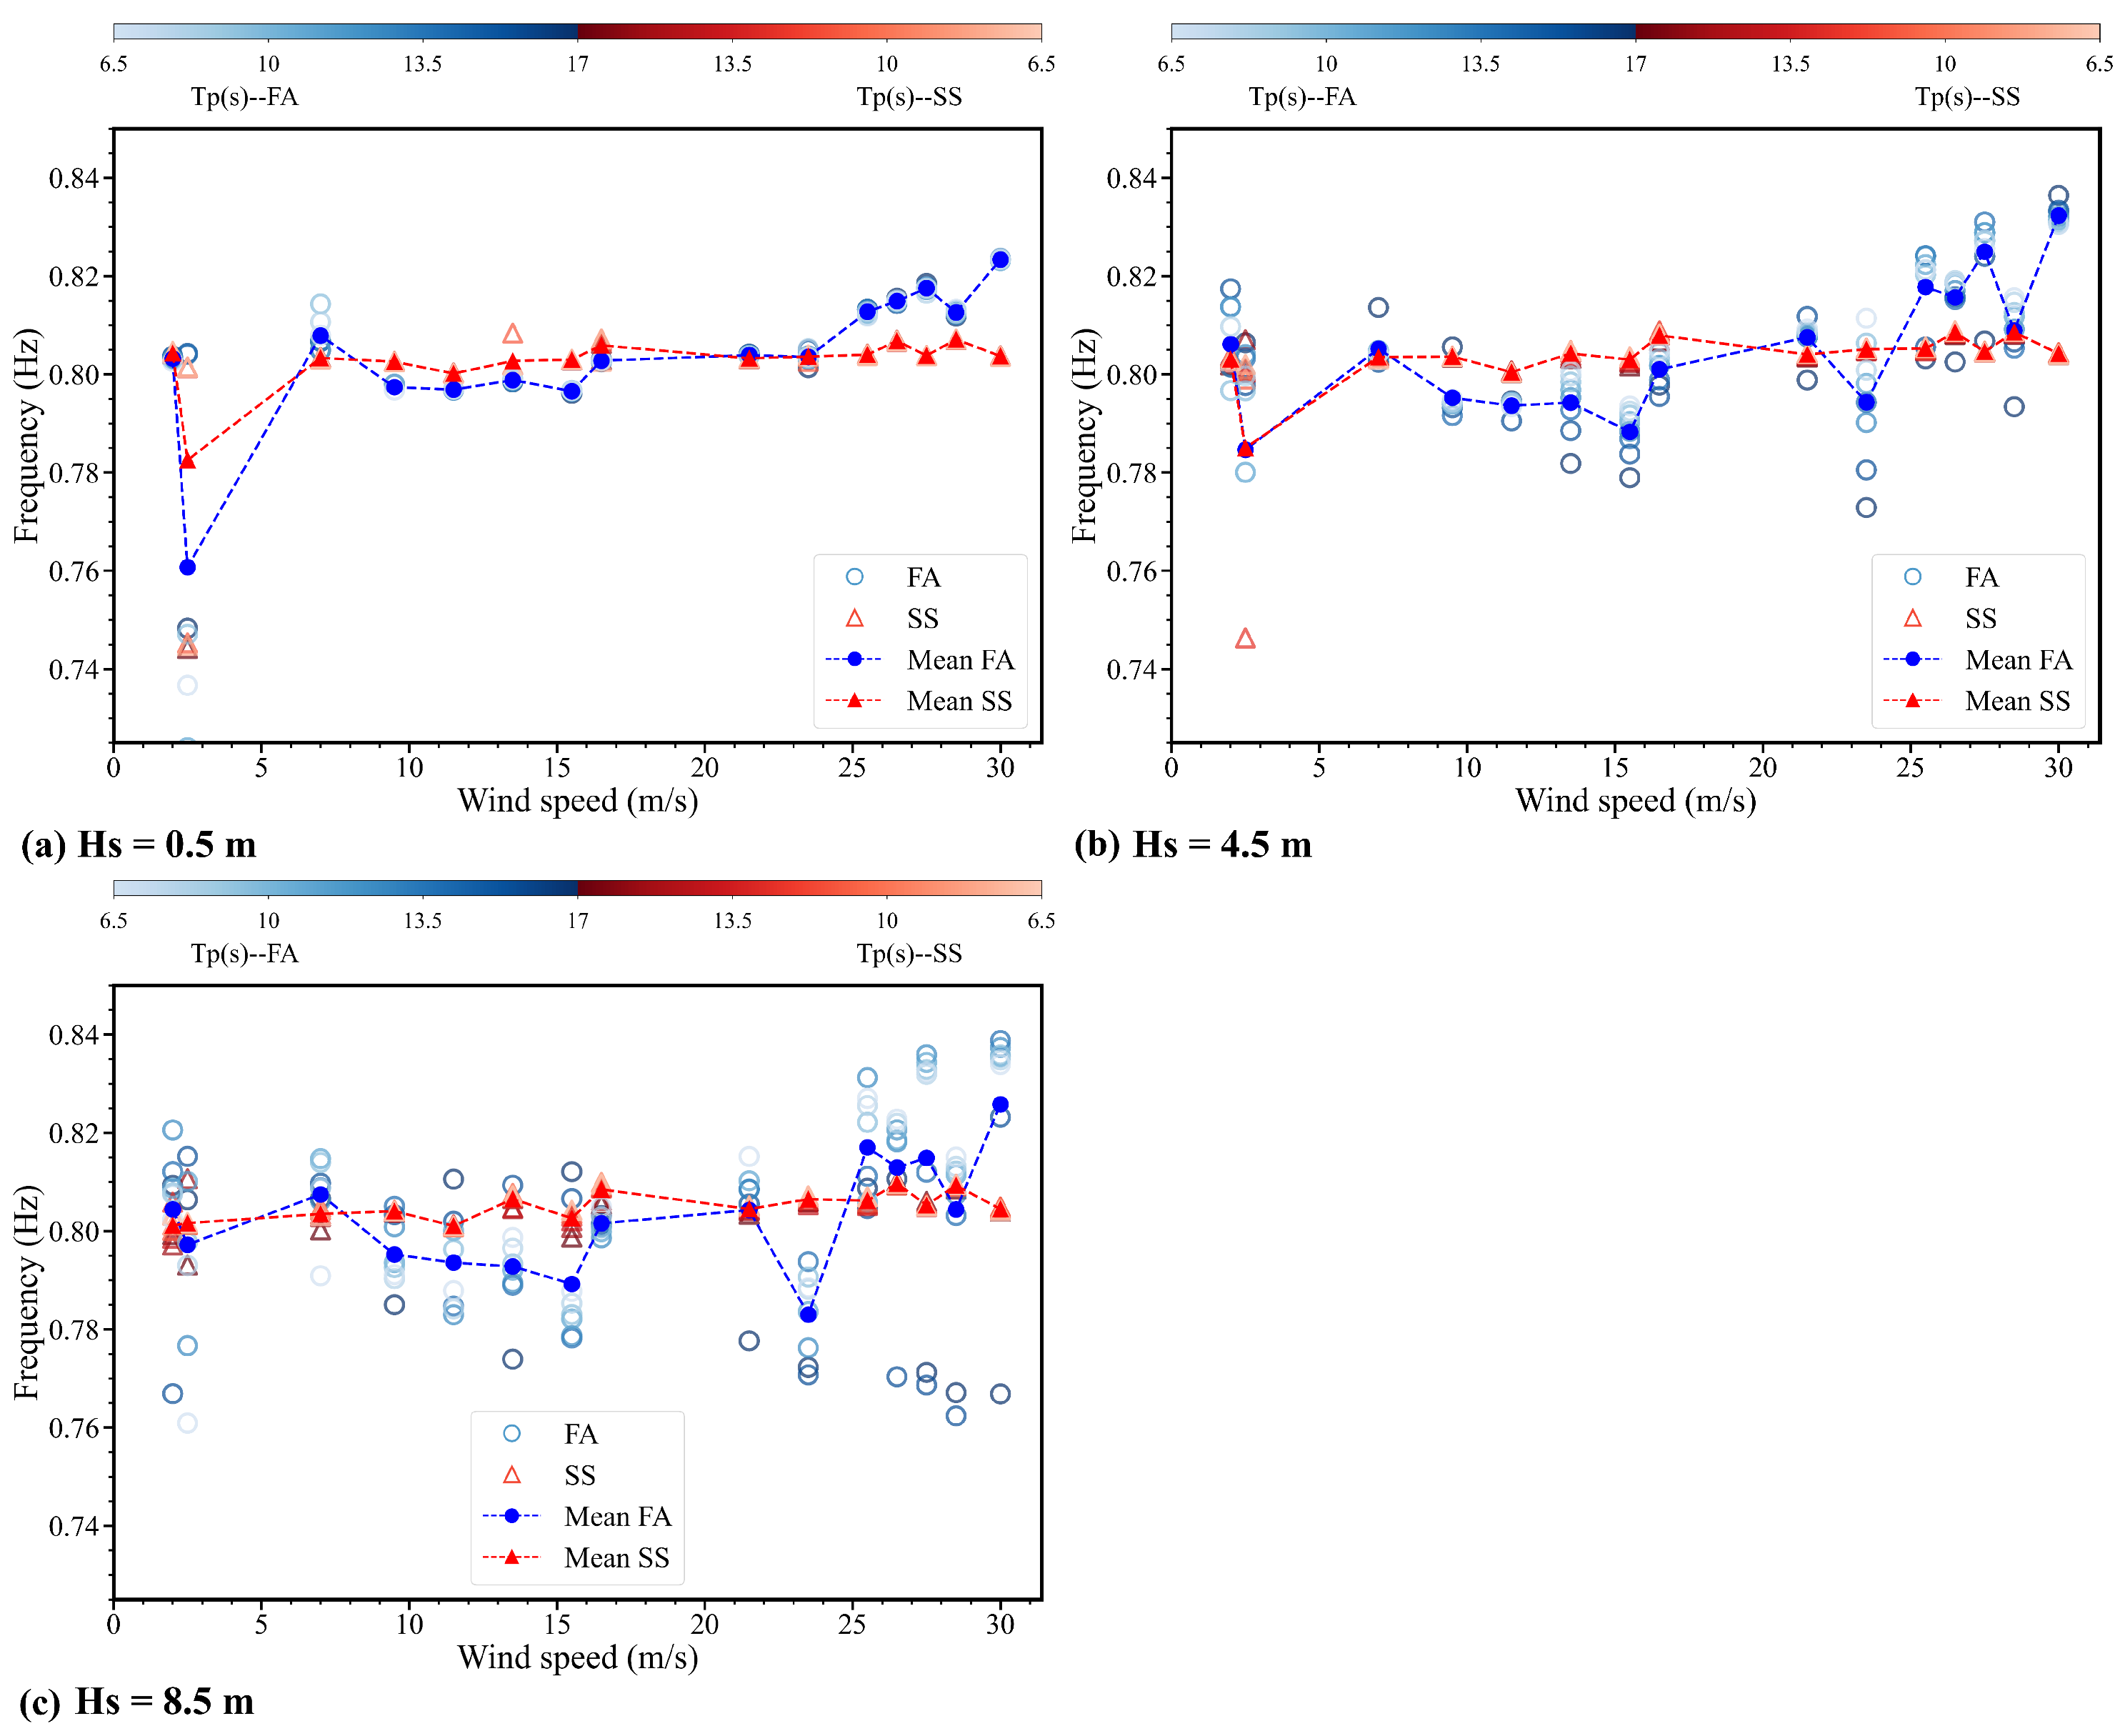
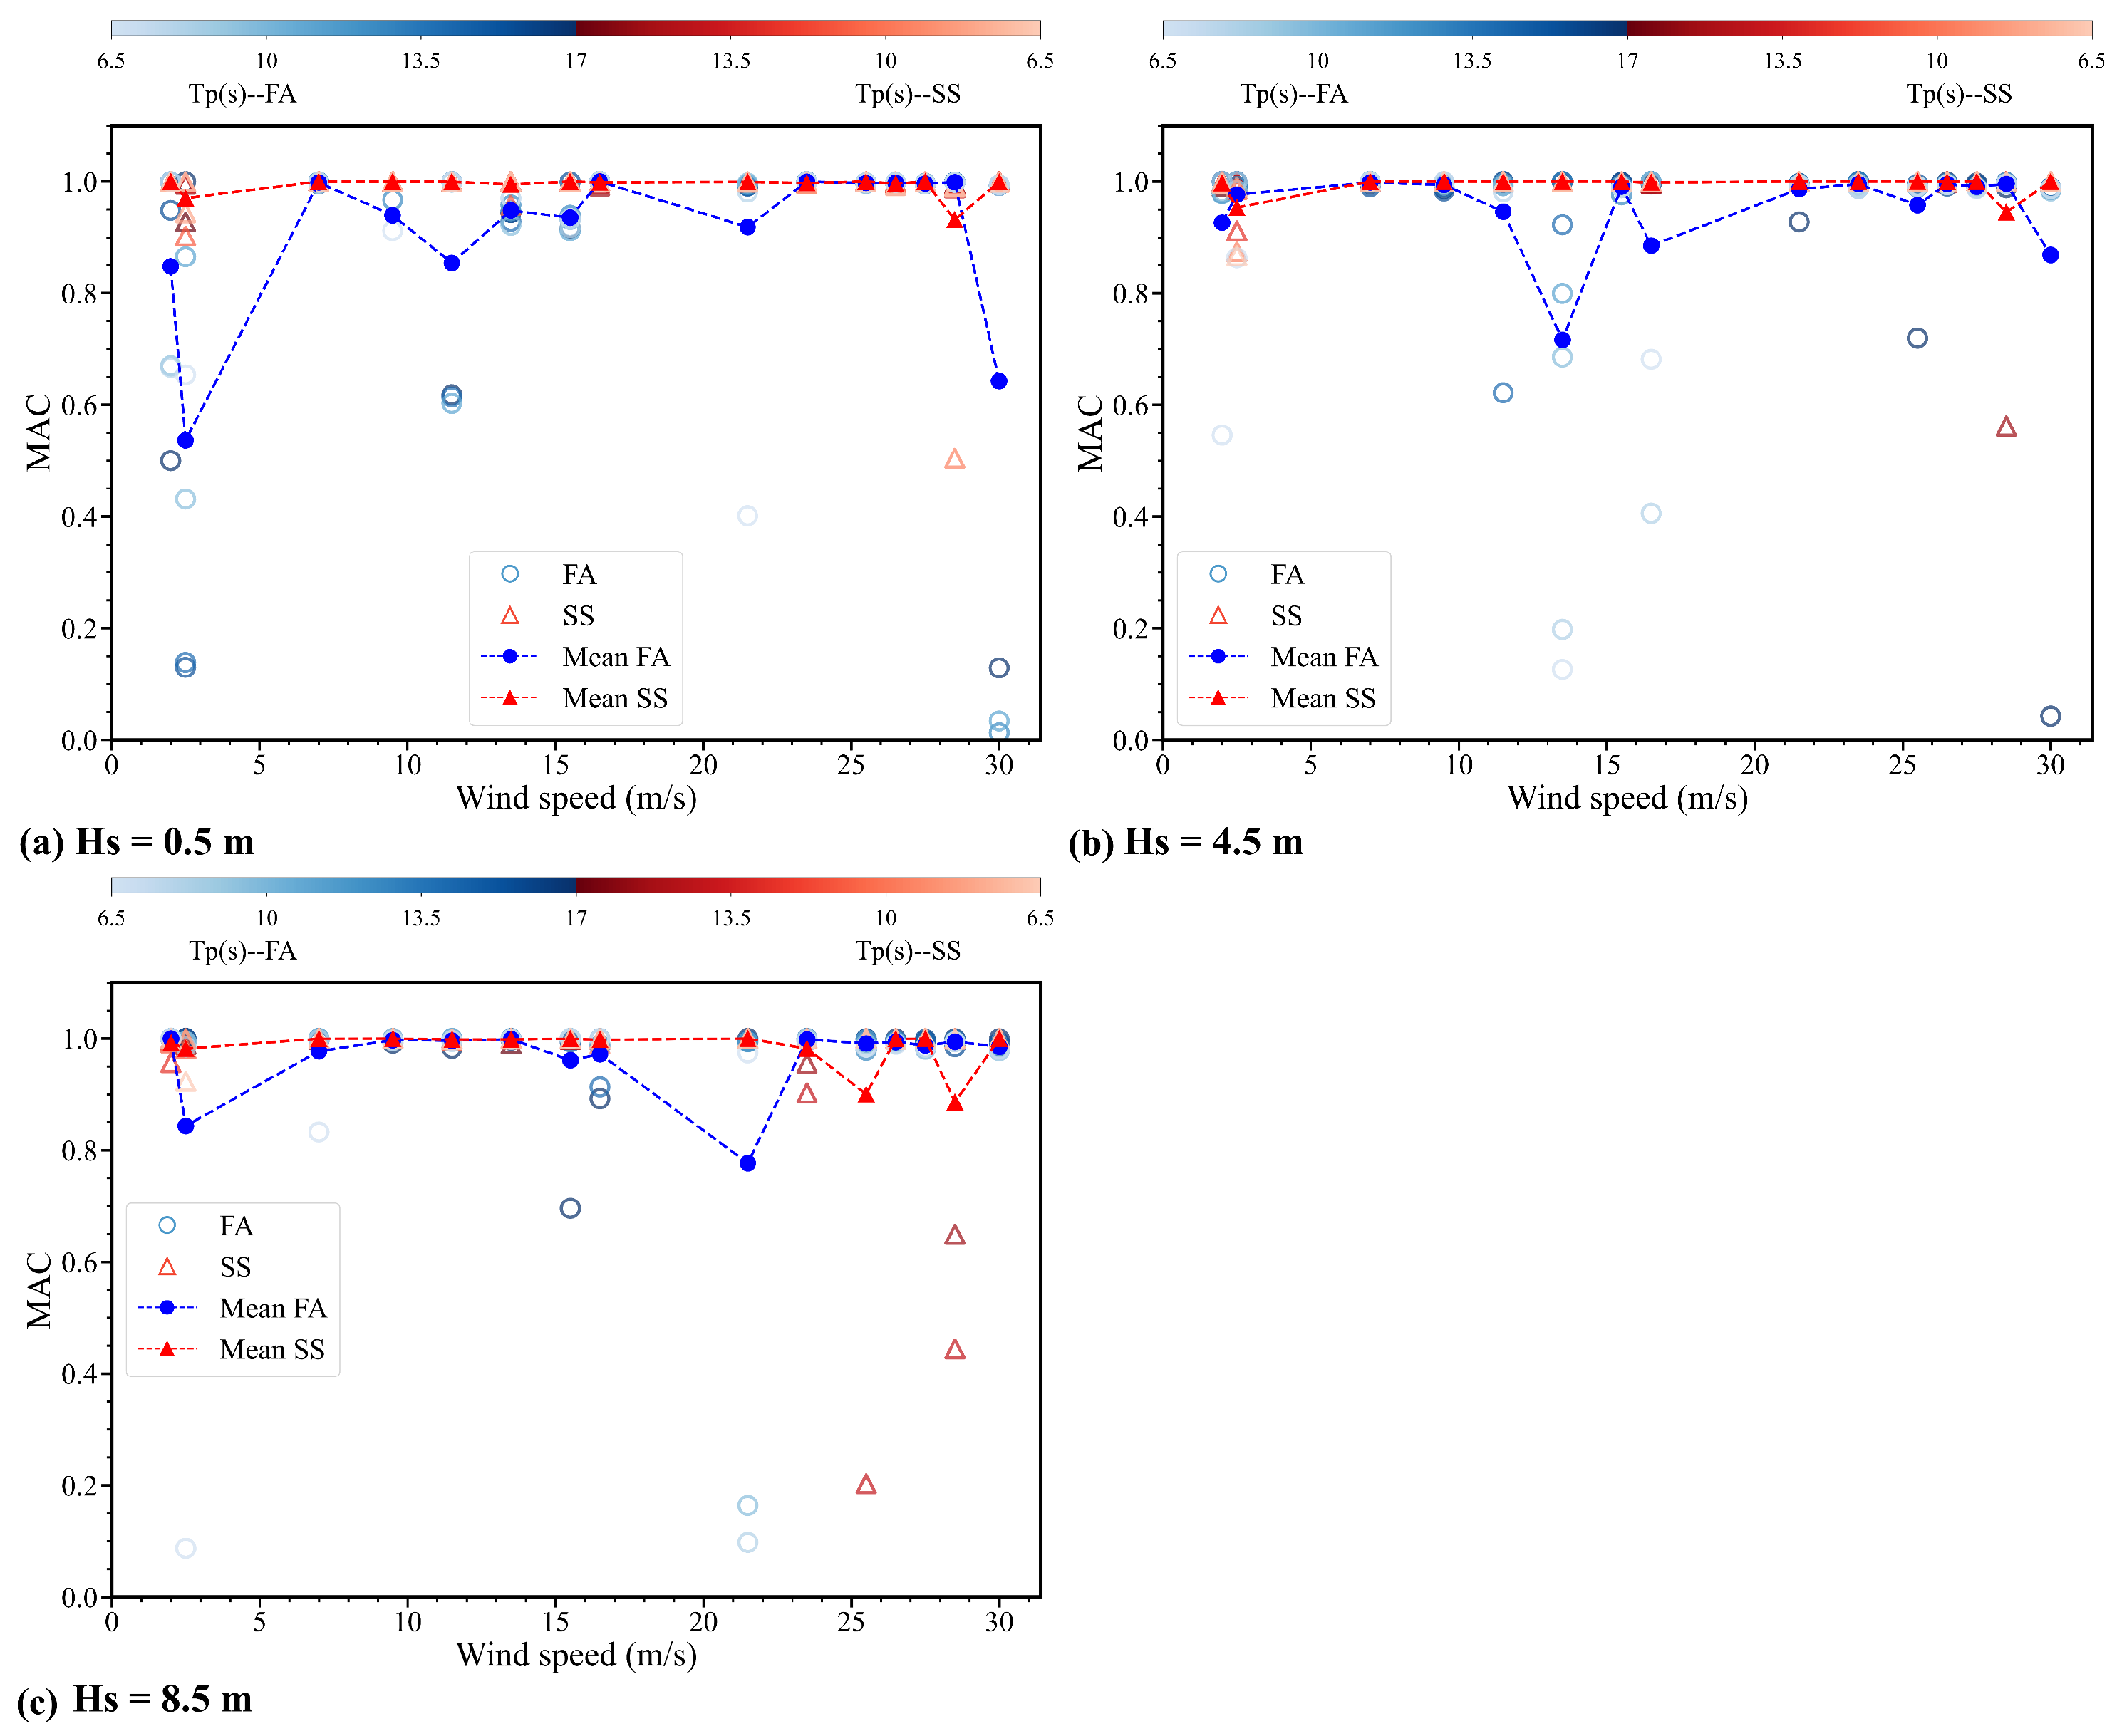
- The first modes can be accurately identified for wind speed higher than the rated speed in conditions of gust wind combined with irregular waves. With the increase in Hs, the identification of the second mode in the FA varies greatly in different Tp conditions with errors fluctuating by approximately 8% compared to the reference modes. However, the second mode in the SS direction can be identified accurately.
- The method is more suitable for applications under broadband excitation, and the identification of first FA natural frequencies is improved by appropriately increasing the angles of wave and wind from 0° to 180°. However, the effect of rotor speed variation on the identification is significantly higher than that of the wave and wind pinch angle, especially when the rotor speed variance is large. The performance in SS consistently outperformed the FA direction under all conditions.
Author Contributions
Funding
Institutional Review Board Statement
Informed Consent Statement
Data Availability Statement
Conflicts of Interest
References
- REN21. Renewables 2023 Global Status Report; Technical Report; REN21: Paris, France, 2023. [Google Scholar]
- Global Wind Energy Council. GWEC|Global Wind Report 2023; Technical Report; Global Wind Energy Council: Brussels, Belgium, 2023. [Google Scholar]
- European Wind Energy Association. EWEA| The Economics of Wind Energy; Technical Report; European Wind Energy Association: Brussels, Belgium, 2009. [Google Scholar]
- van Vondelen, A.A.; Navalkar, S.T.; Iliopoulos, A.; van der Hoek, D.C.; van Wingerden, J.W. Damping identification of offshore wind turbines using operational modal analysis: A review. Wind. Energy Sci. 2022, 7, 161–184. [Google Scholar] [CrossRef]
- Bajrić, A.; Høgsberg, J.; Rüdinger, F. Evaluation of damping estimates by automated operational modal analysis for offshore wind turbine tower vibrations. Renew. Energy. 2018, 116, 153–163. [Google Scholar] [CrossRef]
- Devriendt, C.; Magalhães, F.; Weijtjens, W.; De Sitter, G.; Cunha, Á.; Guillaume, P. Structural health monitoring of offshore wind turbines using automated operational modal analysis. Struct. Health Monit. 2014, 13, 644–659. [Google Scholar] [CrossRef]
- Zhang, G.; Ma, J.; Chen, Z.; Wang, R. Automated eigensystem realisation algorithm for operational modal analysis. J. Sound Vib. 2014, 333, 3550–3563. [Google Scholar] [CrossRef]
- Augustyn, D.; Smolka, U.; Tygesen, U.T.; Ulriksen, M.D.; Sørensen, J.D. Data-driven model updating of an offshore wind jacket substructure. Appl. Ocean Res. 2020, 104, 102366. [Google Scholar] [CrossRef]
- Moynihan, B.; Mehrjoo, A.; Moaveni, B.; McAdam, R.; Rüdinger, F.; Hines, E. System identification and finite element model updating of a 6 MW offshore wind turbine using vibrational response measurements. Renew. Energy. 2023, 219, 119430. [Google Scholar] [CrossRef]
- Xu, P.; Chen, J.; Li, J.; Fan, S.; Xu, Q. Using Bayesian updating for monopile offshore wind turbines monitoring. Ocean Eng. 2023, 280, 114801. [Google Scholar] [CrossRef]
- Andersen, P.; Brincker, R.; Peeters, B.; De Roeck, G.; Hermans, L.; Krämer, C. Comparison of system identification methods using ambient bridge test data. In Proceedings of the 17th International Modal Analysis Conference (IMAC), Kissimmee, FL, USA, 8–11 February 1999; Society for Experimental Mechanics: Aalborg, Denmark, 1999; pp. 1035–1041. [Google Scholar]
- Liu, X.; Luo, Y.; Karney, B.W.; Wang, Z.; Zhai, L. Virtual testing for modal and damping ratio identification of submerged structures using the PolyMAX algorithm with two-way fluid–structure Interactions. J. Fluids Struct. 2015, 54, 548–565. [Google Scholar] [CrossRef]
- Brincker, R.; Zhang, L.; Andersen, P. Modal identification of output-only systems using frequency domain decomposition. Smart Mater. Struct. 2001, 10, 441. [Google Scholar] [CrossRef]
- Cole, H.A., Jr. On-Line Failure Detection and Damping Measurement of Aerospace Structures by Random Decrement Signatures; Technical Report; NASA: Washington, DC, USA, 1973. [Google Scholar]
- Juang, J.N.; Pappa, R.S. Effects of noise on modal parameters identified by the eigensystem realization algorithm. J. Guid. Control Dyn. 1986, 9, 294–303. [Google Scholar] [CrossRef]
- James, G.H. The natural excitation technique (NExT) for modal parameter extraction from operating structures. J. Anal. Exp. Modal. Anal. 1995, 10, 260. [Google Scholar]
- Lardies, J. Modal parameter identification based on ARMAV and state–space approaches. Arch. Appl. Mech. 2010, 80, 335–352. [Google Scholar] [CrossRef]
- Peeters, B.; De Roeck, G. Reference-based stochastic subspace identification for output-only modal analysis. Mech. Syst. Signal Process. 1999, 13, 855–878. [Google Scholar] [CrossRef]
- Van Overschee, P.; De Moor, B. Subspace algorithms for the stochastic identification problem. Automatica 1993, 29, 649–660. [Google Scholar] [CrossRef]
- Ulriksen, M.D.; Tcherniak, D.; Kirkegaard, P.H.; Damkilde, L. Operational modal analysis and wavelet transformation for damage identification in wind turbine blades. Struct. Health Monit. 2016, 15, 381–388. [Google Scholar] [CrossRef]
- Lorenzo, E.D.; Petrone, G.; Manzato, S.; Peeters, B.; Desmet, W.; Marulo, F. Damage detection in wind turbine blades by using operational modal analysis. Struct. Health Monit. 2016, 15, 289–301. [Google Scholar] [CrossRef]
- Shirzadeh, R.; Devriendt, C.; Bidakhvidi, M.A.; Guillaume, P. Experimental and computational damping estimation of an offshore wind turbine on a monopile foundation. J. Wind. Eng. Ind. Aerodyn. 2013, 120, 96–106. [Google Scholar] [CrossRef]
- Weijtjens, W.; Verbelen, T.; Capello, E.; Devriendt, C. Vibration based structural health monitoring of the substructures of five offshore wind turbines. Procedia Eng. 2017, 199, 2294–2299. [Google Scholar] [CrossRef]
- Zhou, L.; Li, Y.; Liu, F.; Jiang, Z.; Yu, Q.; Liu, L. Investigation of dynamic characteristics of a monopile wind turbine based on sea test. Ocean Eng. 2019, 189, 106308. [Google Scholar] [CrossRef]
- Zahid, F.B.; Ong, Z.C.; Khoo, S.Y. A review of operational modal analysis techniques for in-service modal identification. J. Braz. Soc. Mech. Sci. Eng. 2020, 42, 398. [Google Scholar] [CrossRef]
- Song, M.; Mehr, N.P.; Moaveni, B.; Hines, E.; Ebrahimian, H.; Bajric, A. One year monitoring of an offshore wind turbine: Variability of modal parameters to ambient and operational conditions. Eng. Struct. 2023, 297, 117022. [Google Scholar] [CrossRef]
- Song, M.; Moaveni, B.; Ebrahimian, H.; Hines, E.; Bajric, A. Joint parameter-input estimation for digital twinning of the Block Island wind turbine using output-only measurements. Mech. Syst. Signal Process. 2023, 198, 110425. [Google Scholar] [CrossRef]
- Magalhães, F.; Cunha, A.; Caetano, E. Online automatic identification of the modal parameters of a long span arch bridge. Mech. Syst. Signal Process. 2009, 23, 316–329. [Google Scholar] [CrossRef]
- Brincker, R.; Ventura, C. Introduction to Operational Modal Analysis; John Wiley & Sons: Hoboken, NJ, USA, 2015. [Google Scholar]
- Tygesen, U.; Worden, K.; Rogers, T.; Manson, G.; Cross, E. State-of-the-art and future directions for predictive modelling of offshore structure dynamics using machine learning. In Dynamics of Civil Structures, Volume 2: Proceedings of the 36th IMAC, A Conference and Exposition on Structural Dynamics 2018; Springer: Berlin/Heidelberg, Germany, 2019; pp. 223–233. [Google Scholar]
- Popko, W.; Vorpahl, F.; Antonakas, P. Investigation of local vibration phenomena of a jacket sub-structure caused by coupling with other components of an offshore wind turbine. In Proceedings of the ISOPE International Ocean and Polar Engineering Conference, Anchorage, AK, USA, 30 June–5 July 2013; ISOPE: Mountain View, CA, USA, 2013; p. ISOPE–I. [Google Scholar]
- Van Der Tempel, J. Design of Support Structures for Offshore Wind Turbines; TU Delft: Delft, The Netherland, 2006. [Google Scholar]
- Dong, X.; Lian, J.; Yang, M.; Wang, H. Operational modal identification of offshore wind turbine structure based on modified stochastic subspace identification method considering harmonic interference. J. Renew. Sustain. Energy 2014, 6, 033128. [Google Scholar] [CrossRef]
- Dong, X.; Lian, J.; Wang, H.; Yu, T.; Zhao, Y. Structural vibration monitoring and operational modal analysis of offshore wind turbine structure. Ocean Eng. 2018, 150, 280–297. [Google Scholar] [CrossRef]
- Partovi-Mehr, N.; Branlard, E.; Song, M.; Moaveni, B.; Hines, E.M.; Robertson, A. Sensitivity analysis of modal parameters of a jacket offshore wind turbine to operational conditions. J. Mar. Sci. Eng. 2023, 11, 1524. [Google Scholar] [CrossRef]
- Shirzadeh, R.; Weijtjens, W.; Guillaume, P.; Devriendt, C. The dynamics of an offshore wind turbine in parked conditions: A comparison between simulations and measurements. Wind Energy 2015, 18, 1685–1702. [Google Scholar] [CrossRef]
- Zhao, Y.; Pan, J.; Huang, Z.; Miao, Y.; Jiang, J.; Wang, Z. Analysis of vibration monitoring data of an onshore wind turbine under different operational conditions. Eng. Struct. 2020, 205, 110071. [Google Scholar] [CrossRef]
- Peeters, B. System Identification and Damage Detection in Civil Engineering. Ph.D. Thesis, Katholieke Universiteit Leuven, Leuven, Belgium, 2000. [Google Scholar]
- Cheynet, E.; Jakobsen, J.B.; Snæbjörnsson, J. Damping estimation of large wind-sensitive structures. Procedia Eng. 2017, 199, 2047–2053. [Google Scholar] [CrossRef]
- Moser, P.; Moaveni, B. Environmental effects on the identified natural frequencies of the Dowling Hall Footbridge. Mech. Syst. Signal Process. 2011, 25, 2336–2357. [Google Scholar] [CrossRef]
- Bak, C.; Zahle, F.; Bitsche, R.; Kim, T.; Yde, A.; Henriksen, L.C.; Hansen, M.H.; Blasques, J.P.A.A.; Gaunaa, M.; Natarajan, A. The DTU 10-MW reference wind turbine. In Proceedings of the Danish Wind Power Research 2013, Fredericia, Denmark, 27–28 May 2013. [Google Scholar]
- Lu, D.; Wang, W.; Li, X. Experimental study of structural vibration control of 10-MW jacket offshore wind turbines using tuned mass damper under wind and wave loads. Ocean Eng. 2023, 288, 116015. [Google Scholar] [CrossRef]
- Jonkman, B.; Jonkman, J. FAST User’s Guide: Version 8.16.00; Technical Report; National Renewable Energy Laboratory: Golden, CO, USA, 2016. [Google Scholar]
- Bir, G. User’s Guide to BModes (Software for Computing Rotating Beam-Coupled Modes); Technical Report; National Renewable Energy Lab. (NREL): Golden, CO, USA, 2005. [Google Scholar]
- Hasselmann, K.; Barnett, T.P.; Bouws, E.; Carlson, H.; Cartwright, D.E.; Enke, K.; Ewing, J.; Gienapp, A.; Hasselmann, D.; Kruseman, P.; et al. Measurements of wind-wave growth and swell decay during the Joint North Sea Wave Project (JONSWAP). Dtsch. Hydrogr. Z. 1973, A12, 95. [Google Scholar]
- Jonkman, B. Turbsim User’s Guide v2. 00.00; Technical Report; National Renewable Energy Lab. (NREL): Golden, CO, USA, 2014. [Google Scholar]
- Zhang, T.; Wang, W.; Li, X.; Wang, B. Vibration mitigation in offshore wind turbine under combined wind-wave-earthquake loads using the tuned mass damper inerter. Renew. Energy 2023, 216, 119050. [Google Scholar] [CrossRef]
- Huan, C.; Lu, D.; Zhao, S.; Wang, W.; Shang, J.; Li, X.; Liu, Q. Experimental study of ultra-large jacket offshore wind turbine under different operational states based on joint aero-hydro-structural elastic similarities. Front. Mar. Sci. 2022, 9, 915591. [Google Scholar] [CrossRef]

| Dimensions/Properties | Values |
|---|---|
| Hub mass | 105,520 kg |
| Wind turbine mass | 446,036 kg |
| Three blades mass | 125,196 kg |
| Tower height | 85.48 m |
| Tower top diameter and thickness | 5.5 m, 0.02 m |
| Tower base diameter and thickness | 7.57 m, 0.034 m |
| Rotor and hub diameter | 178.30 m, 5.60 m |
| Jacket height | 91.15 m |
| Cut-in, rated, cut-out wind speed | 4.0 m/s, 11.4 m/s, 25.0 m/s |
| Cut-in, rated rotor speed | 6.0 rpm, 9.0 rpm |
| Elastic modulus of steel | 210 GPa |
| Density of steel | 8500 kg/m3 |
| Parameter | Values | Value Interval | Value Count | Unit |
|---|---|---|---|---|
| Hs | [0.5, 16.5] | 1.0 | 17 | m |
| Tp | [6.5, 16.5] | 1.0 | 11 | s |
| Parameter | Values | Value Interval | Value Count | Unit |
|---|---|---|---|---|
| Wind Speed | [2.0, 30.0] | 0.5 | 57 | m/s |
| Parameter | Values | Value Interval | Value Count | Unit |
|---|---|---|---|---|
| Hs | [0.5, 8.5] | 2.0 | 5 | m |
| Tp | [6.5, 17.0] | 1.5 | 8 | s |
| Wind Speed | [2.0, 30.0] | − | 15 | m/s |
| Mode | Natural Frequencies (Hz) | MAC | |
|---|---|---|---|
| Reference | Identified | ||
| The first FA | 0.285 | 0.285 | 0.9999 |
| The first SS | 0.291 | 0.289 | 1 |
| The second FA | 0.827 | 0.82 | 0.979 |
| The second SS | 0.809 | 0.804 | 0.997 |
| Parameters | Dimension | Similarity Relationships | Scale Ratio |
|---|---|---|---|
| Length | 0.013 | ||
| Density | 1.00 | ||
| Velocity | 0.11 | ||
| Acceleration | 1.00 | ||
| Rotor speed | 8.66 | ||
| Time | 0.11 | ||
| Frequency | 8.66 | ||
| Force |
| Load Conditions | Description | Wind Speed (m/s) | Blade Pitch (deg) | Rotor Speed (rpm) | Water Depth (m) | Wave Height (m) | Wave Period (s) |
|---|---|---|---|---|---|---|---|
| LC1 | Steady wind & regular wave | - | 0.9 | - | 61.0 | 1.50 | 9.0 |
| LC2 | - | 0.0 | - | 3.00 | 10.0 | ||
| LC3 | 6.0 | 0.9 | 6.00 | - | - | ||
| LC4 | 11.4 | 0.0 | 9.60 | - | - | ||
| LC5 | 6.0 | 0.9 | 6.00 | 1.5 | 9.0 | ||
| LC6 | 11.4 | 0.0 | 9.60 | 3.0 | 10.0 |
| Load Conditions | Description | Wind Speed (m/s) | Blade Pitch (deg) | Rotor Speed (rpm) | Water Depth (m) | Wave Height (m) | Wave Period (s) |
|---|---|---|---|---|---|---|---|
| LC1 | Steady wind & regular wave | - | 0.9 | - | 0.8 | 0.02 | 0.9 |
| LC2 | - | 0.0 | - | 0.04 | 1.1 | ||
| LC3 | 0.7 | 0.9 | 51.96 | - | - | ||
| LC4 | 1.3 | 0.0 | 83.14 | - | - | ||
| LC5 | 0.7 | 0.9 | 51.96 | 0.02 | 0.9 | ||
| LC6 | 1.3 | 0.0 | 83.14 | 0.04 | 1.1 |
Disclaimer/Publisher’s Note: The statements, opinions and data contained in all publications are solely those of the individual author(s) and contributor(s) and not of MDPI and/or the editor(s). MDPI and/or the editor(s) disclaim responsibility for any injury to people or property resulting from any ideas, methods, instructions or products referred to in the content. |
© 2024 by the authors. Licensee MDPI, Basel, Switzerland. This article is an open access article distributed under the terms and conditions of the Creative Commons Attribution (CC BY) license (https://creativecommons.org/licenses/by/4.0/).
Share and Cite
Zhang, C.; Han, X.; Li, C.; Leira, B.J.; Sævik, S.; Lu, D.; Shi, W.; Li, X. Modal Parameter Identification of Jacket-Type Offshore Wind Turbines Under Operating Conditions. J. Mar. Sci. Eng. 2024, 12, 2083. https://doi.org/10.3390/jmse12112083
Zhang C, Han X, Li C, Leira BJ, Sævik S, Lu D, Shi W, Li X. Modal Parameter Identification of Jacket-Type Offshore Wind Turbines Under Operating Conditions. Journal of Marine Science and Engineering. 2024; 12(11):2083. https://doi.org/10.3390/jmse12112083
Chicago/Turabian StyleZhang, Chen, Xu Han, Chunhao Li, Bernt Johan Leira, Svein Sævik, Dongzhe Lu, Wei Shi, and Xin Li. 2024. "Modal Parameter Identification of Jacket-Type Offshore Wind Turbines Under Operating Conditions" Journal of Marine Science and Engineering 12, no. 11: 2083. https://doi.org/10.3390/jmse12112083
APA StyleZhang, C., Han, X., Li, C., Leira, B. J., Sævik, S., Lu, D., Shi, W., & Li, X. (2024). Modal Parameter Identification of Jacket-Type Offshore Wind Turbines Under Operating Conditions. Journal of Marine Science and Engineering, 12(11), 2083. https://doi.org/10.3390/jmse12112083