Abstract
This study presents an optimized container-stowage plan using reinforcement learning to tackle the complex logistical challenges in maritime shipping. Traditional stowage-planning methods often rely on manual processes that account for factors like container weight, unloading order, and balance, which results in significant time and resource consumption. To address these inefficiencies, we developed a two-phase stowage plan: Phase 1 involves bay selection using a Proximal Policy Optimization (PPO) algorithm, while Phase 2 focuses on row and tier placement. The proposed model was evaluated against traditional methods, demonstrating that the PPO algorithm provides more efficient loading plans with faster convergence compared to Deep Q-Learning (DQN). Additionally, the model successfully minimized rehandling and maintained an even distribution of weight across the vessel, ensuring operational safety and stability. This approach shows great potential for enhancing stowage efficiency and can be applied to real-world shipping scenarios, improving productivity. Future work will aim to incorporate additional factors, such as container size, type, and cargo fragility, to further improve the robustness and adaptability of the stowage-planning system. By integrating these additional considerations, the system will become even more capable of handling the complexities of modern maritime logistics.
1. Introduction
1.1. Research Background
In general, shipping companies develop a container-stowage plan to reduce logistics costs for container ships and to consider the stability of the vessel by appropriately positioning the containers. Currently, planners often create stowage plans manually, taking into account information such as loading and unloading ports, size, type, and weight of the cargo. Since the container-stowage plan is directly related to the safety of the vessel, the position of each container must be carefully determined. Heavy cargo should be loaded first to maintain a low and stable center of gravity for the ship, and cargo that will be unloaded soon should be placed at the top to avoid rehandling during loading and unloading. Handling all these complex conditions manually places a significant burden on planners.
To address this issue, many researchers have conducted studies on finding optimal container-stowage plans that satisfy the constraints to be considered when loading cargo. Various techniques such as genetic algorithms, simulation optimization, and mixed integer linear programming (MILP) have been applied in research. Recently, there has also been active research on utilizing artificial intelligence and machine-learning technologies to further improve the accuracy and efficiency of stowage planning.
1.2. Previous Research
The container stowage-planning problem is defined by two main issues: the Container/Block Relocation Problem (CRP/BRP) and the Container Ship Stowage Planning Problem (CSPP).
In relation to CRP/BRP, Dong-Hee Hong’s research applied a hierarchical clustering method to containers with similar attributes, based on the yard map and loading instructions, to improve the efficiency of container terminals. The study organized containers into stack-level clusters and defined constraints to prevent relocations, determining an efficient container-loading sequence [1]. Young-Gyu Park and Gyu-Seok Kwak proposed a method to reduce relocations in the yard by utilizing container weight information when containers are brought into the storage yard. Based on the Minimum Difference First (MDF) heuristic, their approach involved moving already stored containers if a future relocation seemed likely, and then loading the new container to minimize the number of future relocations [2]. M. Hakan Akyüz conducted research on the Dynamic Container Relocation Problem (DCRP) using a beam search heuristic to maximize yard efficiency and minimize the number of relocations [3].
Regarding CSPP (Container Stowage Planning Problem), many researchers have developed container-stowage plans aimed at minimizing rehandling operations by utilizing genetic algorithms (GA) [4,5,6,7,8]. Yuchuang Wang and colleagues optimized the ship’s stability and trim while minimizing the number of container movements through a multi-objective container stowage optimization problem based on an improved NSGA-III [9]. Francisco Parreno, Dario Pacino, and others used the Greedy Randomized Adaptive Search Procedure (GRASP) to establish an optimal container-stowage plan based on the type, size, and weight of the cargo. They aimed to find the optimal stowage condition that satisfies all constraints by starting with a random arrangement of containers and then adjusting their placement [10].
However, even after the establishment of a stowage plan, there can be issues with changes to the loading schedule or the containers that need to be loaded while loading is underway. However, algorithms like genetic algorithms (GA) find it quite challenging to re-optimize or modify constraints in real time as the environment changes. Consequently, many researchers have pursued studies on establishing stowage plans using reinforcement learning to address these dynamic changes [11,12,13,14].
Tiecheng Jiang and colleagues applied heuristic rule-based reinforcement learning to the Container Relocation Problem (CRP) using Unity’s ML-Agent’s toolkit. They trained a model using the Proximal Policy Optimization (PPO) algorithm to minimize the number of relocations. Their research focused on developing a stowage plan for containers in the yard and minimizing relocations. However, considerations related to the center of gravity were not included in the study [15].
Yifan Shen, Ning Zhao, and colleagues applied the Deep Q-learning Network (DQN), a reinforcement learning algorithm, to container stowage planning. Through this, they developed an optimal container stowage plan that considered container weight, minimizing yard crane movement, and adjacent row weight-difference constraints. Similarly [16], Jae-Hyung Shin and Hyun-Seung Ryu developed a container stowage plan based on the loading and unloading sequence planned by the shipping company. Using the same DQN algorithm as in previous studies, they created an optimal container stowage plan that considered both the loading/unloading sequence and the container weight [17].
However, the studies by Yifan Shen, Ning Zhao, Jae-Hyung Shin, and Hyun-Seung Ryu [17] focused on stowage planning within a single bay, making it difficult to apply these methods directly to actual ships.
Dongmin Jeon and Kiyong Kim conducted research on developing an optimal container stowage plan for 60 containers in a 5 × 3 × 4 rectangular cuboid 3D grid space, ensuring that no relocations occurred. However, the research by Dongmin Jeon, Kiyong Kim, and others involves considering the bay plan, row, and tier plan simultaneously for a 3D stowage space, which leads to inputting the state in three dimensions into the neural network. This results in longer training times and a more complex model structure [18].
After reviewing the relevant literature, it is evident that, as in previous studies, focusing on a single bay makes it difficult to apply the findings to real vessels. Additionally, considering the bay, tier, and row simultaneously results in longer neural network training times, making it challenging to find an optimal solution for the stowage plan. To address this, we propose dividing the stowage plan into two phases: in Phase 1, selecting the bay where the container will be loaded, and in Phase 2, selecting the row and tier for container placement. Additionally, to handle real-time changes in the arrangement of containers to be loaded, the study proposed using PPO (Proximal Policy Optimization), one of the most efficient reinforcement learning algorithms. Notably, this study is the first to propose applying the PPO algorithm when considering bay, row, and tier simultaneously in container stowage planning. PPO offers advantages over other reinforcement learning algorithms due to its faster convergence to the optimal solution and shorter training time. To validate the performance of the PPO algorithm, it was compared with the DQN algorithm, which is recognized for its superior performance in reinforcement learning by applying both to the same container stowage problem and comparing the results. In summary, the contribution points of this study are as follows:
- A method is proposed to divide the process into Phase 1 and Phase 2 to establish an optimal stowage plan efficiently and stably for a 3D loading space.
- This study is the first to propose the application of the PPO algorithm for the container-stowage planning problem considering bay, row, and tier simultaneously.
In this study, Section 2 provides a brief explanation of reinforcement learning. Section 3 explains Phase 1, which focuses on the bay plan, and presents its results. In Section 4, the Phase 2 plan for rows and tiers is established using only POD numbers. Following this, Section 5 introduces weight constraints to optimize the stowage plan. Finally, Section 6 presents the results of loading containers into a 10 × 10 × 10 stowage space, and Section 7 explains the process of designing the program’s Graphical User Interface (GUI).
2. Reinforcement Learning
2.1. Overview of Reinforcement Learning
In this study, the reinforcement learning (RL) method used for container-stowage planning is a branch of machine learning where an agent interacts with an environment to learn optimal actions. The agent receives an input in the form of a state, takes an action, and transitions to the next state. During this process, the agent receives rewards, and it learns to maximize the actions based on the expected value of the reward, defined through the state value function and the action value function. Reinforcement learning is modeled based on the Markov Decision Process (MDP), a mathematical framework that supports decision-making processes. MDP consists of the following components: state, action, reward function, discount factor, and policy. The expected values of the state and action, following a policy, are expressed through the state value function and the action value function. Common reinforcement learning algorithms include DQN, PPO, A2C, and Q-learning.
2.2. Proximal Policy Optimization Algorithm
The Proximal Policy Optimization (PPO) algorithm is one of the policy optimization algorithms, similar to Advantage Actor-Critic (A2C) and Trust Region Policy Optimization (TRPO).
As shown in Figure 1, the PPO algorithm uses two neural networks. The state is input into the neural networks to predict the probability of actions, as in Figure 1a, and the state value, as in Figure 1b.
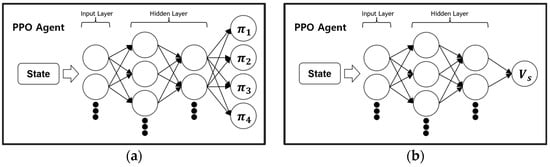
Figure 1.
(a) PPO algorithm policy-estimation process; (b) PPO algorithm state value-estimation process.
State value represents how good the current state is and refers to the total expected reward the agent can obtain from that state onward. The advantage value is estimated using the state value to evaluate how good or bad a certain action is in the current state. If an action results in a good outcome, the probability of taking that action is increased, whereas if it results in a bad outcome, the probability is decreased.
PPO improves the training stability of existing A2C and TRPO algorithms by introducing a clipping mechanism, which limits the range of policy updates, allowing for more stable and efficient learning. This clipping mechanism reduces computational complexity, enabling faster convergence even in high-dimensional state spaces [19].
PPO’s computational complexity is reduced due to the clipping mechanism and the use of first-order optimization. The clipping mechanism prevents large policy updates, allowing for stable and localized optimization, which enables multiple policy updates without additional constraints. Additionally, the use of first-order optimization, such as gradient descent, requires significantly less computational cost compared to second-order optimization methods like those used in TRPO. As a result, PPO maintains computational efficiency and converges quickly, even in high-dimensional state spaces.
3. Applying Reinforcement Learning for Phase 1—Bay Plan
3.1. Problem Definition
In this study, the process of loading cargo onto a container ship is divided into two stages: the bay plan and the row-and-tier plan. The bay plan is defined as Phase 1, and the row-and-tier plan is defined as Phase 2, with the goal of establishing an optimal stowage plan. In Phase 1 of this chapter, the bay where the cargo will be loaded onto the container ship is determined.
To apply reinforcement learning, a total of 10 bays were defined, with each bay assumed to hold 16 containers. It was also assumed that containers are provided one by one in sequence during loading, and the agent does not know which container will be loaded next. Additionally, containers cannot be loaded outside the designated loading space. In Phase 1, the stowage plan was developed with the goal of ensuring that the ship’s longitudinal center of gravity (LCG) does not shift excessively towards the bow or stern.
3.2. Definition of Input Variables and Parameters
In this study, the input variables and parameters were defined as follows to model the formulated stowage-planning problem.
3.3. Application of Reinforcement Learning
The problem defined to apply reinforcement learning in Phase 1 has been described as an MDP with the following definitions for state, action, and reward. The state was assigned a total of 21 values, as shown in Figure 2.
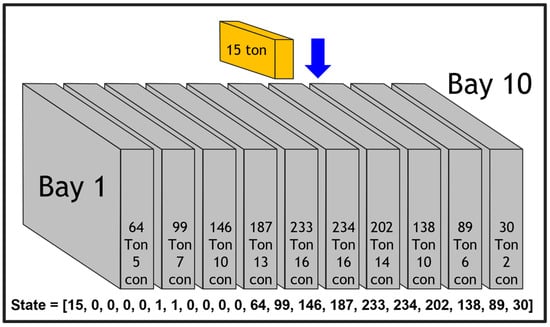
Figure 2.
Phase 1_state definition.
The first position of the state is assigned the weight of the container that needs to be loaded currently. From the second to the eleventh positions, the availability of each bay to hold containers is indicated; if a bay is full, it is assigned a 1. Otherwise, it is assigned a 0. From the twelfth position to the last, the total weight of the containers loaded in each bay is assigned.
For example, the second position is assigned a value of 0 because Bay 1 has 5 containers loaded, which is fewer than the maximum capacity of 16 containers. For Bays 5 and 6, where the number of loaded containers has reached the maximum capacity of 16, a value of 1 is assigned, indicating no further containers can be loaded. The twelfth position is assigned a value of 64, representing the total weight of 64 tons for the containers loaded in Bay 1. Next, the action space is defined as determining which bay to load the next container into. The agent can choose from 10 actions, corresponding to the 10 bays. Finally, to apply reinforcement learning to Phase 1, rewards were assigned as shown in Table 1.

Table 1.
Phase 1 reward assignment.
3.4. Development of a Stowage Model Using the PPO Algorithm
The PPO algorithm trains two neural networks using the state as input, predicting the probability of each action and the value of the current state. The state used as input for the neural networks is modeled according to the state allocation method defined in Phase 1.
The action selection strategy in the PPO algorithm follows the probability of each action. Figure 3 shows an example of the agent selecting actions based on these probabilities. The agent predicts the value of the current state using the neural network and determines whether each action is good or bad, updating the neural network weights accordingly.
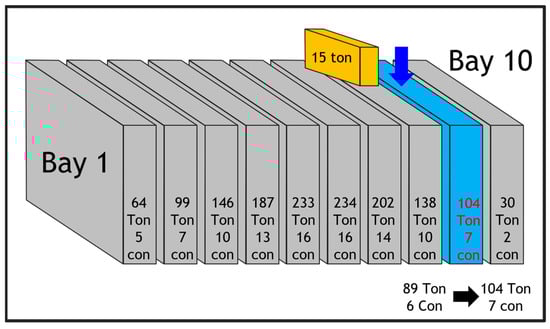
Figure 3.
Phase 1 loaded containers and action select.
3.5. Phase 1 Training Results
The values of the parameters related to the training were set as shown in Table 2. Among these parameters, the learning rate determines how quickly the model learns by controlling the magnitude of the updates to the neural network’s weights. The gamma parameter defines how much the agent values future rewards, while lambda adjusts how much distant data is used when calculating the difference between rewards and the value function. The clipping parameter represents the magnitude of changes during policy updates, and the number of nodes refers to the number of neurons in the hidden layers of the neural network. Finally, the optimizer, which determines how the neural network’s weights are updated, was set to Adam in this study.
Table 2.
Parameter setting of Phase 1 PPO model.
For the experiment, a total of 160 containers were randomly assigned weights of 13 tons, 14 tons, 15 tons, or 16 tons, and the model was trained for 200,000 iterations. As shown in Figure 4, the model converged towards the optimal policy, reaching close to the maximum score of 300 points between 175,000 and 200,000 episodes.
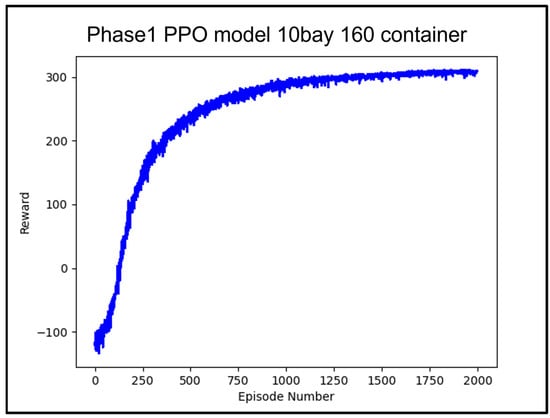
Figure 4.
Average reward value according to 200 k learning counts of Phase 1 PPO model.
Figure 4 shows the training results of the PPO algorithm in Phase 1. The performance of the Phase 1 model trained using the PPO algorithm was evaluated. For performance validation, a stowage plan was established by randomly assigning a total of 90 containers, each weighing 13 tons, 14 tons, 15 tons, or 16 tons, to 10 bays with 16 loading spaces each.
Figure 5 shows the results of loading 90 randomly assigned containers using the trained Phase 1 PPO model. The results demonstrate a well-balanced stowage plan, with no significant shift in the center of gravity or excessive concentration of containers in a single bay.
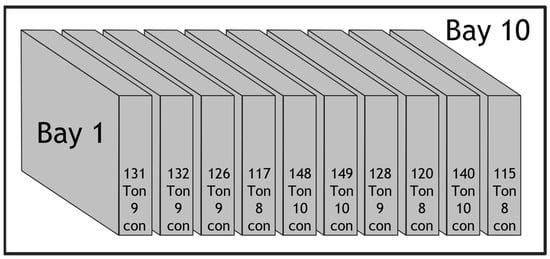
Figure 5.
The loading results of Phase 1 PPO model.
4. Application of Reinforcement Learning for Minimizing Relocations in Phase 2—Row, Tier Plan
4.1. Problem Definition
Rehandling refers to a situation where containers destined for unloading at a current port are stacked on top of containers destined for a farther port, necessitating unnecessary temporary movement of containers. Rehandling is determined by comparing the Port Of Discharge (POD) of containers. In this study, the POD of the first container to be unloaded is defined as NO.1, the next as NO.2, and so forth, with the last POD being NO.4.
To apply reinforcement learning for minimizing rehandling, a 4 × 4 loading space was defined, consisting of four stacks, each capable of holding four containers. It is assumed that containers are provided one at a time during loading, and the agent does not know which container will be loaded next. Additionally, containers cannot be loaded outside the designated loading space.
Containers with smaller POD numbers, indicating the order in which they need to be unloaded first, should be loaded on top to minimize rehandling. As depicted in Figure 6, in Stack 1, containers are loaded from the bottom up in the order of POD NO.4, POD NO.2, POD NO.2, and POD NO.1, with the largest POD numbers at the lowest tier, ensuring no rehandling. Similarly, in Stack 2, containers are loaded from the bottom up as POD NO.4, POD NO.3, POD NO.3, and POD NO.1, also resulting in no rehandling. In Stacks 3 and 4, containers with the largest POD numbers are loaded from the bottom up, preventing rehandling. This method of loading ensures that all containers are loaded without rehandling, successfully achieving the objective defined in this chapter.
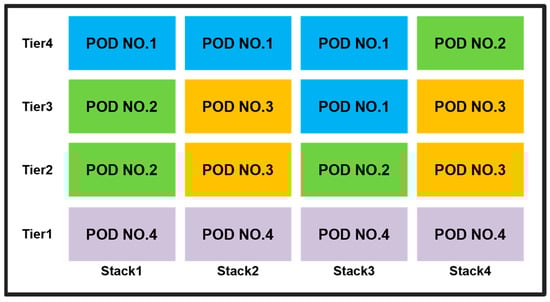
Figure 6.
Loading status of provided containers.
4.2. Definition of Input Variables and Parameters
In this study, the input variables and parameters were defined as follows to model the stowage-planning problem.
4.3. Application of Reinforcement Learning
The problem defined to apply reinforcement learning in Phase 1 has been described as an MDP with the following definitions for state, action, and reward. First, the state is represented using characteristic values that can identify both the containers currently loaded and the container that needs to be loaded.
The state is defined with a total of nine elements: the POD number of the container to be loaded, the count of containers already loaded in each of stacks 1 through 4, and whether rehandling is necessary for each stack, calculated as 0 or 1, to indicate the absence or presence of rehandling, respectively.
In Figure 7, an example is used to illustrate the definition of the state. The first position of the state is assigned the POD number 3 of the container that needs to be loaded. The number of tiers in Stacks 1 to 4 are 3, 1, 2, and 3, respectively, so these values are assigned to the second through fifth positions of the state. Since rehandling occurs when loading containers in Stack 1, a value of 1 is assigned to the sixth position; Stack 2 does not require rehandling and is capable of loading, so a value of 0 is assigned to the seventh position; rehandling occurs when loading into Stacks 3 and 4, so a value of 1 is assigned to each, in the eighth and ninth positions, respectively. Defining the state in this way ensures that the state size does not grow exponentially with the number of tiers, even as the loading space increases. Next, the action space is defined as determining which stack to load the next container into. The agent can choose from four actions, corresponding to the four stacks. Finally, to apply reinforcement learning to Phase 2, rewards were assigned as shown in Table 3.
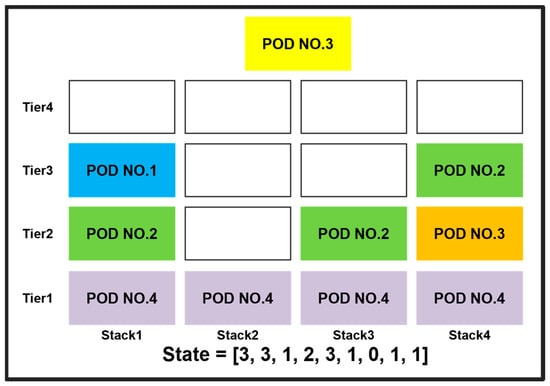
Figure 7.
State first definition.
Table 3.
Phase 2 reward assignment.
4.4. Development of a Stowage Model Using the PPO Algorithm
In Phase 2, the application of the PPO algorithm also involves training a neural network using the state as input, just as in Phase 1, and predicting the probability of each action and the value of the current state. The neural network uses the state described in Section 4.3 as its input, and similar to Phase 1, it predicts the probability of each action and the value of the current state using two neural networks.
4.5. Training Results of the PPO Algorithm in Phase 2
For the agent’s training, parameters related to learning were set as described in Table 4. POD numbers 1, 2, 3, and 4 were randomly assigned to 16 containers, and the number of training iterations was set at 200,000.
Table 4.
Parameter setting of Phase 2 PPO model.
Figure 8 shows the training results of the PPO algorithm. Table 5 presents the performance validation of the trained PPO model across nine different test container cases. The validation of the trained model was conducted by sequentially loading containers from the leftmost container in the test container list. The test results indicated that a stowage plan was established without any rehandling for all test container cases.
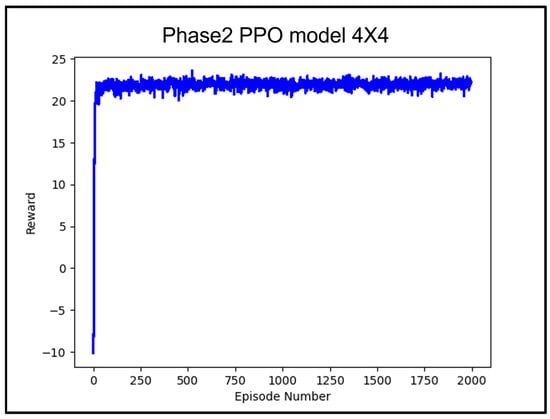
Figure 8.
Average reward value according to 200 k learning counts of Phase 2 PPO model.
Table 5.
Test results of Phase 2 PPO model trained.
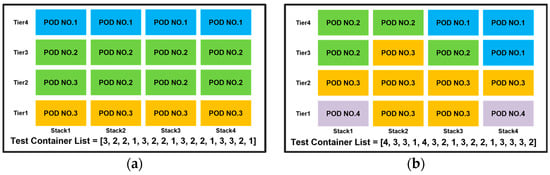
Figure 9.
(a) The loading results of Phase 2 PPO model for Test Container Case No.1; (b) the loading results of Phase 2 PPO model for Test Container Case No.4.
4.6. Performance Comparison with the DQN Algorithm
The Deep Q-Network (DQN) algorithm is one of the methods used in reinforcement learning, enhancing Q-learning by utilizing artificial neural networks. Q-learning is an algorithm in which an agent learns a policy to maximize rewards for provided states and actions, calculating the total expected reward for taking a specific action in a specific state through the Q-function. However, Q-learning faces a challenge as the size of the table storing the Q-values grows exponentially with the increase in combinations of states and actions. To address this, the DQN algorithm uses artificial neural networks to approximate and learn the Q-function [20]. Figure 10 shows the results of training using the DQN algorithm under the same conditions to compare its performance with the PPO algorithm.
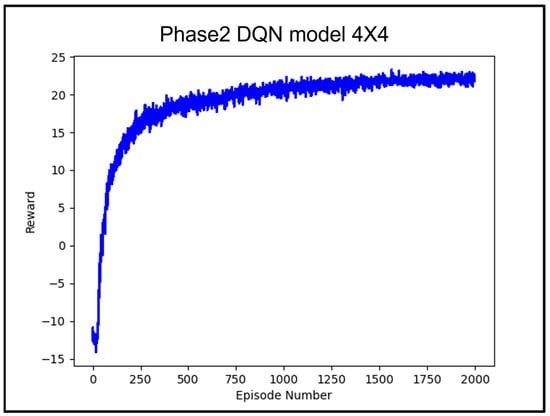
Figure 10.
Average reward value according to 200 k learning counts of DQN model.
Table 6 presents the performance validation of the DQN Model across nine different test container cases. The DQN algorithm, like the PPO algorithm, successfully established a stowage plan without rehandling for all test container cases. Figure 11a,b shows the results of loading for Cases 1 and 4 from Table 6, respectively.
Table 6.
Test results of DQN model trained.
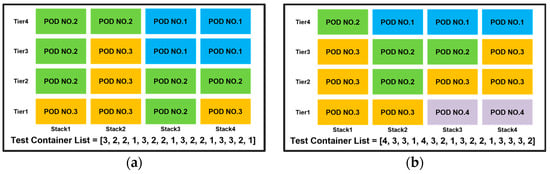
Figure 11.
(a) The loading results of DQN Model for Test Container Case No.1; (b) the loading results of DQN Model for Test Container Case No.4.
Both the model trained with the PPO algorithm and the model trained with the DQN algorithm successfully established stowage plans without rehandling for all nine test container lists. However, the PPO algorithm demonstrated faster convergence and less noise compared to the DQN algorithm. In terms of training speed, the PPO algorithm took around 50 min for 200,000 iterations, while the DQN algorithm took about 2 h and 10 min. Therefore, the PPO algorithm is considered to be a more efficient and superior reinforcement learning method compared to the DQN algorithm.
5. Container Stowage Planning with Weight Constraints Added in Phase 2
5.1. Problem Definition
The container-stowage plan with added weight constraints follows the same problem definition as described in Section 4, with the addition of weight-specific rewards. The weight reward ensures that the weight limit for each stack is not exceeded, heavier containers are prioritized for loading at the bottom, and the total weight of the containers loaded on both sides of the ship, relative to the centerline, is balanced to prevent tilting. This stowage method lowers the ship’s center of gravity and increases GM, thereby enhancing the ship’s stability.
As shown in the stowage state in Figure 12, containers with larger POD numbers are loaded from the bottom in all stacks, resulting in no rehandling. Additionally, the total weight of the containers in Stack 1 and Stack 2 is 113 tons, while the total weight in Stack 3 and Stack 4 is 117 tons, with only a 4-ton difference between the left and right sides. Under the condition of prioritizing the loading of heavier containers, the heavier containers are loaded first from the bottom, and the container weight decreases as the tiers go up. This example demonstrates that all containers were loaded without rehandling and in compliance with the weight constraints, achieving the objective defined in this chapter.
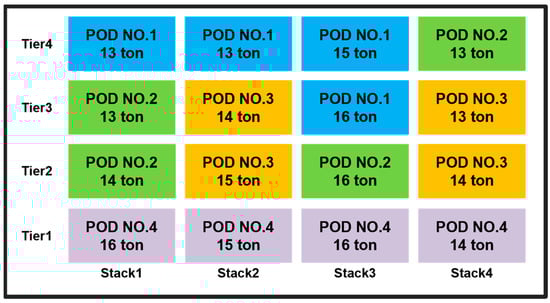
Figure 12.
Loading status of particular containers’ added weight constraints.
5.2. Definition of Input Variables and Parameters
In this chapter, the input variables and parameters were additionally defined as follows to model the weight constraints in the stowage-planning problem defined earlier.
5.3. Application of Weight Constraints in Phase 2
In this chapter, the PPO algorithm is used over the DQN algorithm, as it reaches the highest point faster during training and exhibits less noise. To apply container stowage planning with weight constraints to reinforcement learning, additional weight constraint conditions were defined for the state, action, and reward as outlined in Section 3. To incorporate the weight constraints, nine more characteristic values were added to the state, which was originally defined with nine values. These additional values include the weight of the container to be loaded, the total weight of containers already loaded in each stack, and the weight difference between the container being loaded and the one directly below it. The details are as follows.
In Figure 13, among the values assigned to the state, the first position is assigned the POD number 3 of the container to be loaded, and the second position is assigned the weight 15 of the container to be loaded. From the third to the tenth positions, the values related to the POD are used, as in the previous stowage plan that only considered rehandling constraints. Positions 11 through 14 represent the total weight of containers loaded in each stack. For example, in the eleventh position, the total weight of the containers loaded in stack 1 is 16 tons + 15 tons + 14 tons = 45 tons, so a value of 45 is assigned. From the fifteenth position, the difference between the weight of the container to be loaded and the weight of the container at the top of each stack is assigned. For example, in the fifteenth position, the difference between the weight of the container at the top of stack 1, and the container to be loaded is 14–15 tons = −1 ton, so a value of −1 is assigned. As in the stowage plan with rehandling as the only constraint, the agent has four possible actions, corresponding to the number of stacks. On the other hand, unlike the stowage plan that only considered container rehandling, the weight constraint condition was added to the reward using the method outlined in Table 7.
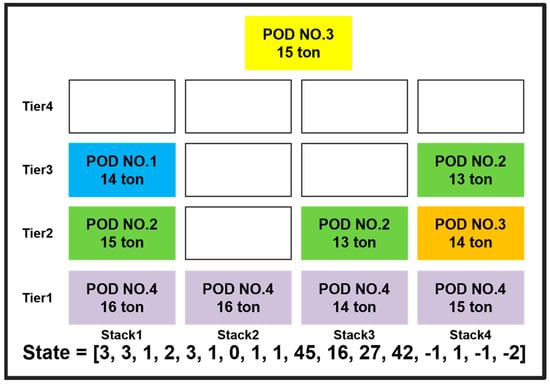
Figure 13.
State definition for applying the PPO algorithm with weight constraints.
Table 7.
Phase 2 reward assignment with weight constraints.
5.4. Model Training Results
The values for the training-related parameters were set as shown in Table 8. The experiment in this chapter was conducted similarly to Section 4, where 16 containers were randomly assigned POD NO.1, POD NO.2, POD NO.3, and POD NO.4, and the container weights were randomly set to 13 tons, 14 tons, 15 tons, and 16 tons to train the PPO model.
Table 8.
Parameter setting of PPO model with weight constraints.
The training results of the PPO model with added weight constraints are shown in Figure 14. The PPO model for Phase 2, with added weight constraints, was also evaluated using the same nine test container lists as Phase 2, which only considered rehandling. Table 9 shows the test container lists used for performance validation and the results. The validation results indicate that all nine test container lists resulted in stowage plans without any rehandling. Figure 15a,b shows the stowage results for Test Container Lists 6 and 9, respectively.
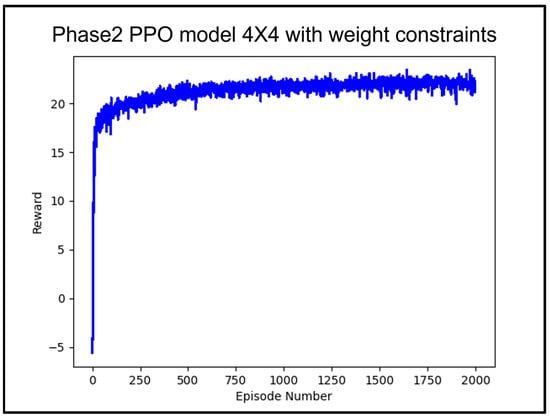
Figure 14.
Average reward value according to 200 k learning counts of PPO Algorithm with weight constraints.
Table 9.
Test results of the Phase 2 PPO model trained with weight.
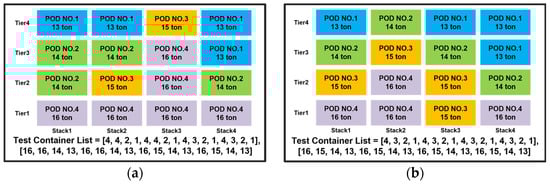
Figure 15.
(a) The loading results of Phase 2 PPO model for Test Container Case No.6 with weight constraints; (b) the loading results of Phase 2 PPO Model for Test Container Case No.9 with weight constraints.
6. Application of Phase 1 and Phase 2 in a 3D Stowage Space
6.1. Problem Definition
To establish the stowage plan in a 3D loading space, which is the final objective of this study, both Phase 1 and Phase 2 were applied simultaneously. The 3D loading space was defined as a space capable of holding a total of 1000 containers, with 10 bays, 10 rows, and 10 tiers. To establish the stowage plan for the 3D loading space, the Phase 1 model was used to select the bay, and the Phase 2 model was used to select the row.
6.2. Stowage Planning
As the loading space was changed from 4 rows and 4 tiers to 10 rows and 10 tiers, Phase 1 and Phase 2 were retrained. For Phase 1, the number of bays and training iterations remained the same, but the number of containers used for training was increased to 1000 containers, which were randomly assigned for training. For Phase 2, due to the expansion of the loading space, the number of training iterations was set to 300,000. Figure 16a shows the training results for Phase 1, and Figure 16b shows the training results for Phase 2.
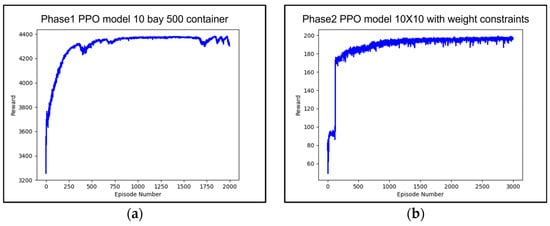
Figure 16.
(a) Average reward value according to 200 k learning counts of Phase 1 PPO model; (b) average reward value according to 300 k learning counts of Phase 2 PPO model.
In Figure 16a, the score converged near the maximum possible score of 4300, which can be obtained when 500 containers are loaded in Phase 1. In Figure 16b, the score converged near the maximum possible score of 200, which can be obtained when 100 containers are loaded in the stowage space defined in Phase 2 without rehandling.
The containers used for the stowage plan were randomly assigned POD numbers from POD NO.1 to POD NO.4, and their weights were randomly assigned as 13 tons, 14 tons, 15 tons, or 16 tons. A stowage plan was established using 800 containers for a total of 1000 stowage spaces. Figure 17 shows the stowage plan results for Phase 1. Figure 18b shows the stowage results for Bay 5, which had the most containers loaded, while Figure 18a shows the stowage results for Bay 1, which had the fewest containers loaded.
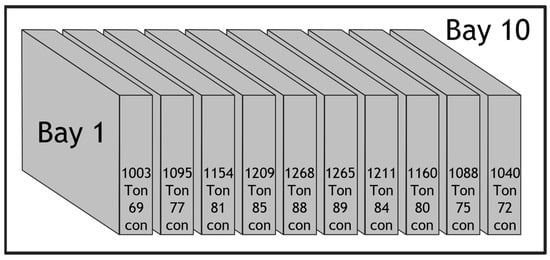
Figure 17.
Phase 1 container-stowage results using the PPO model with 800 containers.
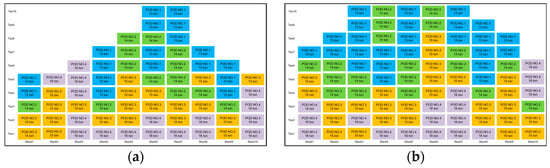
Figure 18.
(a) Phase 2 container-stowage results for Bay 1; (b) Phase 2 container-stowage results for Bay 5.
In the bay plan using Phase 1, the longitudinal length of the loaded space was 61 m, and the Longitudinal Center of Gravity (LCG) of the container ship was +3.111 m from the midship, meaning that the center of gravity did not significantly deviate from the center. The stowage plan was established without concentrating the load in a single bay. In the row and tier plan using Phase 2, all 800 containers were loaded across 10 bays, and an average of six to eight rehandlings occurred per bay. Compared to the previous study by Dongmin Jeon, where two to three rehandlings occurred in a 5 × 5 stowage space, the current study shows favorable results, as the stowage space increased fourfold, yet only six to eight rehandlings occurred. The vertical length of the loaded space was 24 m, and the Vertical Center of Gravity (VCG) of the container ship was well balanced, with the center of gravity at +1.656 m in Bay 1 and +1.08 m in Bay 2 from the centerline. The overall stowage results are included in the Appendix A.
7. Program Development
7.1. Program Overview
In this study, a program was developed to be user-friendly. First, the program receives the POD number and weight of the container to be loaded. Then, the container’s weight information and the loading status of each bay are input into the pre-trained Phase 1 model in the form of the defined state to predict the probability of loading into each bay. Based on the predicted probabilities, a bay is selected. The loading status of the selected bay, along with the POD number and weight of the container to be loaded, are input into the Phase 2 model in the form of the Phase 2 state to predict the probability of loading into each row. Based on these predicted probabilities, a row is selected. The stowage plan allows containers to be entered one by one in sequence. Once the stowage plan is completed, the final output includes the loading status, the center of gravity of the container ship with the loaded cargo, the total weight, the number of loaded containers, and the remaining available space.
7.2. Program Graphical User Interface
The Graphical User Interface (GUI) of the program developed in this study is designed as shown in Figure 19. The “input data” button at the top right of the GUI is used to input the information of the containers to be loaded before establishing the stowage plan. To the right of the “input data” button, a “run” button is created to execute the program. Further to the right, the “ship info” window allows input of the ship’s number of bays, rows, and tiers. At the center of the GUI, a schematic of the container ship is displayed with each bay represented as a button, enabling visualization of the loading status within each bay after the stowage plan has been established. The center-right section of the GUI shows the center of gravity (X, Y, Z) of the container ship after the stowage plan is created. Finally, the “current status” window at the top right of the GUI displays the number of loaded containers, remaining space, and the total weight of the ship.
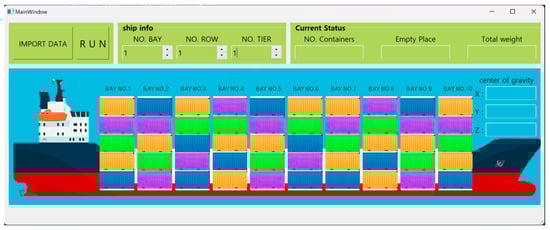
Figure 19.
Container Ship Loading Planning Program Main window UI.
Figure 20 shows the window that appears when the previously mentioned “input data” button is clicked. It allows users to manually input the POD number and weight information for up to eight containers. When a large amount of container information needs to be entered, users can click the button on the right to input the data in Excel file format.
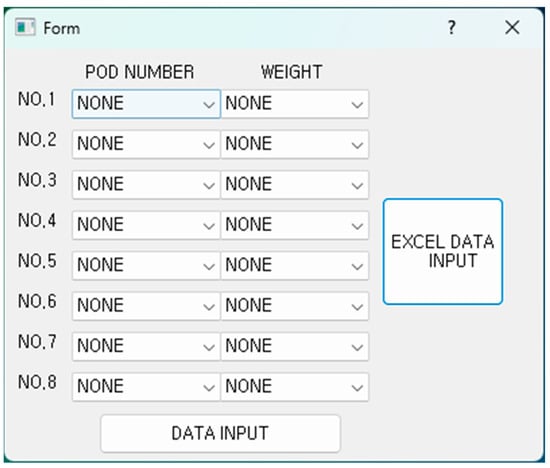
Figure 20.
Container ship loading-planning program data input window UI.
7.3. Execution Result
Figure 21 shows the result window after running the program. For the experiment in this study, 144 containers were input into the program to check the results. The POD numbers assigned to the containers were POD NO.1, POD NO.2, POD NO.3, and POD NO.4, while the weights were assigned as 13 tons, 14 tons, 15 tons, and 16 tons. The target ship was assumed to have 9 bays, 10 rows, and 10 tiers, with a total of 900 loading spaces. The ship’s weight was assumed to be 100 tons. The loading results related to Phase 1 can be seen in Figure 21, which shows the number of containers loaded at the top of each bay and the total weight of the loaded containers.
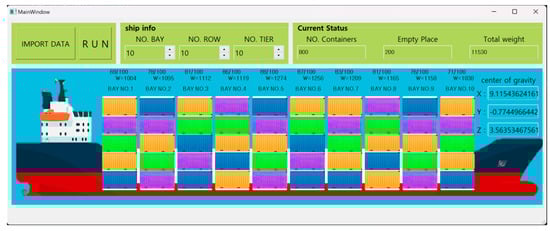
Figure 21.
Container ship loading-planning program result.
Figure 22 shows the loading results within each bay. By clicking on the bay button, the loading status of each bay can be viewed. The POD numbers of the containers are displayed, and at the top of each row, the number of loaded containers and the weight per row are shown.
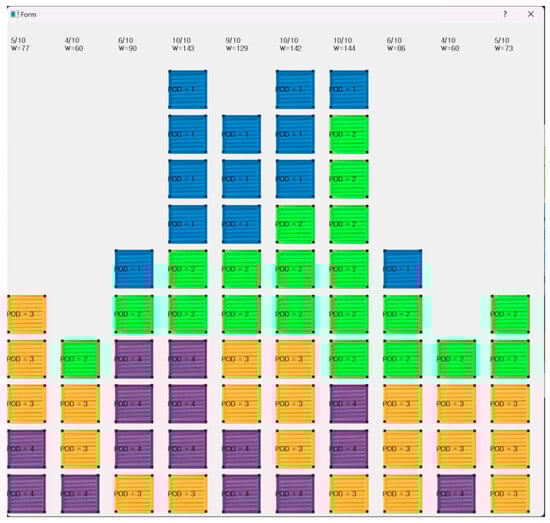
Figure 22.
Container ship loading-planning program in bay result.
8. Conclusions
Establishing a container-stowage plan using reinforcement learning must take into account various factors, such as container weight, unloading order, size, and type. This process requires significant time and effort when done manually. To address this issue, this study applied reinforcement learning to develop an optimal container-stowage plan. Traditional optimization algorithms like GA have the drawback of needing to re-optimize each time there is a change in the containers to be loaded. To overcome this, the study developed a stowage plan that accounts for real-time changes by setting reward functions based on rehandling and the ship’s center of gravity.
To establish the stowage plan using reinforcement learning, the environment was mathematically modeled, and the state, action, and reward of the Markov Decision Process (MDP) were defined. In Phase 1, the state was defined using the weight information of the container to be loaded, the loading status of each bay, and the total weight of containers loaded in each bay. In Phase 2, the state was defined using characteristic values for a 4 × 4 loading space. The agent’s actions were defined as determining where the container should be loaded. The rewards based on actions were calculated according to conditions such as successful loading, inability to load, rehandling, the center of gravity, weight constraints by bay and row, and prioritizing the loading of heavy cargo.
The Proximal Policy Optimization (PPO) algorithm was used for reinforcement learning. To compare the performance of PPO, the study also employed the Deep Q-learning Network (DQN) algorithm under the same conditions. When only the unloading order was considered, the comparison showed that the PPO algorithm outperformed the DQN algorithm in terms of both learning speed and performance. Both Phase 1 and Phase 2 were trained using the PPO algorithm, and container-stowage plans were established using the trained model, with the results being reviewed. The results confirmed that the approach to solving the container-stowage problem using reinforcement learning is an effective method.
In this study, Phase 1 and Phase 2 were combined to establish a container-stowage plan for a 3D loading space. A program was developed, and a user-friendly GUI was designed to allow easy use of this system.
It was confirmed that by considering not only the unloading order and weight but also the size and type of containers, a container stowage-planning system that can be used in real-world operations can be developed in the future.
Author Contributions
Conceptualization, J.C. and N.K.; supervision, N.K.; methodology, N.K.; experiment, J.C.; writing, J.C. and N.K. All authors have read and agreed to the published version of the manuscript.
Funding
This work was supported by Innovative Human Resource Development for Local Intellectualization program through the Institute of Information & Communications Technology Planning & Evaluation (IITP) grant funded by the Korea government (MSIT) (IITP-2024-RS-2020-II201791, 90%) and “Regional Innovation Strategy (RIS)” through the National Research Foundation of Republic of Korea (NRF) funded by the Ministry of Education (MOE) (2023RIS-007, 10%).
Institutional Review Board Statement
Not applicable.
Informed Consent Statement
Not applicable.
Data Availability Statement
Data are contained within the article.
Conflicts of Interest
The authors declare no conflict of interest.
Appendix A
This appendix contains the stowage results for the bays other than Bay 1 and Bay 5, which are shown in the main text, regarding the experimental results from Section 6.
As a result of the stowage process, all containers were loaded within the predefined stowage space of 10 × 10 × 10, ensuring compliance with the ship’s visibility requirements that were considered during the design phase.

Figure A1.
Phase 2 container-stowage results for Bay 2.

Figure A2.
Phase 2 container-stowage results for Bay 3.

Figure A3.
Phase 2 container-stowage results for Bay 4.

Figure A4.
Phase 2 container-stowage results for Bay 6.

Figure A5.
Phase 2 container-stowage results for Bay 7.

Figure A6.
Phase 2 container-stowage results for Bay 8.

Figure A7.
Phase 2 container-stowage results for Bay 9.

Figure A8.
Phase 2 container-stowage results for Bay 10.
Appendix B
Algorithm A1 represents the pseudocode based on the methodology.
| Algorithm A1: Container Stowage Planning using Proximal Policy Optimization (PPO) |
Input:
Output:
|
| ### Phase 1: Bay Selection ### 1: Initialize policy network πθ and value network Vφ with random weights 2: For each iteration do 3: For each container i = 1 to N do 4: Observe current state s_i (bay capacities, container weights, ship’s LCG) 5: Select action a_i (choose bay) based on πθ(s_i) 6: Execute action a_i (stow container in the selected bay) 7: Compute reward r_i based on the stowage (e.g., LCG balance, bay capacity) 8: Store transition (s_i, a_i, r_i, s_i+1) in memory 9: End for ### Phase 2: Row and Tier Selection ### 10: for each container i = 1 to N do 11: Observe current state s_i (row and tier capacities, POD numbers) 12: Select action a_i (choose row and tier) based on πθ(s_i) 13: Execute action a_i (stow container in the selected row and tier) 14: Compute reward r_i based on rehandling avoidance and weight distribution 15: Store transition (s_i, a_i, r_i, s_i+1) in memory 16: End for ### Training and Optimization ### 17: Compute advantages A_i using rewards and value network Vφ 18: For each mini-batch of data do 19: Compute the ratio r = πθ(new action)/πθ(old action) 20: Clip the ratio r to [1 − ε, 1 + ε] to avoid large policy updates 21: Update policy network πθ using a clipped loss function 22: Update value network Vφ using mean squared error between predicted and actual returns 23: End for 24: Apply updates to policy network πθ and value network Vφ 25: End for |
| 26: Output the optimized stowage plan |
References
- Hong, D.H. The Method of Container Loading Scheduling through Hierarchical Clustering. J. Korea Soc. Comput. Inf. 2005, 10, 201–208. [Google Scholar]
- Park, Y.K.; Kwak, K.S. Export container preprocessing method to decrease the number of rehandling in container terminal. J. Navig. Port Res. 2011, 35, 77–82. [Google Scholar] [CrossRef][Green Version]
- Akyüz, M.H.; Lee, C.Y. A Mathematical Formulation and Efficient Heuristics for the Dynamic Container Relocation Problem. Nav. Res. Logist. 2014, 61, 101–118. [Google Scholar] [CrossRef]
- Dubrovsky, O.; Levitin, G.; Penn, M. A Genetic Algorithm with a Compact Solution Encoding for the Container Ship Stowage Problem. J. Heuristics 2002, 8, 585–599. [Google Scholar] [CrossRef]
- Zhu, H. Integrated Containership Stowage Planning: A Methodology for Coordinating Containership Stowage Plan and Terminal Yard Operations. Sustainability 2022, 14, 13376. [Google Scholar] [CrossRef]
- Chen-Fu, C.; Yu-Bin, L.; Kanchana, S.; Chia-Ching, P. Digital system for dynamic container loading with neural network-based memory exploiting hybrid genetic algorithm for carbon reduction. Comput. Ind. Eng. 2024, 191, 110149. [Google Scholar] [CrossRef]
- Chang, Y.; Hamedi, M.; Haghani, A. Solving integrated problem of stowage planning with crane split by an improved genetic algorithm based on novel encoding mode. Meas. Control 2023, 56, 172–191. [Google Scholar] [CrossRef]
- Junqueira, C.; Azevedo, A.T.; Ohishi, T. Solving the integrated multi-port stowage planning and container relocation problems with a genetic algorithm and simulation. Appl. Sci. 2022, 12, 8191. [Google Scholar] [CrossRef]
- Wang, Y.; Shi, G.; Hirayama, K. Many-Objective Container Stowage Optimization Based on Improved NSGA-III. J. Mar. Sci. Eng. 2022, 10, 517. [Google Scholar] [CrossRef]
- Parreño, F.; Pacino, D.; Alvarez-Valdes, R. A GRASP Algorithm for the Container Stowage Slot Planning Problem. Transp. Res. Part E 2016, 94, 141–157. [Google Scholar] [CrossRef]
- Wei, L.; Wie, F.; Schmitz, S.; Kunal, K.; Noche, B. Optimization of Container Relocation Problem via Reinforcement Learning. Logist. J. Proc. 2021, 2021. [Google Scholar] [CrossRef]
- Ling, Y.; Wang, Q.; Pan, L. Advancing multi-port container stowage efficiency: A novel DQN-LNS algorithmic solution. Knowl.-Based Syst. 2024, 299, 112074. [Google Scholar] [CrossRef]
- Chen, P.; Wang, Q. Learning for multiple purposes: A Q-learning enhanced hybrid metaheuristic for parallel drone scheduling traveling salesman problem. Comput. Ind. Eng. 2024, 187, 109851. [Google Scholar] [CrossRef]
- Karimi-Mamaghan, M.; Mohammadi, M.; Pasdeloup, B.; Meyer, P. Learning to select operators in meta-heuristics: An integration of Q-learning into the iterated greedy algorithm for the permutation flowshop scheduling problem. Eur. J. Oper. Res. 2023, 304, 1296–1330. [Google Scholar] [CrossRef]
- Jiang, T.; Zeng, B.; Wang, Y.; Yan, W. A new heuristic reinforcement learning for container relocation problem. J. Phys. Conf. Ser. 2021, 1873, 012050. [Google Scholar] [CrossRef]
- Shen, Y.; Zhao, N.; Xia, M.; Du, X. A Deep Q-Learning Network for Ship Stowage Planning Problem. Pol. Marit. Res. 2017, 24, 102–109. [Google Scholar] [CrossRef]
- Shin, J.Y.; Ryu, H.S. Deep Q-Learning Network Model for Container Ship Master Stowage Plan. J. Korean Soc. Ind. Converg. 2021, 24, 19–29. [Google Scholar] [CrossRef]
- Jeon, D.; Kim, G.; Lim, C.; Shin, S. Container Stowage Plan to Reduce Shifts Based on Reinforcement Learning. In Proceedings of the Korean Society of Ocean Science and Technology Conference, Jeju, Republic of Korea, 2 June 2022; pp. 515–521. [Google Scholar]
- Schulman, J.; Wolski, F.; Dhariwal, P.; Radford, A.; Klimov, O. Proximal Policy Optimization Algorithms. arXiv 2017, arXiv:1707.06347. [Google Scholar]
- Mnih, V.; Kavukcuoglu, K.; Silver, D.; Rusu, A.A.; Veness, J.; Bellemare, M.G.; Graves, A.; Riedmiller, M.; Fidjeland, A.K.; Ostrovski, G.; et al. Human-Level Control Through Deep Reinforcement Learning. Nature 2015, 518, 529–533. [Google Scholar] [CrossRef] [PubMed]
Disclaimer/Publisher’s Note: The statements, opinions and data contained in all publications are solely those of the individual author(s) and contributor(s) and not of MDPI and/or the editor(s). MDPI and/or the editor(s) disclaim responsibility for any injury to people or property resulting from any ideas, methods, instructions or products referred to in the content. |
© 2024 by the authors. Licensee MDPI, Basel, Switzerland. This article is an open access article distributed under the terms and conditions of the Creative Commons Attribution (CC BY) license (https://creativecommons.org/licenses/by/4.0/).