Article

Aerial Spray Droplet Deposition Determination Based on Fluorescence Correction: Exploring the Combination of a Chemical Colorant and Water-Sensitive Paper

1
College of Information and Electrical Engineering, Shenyang Agricultural University, Shenyang 110866, China
2
Jiangxi Dronephon Technology Co., Ltd., Nanchang 330224, China
3
Liaoning Engineering Research Center for Information Technology in Agriculture, Shenyang 110299, China
*
Authors to whom correspondence should be addressed.
Agriculture 2025, 15(9), 931; https://doi.org/10.3390/agriculture15090931
Submission received: 21 March 2025 / Revised: 8 April 2025 / Accepted: 22 April 2025 / Published: 24 April 2025
(This article belongs to the Special Issue Smart Spraying Technology in Orchards: Innovation and Application)

Abstract

:
With the rapid development of precision agriculture spraying technology, the evaluation and detection of deposition effects have gradually become research hotspots. Rhodamine-B is often used for the quantitative elution detection of droplet deposition due to its fluorescent properties. In contrast, the method of detecting droplet deposition using water-sensitive paper (WSP) is simple to operate. However, it often faces issues with measurement accuracy due to factors such as irregular droplet diffusion and the excessive hydrophilicity of the sampler material. Based on this, the study proposes a method for correcting WSP deposition assays by using the quantitative elution of chemical colorants as a baseline reference. Experiments were conducted using a DJI T30 unmanned aerial spraying system (UASS) as the spray carrier, with four types of samplers—Ginkgo biloba leaves (GBL), Malus spectabilis leaves (MS), polyvinyl chloride (PVC) cards, and WSP—fixed at nine different angles. The deposition amounts of five concentrations of Rhodamine-B stain sprayed on the samplers were then compared. The results indicate that the correction factor can be influenced by various factors, including the environment, the type of sampler, the concentration of the sprayed colorant, and the angle of the sampler. Deposition correction coefficients for WSP with different samplers were determined to be in the ranges of 1.507 to 1.547 (WSP–GBL), 1.471 to 1.478 (WSP–MS), and 1.312 to 1.391 (WSP–PVC), respectively. The study confirmed the feasibility of the proposed fluorescence-corrected aerial spray droplet deposition method, which retains the advantages of two existing typical deposition determination methods. Additionally, pre-tests should be tailored to experimental conditions, and the choice of colorant concentration should be carefully considered.

Graphical Abstract

1. Introduction

Precision agriculture is a framework designed to maximize the potential of natural, human, and mechanical resources while minimizing damage to agro-ecosystems [1]. Spraying of plant protection products (PPPs) leads to the overuse of chemicals and adverse environmental impacts [2]. Over the past decade, unmanned aerial vehicles (UAVs) for plant protection—i.e., unmanned aerial sprayers or unmanned aerial spraying systems (UASSs)—have been rapidly developing globally as a new approach to the application of PPPs, especially in East and Southeast Asian countries [3]. This has been accompanied by extensive research into UASSs, and many advances have been made. These include droplet deposition factors [4], the effect of downwash airflow [5], the effect of application height and meteorological effects [6], and the effect of UASS operation parameters on spraying efficiency [7].
Meanwhile, technologies such as variable spraying, GPS systems, and automated navigation have enabled farmers to reduce the ineffective application of chemicals, such as pesticides and fertilizers [8]. However, with improvements in the quality of life, concerns about the environmental impact of the UASS spraying process have increased. Relevant experimental studies have been carried out, such as those investigating the impacts of agricultural UASSs on the environment, bystanders, and inhabitants [9]; UASS spray drift and environmental impacts [10]; the use of autonomous UASS to reduce drift in orchards [11]; and the use of remote sensing to measure and reduce droplet drift [12], among others. Unsurprisingly, the attention of most researchers has been focused primarily on how to minimize the environmental impact of UASS spraying, while the research process itself, a potential cause of environmental pollution, is often easy to overlook.
Studying the effect of spraying droplets is inherently complex, and current detection methods are typically categorized into invasive and non-invasive techniques. Invasive methods include the use of samplers such as water-sensitive paper (WSP) and slides to measure droplet deposition through color development or elution [13]. Ahmad et al. [14] compared the effectiveness of two samplers, WSP and slides, for droplet deposition collection. In contrast, non-invasive detection methods are based on high-precision instruments such as particle image velocimetry (PIV) and machine learning techniques to process images and obtain droplet spraying parameters. Given that the accuracy of measurement data from non-invasive methods needs to be improved and that these devices are not easy to use in real operational sites, the use of invasive methods for spray droplet detection is currently the main choice for most researchers. For example, Chen et al. [15] used WSP to determine canopy droplet deposition in apple trees, while Li et al. [16] used WSP with filter paper to assess UASS spray deposition in almond trees for application evaluation.
WSP, as a typical invasive assay sampler, is a special type of paper coated with bromocresol blue, which has a yellow surface that turns blue when exposed to water [17]. It is a widely used tool for assessing droplet deposition, allowing for the quick detection of droplets [18,19] and visualization of the distribution and concentration of droplets, and is non-polluting to the environment. However, it has certain disadvantages, such as droplets being too small to be visible on WSP [20], and is suitable only for qualitative analysis; there is difficulty in detecting droplets with diameters less than 50 μm [21], and the results of droplet deposition determination are on the larger side [22], among other issues.
Compared to droplet collection using WSP, accurate droplet deposition results can be obtained by eluting leaves or samplers and measuring the amount of colorant with a spectrophotometer. For example, Brilliant Blue dye FC (food coloring Brilliant Blue) was used for elution to verify the deposition and biological effects of Glufosinate ammonium [23]; four colorants, namely, Lemon Yellow 85, Temptation Red, Ponceau 2R, and Methylene Blue, were used to analyze the influence of foliar wettability on droplet settlement in oilseed rape leaves [24] and Rhodamine-B (RB) was used to determine pesticide spray distribution [25], among others. However, the disadvantages of the elution method are its complexity, low efficiency, and the higher cost of related equipment.
Among them, RB, as one of the representatives of water-soluble colorants, has higher fluorescence detection accuracy compared to other colorants and is often used for aerial spray deposition detection due to its high recovery rate and ease of detection [10]. However, RB is also a typical organic colorant contaminant [26]. It has been shown that RB can accumulate in organisms, disrupting the endocrine system, impairing fertility, and causing genetic damage [27]. At the same time, the hazards of using RB spray and the subsequent elution analysis on soil and water sources are real. Therefore, it is worth studying how to combine the advantages of existing sampling methods, such as WSP and chemical colorant, to reduce the environmental pollution caused by the experiment process while effectively ensuring the accuracy of droplet deposition detection and finding a reasonable “trade-off” method.
From the above explanation, it can be seen that fluorescent colorants like RB can accurately measure droplet deposition, but the environmental pollution caused by the spraying process should not be underestimated. Currently, some researchers have recognized this issue and are trying to find ways to use WSP instead of colorant spraying and to improve the accuracy of WSP measurements. For example, Witton et al. [28] corrected the amount of droplet deposition measured by WSP based on the precise pesticide residues obtained by eluting apple leaves. The results showed that the method was cost-effective, efficient, and a viable alternative compared to traditional methods. However, the study only conducted a preliminary exploratory experiment, and further research is needed on factors that may affect the correction results, such as the sampler angle, type, and spray concentration of the chemical colorant. Other studies have also confirmed that there are many factors affecting the accuracy of WSP calibration, and that different crop species, colorant concentrations, sampler types, leaf angles, and other variables may impact deposition results [22].
It should also be noted that the elution recovery of the sampler is an important factor affecting the accuracy of colorant-based assays. Different experiment environments, samplers, elution methods, and applied chemicals can all impact the elution recovery. Khot et al. [29] found that exposure of fluorescent colorants to sunlight may lead to non-significant evaluations in field trials. You et al. [30] found that elution recoveries varied greatly between samplers. However, a further review of the literature revealed that some studies do not explicitly or accurately determine the key parameter of elution recovery. Most of them directly quoted the elution recovery from other studies, which may lead to significant errors in the measured droplet deposition results due to differences in the applicable scenarios. Therefore, the influence of colorant elution recovery on experiment results must also be carefully considered when conducting studies.
Based on the above status, in order to ensure the sustainability of droplet deposition detection experiments, this study aims to propose a method that minimizes the environmental pollution caused by the experiment process while ensuring the accuracy of droplet deposition measurement, and to provide the range of the corresponding calibration parameters. The results of this work are expected to reduce the use of chemical colorants, such as RB, and to offer methodological references and data support for protecting the environment in the practice of droplet spraying by UASSs. The specific aims of this study are:
(1)
An experiment method is proposed that ensures the measurement accuracy of droplet spraying operations, enables the use of existing deposition measurement techniques instead of colorant deposition measurement, and reduces the environmental pollution caused by the experiment process.
(2)
Based on the proposed method, validation experiments are conducted in real application scenarios to confirm the feasibility of this study, with a view to providing data references for related UASS aerial spraying detection and analysis.

2. Materials and Methods

This study consisted of a pre-test and a field spraying experiment. The pre-test involved nozzle performance measurement and elution recovery measurement. Based on the pre-test, the field spraying experiment further measured and compared the droplet sampling effects of different samplers under various conditions.

2.1. Parameters of Unmanned Aerial Spraying Systems

DJI T30 (Shenzhen DJI Technology Co., Ltd., Shenzhen, China) six-rotor unmanned aerial spraying system (UASS) was used for field spraying trials. The total weight of the UASS is 36.5 kg (unloaded with battery), and its dimensions are 2858 mm × 2685 mm × 790 mm (distances between tips of the propellers). The UASS is equipped with a 30 L quick-draw tank and 16 SX110015VS aerial spray nozzles (Shenzhen DJI Technology Co., Ltd., Shenzhen, China) mounted symmetrically under the 6 rotors. It is worth noting that the UASS is equipped with 4 nozzles under each of the front and rear rotors, and 2 nozzles under each of the remaining rotors.

2.2. Pre-Test

The performance parameters of 12 SX110015VS aerial nozzles were measured in the pre-test. The set single nozzle flow rate was consistent with the actual spraying flow rate of the UASS, which was 0.465 L/min. In addition, the elution recoveries of 3 samplers, Ginkgo biloba leaf (GBL), Malus spectabilis leaf (MS), and polyvinyl chloride (PVC) card (20 mm × 80 mm, Wenzhou Yutuda Building Materials Trading Co., Ltd., Wenzhou, China), under 5 concentrations of (0.1 g/L, 0.5 g/L, 1.0 g/L, 5.0 g/L, and 10.0 g/L) the chemical colorants RB (Anhui Zesheng Technology Co., Ltd., Anqing, China) spray were also determined.

2.2.1. Measurement of Spray Nozzle Atomization Performance

DP-02 laser diffraction device (Zhuhai OMEC Instruments Co., Ltd., Zhuhai, China) was used for the determination of atomization performance of 12 DJI SX110015VS spray nozzles. The experiment consisted of 12 treatment groups (N1 to N12), each repeated five times under identical conditions to minimize the influence of experimental error on the results. The spraying flow rate was set at 0.465 L/min.
For this study, although the UASS was equipped with 16 nozzles, only 12 nozzles were subjected to atomization performance measurement. This is because the system automatically turned off the 4 nozzles at the front in the forward direction due to the flow rate setting during the spraying operation. The nozzle flow rate calculation formulas are shown in Equations (1) and (2):
F A L L = V U A S S × S P A × T S × D M E D × 10000
F S I G = F A L L N N O Z
In Equation (1), FALL is the total flow rate of the nozzle (L/min), VUASS is the flight speed of the UAV (m/s), SPA is the spraying width (m), TS is a constant indicating 60 s (s/min), and DMED is the amount of medicinal liquid used per hectare (L/hm2). In Equation (2), FSIG is the flow rate of each spray head (L/min) and NNOZ is the number of operating spray heads in the experiment.
The laser diffraction device was placed horizontally on both sides of the bench, with the transmitter and receiver ends 120 cm apart and the spray nozzle located 30 cm directly above the laser so that the laser passes vertically through the spray plume (Figure 1).
Parameters for evaluating the atomization performance of the nozzle include Dv0.1, Dv0.5, Dv0.9, V<150 (%volume), V<200 (%volume), V<250 (%volume), spread value (SV), and relative span (RS). Dva represents the droplet size from small to large, accumulated to (a × 100)% of the total droplet volume. Among them, Dv0.5, also known as volume median diameter (VMD), is often used to characterize the droplet size. V<150 (%volume), V<200 (%volume), and V<250 (%volume) represent the percentage of cumulative spray volume corresponding to droplet sizes less than 150 µm, 200 µm, and 250 µm, respectively. SV indicates the difference between repeated measurement results within the same group of experiments. The smaller the SV, the smaller the difference between repeated experiment results within the same group of experiments on the surface. It is calculated as follows:
S V ( % ) = D max D min D m e a n × 100 %
In Equation (3): SV is the diffusion value, Dmax is the maximum value of Dva, Dmin is the minimum value of Dva, and Dmean is the average value of Dva.
RS is used to characterize the uniformity of the spray droplets applied by the nozzle. A smaller RS indicates better uniformity of the droplets. It is calculated as follows:
R S = D v 0.9 D v 0.1 D v 0.5
The droplet size classification (DSC) is based on the ASABE Standard S572.3 [31] and the median diameter of the droplet volume is classified into 8 classes (Table 1).

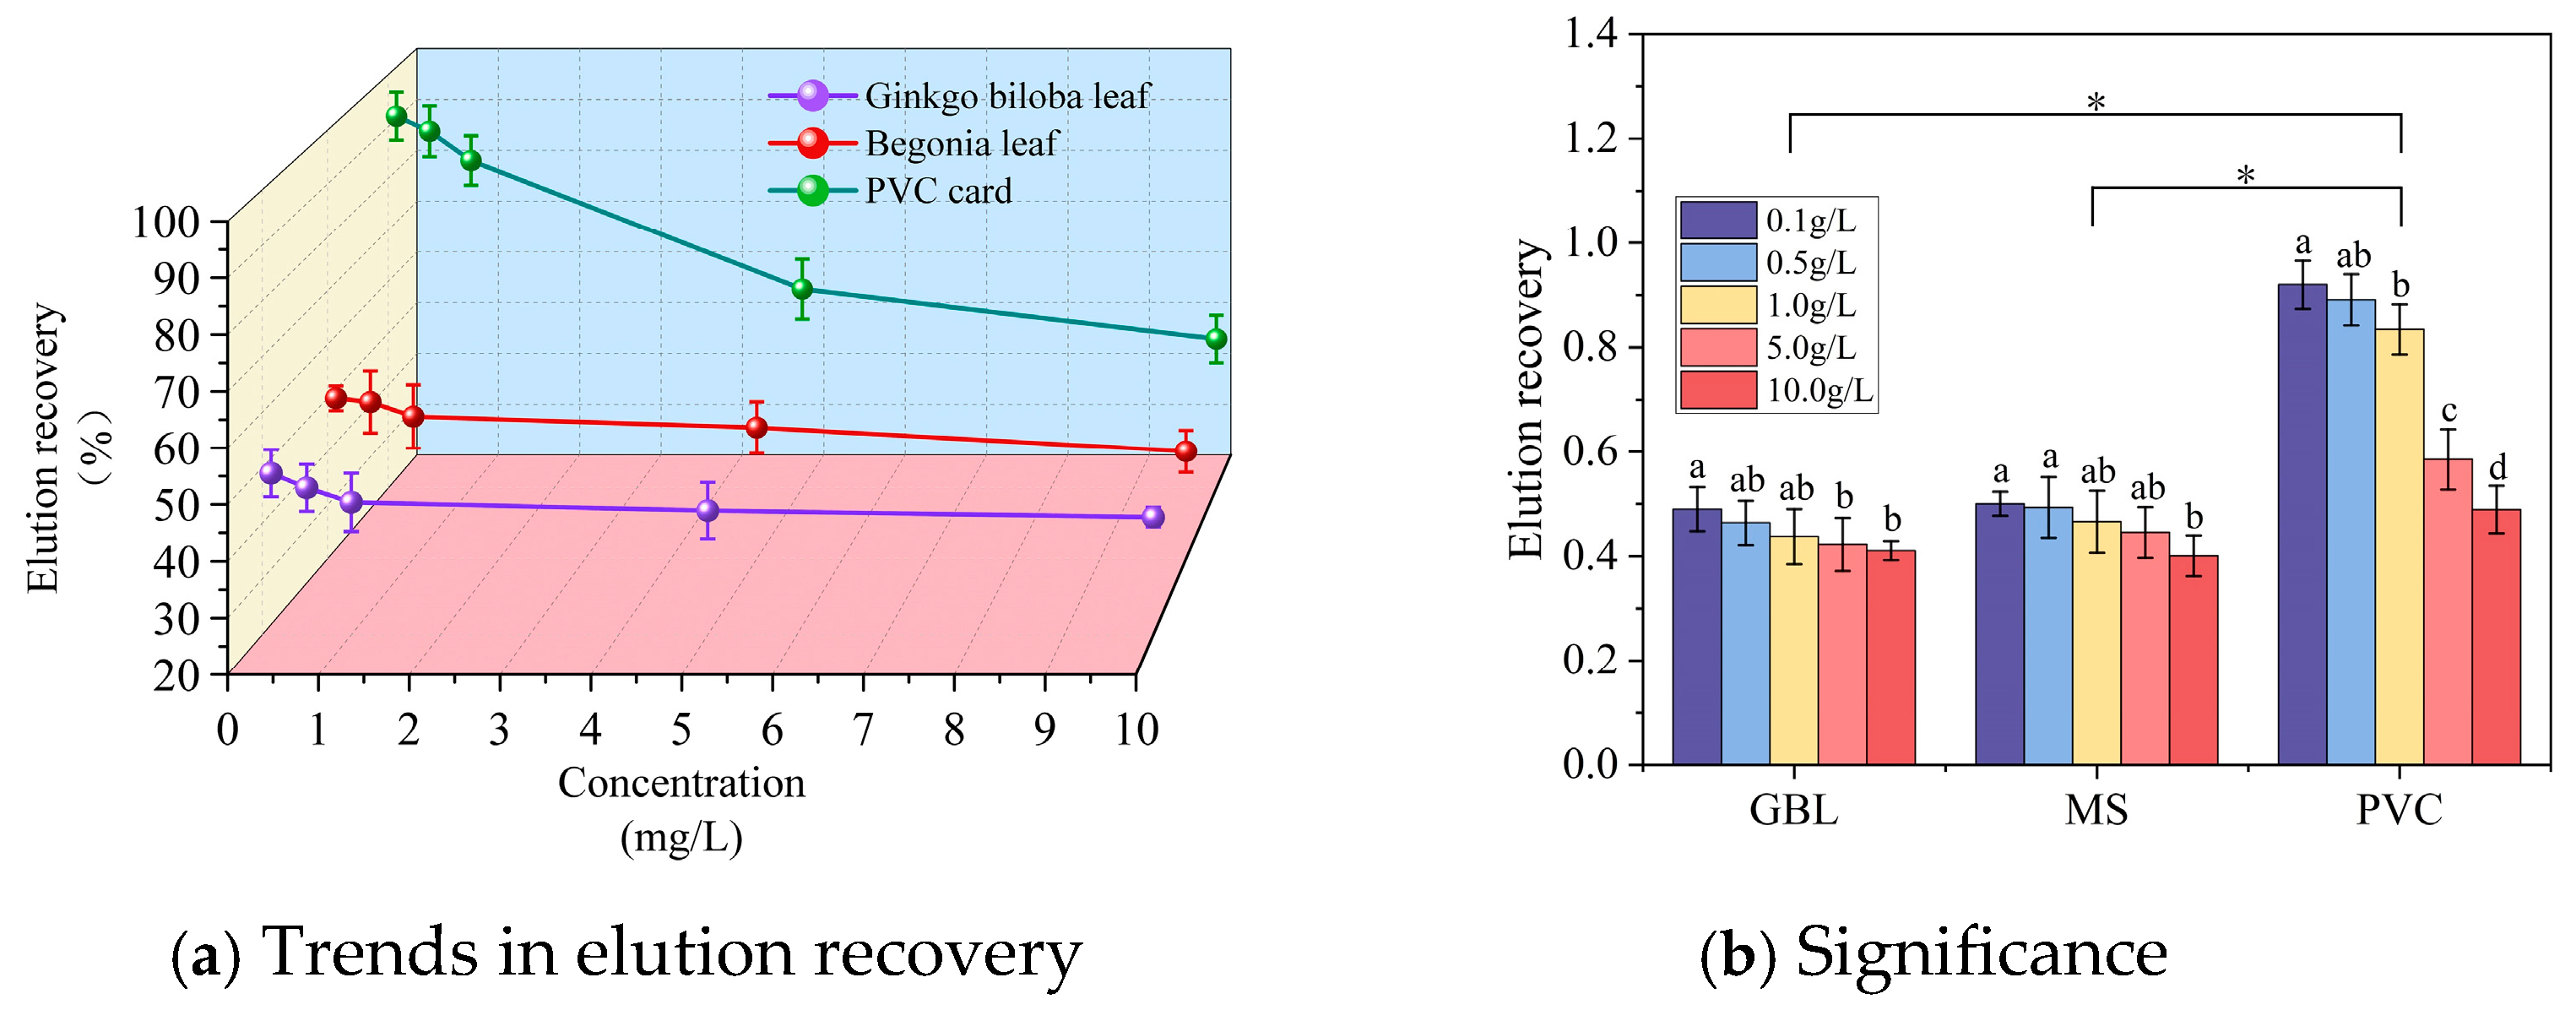
2.2.2. Determination of Elution Recovery

Different concentrations of the chemical colorant RB solution were used in the experiment. A total of 4 types of samplers were used for droplet deposition acquisition: WSP (26 mm × 76 mm, Syngenta, Basel, Switzerland), GBL, MS, and PVC card (20 mm × 80 mm, Wenzhou Yutuda Building Materials Trading Co., Ltd., Wenzhou, China).
Before the determination of the elution recovery, the standard absorption curve of RB solution was measured as T c o n = 0.001002 × F c a l 0.005933 (Tcon is the concentration of solution, mg/L; Fcal is the intensity of fluorescence value) using a fluorescence spectrophotometer (F-380, Tianjin Gangdong Science and Technology Co., Ltd., Tianjin, China), and R2 = 0.9992. Fluorescence measurements were performed in an indoor laboratory, which was free of wind and shaded from outside light. The elution recoveries of the chemical colorant were calculated as follows:
R = C w C g × 100 %
In Equation (5), Cw is the mass concentration of the elution solution and Cg is the reference concentration of the recovery solution.
The study simulated the actual droplet detection scenario of the field spraying experiment to determine the elution recoveries of 3 samplers (GBL, MS, and PVC card) under 5 treatments with the fluorescent colorant RB at 5 concentrations, using the setup shown in Table 2. The concentration gradients were set at 0.1 g/L, 0.5 g/L, 1.0 g/L, 5.0 g/L, and 10.0 g/L. The experiment was set up with five treatment groups from E1 to E5, and 4 replications were set for each group. The specific operations were as follows:
(1)
Using a pipette (Beijing Dalongxingchuang Experimental Instrument Co., Ltd., Beijing, China), 5 concentrations (0.1–10.0 g/L) of RB solution were added uniformly to the 3 samplers (GMS, MS, and PVC card). The samplers were then placed at 30 °C, away from wind and direct sunlight, for 180 s. The samples were subsequently washed 3 times with distilled water, and the fluorescence value of each concentration was determined using a fluorescence spectrophotometer.
(2)
The samplers were placed into sealed bags and eluted 3 times with distilled water. The fluorescence value of the eluate was measured using a fluorescence spectrophotometer, with 4 replicates for each concentration.
(3)
The concentration of the chemical colorant RB, sampler type, and deposition results were analyzed for significance at the p < 0.05 level.
Table 2. Elution recovery measurement experiment.
TreatmentConcentration (g/L)RepetitionTypes of SamplersElution FrequencyStanding Time (s)
E10.1433180
E20.5433180
E31.0433180
E45.0433180
E510.0433180
Note: The 3 samplers in the table are: GBL, MS, and PVC card.

2.3. Field Spraying Experiment

2.3.1. Experiment Site and Meteorological Conditions

The experiment was conducted on level grassland at Shenyang Agricultural University (41°49′31″ N, 123°34′14″ E), Shenyang City, Liaoning Province. An NK5500 weather station (Nielsen-Kellerman, Boothwyn, PA, USA) was used for meteorological data collection. The weather station measured wind speed, wind direction, and air temperature with a sampling frequency of 0.5 Hz. It was found that the average wind speed during the measurement period ranged from 0 to 1.2 m/s, with no maximum gusts exceeding 2.0 m/s. The temperature ranged from 30.6 to 35.1 °C, which was suitable for UASS spraying operations.

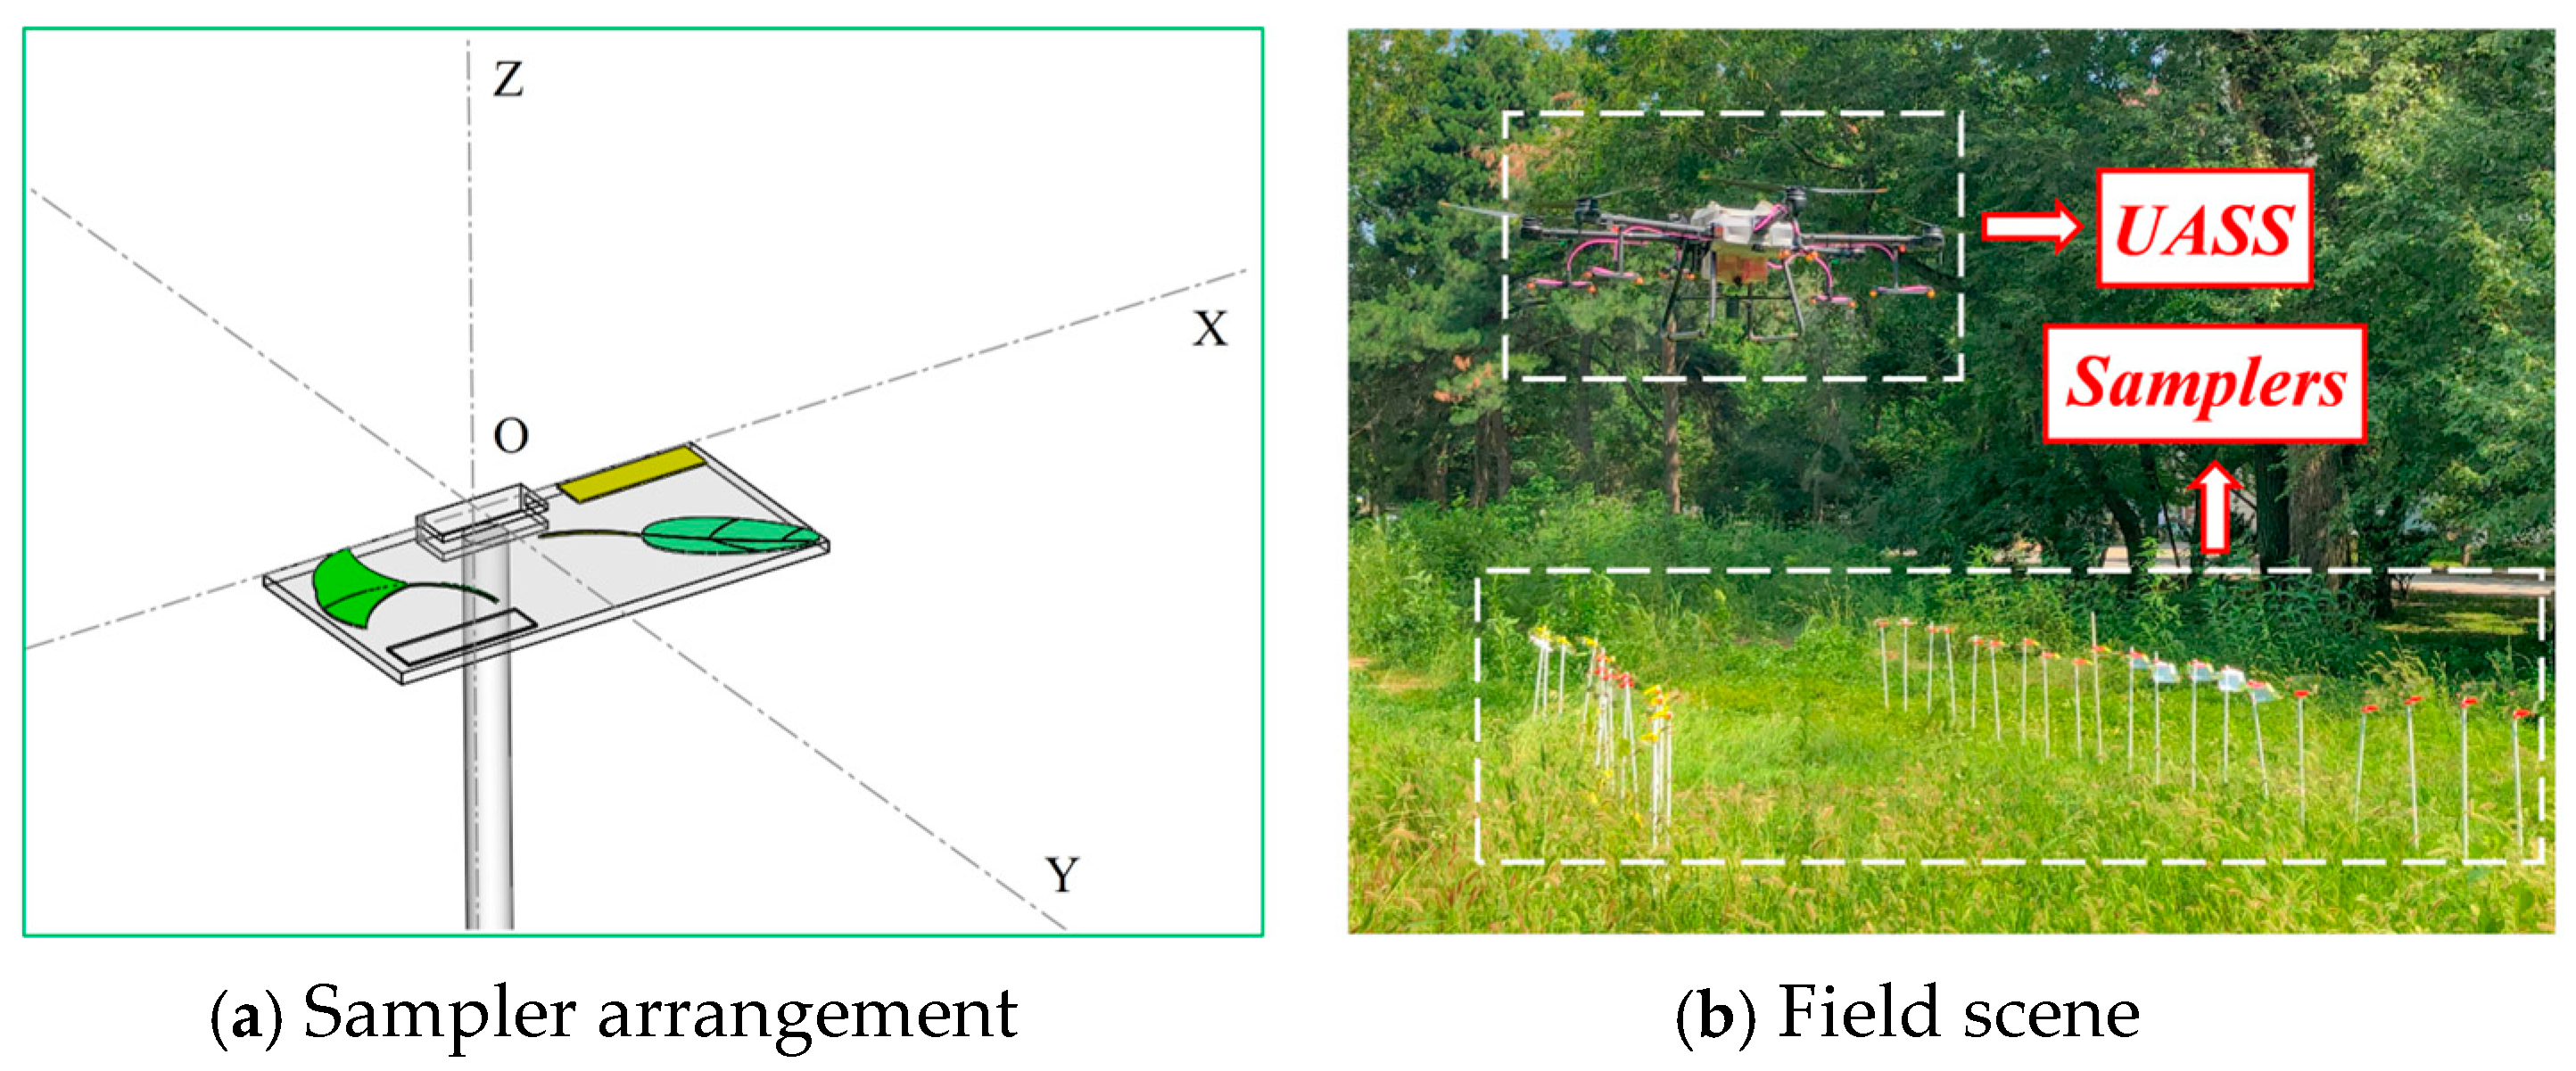
2.3.2. Experimental Setup

As shown in Table 3, the field experiment included 5 treatments (T1–T5), with the RB solution concentration (0.1–10.0 g/L) sprayed by UASS being the same as in the pre-test. The sampler was positioned at angles of 0°, A ± 30°, A ± 60°, B ± 30°, and B ± 60°, resulting in 9 different angle settings, with each treatment replicated 5 times. After each treatment, the tank, pipe, and spraying kit of UASS were cleaned promptly.
Figure 2 showed the schematic diagram of the field spraying experiment. The site was divided into 9 identical rectangular plots. A total of 45 sampling points were set up in 3 rows and 15 columns along the center line of the rectangular plots, with an interval of 0.5 m between points. The PVC plate used to fix the sampler was supported by a PP-R pipe, which was installed vertically in the ground. The length of the underground portion of the PP-R pipe was 0.2 m, and the length of the above-ground portion was 1 m. The UASS flew back and forth along the planned path.
During the spraying operation, the flight altitude of the UASS was set to 3 m, the spraying width to 5 m, and the controlled spraying volume to 30 L/hm2. Due to the low flow rate setting, only 12 nozzles were turned on to meet the spraying requirements, and the 4 front nozzles facing the forward direction of the UASS were always turned off. To avoid repetition of spraying angles, the OY axis of the PVC plate was aligned with the forward direction of the UASS (Figure 3).
As shown in Table 4, each sampler was set to simulate the blade at 9 angles (M1 to M9), and the 4 samplers were fixed on a PVC plate without obstructing each other. The samplers were rotated around the OX axis (noted as A) and the OY axis (noted as B), with clockwise rotation around the axis indicated as (−) and counterclockwise rotation as (+). The angle of the horizontal plane where the OXY axis is located is noted as 0°.

2.4. Experiment Data Processing

After each spraying experiment, the droplets were allowed to dry for 180 s, and then the 4 types of samplers were recovered in sequence. The collected WSPs were scanned one by one using a scanner (Seiko EPSON Corp, Suwa, Nagano, Japan). In this study, the WSPs were processed using the Deposit Scan software (https://www.ars.usda.gov/midwest-area/wooster-oh/application-technology-research/engineering/depositscan/, accessed on 1 April 2025) from the U.S. Department of Agriculture (USDA), which allowed us to obtain deposition parameters such as the amount of fog droplets deposited at the corresponding sampling points, as well as the droplet size of the droplets (Dv0.1, Dv0.5, and Dv0.9). Deposit Scan is a software program that enables rapid analysis of droplet deposition distribution on samplers such as water-sensitive paper or Kromekote cards and is widely used to assess the quality of pesticide droplet deposition on spray targets [32].
The elution methods for the GBL, MS, and PVC cards were the same as those used in the pre-test, and the concentration of the eluent for each sampler was determined separately using a fluorescence spectrophotometer. The corresponding leaves were placed in an HWS-250 constant temperature and humidity culture cabinet (Zhejiang Tuopuyunnong Technology Co., Ltd., Hangzhou, China). After the surfaces of both GBL and MS leaves were dried, the leaves were removed and their areas were measured using the YMJ-S leaf area meter (Shandong Laing Photoelectric Technology Co., Ltd., Weifang, China), while the area of the PVC card was fixed at 16 cm2.
The formulas for calculating spray deposition on various droplet collectors are shown in Equations (6)–(9), and the deposition amounts were measured on the samplers obtained from the tests.
S y = T c o n × V w N s p r a y × A c o l
F lit = X s m p l Z b l k
T c o n = 0.001002 × F c a l 0.005933
S y % = S y M v / 100 × 100
S y c = S y R
In Equation (6), Sy is the amount of droplet deposition per unit area (μL/cm2), Tcon is the concentration (mg/L), Vw is the volume of eluent added (mL), Nspray is the concentration of sprayed chemical colorant (g/L), and Acol is the area of the sampler (cm2). In Equation (7), Flit is the measured fluorescence value, Xsmpl is the fluorescence value of the sampler, and Zblk is the fluorescence value of the blank. Equation (8) is derived from the absorption curve of the gradient concentration solution of the fluorescent colorant used with the fluorescence spectrophotometer. In Equation (9), Sy is the deposition rate (%) and Mv is the volume of drug applied (L/m2). In Equation (10), Syc is the amount of droplet deposition per unit area obtained by calculating the elution recovery rate and R is elution recovery (%).

2.4.1. Optimal Concentration Selection for Chemical Colorant

Based on the pre-test, correlation analysis, multivariate comprehensive linear fitting analysis, and coefficient of variation analysis were performed on the results of the measured droplet deposition amounts to determine the optimal concentration of chemical colorant RB. Each method is described as follows:
(1)
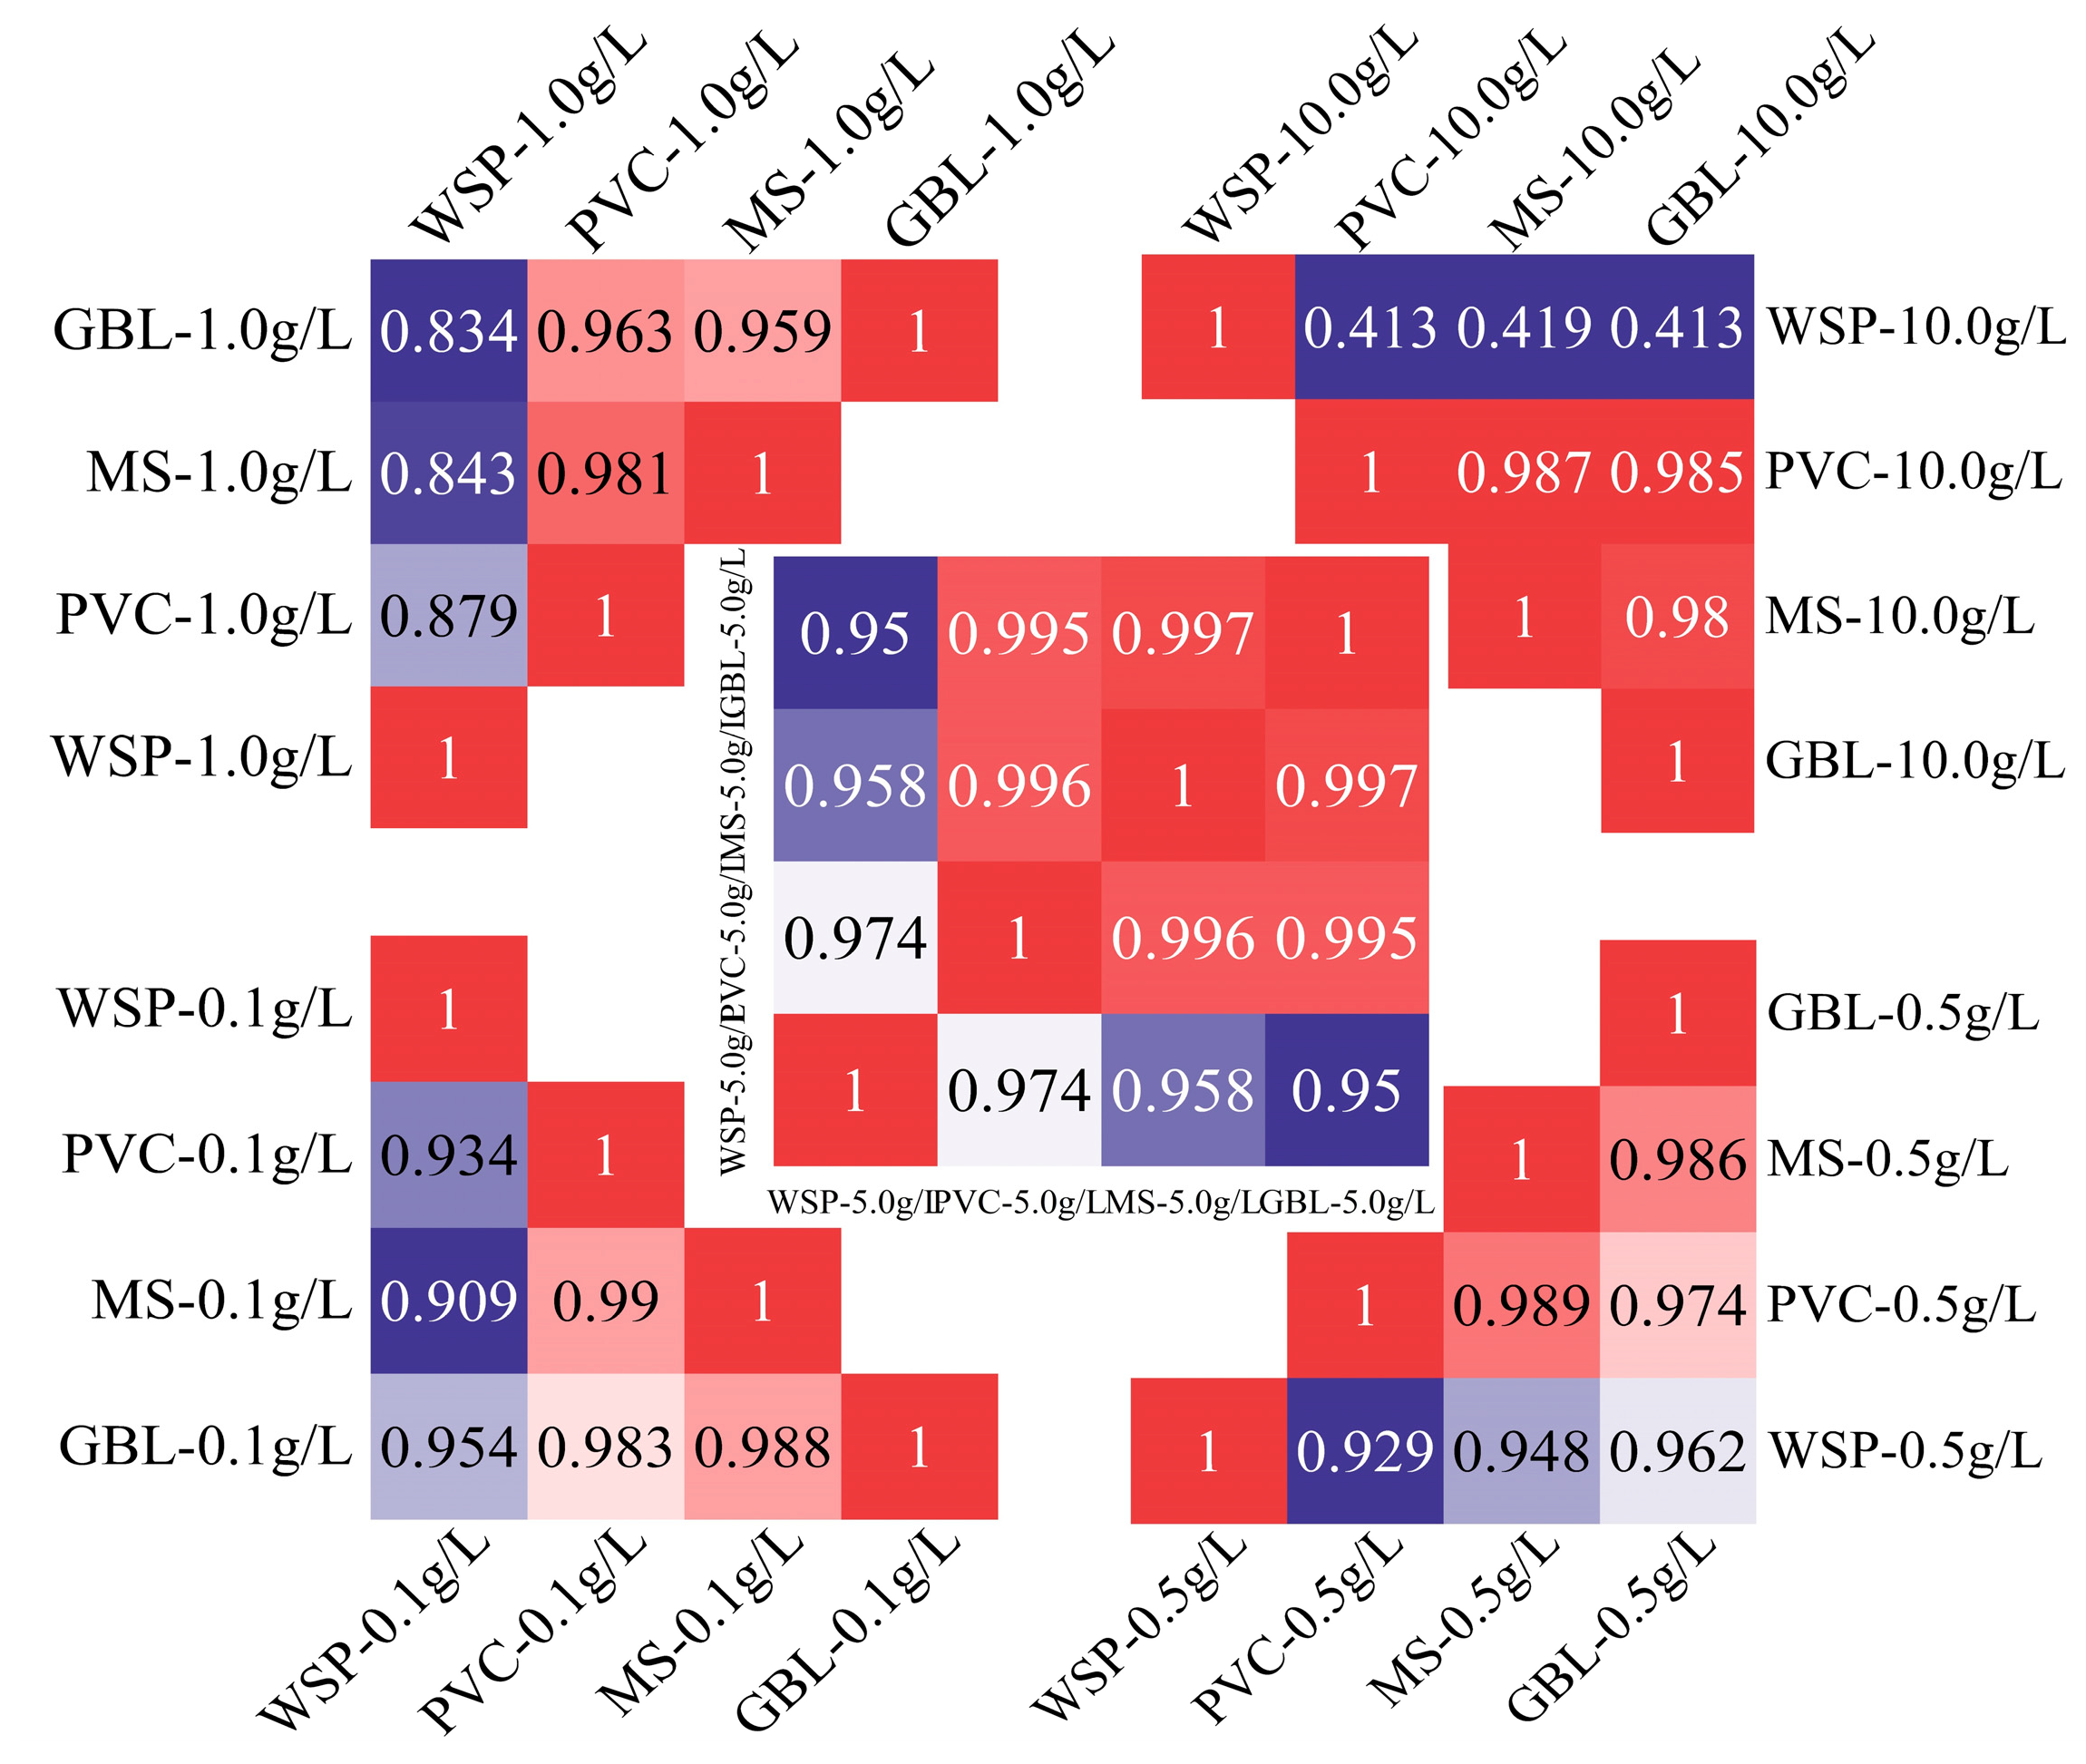
Correlation analysis was conducted on the measured droplet deposition amounts from the 4 samplers and the concentration of the RB spraying solution, using data that conform to a normal distribution.
(2)
Linear fitting was performed on the ratio of the WSP to the mean deposition values measured by the 3 samplers, based on the concentration of the RB spraying solution across 5 colorant concentrations and 9 angle settings.
(3)
The coefficient of variation was calculated for the deposition amounts measured by the 3 samplers and the WSP, based on the concentrations of the 5 colorant RB spraying solutions at 9 angles. A smaller coefficient of variation indicates a more uniform distribution of droplet deposition. The formulas for the coefficient of variation and standard deviation are presented in Equations (11) and (12), respectively.
C V = ( S / X ¯ ) × 100 %
S = i = 1 n X i X ¯ 2 / n 1
In Equation (11), S is the standard deviation of the samples collected by the droplet sampler at the same angle and Xi is the amount of droplet deposition measured by the sampler at each sampling point, μL/cm2. In Equation (12), X ¯ is the average droplet deposition measured by the sampler at the same angle, μL/cm2 and n is the number of sampling points in each group.

2.4.2. Droplet Deposition Analysis

Based on the data for the optimal RB spraying concentration, the amount of droplet deposition in the experimental data was analyzed using 3 methods: quotient value, integral value, and linear fitting, as follows:
(1)
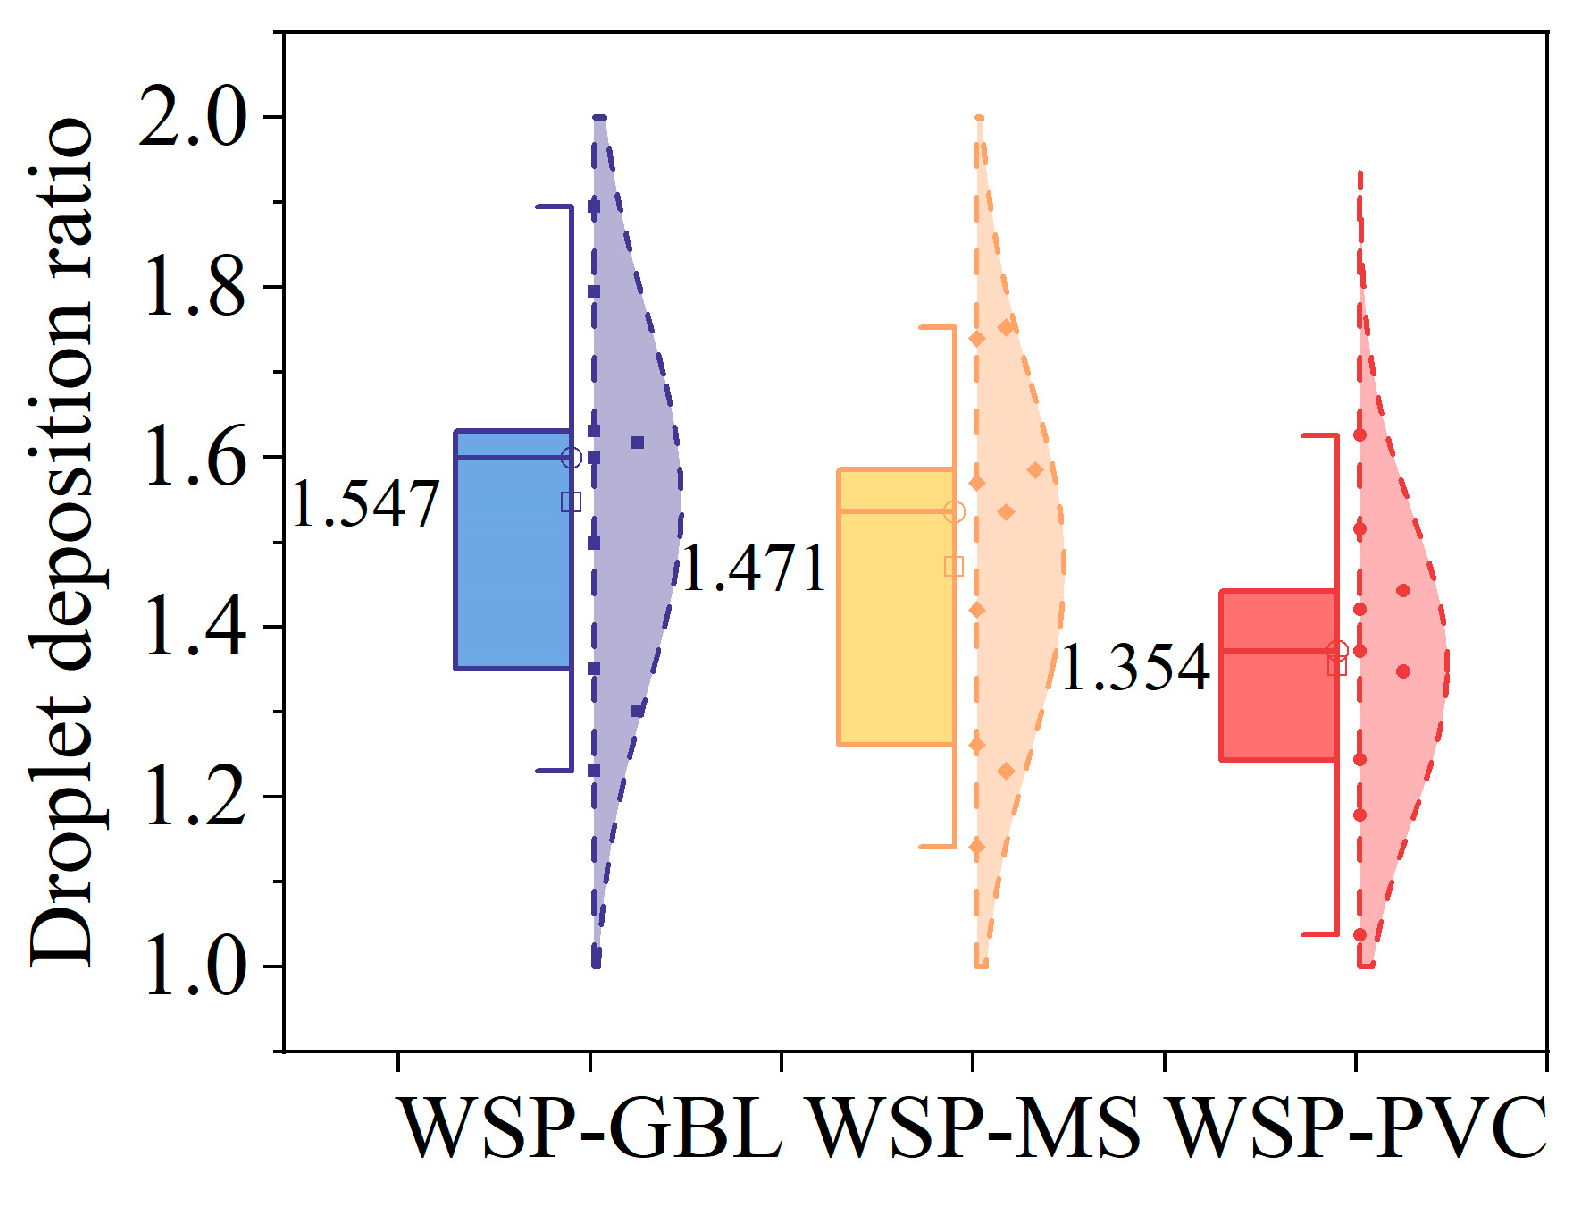
Quotient value. The optimal RB spraying concentration was used in the experiment, and the average deposition amount results of the 4 samplers at 9 angles were calculated. The quotient of the average droplet deposition amount between the WSP and each of the 3 samplers at each angle was then computed to determine the proportionality of droplet deposition among the samplers.
(2)
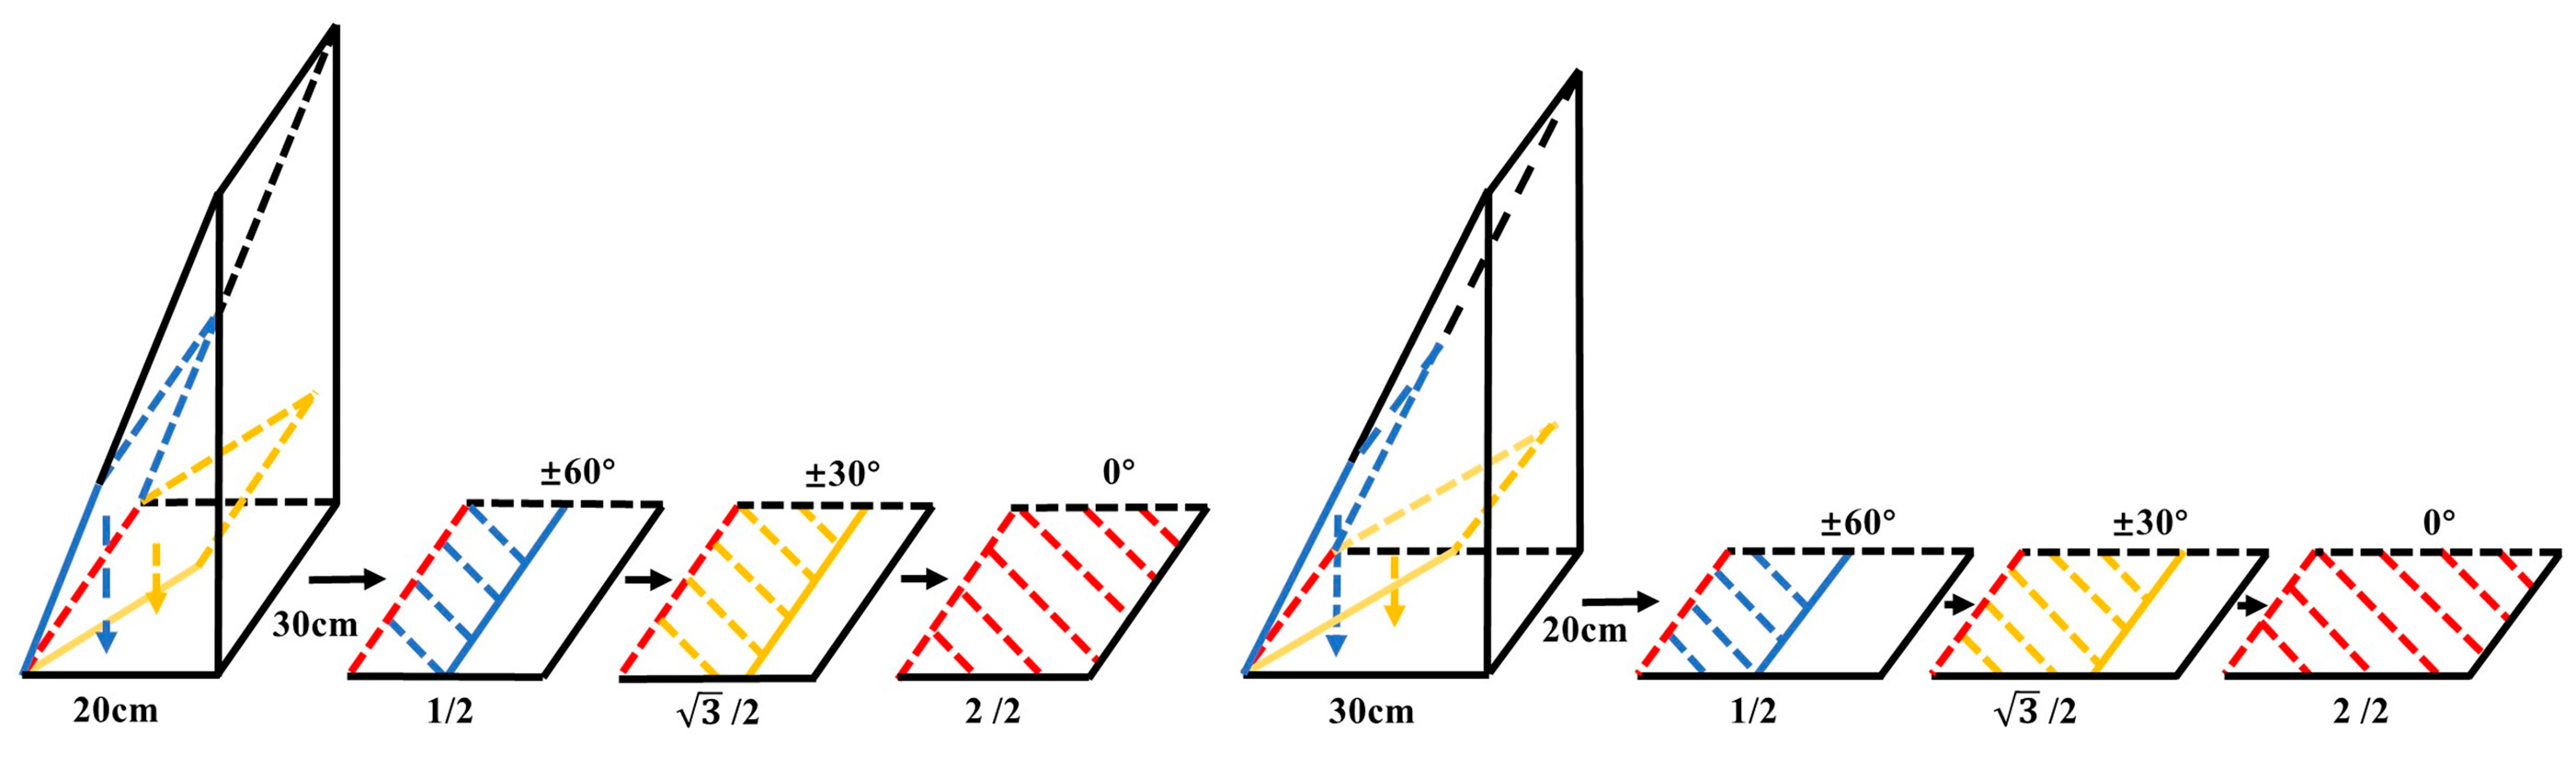
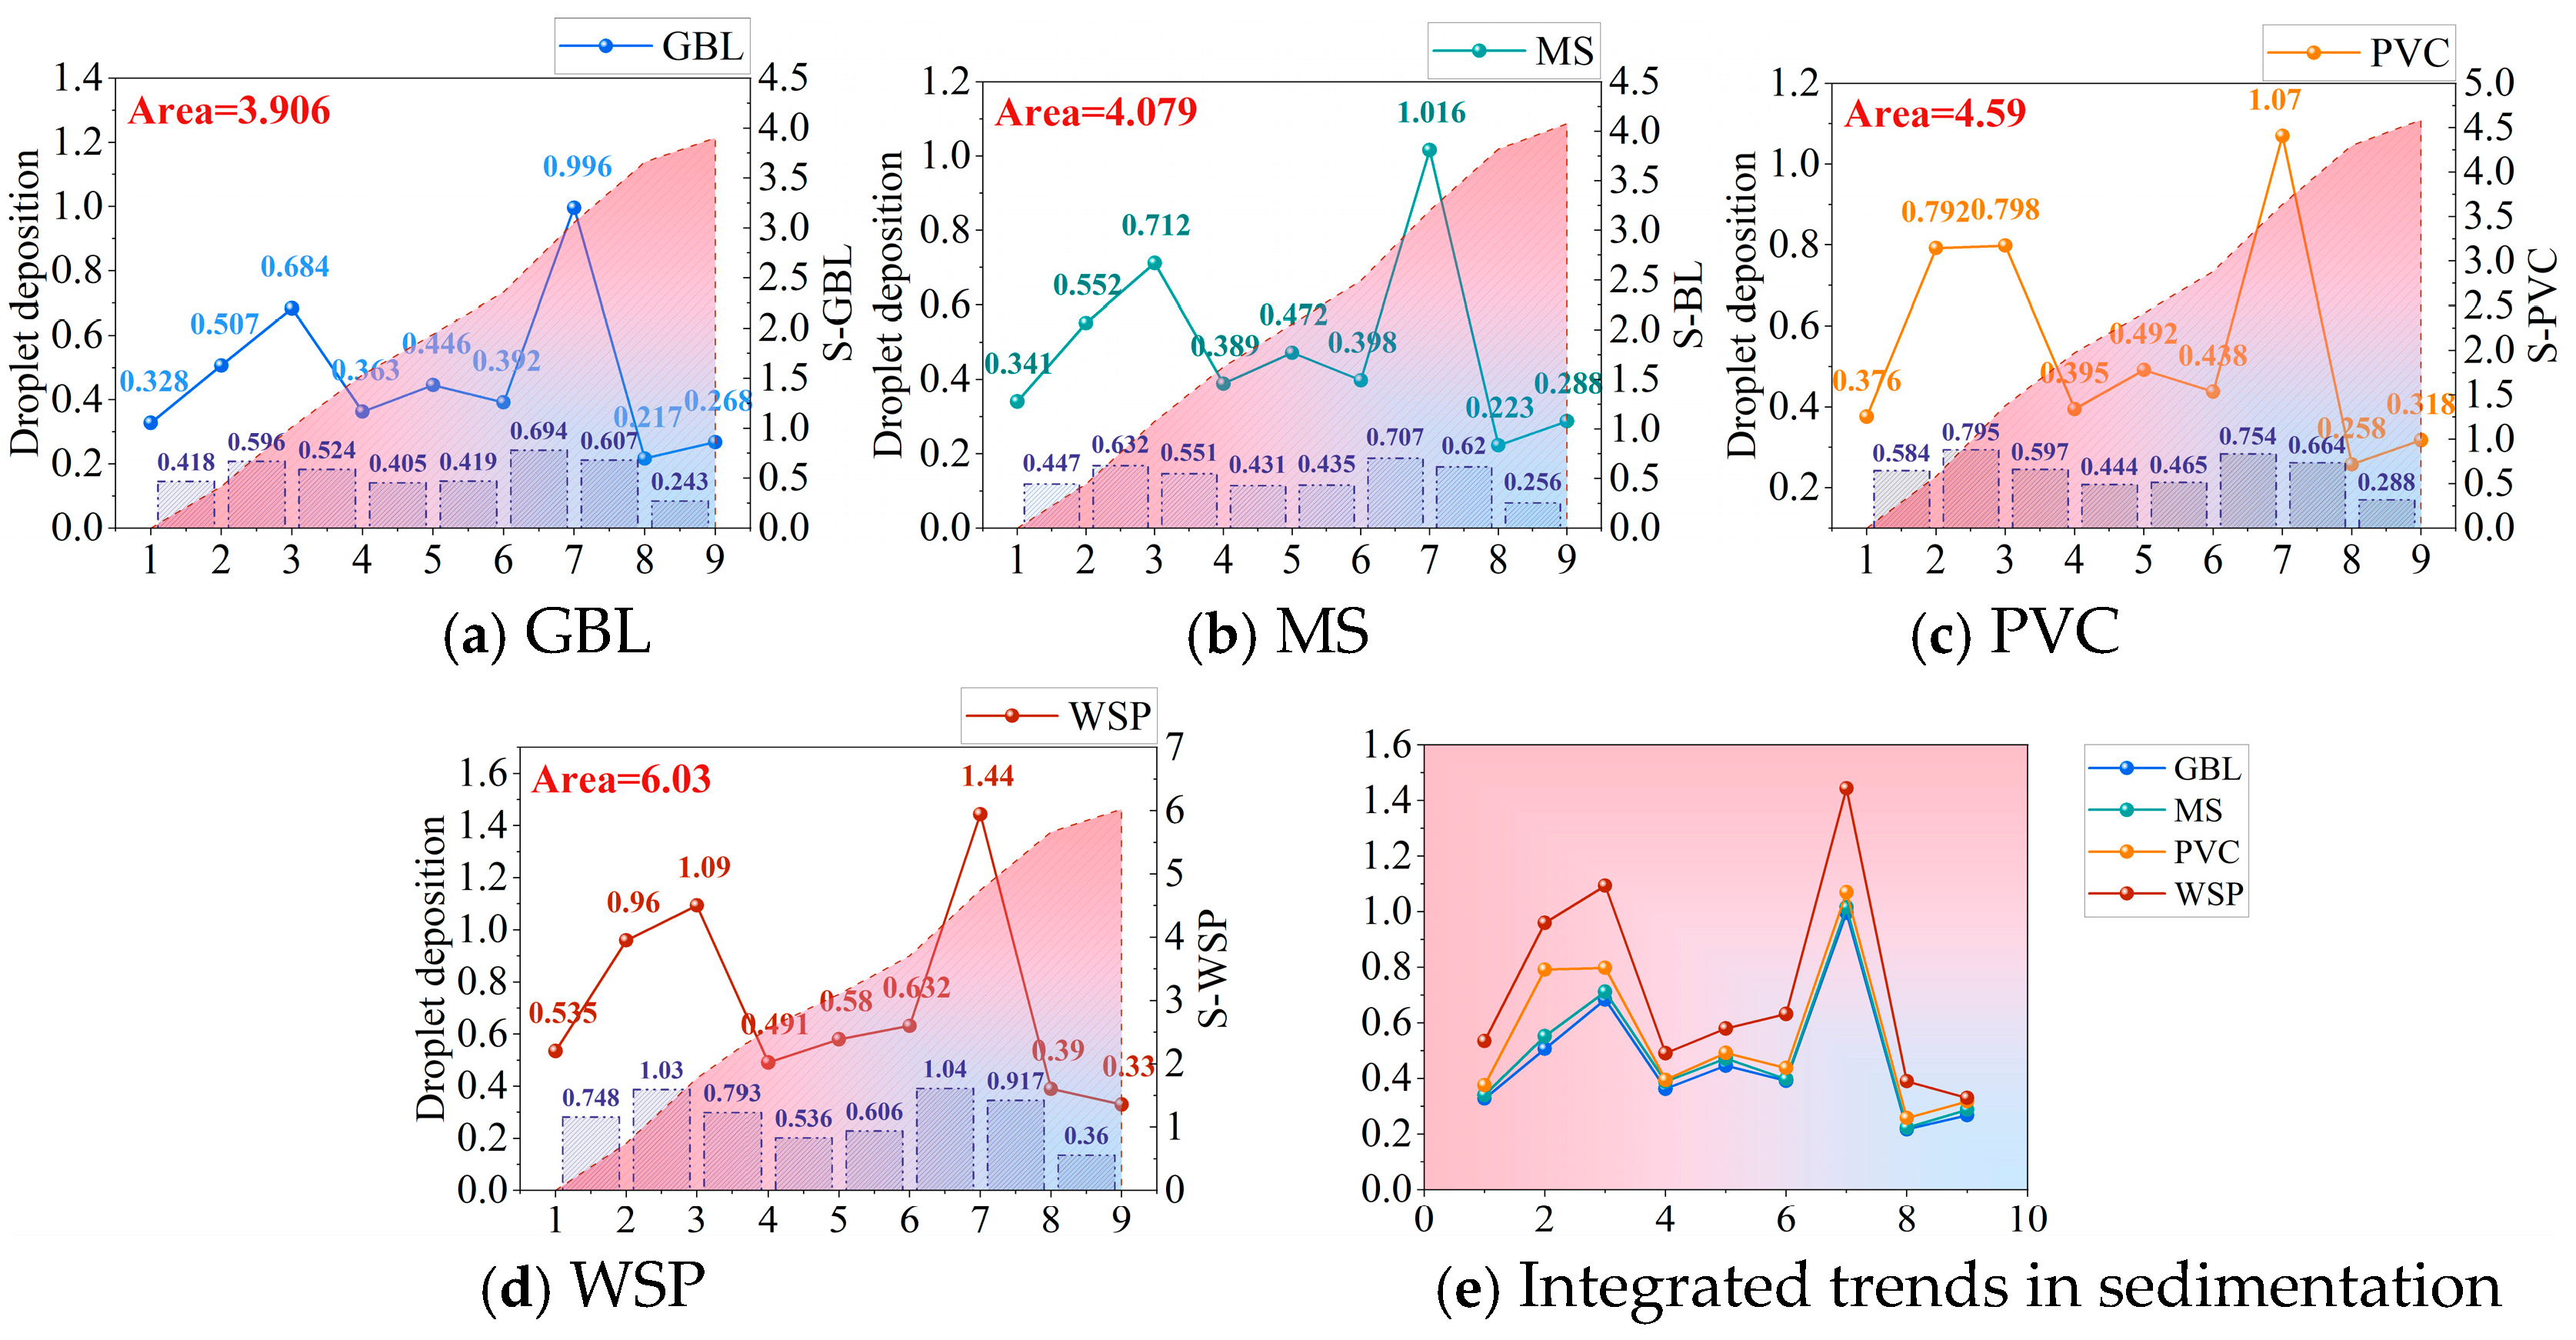
Integral value. The projection of the droplet deposition amount was calculated onto the horizontal plane (Figure 4). We then determined the proportionality between the WSP and the droplet deposition amounts of the 3 samplers based on the area enclosed by the projection and the coordinate axes.
(3)
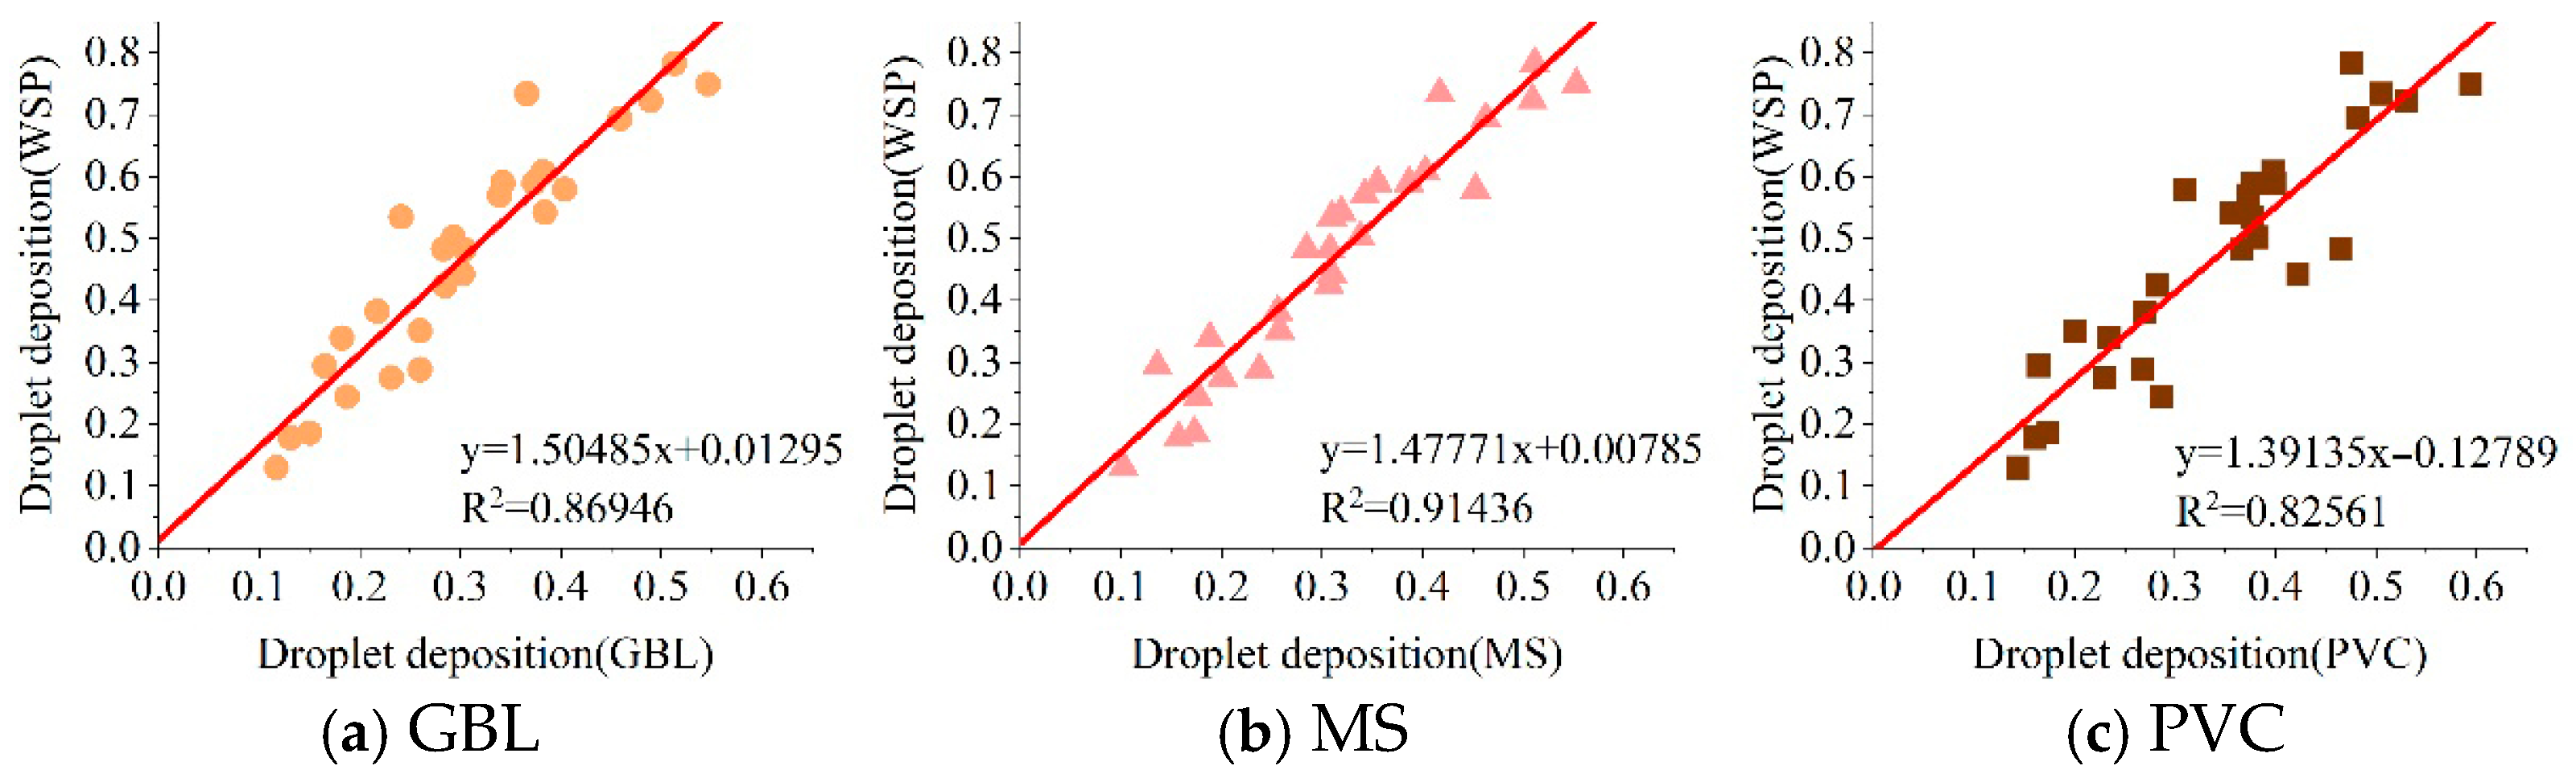
Linear fitting. Based on the optimal RB spray solution concentration, a linear fit was performed on the spray deposition volume results for WSP and the other 3 samplers at 9 angles to determine the proportionality of the droplet deposition volumes among the 3 samplers. Additionally, the deposition volume results for WSP and the 3 samplers at 9 angles were individually fitted, resulting in 27 sets of results that describe the proportionality relationship between WSP and each of the 3 samplers in terms of droplet deposition.

2.4.3. Droplet Size Analysis

Further, to describe in detail the distribution of droplets of various droplet sizes deposited on the WSP during the spraying experiment, the droplet sizes were categorized into 6 spectral intervals: 50–100 μm, 101–150 μm, 151–200 μm, 201–250 μm, 251–300 μm, and >300 μm. The percentage of each droplet size spectrum was calculated as shown in Equation (13):
C = S A × 100 %
Equation (13), where C is the percentage of droplet size spectrum, S is the number of droplets in the selected droplet size interval, and A is the number of droplets in all droplet size intervals.

3. Results

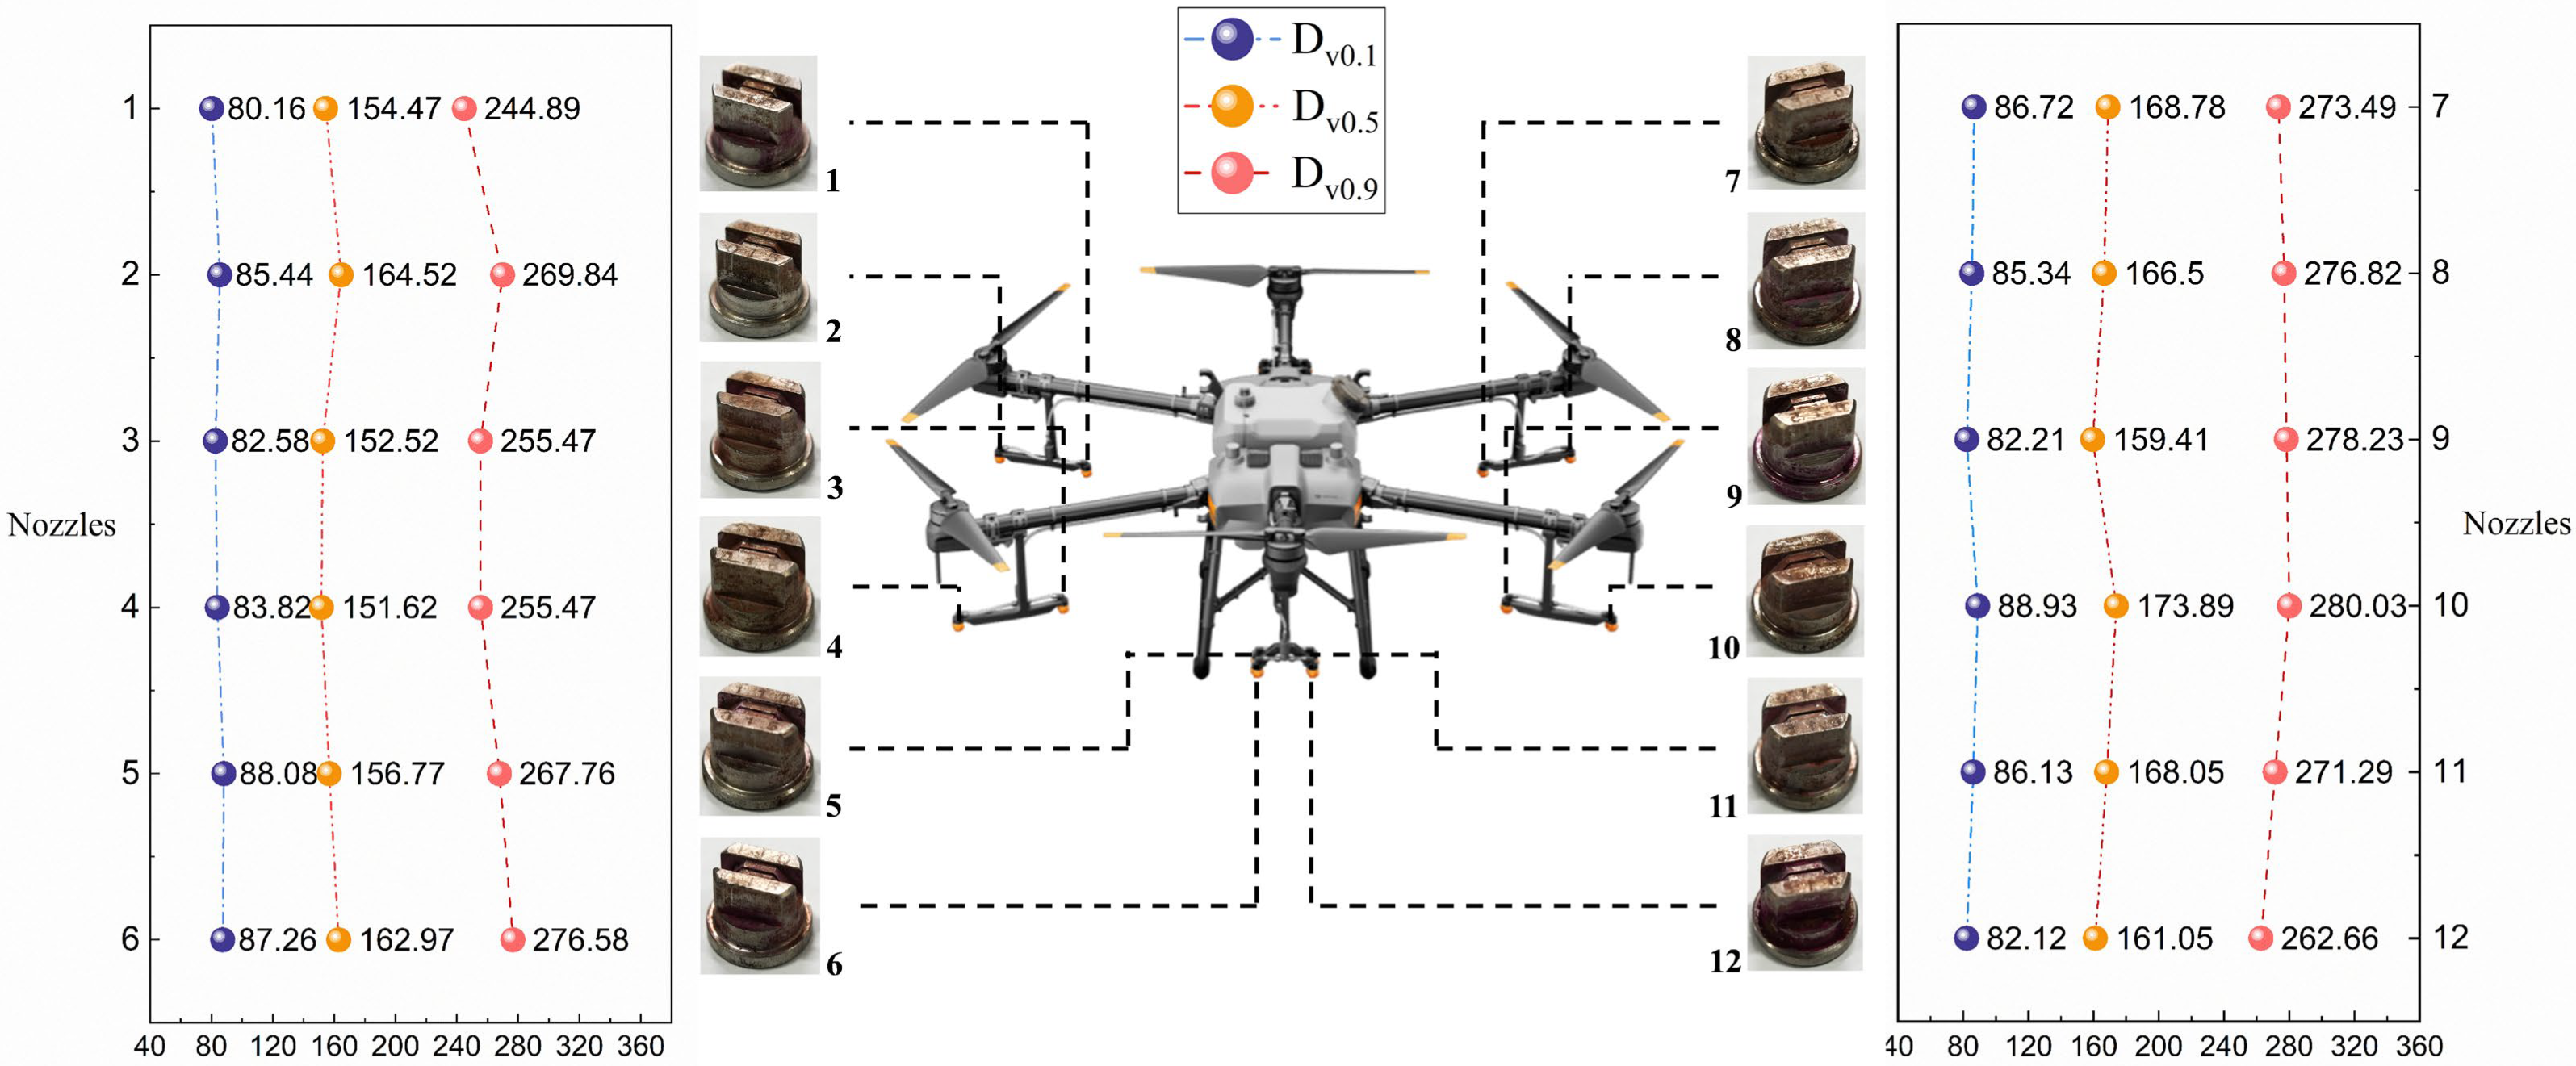
3.1. UASS Nozzle Performance Analysis

The distribution of the atomization performance of the 12 nozzles (DJI SX110015VS) selected for the test is shown in Figure 5. The VMD values of these 12 nozzles were measured to be in the range of 151.62 to 173.89 μm, which corresponds to the medium standard (150–190 μm, M) in the droplet size grading standard. It is noteworthy that the Dv0.9 values for nozzle 1 and nozzle 12 were smaller compared to the equivalent values of the other nozzles, which are 244.89 μm and 262.66 μm, respectively.
Table 5 shows the spread value (SV), cumulative spray volume share of droplet sizes V<a (%volume), and relative span (RS) for each spray head. The SV values for each droplet size ranged from 2.81% to 4.93% (Dv0.1), 1.96% to 4.69% (Dv0.5), and 1.26% to 4.10% (Dv0.9), respectively. V<150 (%volume), V<200 (%volume), and V<250 (%volume) indicate the cumulative percentage of spray volume for droplet sizes smaller than 150 μm, 200 μm, and 250 μm, with variations of 16.0%, 17.5%, and 12.1%, respectively. Additionally, the RS values for the 12 nozzles ranged from 1.07 to 1.23, showing no statistically significant differences among them. The coefficient of variation (CV) was 3.40%, with a standard deviation of 0.0384, indicating minimal variability within the dataset.

3.2. Elution Recovery Analysis

The elution recoveries for the three samplers (GBL, MS, and PVC card) are shown in Figure 6. The elution recoveries for each sampler were determined to range from 48.975% to 41.075% for GBL, 50.000% to 40.065% for MS, and 92.000% to 48.880% for PVC card, with variations in the concentration of the RB solution (0.1 g/L to 10.0 g/L).
Further analysis of the elution recovery trends (Figure 7a) for the three samplers (GBL, MS, and PVC card) revealed that the elution recovery decreases with increasing chemical colorant concentration and eventually stabilizes. Among them, the decay trend of the elution recovery for the two types of leaf samplers was relatively flat, with extreme difference values of 7.90% (GBL) and 9.93% (MS), respectively. On the other hand, the PVC sampler exhibited a larger range of elution recovery decay, from 92.00% (0.1 g/L) to 48.88% (10.0 g/L).
As shown in Figure 7b, the significance analysis indicated that elution recovery differed significantly among samplers at the p < 0.05 level across the five RB spray solution concentrations. Specifically, significant differences were observed between the PVC sampler and both types of leaves, while no significant difference was found between the two leaf types. Furthermore, the elution recovery of the PVC sampler varied significantly with RB concentration, whereas the two leaf samplers exhibited no significant variation, which was consistent with the overall elution recovery trends.

3.3. Optimal Chemical Colorant Concentration

3.3.1. Overall Analysis of Correlation

Based on the five concentrations of RB spraying solution, the deposition amounts for the four samplers were analyzed individually to determine the trends in deposition amounts and the correlation of droplet deposition amounts between samplers.
The results of the trend of deposition amount (Figure 8) show that the results of droplet deposition amount with angle were similar for the four samplers. At the same RB spraying concentration, the deposition amount values of the two leaf samplers (GBL and MS) were relatively close to each other, with the difference ranging from 1.03% to 8.89% (0.1 g/L), 1.82% to 11.81% (0.5 g/L), 0.51% to 15.10% (1.0 g/L), 1.93% to 8.89% (5.0 g/L), and 1.62% to 15.5% (10.0 g/L). The deposition values for the PVC sampler were slightly greater than those for the two leaf samplers. The range of differences in mean deposition values compared to the two leaf samplers (GBL and MS) were 1.08% to 20.0% (0.1 g/L), 1.58% to 27.90% (0.5 g/L), 7.25% to 27.87% (1.0 g/L), 4.96% to 17.00% (5.0 g/L), and 1.03% to 18.23% (10.0 g/L). In contrast, the deposition results for the WSP were large compared to the other three samplers, with a range of differences in deposition averages compared to the two leaf samplers (GBL and MS), respectively: 50.40~166.00% (0.1 g/L), 58.14~141.39% (0.5 g/L), 44.99~230.91% (1.0 g/L), 18.44~77.36% (5.0 g/L), and 10.52~374.26% (10.0 g/L). In addition, at the five RB spray solution concentrations, the droplet deposition values obtained with the four samplers were significantly higher when the sampler angles were A + 30° and B + 60°, whereas the values were lower when the sampler angles were A − 60° and B − 60°.
The correlation results are shown in Figure 9. When the concentration of RB spraying solution is in the range of 0.1 g/L to 5.0 g/L, the correlation of deposition results among the four samplers is extremely significant and satisfies the 0.01 level (two-tailed). The correlation among the samplers was most significant when the RB spray solution concentration was 5.0 g/L. The correlation values among the three samplers (GBL, MS, and PVC card) were all greater than 0.995, and the correlation significance between the WSP and the other three samplers was greater than 0.950. However, when the RB spray solution concentration was 10.0 g/L, there was no significant correlation between the WSP and the three samplers.

3.3.2. Overall Analysis of Ratio Fit

Based on the five concentrations of RB spray solution, the results of the ratio of the mean values of deposition from the WSP and the other three samplers were linearly fitted at nine different sampling angles, as shown in Table 6. The results of the linear fitting indicated that at a RB spray solution concentration of 10.0 g/L, the R2 values ranged from 0.171 to 0.175, which were insufficient to effectively illustrate the proportionality between the samples. When the concentration of RB spraying solution was 1.0 g/L, the fitting results of R2 ranged from 0.696 to 0.773. The fitting coefficient obtained by WSP–GBL was 2.29, which was higher than that of WSP–PVC card, which was 2.212, indicating a significant gap from the expected results. At RB spraying solution concentrations of 0.1 g/L and 0.5 g/L, the fitting results for the deposition amount improved, with R2 ranging from 0.827 to 0.926. The best fit for the deposition amount was achieved at a RB spray solution concentration of 5.0 g/L, with R2 values greater than 0.9 in both cases.

3.3.3. Overall Analysis of the Coefficient of Variation

Based on five RB spraying solution concentrations, the coefficient of variation analysis (Table 7) was performed on the deposition results of four samplers under nine sets of angles. Results show that when the concentration of RB spraying solution is 5.0 g/L, the mean coefficient of variation in the data measured by each sampler is less than 15%, which is more uniformly distributed compared to the data at other concentrations. The results from the combined overall analysis of correlation and ratio fit showed that the correlation between the four samplers and the fit coefficients were most significant and highest at the RB spraying solution concentration of 5.0 g/L. Therefore, a RB spraying solution concentration of 5.0 g/L was chosen as the optimal concentration for further data analysis.

3.4. Proportional Analysis of Droplet Deposition

Based on the optimal RB spray solution concentration, and to accurately analyze the correction coefficients of droplet deposition for the four samplers at nine different angles, three analytical methods were chosen for comparison: quotient values, integral values, and linear fits.

3.4.1. Quotient Values

The results (Figure 10) of the quotients of the mean values of droplet deposition determined by the samplers were 1.547 (WSP–GBL), 1.471 (WSP–MS), and 1.354 (WSP–PVC). It was found that the maximum values of the correction coefficients were all located at the small angle A + 30° of the sampler, while the minimum values were found at the large angle B + 60° of the sampler. The maximum value results are 1.895 (WSP–GBL, A + 30°), 1.74 (WSP–MS, A + 30°), and 1.626 (WSP–PVC, A + 30°). The minimum value results are 1.231 (WSP–GBL, B + 60°), 1.142 (WSP–MS, B + 60°), and 1.038 (WSP–PVC, B + 60°).

3.4.2. Integral Value

The projection results of the droplet deposition and the integration area for the four samplers are shown in Figure 11. The integration area values of the four-sampler projection droplet deposition were calculated to be 3.906 (GBL), 4.079 (MS), 4.590 (PVC), and 6.030 (WSP). The integral area values of the projection droplet deposition for the WSP were divided separately by the integral area results obtained for the other three samplers to obtain proportional results: 1.544 (WSP–GBL), 1.478 (WSP–MS), and 1.314 (WSP–PVC).

3.4.3. Linear Fit

(1)
Multi-angle linear fitting. The multi-angle linear fitting results of droplet deposition between the WSP and the three samplers are shown in Figure 12a–c. The fitting results are y = 1.50485x + 0.01295 (WSP–GBL, R2 = 0.86946), y = 1.47771x + 0.00785 (WSP–MS, R2 = 0.91436), and y = 1.39135x − 0.12789 (WSP–PVC, R2 = 0.82561). The data show that the R2 values after fitting for the three samplers are all above 0.82, indicating strong predictive capability.
(2)
Angle-specific linear fitting. Based on the optimal RB spray solution concentration, the angle-specific linear fitting results of the droplet deposition between the WSP and the three samplers were obtained at nine specific angles. The range of the fitted results (Table 8) was 1.244 to 1.890 (GBL), 1.129 to 1.739 (MS), and 1.041 to 1.632 (PVC), respectively. The results show that the correction coefficients of deposition vary at different angles, with the fitting results at large angles (A ± 60° and B ± 60°) being smaller compared to those at other angles. The largest scale factor results are observed at A + 30°.

3.5. WSP Droplet Size Analysis

Based on the optimal RB spray solution concentration, the results of the WSP deposition measurements were analyzed to obtain the droplet size parameters of the droplets.
Figure 13a shows the statistical results of the number of droplets deposited on the WSP with different droplet size percentages for each angle range. The number of droplets was very small when the sampler angles were A − 60° and B − 60°, with average values of 69 and 309, respectively, from five spraying results. In contrast, when the samplers’ angles were A + 30° and B − 30°, the number of droplets was significantly higher, with average results of 536 and 535, respectively, from five repetitions of the data. The droplet size spectra of the deposited droplets on the WSP for each angle range are shown in Figure 13b. When the sampler angles were A ± 30° and A + 60°, the number of large droplets (>200 μm) increased significantly, reaching 41% and 40%, respectively. In contrast, when the angles were 0° and B + 60°, the number of large droplets (>200 μm) decreased to 38% and 34%, respectively, while the number of small droplets (<100 μm) increased significantly.

4. Discussion

This study was based on a hexacopter UASS DJI T30 and its accompanying SX110015VS aerial spray nozzle for four different combinations of sampler types (GBL, MS, PVC card, and WSP) and five RB spray solution concentrations (0.1 g/L, 0.5 g/L, 1.0 g/L, 5.0 g/L, and 10.0 g/L), and the results are not conclusive and should not be generalized to all uses. However, these data provide new ideas and references for exploring a method that can ensure the accuracy of droplet deposition measurement and reduce the environmental pollution caused by the test process. Overall, correcting WSP deposition results by using the chemical colorant to elute the leaves and measuring the droplet deposition can improve the accuracy of WSP measurements, and the resulting correction coefficients can help reduce the pollution caused by using the chemical colorant in subsequent test processes.
In general, there should not be significant differences in the parameters of aerial nozzles of the same size. Although the study controlled for consistent nozzle models, there were few differences in the atomization performance measurements of the UASS nozzles in the pre-test. This may be due to wear and tear on the aerial nozzles; the experience of field spraying operations prior to the test caused varying degrees of wear on individual nozzles, which affected the base atomization performance of the system.
Yao et al. [33] conducted similar measurements on long-term aerial nozzles using wind tunnels, and the results of their study confirmed that wear and tear can compromise the spray stability of the nozzles. Additionally, it was found that different treatments might lead to variations in elution recovery results from the sampler, which is critical from a deposition correction perspective. For all the experiments conducted in this study, the chemical colorant used was RB solution. It has been documented that the substance is a synthetic colorant that is stable in both nature and structure [34] and does not degrade under natural light irradiation [35]. However, the present study compared the fluorescence intensity values of eluates before and after sunlight irradiation in various samplers and found the results to be surprising. Although we controlled the experiment conditions, i.e., by simulating the field experiment collection environment, it is worth noting that the fluorescence values of the RB eluates decreased as the sampler was exposed to sunlight for longer periods of time. A possible reason for this result is that sunlight exposure increases the temperature of the sampler, which, in turn, affects the fluorescence value of the RB deposited on the sampler. In a study conducted on RB, Chauhan et al. [36] reported that the fluorescence intensity of RB decreases with increasing temperature. Therefore, it is essential to consider the environmental conditions at the time of field collection, especially higher temperatures and more intense sunlight, when conducting relevant studies.
To obtain more accurate elution recovery values for the samplers, the spray concentration of RB was also included in the evaluation of this study. However, the results showed that as the concentration of the RB spraying solution increased, the elution recovery of the sampler decreased, with the rate of decline gradually slowing. It is hypothesized that this phenomenon may be related to the molecular properties of RB. Rahdar et al. [37] found that as the concentration of RB solution increased, the interaction between nanodroplets changed from attractive to repulsive with increasing droplet mass fraction. Yan et al. [38] observed a concentration effect when performing fluorescence detection of solutions, which causes an inner filter effect as well as interactions between solutes that affect the solution fluorescence intensity. These findings suggest that there are numerous factors that can affect the accuracy of deposition results, such as nozzle characteristics, temperature, light, and RB spray solution characteristics. Therefore, setting up a pre-test in the study may be a feasible option. It is recommended that when conducting relevant experiments, pre-tests should be established to explicitly ensure the accuracy of the determination of the correction coefficients, rather than blindly quoting coefficients or results that may adversely affect the experiment outcomes.
The results from the fitting analyses indicate that determining the deposition ratio fitting results between the WSP and the three samplers requires the selection of an appropriate RB spray solution concentration. This study found that both too high and too low concentrations of RB spray solution resulted in differences in the correction factor results. The results of the correction coefficients for the deposition amount between the WSP and the three samplers were 2.419 (WSP–GBL), 2.631 (WSP–MS), and 2.771 (WSP–PVC) at a RB spray solution concentration of 0.1 g/L. In contrast, the deposition correction coefficients for the two leaf samplers were smaller than those for PVC, which also differed from the results of the deposition ratio fits at other concentrations. Despite the high elution recoveries of the samplers at this concentration, the results were 48.975% (GBL), 50.000% (MS), and 92.000% (PVC). However, the fluorescence intensity of the eluent may not be guaranteed to reach the optimal measurement range of the instrument. In comparison, the deposition correction factors for a RB spray solution concentration of 10.0 g/L were 1.178 (WSP–GBL), 1.188 (WSP–MS), and 1.063 (WSP–PVC), respectively. However, the fit R2 values were only 0.171 (GBL), 0.175 (MS), and 0.171 (PVC), which suggests that the correction coefficients for the amount of deposition may not be accurate. Although the preferred spraying concentration in this study, a RB spray solution concentration of 5.0 g/L, was obtained through a pre-test, this concentration may only be applicable to the five RB spray solution concentrations experimented in this study. More work is needed to determine if this concentration is suitable for all spraying situations and chemical colorants. Further, in this study, the droplet deposition correction coefficients were analyzed from different methods based on data at a RB spray solution concentration of 5.0 g/L. First, the droplet deposition coefficients between the WSP and the three samplers were obtained by combining deposition data from nine sets of angles using three analytical methods (Table 9). In this study, the range of differences in droplet deposition correction coefficients obtained by the three methods were 2.61% (GBL), 0.47% (MS), and 5.84% (PVC), respectively. In addition, in the angle-specific fitting analysis, we separately fitted the deposition data for each set of angles. This study shows that the angle has a strong influence on the results of the correction coefficients, and that extreme values of the correction coefficient results occur at specific angles, such as A + 30° or at the maximum angle. Notably, the results of the droplet size analysis also showed that the number of droplets falling on the WSP decreased significantly when the fixed angle of the WSP was A − 60°, compared to other angles. Qian et al. [39] found in their study that collisions between droplets resulted in droplet bouncing, aggregation, rupture, or fragmentation. It is, therefore, hypothesized that the cause of this phenomenon may be the large angle of the sampler, which leads to droplets bouncing and coalescing on the contact surface, forming large droplets that roll off. It is also possible that the spray nozzles were worn out, resulting in uneven spraying of droplets that were not effectively deposited on the sampler surface.
It was also found that the results of droplet deposition from the two leaf samplers were relatively close, but smaller than those measured by the PVC cards. Koch et al. [40] showed that the micro and nanostructures of plant surfaces have a strong influence on their interfacial properties. Ginkgo biloba belongs to the Ginkgoaceae family and has fan-shaped, light green leaves that turn bright yellow in the fall [41]. Its petioles are slightly covered with brown hairs at the base and along the leaf bases [42]. Ginkgo biloba can be used as food, medicine, and timber, and it also has great ornamental value [43]. Malus spectabilis is an ornamental deciduous tree species belonging to the genus Malus in the family Rosaceae [44]. It is known for its decorative value and aesthetic appeal in gardens and landscaping [45]. It is often used for anthocyanin research. For example, Meng et al. [46] used Malus spectabilis to study the biosynthesis of apple anthocyanins under low nitrogen conditions. These two plants not only possess significant economic and ornamental value, but also exhibit substantial research potential and application value in evolutionary biology, pharmacology, genomics, and horticultural genetic improvement. Transparent polyvinyl chloride (PVC) plastic card, commonly known as “soft glass” or “crystal plate” [47], has a glossy surface and is resistant to most inorganic acids, alkalis, salts, and most organic solvents.
Wang et al. [48] showed that the leaf roughness, surface free energy, its components, and work-of-adhesion for water played important roles in hydrological characteristics, especially work-of-adhesion for water. Cavallaro et al. [49] showed that leaf properties such as water contact angle, water droplet attachment, and water retention were determined by surface chemistry (e.g., wax content) and structure (e.g., trichomes, stomatal density, and leaf angle). It is, therefore, hypothesized that the cause of this phenomenon may be related to the surface nature of the sampler, i.e., there may be special structures on the surface of the leaves, such as lint, that may hinder droplet deposition, compared to the smooth surface of the PVC sampler. In addition, the three samplers used in this study, GBL, MS, and PVC card, were only used for the comparison of experiment results, and no specific research was conducted on the samplers. Through the study of the deposition correction coefficients, it has been demonstrated that the leaves and PVC samplers used in the experiment can be used as research vehicles, but future research should consider increasing the kinds of droplet deposition samplers.
Overall, the study’s proposed method of correcting WSP droplet deposition results through the elution of chemical colorant is highly informative. This is because it improves the accuracy of WSP determination and reduces the environmental pollution caused by UASS spraying colorants to a certain extent—something that cannot be achieved with current traditional WSP deposition determination methods.
The study’s proposed method of correcting the results of WSP determination of droplet deposition by eluting the chemical colorant is attractive because it can greatly reduce the environmental pollution caused by the UASS spraying process. Additionally, it can improve the accuracy of WSP determination, which is not achievable by the current conventional WSP deposition determination methods.

5. Conclusions

This study proposes a method that ensures the accuracy of droplet deposition measurements and reduces the environmental pollution caused by the UASS spraying process, which may positively impact aerial spraying experiments. Overall, the method is based on UASSs and determines the deposition correction coefficients for WSP by varying the spray colorant concentration, sampler angle, and type. The results of the experimental data also confirmed the feasibility of the research methodology. At the same time, the method retains the original simplicity of determination compared to existing methods for WSP deposition, while improving the accuracy of detection. After applying the method, collecting data, and performing a comparative analysis of the obtained results, conclusions can be drawn:
(1)
Under the conditions of this study, the range of coefficients for corrected WSP droplet deposition by GBL, MS, and PVC samplers was found to be 1.507 to 1.547 (WSP–GBL), 1.471 to 1.478 (WSP–MS), and 1.312 to 1.391 (WSP–PVC).
(2)
Pre-tests should be set up according to the experiment conditions to avoid directly quoting data. Higher or lower concentrations of chemical colorant solutions should not be used. Suitable concentrations of RB spray solutions include, but are not limited to 5.0 g/L.
(3)
There are many factors that affect the correction coefficient. Among them, the angle and type of sampler have a significant impact on the amount of droplet deposition and the correction coefficient, which can be further investigated with respect to these variables.

Author Contributions

Writing—review and editing, Z.Y. and M.L.; writing—original draft preparation, Z.Y.; visualization, Z.Y. and B.X.; formal analysis, Z.Y. and Y.C.; conceptualization, Z.Y., H.Z. and W.Y.; data curation, Z.Y. and M.L.; investigation, H.Y. and K.L.; funding acquisition, W.Y., K.L. and C.C.; project administration, W.Y. and C.C.; and supervision, W.Y. and C.C. All authors have read and agreed to the published version of the manuscript.

Funding

This research was funded by the Education Fund of Liaoning Province (JYTPT2024002) and was a sub-theme of the National Key Research and Development Program (2024YFD15015032).

Institutional Review Board Statement

Not applicable.

Data Availability Statement

The data that support the findings of this study are available from the corresponding author upon reasonable request.

Conflicts of Interest

Author Kun Li was employed by the company Jiangxi Dronephon Technology Co., Ltd. The remaining authors declare that the research was conducted in the absence of any commercial or financial relationships that could be construed as a potential conflict of interest. The funders had no role in the design of the study; in the collection, analyses, or interpretation of data; in the writing of the manuscript; or in the decision to publish the results.

Abbreviations

WSPWater-sensitive paper
GBLGinkgo biloba leaf
MSMalus spectabilis leaf
PVCPolyvinyl chloride
RBRhodamine-B
UASSUnmanned aerial spraying system
PPPsPlant protection products
PIVParticle image velocimetry

References

  1. Zhang, N.; Wang, M.; Wang, N. Precision agriculture—A worldwide overview. Comput. Electron. Agric. 2002, 36, 113–132. [Google Scholar] [CrossRef]
  2. Taseer, A.; Han, X. Advancements in variable rate spraying for precise spray requirements in precision agriculture using Unmanned aerial spraying Systems: A review. Comput. Electron. Agric. 2024, 219, 108841. [Google Scholar] [CrossRef]
  3. Wang, C.; Liu, Y.; Zhang, Z.; Han, L.; Li, Y.; Zhang, H.; Wongsuk, S.; Li, Y.; Wu, X.; He, X. Spray performance evaluation of a six-rotor unmanned aerial vehicle sprayer for pesticide application using an orchard operation mode in apple orchards. Pest Manag. Sci. 2022, 78, 2449–2466. [Google Scholar] [CrossRef] [PubMed]
  4. Guo, S.; Li, J.; Yao, W.; Hu, X.; Wei, X.; Long, B.; Wu, H.; Li, H. Optimization of the factors affecting droplet deposition in rice fields by rotary unmanned aerial vehicles (UAVs). Precis. Agric. 2021, 22, 1918–1935. [Google Scholar] [CrossRef]
  5. Coombes, M.; Newton, S.; Knowles, J.; Garmory, A. The influence of rotor downwash on spray distribution under a quadrotor unmanned aerial system. Comput. Electron. Agric. 2022, 196, 106807. [Google Scholar] [CrossRef]
  6. Wang, J.; Lan, Y.; Wen, S.; Hewitt, A.J.; Yao, W.; Chen, P. Meteorological and flight altitude effects on deposition, penetration, and drift in pineapple aerial spraying. Asia-Pac. J. Chem. Eng. 2020, 15, e2382. [Google Scholar] [CrossRef]
  7. Sassu, A.; Psiroukis, V.; Bettucci, F.; Ghiani, L.; Fountas, S.; Gambella, F. Unmanned aerial system plant protection products spraying performance evaluation on a vineyard. Precis. Agric. 2024, 25, 2082–2112. [Google Scholar] [CrossRef]
  8. Petrović, B.; Bumbálek, R.; Zoubek, T.; Kuneš, R.; Smutný, L.; Bartoš, P. Application of precision agriculture technologies in Central Europe-review. J. Agric. Food Res. 2024, 15, 101048. [Google Scholar] [CrossRef]
  9. Dubuis, P.-H.; Droz, M.; Melgar, A.; Zürcher, U.A.; Zarn, J.A.; Gindro, K.; König, S.L. Environmental, bystander and resident exposure from orchard applications using an agricultural unmanned aerial spraying system. Sci. Total Environ. 2023, 881, 163371. [Google Scholar] [CrossRef]
  10. Wang, G.; Han, Y.; Li, X.; Andaloro, J.; Chen, P.; Hoffmann, W.C.; Han, X.; Chen, S.; Lan, Y. Field evaluation of spray drift and environmental impact using an agricultural unmanned aerial vehicle (UAV) sprayer. Sci. Total Environ. 2020, 737, 139793. [Google Scholar] [CrossRef]
  11. Sánchez-Fernández, L.; Barrera, M.; Martínez-Guanter, J.; Pérez-Ruiz, M. Drift reduction in orchards through the use of an autonomous UAV system. Comput. Electron. Agric. 2023, 211, 107981. [Google Scholar] [CrossRef]
  12. Li, L.; Zhang, R.; Chen, L.; Hewitt, A.J.; He, X.; Ding, C.; Tang, Q.; Liu, B. Toward a remote sensing method based on commercial LiDAR sensors for the measurement of spray drift and potential drift reduction. Sci. Total Environ. 2024, 918, 170819. [Google Scholar] [CrossRef] [PubMed]
  13. Privitera, S.; Manetto, G.; Pascuzzi, S.; Pessina, D.; Cerruto, E. Drop Size Measurement Techniques for Agricultural Sprays:A State-of-The-Art Review. Agronomy 2023, 13, 678. [Google Scholar] [CrossRef]
  14. Ahmad, F.; Zhang, S.; Qiu, B.; Ma, J.; Xin, H.; Qiu, W.; Ahmed, S.; Chandio, F.A.; Khaliq, A. Comparison of Water Sensitive Paper and Glass Strip Sampling Approaches to Access Spray Deposit by UAV Sprayers. Agronomy 2022, 12, 1302. [Google Scholar] [CrossRef]
  15. Chen, C.; Jia, Y.; Zhang, J.; Yang, L.; Wang, Y.; Kang, F. Development of a 3D point cloud reconstruction-based apple canopy liquid sedimentation model. J. Clean. Prod. 2024, 451, 142038. [Google Scholar] [CrossRef]
  16. Li, X.; Giles, D.K.; Niederholzer, F.J.; Andaloro, J.T.; Lang, E.B.; Watson, L.J. Evaluation of an unmanned aerial vehicle as a new method of pesticide application for almond crop protection. Pest Manag. Sci. 2020, 77, 527–537. [Google Scholar] [CrossRef]
  17. Turner, C.; Huntington, K. The use of a water sensitive dye for the detection and assessment of small spray droplets. J. Agric. Eng. Res. 1970, 15, 385–387. [Google Scholar] [CrossRef]
  18. Simões, I.; Sousa, A.J.; Baltazar, A.; Santos, F. Spray Quality Assessment on Water-Sensitive Paper Comparing AI and Classical Computer Vision Methods. Agriculture 2025, 15, 261. [Google Scholar] [CrossRef]
  19. Cunha, M.; Carvalho, C.; Marcal, A.R. Assessing the ability of image processing software to analyse spray quality on water-sensitive papers used as artificial targets. Biosyst. Eng. 2012, 111, 11–23. [Google Scholar] [CrossRef]
  20. Ferguson, J.C.; Hewitt, A.J.; O’donnell, C.C.; Kruger, G.R. Comparison of water-sensitive paper, Kromekote and Mylar collectors for droplet deposition with a visible fluorescent dye solution. J. Plant Prot. Res. 2023, 60, 98–105. [Google Scholar] [CrossRef]
  21. Hoffmann, W.C.; Hewitt, A.J. Comparison of three imaging systems for water-sensitive papers. Appl. Eng. Agric. 2005, 21, 961–964. [Google Scholar] [CrossRef]
  22. Yao, W.; Wang, X.; Lan, Y.; Jin, J. Effect of UAV prewetting application during the flowering period of cotton on pesticide droplet deposition. Front. Agric. Sci. Eng. 2018, 5, 455–461. [Google Scholar] [CrossRef]
  23. Prado, E.P.; Guerreiro, J.C.; Ferreira-Filho, P.J.; Nascimento, V.D.; Ferrari, S.; Galindo, F.S.; Funichello, M.; Raetano, C.G.; Pagliari, P.H.; Chechetto, R.G.; et al. Performance of spray nozzles and droplet size on glufosinate deposition and weed biological efficacy. Crop Prot. 2024, 177, 106560. [Google Scholar] [CrossRef]
  24. Fang, H.; Zhang, Z.; Xiao, S.; Liu, Y. Influence of leaf surface wettability on droplet deposition effect of rape leaves and their correlation. J. Agric. Food Res. 2019, 1, 100011. [Google Scholar] [CrossRef]
  25. Qin, W.-C.; Xue, X.-Y.; Zhou, Q.-Q.; Cai, C.; Wang, B.-K.; Jin, Y.-K. Use of RhB and BSF as fluorescent tracers for determining pesticide spray distribution. Anal. Methods 2018, 10, 4073–4078. [Google Scholar] [CrossRef]
  26. Singh, S.; Kumar, A.; Gupta, H. Activated banana peel carbon: A potential adsorbent for Rhodamine B decontamination from aqueous system. Appl. Water Sci. 2020, 10, 185. [Google Scholar] [CrossRef]
  27. Priya, P.S.; Nandhini, P.P.; Vaishnavi, S.; Pavithra, V.; Almutairi, M.H.; Almutairi, B.O.; Arokiyaraj, S.; Pachaiappan, R.; Arockiaraj, J. Rhodamine B, an organic environmental pollutant induces reproductive toxicity in parental and teratogenicity in F1 generation in vivo. Comp. Biochem. Physiol. Part C Toxicol. Pharmacol. 2024, 280, 109898. [Google Scholar] [CrossRef]
  28. Witton, J.T.; Pickering, M.D.; Alvarez, T.; Reed, M.; Weyman, G.; Hodson, M.E.; Ashauer, R. Quantifying pesticide deposits and spray patterns at micro-scales on apple (Malus domesticus) leaves with a view to arthropod exposure. Pest Manag. Sci. 2018, 74, 2884–2893. [Google Scholar] [CrossRef]
  29. Khot, L.R.; Salyani, M.; Sweeb, R.D. Solar and Storage Degradations of Oil- and Water-Soluble Fluorescent Dyes. Appl. Eng. Agric. 2011, 27, 211–216. [Google Scholar] [CrossRef]
  30. You, K.; Zhu, H.; Abbott, J.P. Assessment of Fluorescent Dye Brilliant Sulfaflavine Deposition on Stainless Steel Screens as Spray Droplet Collectors. Trans. ASABE 2019, 62, 495–503. [Google Scholar] [CrossRef]
  31. ASABE S572.3; Spray Nozzle Classification by Droplet Spectra. American Society of Agricultural and Biological Engineers: St. Joseph, MI, USA, 2020.
  32. Zhu, H.; Salyani, M.; Fox, R.D. A portable scanning system for evaluation of spray deposit distribution. Comput. Electron. Agric. 2011, 76, 38–43. [Google Scholar] [CrossRef]
  33. Yao, W.; Lan, Y.; Hoffmann, W.C.; Li, J.; Guo, S.; Zhang, H.; Wang, J. Droplet Size Distribution Characteristics of Aerial Nozzles by Bell206L4 Helicopter under Medium and Low Airflow Velocity Wind Tunnel Conditions and Field Verification Test. Appl. Sci. 2020, 10, 2179. [Google Scholar] [CrossRef]
  34. Bakkialakshmi, S.; Selvarani, P.; Chenthamarai, S. Fluorescence quenching of Rhodamine B base by two amines. Spectrochim. Acta Part A: Mol. Biomol. Spectrosc. 2013, 105, 557–562. [Google Scholar] [CrossRef]
  35. Basely, A.M.; Shaker, M.H.; Helmy, F.M.; Abdel-Messih, M.; Ahmed, M. Construction of Bi2S3/g-C3N4 step S-scheme heterojunctions for photothermal decomposition of rhodamine B dye under natural sunlight radiations. Inorg. Chem. Commun. 2023, 148, 110300. [Google Scholar] [CrossRef]
  36. Chauhan, V.M.; Hopper, R.H.; Ali, S.Z.; King, E.M.; Udrea, F.; Oxley, C.H.; Aylott, J.W. Thermo-optical characterization of fluorescent rhodamine B based temperature-sensitive nanosensors using a CMOS MEMS micro-hotplate. Sens. Actuators B Chem. 2014, 192, 126–133. [Google Scholar] [CrossRef]
  37. Rahdar, A.; Almasi-Kashi, M. Photophysics of Rhodamine B in the nanosized water droplets: A concentration dependence study. J. Mol. Liq. 2016, 220, 395–403. [Google Scholar] [CrossRef]
  38. Yan, K.; Han, X.; Wang, L.; Ding, F.; Lan, Y.; Zhang, Y. Research on the fluorescence spectra characteristics of abamectin technical and preparation solution. Spectrosc. Spectr. Anal. 2022, 42, 3476–3481. [Google Scholar]
  39. Qian, J.; Law, C.K. Regimes of coalescence and separation in droplet collision. J. Fluid Mech. 1997, 331, 59–80. [Google Scholar] [CrossRef]
  40. Koch, K.; Bhushan, B.; Barthlott, W. Multifunctional surface structures of plants: An inspiration for biomimetics. Prog. Mater. Sci. 2009, 54, 137–178. [Google Scholar] [CrossRef]
  41. Lin, H.; Li, W.; Lin, C.; Wu, H.; Zhao, Y. International Biological Flora: Ginkgo Biloba. J. Ecol. 2022, 110, 951–982. [Google Scholar] [CrossRef]
  42. Dörken, V.M. Morphology, anatomy and vasculature in leaves of Ginkgo biloba L. (Ginkgoaceae, Ginkgoales) under functional and evolutionary aspects. Feddes Repert. 2013, 124, 80–97. [Google Scholar] [CrossRef]
  43. Del Tredici, P. Ginkgos and People: A Thousand Years of Interaction. Arnoldia 1991, 51, 3–15. [Google Scholar] [CrossRef]
  44. Jiao, Q.; Tao, J.; Wang, C.; Yin, Y.; Feng, L. Characterization of the Complete Chloroplast Genome of Malus Spectabilis ‘Guanghui’. Mitochondrial DNA Part B 2020, 5, 2555–2556. [Google Scholar] [CrossRef] [PubMed]
  45. Tan, C.; Yang, J.; Xue, X.; Wei, J.; Li, H.; Li, Z.; Duan, Y. MsMYB62-like as a negative regulator of anthocyanin biosynthesis in Malus spectabilis. Plant Signal. Behav. 2024, 19, 2318509. [Google Scholar] [CrossRef]
  46. Meng, J.; Wang, H.; Chi, R.; Qiao, Y.; Wei, J.; Zhang, Y.; Han, M.; Wang, Y.; Li, H. The eTM-miR858-MYB62-like module regulates anthocyanin biosynthesis under low-nitrogen conditions in Malus spectabilis. New Phytol. 2023, 238, 2524–2544. [Google Scholar] [CrossRef]
  47. Jouyandeh, M.; Ganjali, M.R.; Hadavand, B.S.; Aghazadeh, M.; Akbari, V.; Shammiry, F.; Saeb, M.R. Curing epoxy with polyvinyl chloride (PVC) surface-functionalized CoxFe3-xO4 nanoparticles. Prog. Org. Coat. 2019, 137, 105364. [Google Scholar] [CrossRef]
  48. Wang, H.; Shi, H.; Li, Y.; Wang, Y. The Effects of Leaf Roughness, Surface Free Energy and Work of Adhesion on Leaf Water Drop Adhesion. PLoS ONE 2014, 9, e107062. [Google Scholar] [CrossRef]
  49. Cavallaro, A.; Carbonell-Silletta, L.; Burek, A.; Goldstein, G.; Scholz, F.G.; Bucci, S.J. Leaf surface traits contributing to wettability, water interception and uptake of above-ground water sources in shrubs of Patagonian arid ecosystems. Ann. Bot. 2022, 130, 409–418. [Google Scholar] [CrossRef]
Figure 1. Measurement of spray nozzle atomization performance. The nozzle is positioned 30 cm above the midpoint between the emitting and receiving ends of the laser droplet sizer. By controlling the water pump and observing the flow meter, the flow rate of the nozzle is adjusted.
Agriculture 15 00931 g001
Figure 2. Schematic diagram of the field spraying experiment. The letters and angles on the lower left side of the plot represent the axis around which the sampler rotates and the angle of rotation. (A) of the PVC board rotating around the OX axis, while the (B) rotating around the OY axis. For example, (A − 30°) indicates that the sampler rotates clockwise by 30° around the OX axis.
Agriculture 15 00931 g002
Figure 3. Schematic diagram of the sampler arrangement. In this diagram, the PVC plate is rotated in the directions of the OX axis and OY axis, respectively.
Agriculture 15 00931 g003
Figure 4. Projection schematic. The blue, yellow and red lines in the figure correspond to the projections for rotation angles of ±60°, ±30° and 0°, respectively. When the rotation angles are ±60°, ±30°, and 0°, the corresponding projection coefficients are cos (±60°), cos (±30°), and cos (0°), respectively. When rotating the same angles (±60°, ±30°, and 0°) around the OX and OY axes, the resulting projection areas are identical. The ratios of the projection areas to the area at 0° are 1/2, √3/2, and 2/2, respectively.
Agriculture 15 00931 g004
Figure 5. DJI T30 UASS, nozzles and nozzle droplet size distribution. A total of 12 nozzles were used in the spraying operation of the UASS, and images of the nozzles, their numbers, and the corresponding droplet size data (Dv0.1, Dv0.5, and Dv0.9) are shown on both sides of the Figure.
Agriculture 15 00931 g005
Figure 6. GBL, MS, and PVC sampler elution recovery results. The values shown represent the average of four replicate measurements of elution recovery.
Agriculture 15 00931 g006
Figure 7. Plot of elution recovery trends and significance results. In Figure 7b, letters indicate significant differences in elution recoveries for the same sampler across RB concentrations, while asterisks (*) denote significant differences between different samplers.
Agriculture 15 00931 g007
Figure 8. Trends in sedimentation volume (ae). The deposition volume graph includes bar charts and dotted line graphs, where the horizontal axis represents the angle and the vertical axis represents the deposition volume. Since the deposition volume values at different concentrations are not continuous, drawing line graphs is not practically meaningful; instead, the overall trend is indicated by the dashed dot line graphs.
Agriculture 15 00931 g008
Figure 9. Correlation results of the amount of droplet deposition at different RB spray solution concentrations.
Agriculture 15 00931 g009
Figure 10. Distribution of droplet deposition quotient results.
Agriculture 15 00931 g010
Figure 11. The projection results of the droplet deposition and integral area chart. The line graphs represent the projection results of the droplet deposition determined by the four samplers, the bar graphs represent the values of the integral area of the droplet deposition under each angular projection, and the shading represents the cumulative value of the integral area. The left axis shows the droplet deposition value and the right axis shows the integral value.
Agriculture 15 00931 g011
Figure 12. Multi-angle linear fitting results.
Agriculture 15 00931 g012
Figure 13. Droplet number (a) and droplet size spectrum (b).
Agriculture 15 00931 g013
Table 1. Droplet size classification standard (ASABE S572.3).
CategorySymbolApprox. Dv0.5 (μm)
Extremely FineXF<50
Very fineVF50~100
FineF100~150
MediumM150~190
CoarseC190~275
Very CoarseVC275~350
Extremely CoarseXC350~480
Ultra CoarseUC480~660
Table 3. Field spraying experiment.
TreatmentConcentration
(g/L)
RepetitionTypes of SamplersNumber of AngelsTotal Number of Samplers
T10.1549180
T20.5549180
T31.0549180
T45.0549180
T510.0549180
Note: The 4 samplers in the table are GBL, MS, PVC card, and WSP.
Table 4. Angle settings for the field spraying experiment.
TreatmentRotation AxisReverse RotationAngle Setting
M1~M9OXA0°(M1)A + 30°(M2)
A − 30°(M3)
A + 60°(M4)
A − 60°(M5)
OYBB + 30°(M6)
B − 30°(M7)
B + 60°(M8)
B − 60°(M9)
Note: A and B in the table correspond to the OX and OY rotation axes, respectively. Each axis is set to ±30° and ±60°, including the 0° angle of the horizontal plane where the OXY axis is located, resulting in a total of 9 angles.
Table 5. SX110015VS spray head atomization performance parameters.
No.SV (%)V<150
(%volume)
V<200
(%volume)
V<250
(%volume)
RS
Dv0.1Dv0.5Dv0.9
13.961.962.280.480.750.871.07
23.342.462.530.420.680.861.12
34.932.622.900.460.750.871.13
43.022.402.900.450.750.871.13
54.622.143.250.440.700.811.15
63.973.532.040.440.680.801.16
72.892.692.970.420.640.831.11
82.813.203.240.410.660.811.15
94.414.694.100.450.680.861.23
104.042.073.680.420.630.831.10
112.913.201.260.410.640.771.10
123.102.691.880.450.670.771.12
Table 6. Fitting of the deposition ratio.
Concentration (g/L)WSP–GBLWSP–MSWSP–PVC
Fitting ResultR2Fitting ResultR2Fitting ResultR2
0.1y = 2.419x − 0.0360.910y = 2.631x − 0.0580.827y = 2.771x − 0.0960.873
0.5y = 2.060x − 0.0010.926y = 2.039x − 0.0090.898y = 1.854x − 0.0040.862
1.0y = 2.290x − 0.0010.696y = 2.151x + 0.0010.711y = 2.212x − 0.0600.773
5.0y = 1.718x − 0.0460.903y = 1.663x − 0.0540.919y = 1.617x − 0.0810.948
10.0y = 1.178x + 0.2450.171y = 1.188x + 0.2370.175y = 1.063x + 0.2490.171
Note: In the table, WSP–GBL refers to the fit coefficient between the droplet deposition results determined by WSP and those determined by GBL elution, and R2 represents the goodness of fit for the fitted linear regression.
Table 7. Coefficient of variation in deposition.
TypeConcentration
(g/L)
A + 30°A + 60°A − 30°A − 60°B + 30°B + 60°B − 30°B + 60°Average Value
GBL0.110.66.922.8 *8.321.1 *8.76.38.015.4 *12.0
0.514.322.3 *10.516.3 *33.5 *26.8 *16.9 *35.6 *6.620.3 *
1.038.7 *12.822.1 *33.6 *33.0 *31.3 *18.9 *28.9 *28.9 *27.6 *
5.023.916.8 *11.714.213.410.28.914.112.514
10.09.115.2 *8.715 *11.8123 *9.722.9 *10.325.1 *
MS0.11.26.611.717.4 *8.510.218.2 *0.05815.7 *10.6
0.57.020.2 *10.329.0 *25.0 *10.84.039.7 *27.1 *19.2 *
1.023.3 *16.7 *11.411.330.7 *34.8 *15.1 *15.7 *34.2 *21.5 *
5.010.41113.28.917.6 *11.58.922.6 *25.9 *14.4
10.02.75.815.9 *11.11.25.08.815.6 *21.6 *9.74
PVC0.115.6 *8.319.7 *19.7 *8.413.218.9 *12.76.413.7
0.57.39.817.7 *23.9 *19.9 *15.4 *13.433.5 *15.4 *17.4 *
1.010.12.22.329.1 *1313.47.516.4 *7.911.3
5.017.3 *7.85.714.814.84.710.624.2 *9.812.2
10.09.411.412.115.7 *74.8 *7.33.119.2 *18.9 *19.1 *
WSP0.133.5 *15.8 *16.9 *10.915.6 *5.05.425.5 *10.815.5 *
0.516.0 *25.5 *23.9 *30.3 *21.5 *23.8 *14.328.1 *32.6 *24.0 *
1.05.14.922.9 *31.7 *12.420.8 *17.8 *25.8 *12.117.1 *
5.07.414.716.5 *18.1 *15.5 *10.53.81318.4 *13.1
10.015.8 *5.123.3 *30.8 *5.05.88.117.5 *20.6 *14.7
Note: * in the table represents a coefficient of variation greater than or equal to 15%.
Table 8. Angle-specific droplet deposition linear fitting results.
Sampling AnglesLinear Fitting Result
WSP–GBLWSP–MSWSP–PVC
1.583 ± 0.1381.528 ± 0.1231.402 ± 0.073
A + 30°1.890 ± 0.0561.739 ± 0.1091.632 ± 0.074
A + 60°1.604 ± 0.0701.540 ± 0.0641.377 ± 0.094
A − 30°1.353 ± 0.0601.267 ± 0.0671.245 ± 0.044
A − 60°1.290 ± 0.0271.221 ± 0.0561.176 ± 0.036
B + 30°1.616 ± 0.0331.583 ± 0.0421.444 ± 0.062
B + 60°1.445 ± 0.0431.417 ± 0.0411.343 ± 0.053
B − 30°1.794 ± 0.0321.690 ± 0.1721.490 ± 0.098
B − 60°1.244 ± 0.0601.129 ± 0.0481.041 ± 0.058
Table 9. Comparison of the correction coefficients for droplet deposition between WSP and three samplers using three methods.
Analytical MethodQuotient ValueIntegral ValueLinear Fit
Types of
samplers
GBLMSPVCGBLMSPVCGBLMSPVC
Correction
coefficients
1.5471.4711.3541.5431.4781.3121.5071.4781.391
Disclaimer/Publisher’s Note: The statements, opinions and data contained in all publications are solely those of the individual author(s) and contributor(s) and not of MDPI and/or the editor(s). MDPI and/or the editor(s) disclaim responsibility for any injury to people or property resulting from any ideas, methods, instructions or products referred to in the content.

