Abstract
Accurate and effective fruit tracking and counting are crucial for estimating tomato yield. In complex field environments, occlusion and overlap of tomato fruits and leaves often lead to inaccurate counting. To address these issues, this study proposed an improved lightweight YOLO11n network and an optimized region tracking-counting method, which estimates the quantity of tomatoes at different maturity stages. An improved lightweight YOLO11n network was employed for tomato detection and semantic segmentation, which was combined with the C3k2-F, Generalized Intersection over Union (GIoU), and Depthwise Separable Convolution (DSConv) modules. The improved lightweight YOLO11n model is adaptable to edge computing devices, enabling tomato yield estimation while maintaining high detection accuracy. An optimized region tracking-counting method was proposed, combining target tracking and region detection to count the detected fruits. The particle swarm optimization (PSO) algorithm was used to optimize the detection region, thus enhancing the counting accuracy. In terms of network lightweighting, compared to the original, the improved YOLO11n network significantly reduces the number of parameters and Giga Floating-point Operations Per Second (GFLOPs) by 0.22 M and 2.5 G, while achieving detection and segmentation accuracies of 91.3% and 90.5%, respectively. For fruit counting, the results showed that the proposed region tracking-counting method achieved a mean counting error (MCE) of 6.6%, representing a reduction of 5.0% and 2.1% compared to the Bytetrack and cross-line counting methods, respectively. Therefore, the proposed method provided an effective approach for non-contact, accurate, efficient, and real-time intelligent yield estimation for tomatoes.
1. Introduction
Tomatoes are one of the three major traded vegetables globally and hold a significant position in international vegetable trade. Timely and accurate yield prediction before harvest is of great importance. Estimating the yield of tomato fruits before harvest can provide effective growth information to assist growers in adjusting their planting strategies. Additionally, since harvested fruits have a short shelf life, accurate yield estimates can offer valuable insights for storage, logistics, and effective marketing [1]. However, when estimating the yield of fruits at different growth stages, traditional manual picking and observation methods, which are labor-intensive, often suffer from inaccuracies due to leaf occlusion, dense growth, and difficulties distinguishing maturity levels [2]. Traditional machine vision for fruit target detection primarily relies on manually designed operators to identify and locate fruits [3,4]. This method requires substantial human intervention and necessitates the adjustment of operators across different scenarios, resulting in relatively poor flexibility and adaptability. Accurate target detection, semantic segmentation, and multi-target tracking are prerequisites for tomato yield estimation. Multi-target tracking can effectively address issues such as target loss and repeated counting caused by occlusions in complex environments [5,6,7].
In recent years, computer vision combined with artificial intelligence (AI) has been introduced into agricultural production to replace labor-intensive activities [8,9,10,11,12]. Juntao et al. [13] employed the Faster R-CNN method to detect green citrus fruits of varying sizes under different lighting conditions, achieving a mean average precision (mAP) of 85.49% on the test set, albeit with a slower detection speed. Lai et al. [14] enhanced the feature extraction capability of the YOLOv7 network by introducing a parameter-free attention module (SimAM) and utilized a Max Pooling Convolution (MPConv) structure to mitigate information loss during downsampling. The improved model was applied to detect pineapples at different maturity stages in complex field environments, resulting in an increase of 2.71% and 3.41% in the model’s mAP and recall, respectively. Yu et al. [15] refined the Mask R-CNN network by using ResNet50 as the backbone network, deepening the network structure to extract more image features while reducing the number of parameters, thereby enhancing the performance of target detection for picking robots. The average detection accuracy for mature and immature strawberry fruits reached 95.78%, with a recall rate of 95.41%, and the mean intersection over union (MIoU) for instance segmentation was 89.85%. The aforementioned algorithms typically exhibit high model complexity. To enable their operation on embedded devices, it is necessary to reduce the computational load and the number of parameters in the algorithms to improve inference speed. Zeng et al. [16] proposed a lightweight tomato object detection method by improving the YOLOv5 algorithm. Their approach integrates a downsampling convolution layer and the neck module from MobileNetV3 while applying channel pruning to the neck layer. Xu et al. [17] developed a lightweight SSV2-YOLO model based on YOLOv5s for detecting sugarcane aphids. The model reconstructs the backbone network using Stem and ShuffleNet V2 and adjusts the width of the neck network. Lin et al. [18] proposed an improved YOLOv8n network model that integrates the FasterNet, Depthwise Separable Convolution (DSConv) modules, and the Generalized Intersection over Union (GIoU) loss function. This model is designed to be lightweight for deployment on edge computing devices while maintaining high detection accuracy, enabling the real-time detection of peanut leaf diseases.
Most existing research on fruit counting is based on image analysis. Chen et al. [19] used deep learning to count fruits on a single-sided view of citrus plants to estimate yield. They first extracted fruit regions using a fully convolutional neural network and then applied a VGG-16-based counting network to count fruits within the regions, achieving a counting accuracy of 91.3% on single-sided views. Koirala et al. [20] developed the MangoYOLO model, which achieved an F1-score of 96.8% for detecting mangoes in natural environments. To estimate the number of mangoes, they first collected two-sided views of mango plants, then detected the number of fruits using MangoYOLO, and finally estimated the yield using correction coefficients, with a yield error ranging between 4.6% and 15.2% across five orchards. However, both the single-view and two-view methods face challenges in recognizing multiple scales of target fruits due to occlusion. Rahnemoonfar and Sheppard [21] optimized the Inception-ResNet network structure, enabling the identification of fruits even in conditions of shadows, branch and leaf occlusion, or overlap between fruits, achieving an average testing accuracy of over 90%. Although this method provided high recognition accuracy, its detection speed was relatively slow. Chen et al. [19] described a fruit counting method based on deep learning, which achieved precise fruit counting in complex natural environments, even under high occlusion. Zhang et al. [22] proposed a region tracking and counting method to mitigate the issue of double-counting caused by fruit occlusion, achieving an average counting error of 8%. However, this method did not optimize the counting regions. Despite the progress made by current methods in improving fruit counting and yield estimation accuracy, challenges such as occlusion, complex backgrounds, and variability in fruit positioning still remain and lead to undercounting or double-counting of fruits [23,24,25].
Therefore, in response to the challenges and demands for accuracy and speed in tomato yield estimation, a yield estimation method consisting of an improved lightweight YOLO11n model and an optimized region tracking-counting method was established. The specific contributions are as follows: (1) A residual feature learning module, C3k2-F, based on the FasterNet module, was designed and integrated into the backbone and neck networks to enhance detection speed while maintaining accuracy. (2) By introducing DSConv to replace the Conv layers in the baseline YOLO11n network, the computational complexity of the model was effectively reduced without increasing the number of parameters. Additionally, the GIoU loss function was used to replace the CIoU loss function in the baseline YOLO11n network, and distribution focal loss (DFL) was adopted as the regression loss function to enhance accuracy. (3) An optimized region tracking-counting method was proposed and optimized for fruit counting in complex environments with occlusions and overlaps between leaves and fruits.
2. Materials and Methods
2.1. Dataset Preparation
The data were collected in June 2023. Tomato images were collected in two batches in a greenhouse belonging to Jiangsu Xingang Agricultural Technology Co., Ltd. (Zhenjiang, China). As shown in Figure 1, an Intel RealSense D435 camera was used for image acquisition. The camera resolution was set to 1280 × 720, and it was mounted on a vertical sliding rod that can be moved up and down. The camera was connected to a Jetson Orin NX (NVIDIA Corporation, Santa Clara, CA, USA) via a USB 3.0 interface. To ensure an optimal field of view, the sliding rod was fixed at a distance of approximately 1.2 m from the tomato crop rows. This setup also included a rail cart, which was used to carry all the equipment, allowing for easy movement of the experimental setup to different locations.
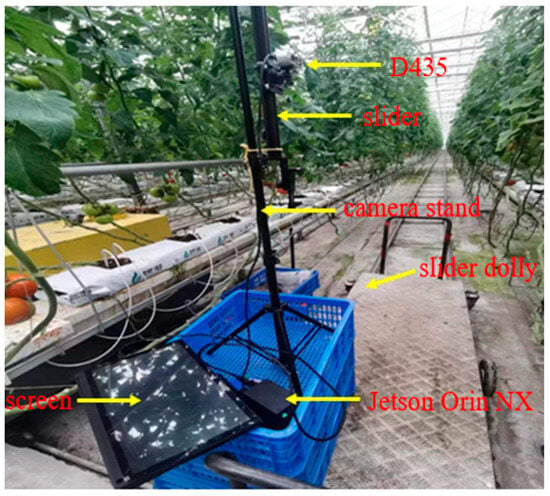
Figure 1.
Image acquisition platform.
As shown in Figure 2a–c, images were collected at different growth stages, with varying levels of occlusion and under different lighting conditions, resulting in a total of 808 raw images. For model training and performance testing, 242 sample images were randomly selected to form a test dataset, while the remaining 566 sample images constituted the original training and validation datasets. To facilitate the input of samples into different networks for comparative experiments, the image resolution was uniformly compressed to 640 × 640, which also reduced the computational requirements during image training and increased the training speed. The Labelme (version 5.5.0) annotation tool was used to label the tomatoes in the images, with maturity levels judged by RGB values and categorized into three types—ripe, semi-ripe, and unripe. All image annotations follow a uniform standard: the outline of the tomato was annotated, including the parts of the tomato that are obscured, and fruits with pixels less than 2500 were not annotated. As shown in Figure 2d, tomatoes marked with red dots represent ripe tomatoes, those marked with green dots represent semi-ripe tomatoes, and those marked with yellow dots represent unripe tomatoes.
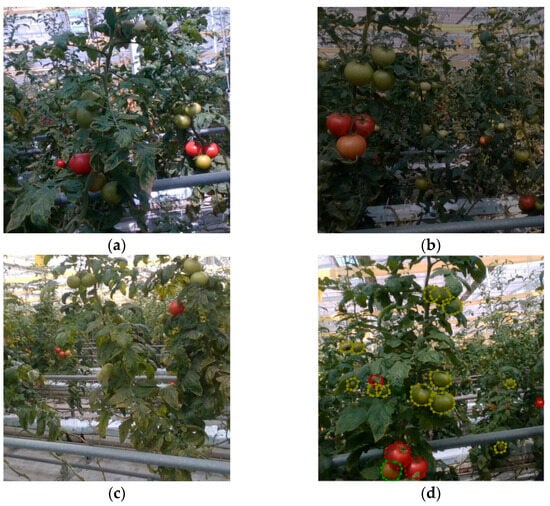
Figure 2.
Sample images under normal lighting conditions (a), dark environment (b), severe occlusion (c), and annotated image (d). In image (d), red markers indicate ripe tomatoes, green markers indicate semi-ripe tomatoes, and yellow markers indicate unripe tomatoes.
To evaluate the accuracy of fruit tracking and counting algorithms, videos were also recorded using the aforementioned platform, with the rail cart moving forward at a constant speed during recording. The recorded videos were divided into 21 segments, each lasting 30 s. Among these segments, eight were used as the training set for fruit tracking and counting algorithms, four as the validation set, and nine as the test set. The video resolution was 1280 × 720, with a frame rate of 30 frames per second.
2.2. Model Construction
2.2.1. YOLO11 Network
YOLO11 [26] represents the latest version of the YOLO series [27], integrating tasks such as object classification, detection, and segmentation into a unified framework. YOLO11 included YOLO11n, YOLO11s, YOLO11m, YOLO11l and YOLO11x. Owing to the actual experimental scenario, the lightest YOLO11n was chosen as our baseline network. YOLO11n adopts an improved CSPNet structure, incorporating a C2PSA module after the SPPF module. By extending the C2f structure of YOLOv8n and introducing the Position-Sensitive Attention (PSA) mechanism, the model enhances its feature extraction capability and attention mechanism. Additionally, YOLO11n replaces the original C2f module with the C3k2 module in both the backbone and neck sections, enhancing the module’s flexibility across different application scenarios. Finally, in the detection head, YOLO11n adds two DWConv (Depthwise Convolution) to the classification detection head of YOLOv8n to enhance computational efficiency. Through these design optimizations, YOLO11n achieves a better balance between performance and efficiency.
2.2.2. DSConv
DSConv [28] is an efficient convolution operator designed to accelerate convolutional neural network (CNN) computations and reduce memory usage through quantization. This operator replaces traditional single-precision operations with faster integer operations, maintaining close accuracy even at lower bit depths. DSConv is composed of DWConv and pointwise convolution (PWConv), combining these two steps to achieve the functionality of traditional convolution. In DWConv, a separate convolution kernel is applied to each input channel independently, without mixing information across channels. Subsequently, the PWConv uses a 1 × 1 kernel to fuse information from different channels. This structure significantly reduces computational load and the number of parameters, enhancing runtime efficiency while preserving model accuracy. Additionally, DSConv incorporates block floating-point quantization for activation values, further optimizing computational performance. DSConv’s versatility has been validated across various mainstream neural network architectures, enabling seamless substitution for standard convolution modules in networks like ResNet, DenseNet, GoogLeNet, MobileNet, and Xception. Experimental results demonstrate that DSConv is an efficient, flexible, and robust convolution operator, suitable for diverse neural network applications, addressing both computational resource constraints and model performance requirements [29].
2.2.3. C3k2-F Structure
FasterNet is a fast neural network designed by Chen et al. [30], which achieves much higher operating speeds than other networks on a wide range of devices without compromising accuracy in a variety of visual tasks. The core building blocks of FasterNet are shown in Figure 3, where the PConv layer is the basic structure of FasterNet. The PConv layer can extract spatial features more efficiently by simultaneously reducing redundant computations and memory accesses, and can effectively reduce the number of floating point operations (FLOPs).
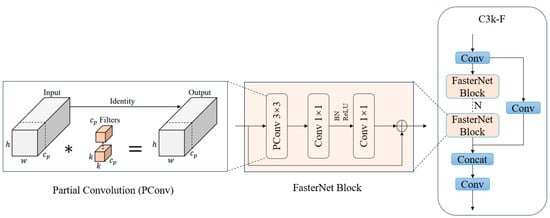
Figure 3.
Structure diagram of the FasterNet block and C3k-F block. The FasterNet block contains PConv, and C3k-F contains several FasterNet blocks.
This paper proposes an improved version of the C3k2-F block by combining FasterNet and C3k2. As shown in Figure 4, the C3k2-F block divides the input features into two parts, one of which is passed directly through the Conv operation, and the other through multiple C3K-F (when C3k = True) or FasterNet block structures for deep feature extraction. The features from the two branches are fused through the Concat operation, and then finally passed through the Conv. The C3k-F is improved by replacing the Bottleneck layer in the C3k module with the FasterNet block. In essence, C3k2-F is a fast and efficient operator that effectively reduces the number of references of FLOPs while maintaining high feature extraction efficiency.
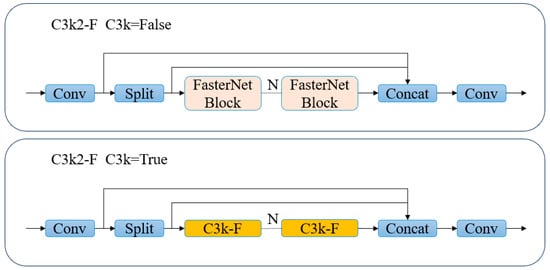
Figure 4.
Structure diagram of the C3k2-F block. When C3k is false, the C3k2-F contains several FasterNet blocks; otherwise, it contains several C3k-F blocks.
2.2.4. Improved YOLO11n Network
To achieve accurate tomato yield estimation and lightweight adaptation to mobile computing devices, an improved YOLO11n network was proposed, which was combined with the C3k2-F, GIoU [31], and DSConv modules. The architecture of the improved YOLO11n network is illustrated in Figure 5. The model comprised three main components—backbone, neck, and head. The improved YOLO11n network incorporates several enhancements compared to the baseline YOLO11 network. First, a residual feature learning module based on FasterNet—C3k2-F—was designed to effectively reduce unnecessary computation and memory usage while maintaining high accuracy. Second, DSConv was introduced to replace the Conv layer in the baseline YOLO11n network, effectively reducing the model’s computational complexity without increasing the parameter count. The network structure of YOLO11 in Figure 5 highlights the exact positions of DSConv and DWConv. Finally, the GIoU loss function was incorporated to replace the CIoU loss function in the baseline YOLO11n network, along with Distribution Focal Loss (DFL) and BCELoss as the regression loss function to improve accuracy. These improvements leverage quantization techniques and partial spatial feature extraction, resulting in a lightweight version of the baseline YOLO11n network.
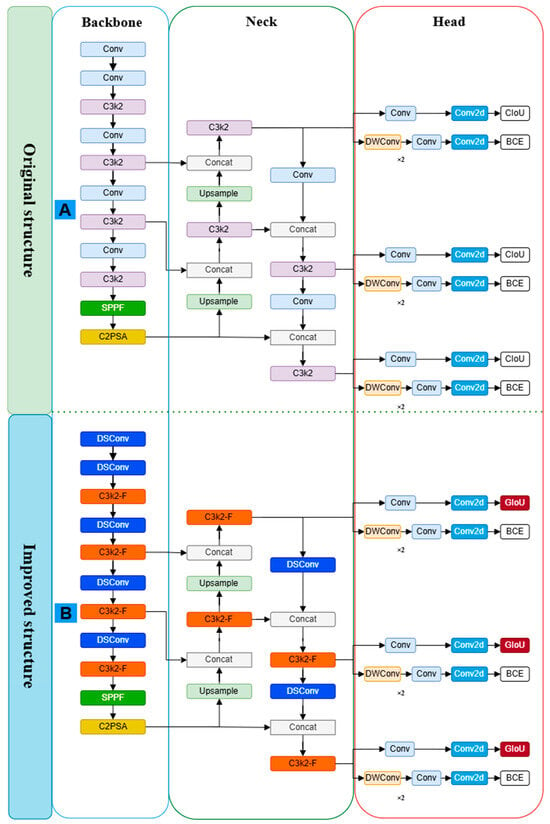
Figure 5.
Structure diagram of YOLO11n. (A) Original YOLO11n structure. (B) Improved YOLO11n structure.
2.3. Fruit Tracking and Counting Methods
2.3.1. Fruit Tracking and Counting
The Bytetrack algorithm [32] integrated into the YOLO11n model was used for fruit tracking in the videos. As shown in Figure 6, the fruit tracking process involved the following steps: (1) Object detection: The improved YOLO11n model was employed to detect tomatoes in the videos, providing the bounding boxes and corresponding features of the detected objects. (2) State estimation: The Kalman filter algorithm [33] was used to estimate the position and state of the targets in the next frame of the video. (3) Track Matching: The Hungarian algorithm [34] performed optimal matching between objects across consecutive frames to generate the object’s trajectory within the video.
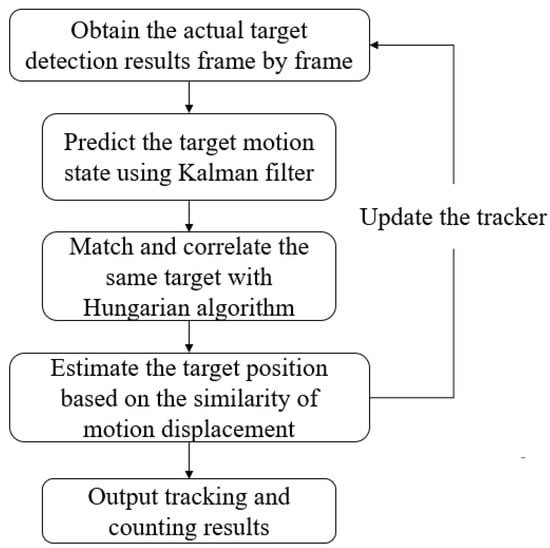
Figure 6.
Flowchart of the Bytetrack algorithm.
If the track matching failed, the trajectory was temporarily stored and continued to participate in future frame estimations. If an object remained unmatched across multiple frames, it was treated as a disappeared object, and its trajectory was then removed. A successful match output the result with parameter updates and restarted the target detection. Each successfully tracked tomato fruit was assigned a unique ID for counting. In practical applications, the tracking and counting method encountered some challenges. If the fruit ID was misassigned or mismatch cases occurred, the counting results would suffer from substantial counting errors [35]. To address this issue, a cross-line counting method was designed and implemented. The core idea of this method is to set a virtual counting line in the center of the camera’s field of view, as shown in Figure 7 (the yellow vertical line). Considering that the camera is in motion during actual detection, this design ensures that all detected tomato fruits will inevitably cross the counting line during their movement. When fruits intersect with the counting line, they will be counted. The advantage of this method is that it does not rely on continuous target tracking or accurate ID recognition, significantly reducing counting errors caused by ID mismatches.
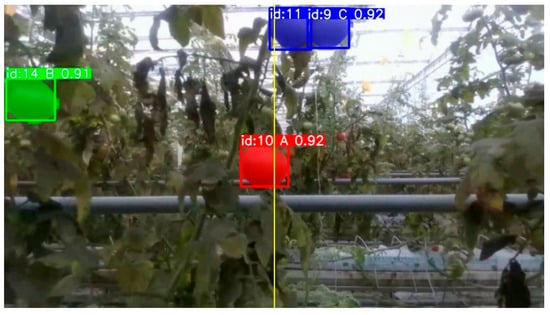
Figure 7.
Illustration of the collision line counting method. The yellow vertical line is the counting line. When fruits intersect with the counting line, they will be counted. ID represents the results of the Bytetrack algorithm, with A, B, and C representing ripe, semi-ripe, and unripe fruits, respectively, and the rightmost digit indicating the confidence level.
2.3.2. Region Tracking-Counting Method
Although the cross-line counting method addressed the issue of inaccurate counting caused by ID mismatches and tracking errors, it may still encounter cases where fruits are occluded by leaves when crossing the counting line, leading to a missed count. To overcome this limitation, the cross-line counting method was optimized by widening the center line into a region, which was named a region-based tracking-counting method. In this approach, a region that is symmetrical along the vertical centerline of an image was defined (Figure 7) as the counting region. Whenever a target bounding box began to enter the detection area, its ID value was recorded and counted, avoiding the miss count due to occlusion between leaves and fruits. Figure 8 illustrates the principle of the region tracking-counting method.
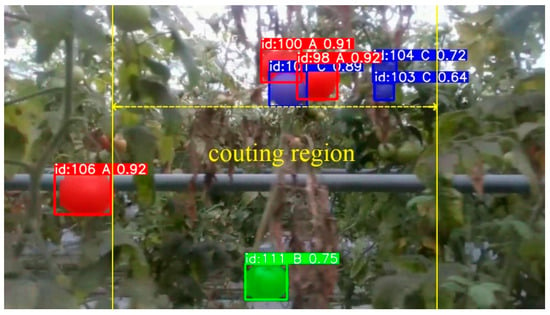
Figure 8.
Illustration of the region tracking-counting method. The valid counting region is the region between the two yellow lines, while regions outside these lines are excluded from the counting process.
In Figure 8, it was observed that the number of counted fruits within the region varied with the width of the region, and there should be an optical region width that provides the best counting performance. Therefore, the particle swarm optimization (PSO) algorithm [36] was used to determine the optimal width of the counting region. The fitness function for the PSO algorithm was defined as the root mean squared error (RMSE) between the true and counted fruit numbers with the video dataset, as illustrated by Equations (1) and (2). The height (h) of the counting region was fixed at 720 (i.e., the vertical resolution of the image), and the range of the width of the counting region (x) was set to [0, 1280]. The fitness function processed the input as follows. When the region width was provided to the fitness function, the round and mod functions were used to perform rounding and modulo operations to ensure the result was an even number. The region tracking-counting method was then applied to different videos to obtain the count value (Equation (1)). Finally, the RMSE was computed as the fitness value of the function (Equation (2)).
where represents the width of the counting region in pixels, denotes the count obtained from the algorithm, is the region tracking-counting method, indicates the number of videos, represents the counted number of fruits in the -th video, denotes the actual number of fruits in the -th video, and is the fitness function.
2.4. Evaluation Metrics
The platform used for training the detection network was a desktop computer running Ubuntu 20.04, equipped with an 11th-generation Intel i9-11900K processor and an NVIDIA GTX3080Ti GPU (NVIDIA Corporation, Santa Clara, CA, USA). The network was built using the PyTorch 1.13.1 framework, and the experimental environment was configured in a virtual environment created with Anaconda3, including Python 3.7, CUDA 11.6, and cuDNN 8.9.2. The training parameters were set as follows: the input image size was 640 × 640, the number of training epochs was set to 200, the batch size was 16, and the IoU threshold for training and testing was set to 0.7. The stochastic gradient descent (SGD) optimizer was employed, with an initial learning rate of 0.01, a weight decay coefficient of 0.0005, and a momentum of 0.937. Additionally, the official pre-training weights were loaded for this study.
2.4.1. Evaluation Metrics for Improved YOLO11n Network
To evaluate the performance of the improved YOLO11n through detection results, precision (P), recall (R), average precision (AP), and mean average precision (mAP) were selected as evaluation metrics. P, R, AP, and mAP can be calculated using Equations (3)–(6).
where TP represents the number of correctly detected tomatoes (True Positives), FP represents the number of incorrectly detected tomatoes (False Positives), and FN represents the number of missed detections (False Negatives), and N represents the number of categories.
Additionally, Param, Memory, FLOPs, Giga Floating-point Operations Per Second (GFLOPs), and MemR + W were chosen as the evaluation metrics to evaluate the improved YOLO11n network of lightweight performance.
2.4.2. Evaluation Metrics for Fruit Tracking-Counting Method
For evaluating fruit tracking and counting method, the following evaluation metrics were employed including mean precision (MP), mean error (ME), mean repetition (MR), and mean counting error (MCE). The formula for each evaluation metric is presented as follows:
where represents the total number of tomato video samples, denotes the total number of video frames, indicates the predicted number of tomatoes in the -th frame of the -th video, represents the number of falsely recognized tomatoes in the -th frame of the -th video, and denotes the actual number of tomatoes in the -th frame of the -th video. Additionally, refers to the number of duplicate tomatoes in the -th video, represents the actual number of tomatoes in the -th video, indicates the predicted number of tomatoes in the -th video.
3. Results and Discussion
3.1. Ablation Experience
Ablation experiments were performed to verify the efficacy of each component within the proposed lightweight YOLO11n network. In this study, YOLO11n was adopted as the baseline, and the C3k2-F, DSConv, and GIoU modules were utilized to achieve a lightweight optimization of the baseline network. The performance of the improved YOLO11n network was analyzed on the test set, with the corresponding results presented in Table 1. Comparing the YOLO11n+C3k2-F network with the baseline YOLO11n network, it can be observed that the P for box and seg increased by 1.3% and 1.2%, respectively, while simultaneously achieving a reduction of 0.22 M in Param and 0.7 G in GFLOPs. This indicates that the C3k2-F block can effectively reduce the algorithm’s parameter count and computational complexity while improving its accuracy. The subsequently introduced DSConv module further reduced the GFLOPs by 1.8G. DSConv significantly reduces the computational complexity of the network by decoupling operations in the spatial and channel dimensions, while both DSConv and Conv possess certain feature extraction capabilities. Lyu et al. [37] enhanced the flexibility of the algorithm by replacing some Conv layers with DSConv in YOLOv8-seg, which is beneficial for the segmentation of long-stemmed and irregularly edged weeds. This also demonstrates the effectiveness of DSConv. Finally, the introduction of the GIoU loss function effectively improved the model’s P, while slightly reducing the mAP and R. This is because GIoU not only focuses on the overlapping regions but also takes into account other non-overlapping areas, thereby providing a more accurate reflection of the degree of overlap between the two. Furthermore, GIoU exhibits higher computational efficiency compared to CIoU, making it more suitable for the efficient operation of embedded devices. The results indicate that in the box task, P, R, mAP@50, and mAP@50:90 were 91.30%, 86.20%, 93.30%, and 65.80%, respectively. Similarly, in the seg task, these metrics were also 90.50%, 85.40%, 92.30%, and 59.30%, respectively. Notably, the model’s Param and GFLOPs were 2.66 M and 8.0G, respectively. In conclusion, the ablation experiments demonstrate that the improvements, including C3k2-F, DSConv, and GIoU, contribute to the lightweight design of the YOLO11n network while enabling it to better address challenges such as accurate detection and segmentation of tomato fruits in complex growth environments.

Table 1.
Improved YOLO11n ablation experiment results.
3.2. Comparison with Other Networks
In terms of object and segment detection, systematic comparative experiments were conducted between the improved lightweight YOLO11n and networks including Mask-RCNN [38], YOLOv5n [39], YOLOv6n [40], YOLOv7 [41], and YOLOv8n [42]. Evaluation metrics encompassed P, mAP@50, FPS, Param, and GFLOPs. As shown in Table 2, the results demonstrate that compared to YOLOv5n and YOLOv6n, the improved lightweight YOLO11n demonstrates significant improvements in P and mAP@50. However, YOLOv5n and YOLOv6n demonstrate faster detection speeds, reaching 116 FPS and 84 FPS, respectively. Among the compared networks, Mask-RCNN and YOLOv7 achieved the highest accuracy, being closest to the improved lightweight YOLO11n. However, this precision improvement comes at the cost of significantly increased model complexity: compared to the lightweight YOLO11n, their FPS, Param, and GFLOPs entirely fail to meet the performance requirements of embedded devices. The aforementioned algorithms struggle to achieve a balance between detection accuracy and model complexity. The YOLOv8 and YOLO11 networks share certain similarities, and some researchers have modified YOLOv8 for tomato detection to meet the requirements of embedded devices. Yue et al. [43] proposed an improved YOLOv8s-Seg network, which enhanced the feature fusion capability of the algorithm, thereby improving the accuracy and speed of real-time instance segmentation for tomatoes. The Param and GFLOPs of YOLOv8n reached 3.40 M and 12.6 G, respectively. However, this lightweight design comes at the expense of accuracy: compared with the improved lightweight YOLO11n, YOLOv8n exhibits reductions of 2.9% in P, 3.8% in mAP@50 in the box task, and 2.7% in P, 3.6% in mAP@50 in the seg task. This is because, compared to the C2F block in YOLOv8n, the C3k2-F block in improved YOLO11n has stronger feature extraction capabilities while being less complex. Compared to the conv module in YOLOv8n, the DSConv module in improved YOLO11n also has lower GFLOPs. Notably, the Improved YOLO11n achieved a detection speed of 62 FPS, the total runtime was 4.05 s, meeting the requirements for real-time detection and segmentation of tomato fruits in the field. Overall, the enhanced lightweight YOLO11n achieves the most lightweight performance in tomato detection and segmentation tasks while maintaining superior accuracy metrics.

Table 2.
Comparison results of different networks.
Finally, several representative images were selected from the test dataset to visualize the performance of the improved YOLO11n network. Figure 9(a1,a2) show the test results of the YOLOv8n network, Figure 9(b1,b2) present the results of the baseline YOLO11n network, while Figure 9(c1,c2) demonstrate the outcomes of the improved YOLO11n network. Comparing Figure 9(a1,b1,c1), the yellow bounding box in Figure 9(c1) highlights tomatoes that were undetected in Figure 9(b1), while the confidence scores on tomato detections in Figure 9(c1) are notably higher than those in Figure 9(a1). This demonstrates that the improved YOLO11n network successfully identified tomatoes previously missed due to leaf occlusion and fruit overlap issues. When contrasting Figure 9(a2,b2,c2), the yellow boxed regions in Figure 9(c2) indicate tomato areas undetected in Figure 9(a2,b2), suggesting enhanced capability of the improved network in detecting challenging tomatoes within complex backgrounds. Notably, the yellow arrow in Figure 9(c2) points to a correctly detected semi-ripe tomato, whereas this fruit was misclassified as ripe in both Figure 9(a2,b2). The improved YOLO11n network effectively achieves a lightweight design without compromising detection accuracy, as evidenced by its ability to maintain precision while resolving previous recognition errors and enhancing detection confidence.
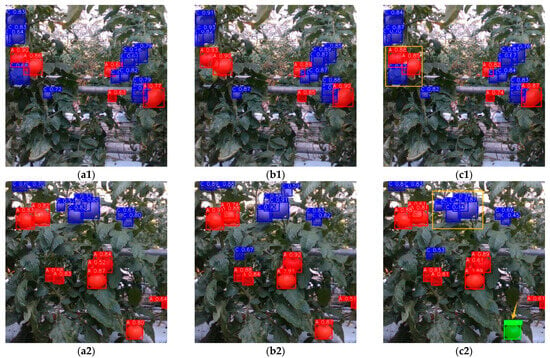
Figure 9.
Visualizing the performance of the YOLOv8n (a1,a2), YOLO11n (b1,b2) and improved YOLO11n (c1,c2).
3.3. Optimization of Region Tracking-Counting Method by PSO
The convergence process of optimizing the proposed region tracking-counting method using PSO is shown in Figure 10. The RMSE was defined as the fitness function of the PSO method. By comparing the RMSEs of the counting results for different region sizes with the true values, the optimal region size was determined. A smaller RMSE indicates higher model accuracy and better prediction performance [44]. In Figure 10, the RMSE converges to approximately 2.5, indicating that the predicted values approach the true values, aligning with the optimization objective. Figure 11 illustrates how the fitness value changes with region width. When the region width is 876, the fitness value is at its minimum, and the counting performance is optimal. Therefore, the final optimized window size is 876 × 720.
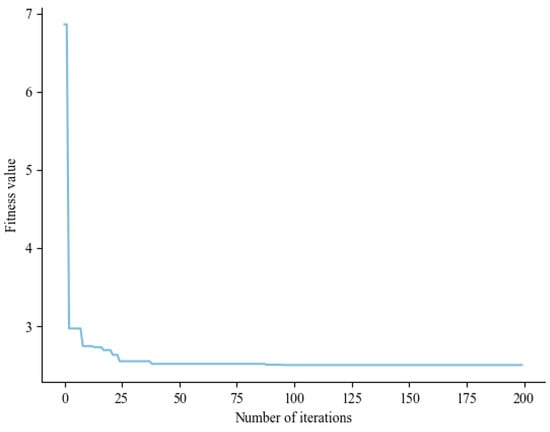
Figure 10.
Convergence process of Particle Swarm Optimization (PSO) fitness value. The number of iterations is 200, and the final fitness value converges to 2.5.
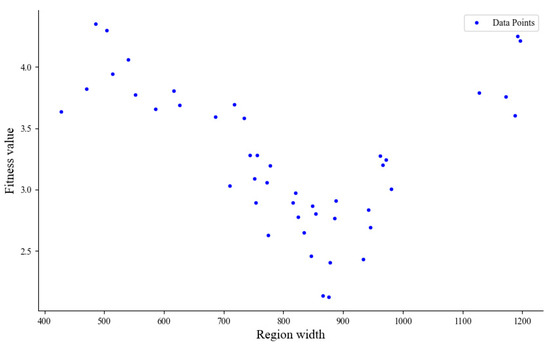
Figure 11.
Variation of fitness value with region width. When the region width is 876, the fitness value reaches its minimum.
The optimized region width was validated using the video validation set collected in Section 2.1. As shown in Table 3, the MCE between the true values and those obtained with the three methods—the cross-line counting method, the region tracking-counting method with a fixed region width of 500 pixels, and the PSO-optimized region tracking-counting method with a region width of 876 pixels—was calculated. Among these methods, the PSO-optimized region tracking-counting method exhibited the smallest MCE of 6.1%, demonstrating the effectiveness of the optimization.

Table 3.
Error analysis of different counting methods.
3.4. Fruit Counting Evaluation
Table 4 compares the fruit counting results of three counting methods—the Bytetrack method from YOLO11n, the cross-line counting method, and the PSO optimized region tracking-counting method. The results indicate that the MP of the Bytetrack method was lower, while the ME, MR, and MCE were higher compared to both the cross-line counting method and the region tracking-counting method. As illustrated in Figure 12a, the reason for the higher MR of the Bytetrack method is that the algorithm could lead to ID loss when tracking objects that were occluded for extended periods, resulting in duplicate counts. By contrast, the cross-line counting method could effectively avoid the issue of duplicate counting, yielding an MR of only 6.8%. Compared to the region tracking-counting method, the cross-line counting method provided a lower MP and higher ME and MCE because it only counted when the fruits crossed the yellow vertical line in the middle of the camera’s field of view. If a tomato was occluded while crossing the yellow line, it would lead to missed counts (Figure 12b,c). As shown in Figure 12d,e, when tomatoes are in the unripe and semi-ripe stages or between semi-ripe and ripe stages, detection errors can lead to duplicate counting for both the Bytetrack and region tracking-counting methods. In summary, the region tracking-counting method exhibits the smallest MCE and the best performance.

Table 4.
Comparisons of three counting methods.
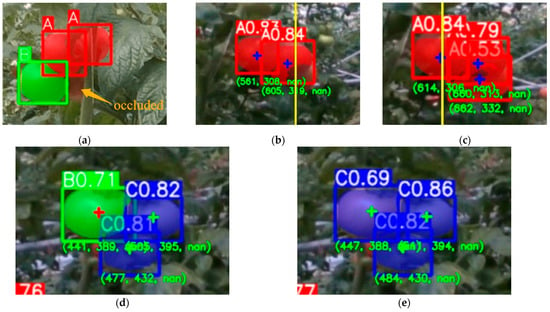
Figure 12.
Cases causing counting errors for three different counting methods. (a) Occluded fruits cause ID loss. (b,c) Fruit is occluded when crossing the vertical yellow line, causing a missed count for the cross-line method. (d,e) Fruits switched between unripe and semi-ripe classes, resulting in duplicate counts.
To better evaluate the performance of the yield estimation system consisting of the improved YOLO11n network and the proposed region tracking-counting method, the video test set collected in Section 2.1 was used. The results are shown in Table 5. The MP reflects the accuracy of the system’s counts compared to ground truth (manual counts). The MP for counting ripe fruits was the highest, reaching 93.4%, while that for semi-ripe fruits was the lowest at 71.9%. This indicates that the detection and counting system is more accurate in identifying and counting ripe tomatoes. The ME shows the proportion of the falsely recognized counts relative to the system’s counts; among all categories, the semi-ripe fruits had the highest ME value of 10.4%. This may be due to the higher similarity in color and shape between semi-ripe fruits and other categories, which increased the difficulty in identifying semi-ripe fruits with the improved YOLO11n network. In other words, if the detection model could identify the fruits accurately, the proposed region tracking-counting method could count them correctly. The MR indicates the system’s tendency to count the same fruit multiple times. The unripe fruits had the highest MR value of 11.8%, likely because the size and color variations in unripe fruits were more significant, leading the system to mistakenly count a single fruit as multiple fruits. Some semi-ripe tomatoes have RGB values close to those of ripe or unripe tomatoes, causing the detection results to fluctuate between the two ripeness levels and resulting in duplicate counts. Finally, the MCE provides an overall assessment of the system’s counting bias. The MCE for all fruits was the lowest at just 6.6%, indicating that despite significant deviations at individual maturity stages, the system could still estimate the total number of fruits accurately. Overall, these results indicate that the system performed the best when detecting and counting ripe tomatoes, while the detection and counting accuracy for unripe fruits needed improvement. The MCE for all fruits is only 6.6%, which signifies that the counting accuracy reached 93.4%, meeting the yield estimation requirements. This algorithm can be deployed on Windows industrial control computers or Linux embedded systems equipped with GPUs, such as NVIDIA’s Jetson series platforms. By deploying on the Jetson Orin NX platform, the processing speed of the whole workflow achieved an average value of 62 FPS, with a peak memory usage of about 3.1 GB, and an average power consumption of 15.6 W, meeting real-time requirements.

Table 5.
Tomato fruit counting results with the improved YOLO11n network and the proposed region tracking-counting method.
4. Conclusions
An improved lightweight YOLO11n model and an optimized region tracking-counting algorithm were proposed. Based on the YOLO11n baseline network, lightweight improvements were implemented: An enhanced C3k2-F block was proposed, whose core innovation lies in integrating the efficient feature extraction capabilities of FasterNet with the lightweight architecture of the C3k2 module, achieving an optimal balance between accuracy and computational efficiency. The improved lightweight YOLO11n model combines the C3k2-F block, DSConv, and GIoU, demonstrating stable operational performance on embedded devices. With the detection results from the improved lightweight YOLO11n model, a cross-line counting method was first proposed to avoid counting errors caused by incorrect ID matching, based on which a region tracking-counting method was proposed and optimized with the PSO algorithm to address counting errors resulting from fruit occlusions.
Experimental results of the improved lightweight YOLO11n model demonstrate that: In the box task, P, R, mAP@50, and mAP@50:90 were 91.30%, 86.20%, 93.30%, and 65.80%, respectively. Similarly, in the seg task, these metrics were also 90.50%, 85.40%, 92.30%, and 59.30%, respectively. Notably, the model’s Param and GFLOPs were 2.66 M and 8.0 G, respectively. For fruit counting, the MCE of the proposed region tracking counting method was 6.6%, achieving state-of-the-art counting accuracy. These results demonstrated that the proposed method was effective for non-contact, accurate, and efficient yield estimation of tomatoes. Embedded devices communicate with robotic systems and are compatible with agricultural management.
Despite the high accuracy of the proposed lightweight tomato yield estimation method, there is still room for improvement in future research. The detection accuracy for semi-ripe fruits was obviously lower than that for ripe and unripe fruits, leading to counting errors, and can be improved further in future by modifying detection models or incorporating spectral imaging technologies. The dataset (808 images and 21 video clips) and camera configuration may not fully capture the diversity of field conditions. In the future, the model’s generalization ability can be improved through datasets and camera configurations based on different work scenarios of varying complexity (e.g., extreme lighting or occlusion scenarios). The functionality of the yield estimation system is currently in the development stages, with relatively limited application scope and high tool costs. Further integration is needed for ease of use. In the future, we will focus on practical scenario issues and develop more applicable functions.
Author Contributions
Conceptualization, A.W. and Y.X.; methodology, A.W., Y.X. and J.L.; software, Y.X. and Q.Z.; validation, L.Z., A.L. and Q.Z.; formal analysis, Y.X. and L.Z.; investigation, D.H.; resources, D.H.; data curation, Y.X.; writing—original draft preparation, Y.X.; writing—review and editing, A.W. and J.L.; visualization, Y.X. and A.L.; supervision, A.W.; project administration, A.W. and J.L.; funding acquisition, A.W. and J.L. All authors have read and agreed to the published version of the manuscript.
Funding
This research was funded by the National Key Research and Development Program of China (No. 2022YFD2000500), Modern Agricultural Machinery Equipment and Technology Promotion Project of Jiangsu Province (No. NJ2024-26), Jiangsu Province Science and Technology Plan Special Fund Project (No. BE2022363), Zhenjiang Science & Technology Program (No. NY2024019), Jiangsu Province and Education Ministry Co-sponsored Synergistic Innovation Center of Modern Agricultural Equipment and Open Funding from the Key Laboratory of Modern Agricultural Equipment and Technology (Jiangsu University), Ministry of Education (MAET202112, MAET202303).
Institutional Review Board Statement
Not applicable.
Data Availability Statement
The data presented in this study are available on request from the corresponding author.
Conflicts of Interest
The authors declare no conflicts of interest.
References
- Anderson, N.T.; Walsh, K.B.; Koirala, A.; Wang, Z.; Amaral, M.H.; Dickinson, G.R.; Sinha, P.; Robson, A.J. Estimation of Fruit Load in Australian Mango Orchards Using Machine Vision. Agronomy 2021, 11, 1711. [Google Scholar] [CrossRef]
- Zhou, C.; Hu, J.; Xu, Z.; Yue, J.; Ye, H.; Yang, G. A Novel Greenhouse-Based System for the Detection and Plumpness Assessment of Strawberry Using an Improved Deep Learning Technique. Front. Plant Sci. 2020, 11, 559. [Google Scholar] [CrossRef] [PubMed]
- Arefi, A.; Motlagh, A.M.; Mollazade, K.; Teimourlou, R.F. Recognition and localization of ripen tomato based on machine vision. Aust. J. Crop Sci. 2011, 5, 1144–1149. [Google Scholar]
- Wang, C.; Tang, Y.; Zou, X.; Luo, L.; Chen, X. Recognition and matching of clustered mature litchi fruits using binocular charge-coupled device (CCD) color cameras. Sensors 2017, 17, 2564. [Google Scholar] [CrossRef] [PubMed]
- Zhang, F.; Chen, Z.; Ali, S.; Yang, N.; Fu, S.; Zhang, Y. Multi-class detection of cherry tomatoes using improved YOLOv4-Tiny. Int. J. Agric. Biol. Eng. 2023, 16, 225–231. [Google Scholar] [CrossRef]
- Hu, T.; Wang, W.; Gu, J.; Xia, Z.; Zhang, J.; Wang, B. Research on apple object detection and localization method based on improved YOLOX and RGB-D images. Agronomy 2023, 13, 1816. [Google Scholar] [CrossRef]
- Guan, X.; Shi, L.; Yang, W.; Ge, H.; Wei, X.; Ding, Y. Multi-Feature Fusion Recognition and Localization Method for Unmanned Harvesting of Aquatic Vegetables. Agriculture 2024, 14, 971. [Google Scholar] [CrossRef]
- Li, A.; Wang, C.; Ji, T.; Wang, Q.; Zhang, T. D3-YOLOv10: Improved YOLOv10-Based Lightweight Tomato Detection Algorithm Under Facility Scenario. Agriculture 2024, 14, 2268. [Google Scholar] [CrossRef]
- Ji, W.; Pan, Y.; Xu, B.; Wang, J. A Real-Time Apple Targets Detection Method for Picking Robot Based on ShufflenetV2-YOLOX. Agriculture 2022, 12, 856. [Google Scholar] [CrossRef]
- Wang, A.; Peng, T.; Cao, H.; Xu, Y.; Wei, X.; Cui, B. TIA-YOLOv5: An improved YOLOv5 network for real-time detection of crop and weed in the field. Front. Plant Sci. 2022, 13, 1091655. [Google Scholar] [CrossRef]
- Xu, B.; Cui, X.; Ji, W.; Yuan, H.; Wang, J. Apple Grading Method Design and Implementation for Automatic Grader Based on Improved YOLOv5. Agriculture 2023, 13, 124. [Google Scholar] [CrossRef]
- Zhang, T.; Zhou, J.; Liu, W.; Yue, R.; Yao, M.; Shi, J.; Hu, J. Seedling-YOLO: High-Efficiency Target Detection Algorithm for Field Broccoli Seedling Transplanting Quality Based on YOLOv7-Tiny. Agronomy 2024, 14, 931. [Google Scholar] [CrossRef]
- Xiong, J.; Liu, Z.; Tang, L.; Lin, R.; Bu, R.; Peng, H. Visual detection technology of green citrus under natural environment. Nongye Jixie Xuebao/Trans. Chin. Soc. Agric. Mach. 2018, 49, 45–52. [Google Scholar]
- Lai, Y.; Ma, R.; Chen, Y.; Wan, T.; Jiao, R.; He, H. A pineapple target detection method in a field environment based on improved yolov7. Appl. Sci. 2023, 13, 2691. [Google Scholar] [CrossRef]
- Yu, Y.; Zhang, K.; Yang, L.; Zhang, D. Fruit detection for strawberry harvesting robot in non-structural environment based on Mask-RCNN. Comput. Electron. Agric. 2019, 163, 104846. [Google Scholar] [CrossRef]
- Zeng, T.; Li, S.; Song, Q.; Zhong, F.; Wei, X. Lightweight tomato real-time detection method based on improved YOLO and mobile deployment. Comput. Electron. Agric. 2023, 205, 107625. [Google Scholar] [CrossRef]
- Xu, W.; Xu, T.; Alex Thomasson, J.; Chen, W.; Karthikeyan, R.; Tian, G.; Shi, Y.; Ji, C.; Su, Q. A lightweight SSV2-YOLO based model for detection of sugarcane aphids in unstructured natural environments. Comput. Electron. Agric. 2023, 211, 107961. [Google Scholar] [CrossRef]
- Lin, Y.; Wang, L.; Chen, T.; Liu, Y.; Zhang, L. Monitoring system for peanut leaf disease based on a lightweight deep learning model. Comput. Electron. Agric. 2024, 222, 109055. [Google Scholar] [CrossRef]
- Chen, S.W.; Shivakumar, S.S.; Dcunha, S.; Das, J.; Okon, E.; Qu, C.; Taylor, C.J.; Kumar, V. Counting Apples and Oranges with Deep Learning: A Data-Driven Approach. IEEE Robot. Autom. Lett. 2017, 2, 781–788. [Google Scholar] [CrossRef]
- Koirala, A.; Walsh, K.B.; Wang, Z.; McCarthy, C. Deep learning for real-time fruit detection and orchard fruit load estimation: Benchmarking of ‘MangoYOLO’. Precis. Agric. 2019, 20, 1107–1135. [Google Scholar] [CrossRef]
- Rahnemoonfar, M.; Sheppard, C. Deep Count: Fruit Counting Based on Deep Simulated Learning. Sensors 2017, 17, 905. [Google Scholar] [CrossRef]
- Zhang, W.; Wang, J.; Liu, Y.; Chen, K.; Li, H.; Duan, Y.; Wu, W.; Shi, Y.; Guo, W. Deep-learning-based in-field citrus fruit detection and tracking. Hortic. Res. 2022, 9, uhac003. [Google Scholar] [CrossRef]
- Koirala, A.; Walsh, K.B.; Wang, Z. Attempting to estimate the unseen—Correction for occluded fruit in tree fruit load estimation by machine vision with deep learning. Agronomy 2021, 11, 347. [Google Scholar] [CrossRef]
- Stein, M.; Bargoti, S.; Underwood, J. Image based mango fruit detection, localisation and yield estimation using multiple view geometry. Sensors 2016, 16, 1915. [Google Scholar] [CrossRef]
- Wang, Z.; Walsh, K.; Koirala, A. Mango fruit load estimation using a video based MangoYOLO—Kalman filter—Hungarian algorithm method. Sensors 2019, 19, 2742. [Google Scholar] [CrossRef]
- Khanam, R.; Hussain, M. Yolov11: An overview of the key architectural enhancements. arXiv 2024, arXiv:2410.17725. [Google Scholar]
- Redmon, J.; Divvala, S.; Girshick, R.; Farhadi, A. You only look once: Unified, real-time object detection. In Proceedings of the IEEE Conference on Computer Vision and Pattern Recognition, Las Vegas, NV, USA, 27–30 June 2016. [Google Scholar]
- Nascimento, M.G.d.; Fawcett, R.; Prisacariu, V.A. Dsconv: Efficient convolution operator. In Proceedings of the IEEE/CVF International Conference on Computer Vision, Seoul, Republic of Korea, 27 October–2 November 2019. [Google Scholar]
- Singh, H.; Verma, M.; Cheruku, R. Novel dilated separable convolution networks for efficient video salient object detection in the wild. IEEE Trans. Instrum. Meas. 2023, 72, 5023213. [Google Scholar] [CrossRef]
- Chen, J.; Kao, S.-h.; He, H.; Zhuo, W.; Wen, S.; Lee, C.-H.; Chan, S.-H.G. Run, don’t walk: Chasing higher FLOPS for faster neural networks. In Proceedings of the IEEE/CVF Conference on Computer Vision and Pattern Recognition, Vancouver, BC, Canada, 17–24 June 2023. [Google Scholar]
- Rezatofighi, H.; Tsoi, N.; Gwak, J.; Sadeghian, A.; Reid, I.; Savarese, S. Generalized Intersection Over Union: A Metric and a Loss for Bounding Box Regression. In Proceedings of the 2019 IEEE/CVF Conference on Computer Vision and Pattern Recognition (CVPR), Long Beach, CA, USA, 15–20 June 2019; pp. 658–666. [Google Scholar]
- Zhang, Y.; Sun, P.; Jiang, Y.; Yu, D.; Weng, F.; Yuan, Z.; Luo, P.; Liu, W.; Wang, X. Bytetrack: Multi-object tracking by associating every detection box. In Proceedings of the European Conference on Computer Vision, Tel Aviv, Israel, 23–27 October 2022; Springer: Cham, Switzerland, 2022. [Google Scholar]
- Kim, Y.; Bang, H. Introduction to Kalman filter and its applications. In Introduction and Implementations of the Kalman Filter; IntechOpen: Rijeka, Croatia, 2018. [Google Scholar]
- Kuhn, H.W. The Hungarian Method for the Assignment Problem. In 50 Years of Integer Programming 1958-2008; Springer: Berlin/Heidelberg, Germany, 2010; pp. 29–47. [Google Scholar]
- Gao, F.; Fang, W.; Sun, X.; Wu, Z.; Zhao, G.; Li, G.; Li, R.; Fu, L.; Zhang, Q. A novel apple fruit detection and counting methodology based on deep learning and trunk tracking in modern orchard. Comput. Electron. Agric. 2022, 197, 107000. [Google Scholar] [CrossRef]
- Venter, G.; Sobieszczanski-Sobieski, J. Particle Swarm Optimization. AIAA J. 2003, 41, 1583–1589. [Google Scholar] [CrossRef]
- Lyu, Z.; Lu, A.; Ma, Y. Improved YOLOv8-Seg Based on Multiscale Feature Fusion and Deformable Convolution for Weed Precision Segmentation. Appl. Sci. 2024, 14, 5002. [Google Scholar] [CrossRef]
- He, K.; Gkioxari, G.; Dollár, P.; Girshick, R. Mask r-cnn. In Proceedings of the IEEE International Conference on Computer Vision, Venice, Italy, 22–29 October 2017. [Google Scholar]
- Jocher, G.; Stoken, A.; Borovec, J.; Changyu, L.; Hogan, A.; Diaconu, L.; Poznanski, J.; Yu, L.; Rai, P.; Ferriday, R. ultralytics/yolov5: v3.0. Zenodo. 2020. Available online: https://zenodo.org/records/3983579 (accessed on 24 January 2025).
- Li, C.; Li, L.; Jiang, H.; Weng, K.; Geng, Y.; Li, L.; Ke, Z.; Li, Q.; Cheng, M.; Nie, W. YOLOv6: A single-stage object detection framework for industrial applications. arXiv 2022, arXiv:2209.02976. [Google Scholar]
- Wang, C.-Y.; Bochkovskiy, A.; Liao, H.-Y.M. YOLOv7: Trainable bag-of-freebies sets new state-of-the-art for real-time object detectors. In Proceedings of the IEEE/CVF Conference on Computer Vision and Pattern Recognition, Vancouver, BC, Canada, 17–24 June 2023. [Google Scholar]
- Varghese, R.; Sambath, M. Yolov8: A novel object detection algorithm with enhanced performance and robustness. In Proceedings of the 2024 International Conference on Advances in Data Engineering and Intelligent Computing Systems (ADICS), Chennai, India, 18–19 April 2024. [Google Scholar]
- Yue, X.; Qi, K.; Na, X.; Zhang, Y.; Liu, Y.; Liu, C. Improved YOLOv8-Seg network for instance segmentation of healthy and diseased tomato plants in the growth stage. Agriculture 2023, 13, 1643. [Google Scholar] [CrossRef]
- Li, Z.; Guo, X. Non-photosynthetic vegetation biomass estimation in semiarid Canadian mixed grasslands using ground hyperspectral data, Landsat 8 OLI, and Sentinel-2 images. Int. J. Remote Sens. 2018, 39, 6893–6913. [Google Scholar] [CrossRef]
Disclaimer/Publisher’s Note: The statements, opinions and data contained in all publications are solely those of the individual author(s) and contributor(s) and not of MDPI and/or the editor(s). MDPI and/or the editor(s) disclaim responsibility for any injury to people or property resulting from any ideas, methods, instructions or products referred to in the content. |
© 2025 by the authors. Licensee MDPI, Basel, Switzerland. This article is an open access article distributed under the terms and conditions of the Creative Commons Attribution (CC BY) license (https://creativecommons.org/licenses/by/4.0/).