Abstract
Forty wheat samples of ten wheat varieties harvested from optimal or late sowings in 2019 and 2020 were evaluated for nutrient composition. This included crude protein (CP), starch, amino acids, minerals, phytate-phosphorus (phytate-P) and non-starch polysaccharides (NSPs). The objective was to investigate the impact of high temperature on wheat grain quality as a feedstuff for broiler chickens. Growth performance and economic impact of such changes were predicted by the Emmans, Fisher and Gous broiler growth model. On average, 2019 was 1 °C hotter than 2020 during the growing season (Narrabri, NSW 2390, Australia). The wheat harvested in 2019 had higher concentrations of CP, phytate-P, total P and calcium. In 2019, late sowing increased average protein concentrations from 166.6 to 190.2 g/kg, decreased starch concentration from 726 to 708 g/kg and increased total NSPs from 693 to 73.9 g/kg. Unlike the 2019 harvest, the late sowing in 2020 had no impact on CP concentrations in almost all wheat varieties. The 2019 varieties had higher concentrations of 16 assessed amino acids (p < 0.001) compared to the 2020 harvest. The largest difference was in lysine (19.2%), and the smallest difference was in proline (11.1%). It was predicted that broiler diets formulated from 2019 wheat varieties would have better efficiency of feed conversion with an advantage of 2.53% (1.539 versus 1.579) than 2020 varieties to 35 days post-hatch. This would translate to a cost saving of approximately AUD 16.45 per tonne of feed, much of which would represent additional profit.
Keywords:
heat stress; wheat; starch; protein; climate; non-starch polysaccharides; phytate; broiler; time of sowing 1. Introduction
Wheat is the dominant feed grain in Australia for chicken meat production. Locally, the apparent metabolisable energy (AME) of wheat ranges from 10.35 to 15.9 MJ/kg for broiler chickens [1,2], and the protein content varies from 103 to 205 g/kg [3,4]. Typical wheat–soybean-meal-based broiler diets contain 550-650 g/kg wheat, which provides approximately one-third of dietary protein and two-thirds of dietary energy [3]. However, variations in wheat characteristics influence the nutritional value of wheat as a feedstuff for broiler chickens. Climate-related factors including drought, heat and elevated carbon dioxide levels may further increase variations in the yield and quality parameters in wheat grains [5,6,7]. The impacted quality parameters include grain size, grain number and weight along with many other factors such as mineral contents, protein and starch quantity and quality [4,7,8,9].
Ben Mariem et al. [5] concluded that heat stress may reduce starch synthesis by shortening both the duration of photosynthetic tissue and the grain growth period, thus reducing final grain weight; similarly, drought is expected to limit starch synthesis by reducing the production of photoassimilates and decreasing enzyme activity during starch synthesis in the endosperm. Consequently, protein content and certain mineral concentrations in grains are expected to increase as a percentage of the total grain dry mass [5]. Interestingly, heat stress and drought increase phytate concentrations, in contrast to the impact of increased CO2 levels [10]. Soluble non-starch polysaccharides (SNSPs) are an important anti-nutritive factor in wheat [11], and phytate is ubiquitous in all feed ingredients [12,13]. Presently, NSPs and phytate-degrading enzymes are routinely included in wheat-based poultry diets. However, published information on how heat stress influences NSP content in wheat and their economic consequences is limited. Therefore, the primary purpose of this study was to evaluate changes in nutrient composition in ten wheat varieties, sampled from two sowing times in 2019 and 2020. Typically, late-sown wheat is exposed to warmer temperatures in mid to late spring. The hypothesis is that year of harvest, sowing time and variety will all impact on the nutrient composition in wheat, and the impact of sowing time in 2019 would be greater than 2020 due to the hotter and drier weather experienced in 2019.
2. Materials and Methods
2.1. Wheat Sample Selection
The grain of 10 wheat varieties from the optimal (May) and late (June) sowing of the Plant Breeding Institute at the University of Sydney (Narrabri, NSW 2390, Australia) in both 2019 and 2020 (40 samples in total) was used for this study. Irrigation was applied to limit the confounding effects of moisture stress and to achieve as close to the long-term average for the location as possible. This eliminated the drought-stress factor so that only the high-temperature treatment is in effect. Minimum tillage was used to maintain soil integrity. Soil deficiencies or nutrient imbalances were not evident from annual soil nutrient testing. The experimental sites were fallowed over the summer months and rotated with a legume crop (chickpea) during alternate years to minimise disease outbreaks and to maintain soil integrity. Seasonal pests and diseases were rigorously controlled based on NSW Department of Primary Industries recommendations. The predominant soil type at the experimental site was a black Vertosol cracking clay with high water retention. The crops were adequately fertilised with urea [46% N] at 100 kg/ha and Cotton Sustain [5% N, 10% P, 21% K, 1% Z] at 80 kg/ha pre-planting. The details of crop management for heat-tolerant wheats are described in Ullah et al. [14]. The crop field experiment was an alpha lattice design (or simplified as a randomised complete block design) with two replicates. Table 1 summarises the 10 varieties and their heat tolerance rating, while Figure 1 shows the seasonal temperatures in different years and harvests.

Table 1.
The summary of wheat variety, thousand kernel weight (TKW), pollen viability and heat tolerance rating [15].
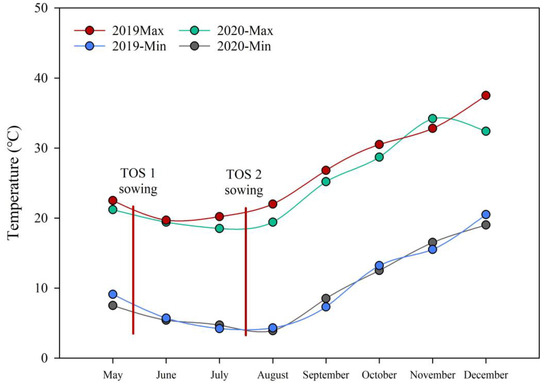
Figure 1.
Temperatures and time of sowing (TOS) for Narrabri in 2019 and 2020. TOS1: third week of May 2019 and 2020; TOS2: second and third week of July 2019 and 2020.
2.2. Physico-Chemical Analyses
All wheat grains used for analysis were milled to a fine flour using a cyclone sample mill (UD Corporation, Boulder, CO, USA) and sieved through a 0.5 mm screen.
The Cielab L*, a* and b* values for the colour of the wheat grain were determined using a Minolta CR-310 Colorimeter (Minolta Co., Ltd., Osaka, Japan), and measurements were expressed as Commission Internationale de l’Eclairage L*, a* and b* (CIELAB) values [16].
The L* value is indicative of white as opposed to black, the a* value is indicative of red as opposed to green and the b* value is indicative of yellow as opposed to blue. The CIELAB colour test was completed in triplicate.
Chemical analyses were completed in duplicate except for analyses of NSPs and amino acids; all results are reported on a dry-matter basis.
Nitrogen in feed was determined by combustion analysis of an approximate 0.5 g sample in a combustion analyser (Leco model FP-2000 N Analyzer, Leco Corp., St. Joseph, MI, USA) using EDTA as a calibration standard, and CP content was calculated by multiplying nitrogen concentration by 6.25. The total starch content of the samples was analysed by using a method derived from Megazyme (Megazyme International Ireland Ltd., Wicklow, Ireland) and described in Mahasukhonthachat et al. [17]. Total fibre content was determined using a Megazyme test kit [18]. Phytate was analysed by the ferric chloride precipitation method as described in Miller et al. [19].
Minerals were analysed using inductively coupled plasma optical emission spectrometry (ICP-OES). Approx. 0.5 g of the sample was accurately weighed into a clean Teflon microwave digestion vessel. Then, 5 mL of concentrated analytical-grade nitric acid was added, and the sample was allowed to sit for 10 min. The vessel was then sealed, and the mixture was digested using a MAR S6 microwave digestion unit (CEM Co, Charlotte, NC, USA). The sample was heated to 180 °C for 20 min. After cooling to ambient temperature, the vessel was opened carefully and the contents washed into a 50 mL volumetric flask and made up to volume. This solution was then analysed by ICP-OES.
Amino acid concentrations in wheat were determined via 24 h liquid hydrolysis at 110 °C in 6 M HCl followed by analysis of 16 amino acids using the Waters AccQ•Tag Ultra Column on a Waters Acquity ultra-performance liquid chromatograph (UPLC; Waters Corporation, Milford, MA, USA).
The NSP composition was determined by gas chromatography (GC; Varian analytical instrument, Palo Alto, CA, USA) according to the method described by Englyst and Cummings [20] and reported on a dry-matter basis.
Starch-pasting profiles were determined by rapid visco-analysis (RVA) using an RVA-4 analyser (Newport Scientific, Warriewood, Australia) in a manner similar to that described by Beta and Corke [21]. Ground wheat grain (4.2 g) was mixed with deionised water (23.8 g) in a programmed heating and cooling cycle of 13 min. The slurry was held at a temperature of 50 °C for 1 min and then heated to 95 °C and held for 2.5 min prior to cooling the slurry to 50 °C and holding that temperature for 2 min. The speed of the mixing paddle was 960 rpm for 10 s and then 160 rpm for the remainder of the cycle. Peak viscosity, holding viscosity, final viscosity, breakdown viscosity (peak-holding) and setback viscosity (final-peak) were recorded as well as peak time and pasting temperature.
The Emmans, Fisher and Gous (EFG) broiler growth model (version 5.1, Stellenbosch, South Africa) was used to predict the growth performance of birds offered diets based on either 2019- or 2020-harvested wheats and formulated to meet 2022 Aviagen nutrient specifications for Ross 308 broiler chickens [22,23].
2.3. Statistical Analyses
The experimental data were analysed by two-way analysis of variance using the JMP® Pro 14.0 software package (SAS Institute Inc., JMP Software. Cary, NC, USA). The data were analysed using two-way analysis of variance (ANOVA) for each year. Variety and sowing time were considered as independent variables for the analysis of CP, crude fibre, starch, phytate-P, minerals and RVA-pasting properties. Two-way ANOVA was then used to analyse the combined dataset, where variety and year of harvest were considered as independent variables, to investigate differences among wheat colours and amino acid concentrations. One-way ANOVA was conducted using 2019 data, where both variety and year of harvest were considered independent variables separately, to study the difference in NSPs. Pearson correlations were then determined between colour and chemical compositions, and significance was considered at 5% by Tukey’s HSD test.
3. Results
The impacts of variety and year on wheat colour scores are reported in Table 2. There were significant differences between varieties (p < 0.001) for all three CIELAB colour scores. The 2020 wheats had lower a* (2.55 versus 2.33; p < 0.001) and b* (14.00 versus 13.66; p = 0.026) scores than 2019 wheat, but there was no difference in L* scores. Interaction between variety and year was not observed. Zanzibar wheat had the lowest L* (81.67) and highest a* (3.20) value compared to all other wheat varieties (p < 0.001). Coolah, Cutlass, EGA-Gregory, Trojan and Zanzibar had statistically higher b* than Borlaug, Livingston and Mitch (p < 0.001).
Table 2.
The effect of variety and year on wheat colour (L*, a* and b*).
Table 3 shows the impacts of cultivar and sowing time on CP, crude fibre, starch, phytate-P and concentrations of nine minerals in 2019-harvested wheats. Overall, concentrations of CP, crude fibre, starch and phytate-P averaged 178.4 g/kg (151.4 to 195.1), 15.0 g/kg (10.8 to 17.9), 716.9 g/kg (659.3 to 774.6) and 4.0 g/kg (2.7 to 4.6), respectively, with the ranges shown in parentheses. Significant interactions between cultivar and sowing time were observed for all parameters determined, other than starch and copper concentrations.
Table 3.
The impacts of variety and sowing period on crude fibre, protein, starch, phytate and minerals from the 2019 wheat harvest.
Significant differences in CP between optimal and late sowings were detected in all varieties except Zanzibar. On average, late sowing significantly increased CP concentrations by 23.6 g/kg (190.2 versus 166.6 g/kg), with the largest increase of 43.1 g/kg (194.5 versus 151.4 g/kg) observed in EGA-Gregory.
Significant increases in crude fibre contents under late sowing were observed in EGA-Gregory (12.0 versus 14.1 g/kg), Lancer (11.9 versus 13.3 g/kg) and Mitch (16.0 versus 17.9 g/kg).
There was no treatment interaction for starch content; however, late sowing significantly decreased starch concentrations from 725.8 to 708.0 g/kg. Regardless of sowing time, Coolah generated the highest starch content (761.1 g/kg), and Lancer the lowest (677.2 g/kg).
Late sowing significantly increased phytate-P concentrations only in Coolah (2.7 versus 3.9 g/kg,) and Livingston (3.3 versus 4.2 g/kg). Late sowing significantly increased total P concentrations in Cutlass, Dart, EGA-Gregory, Lancer, Livingston, Mitch and Zanzibar. The largest increase in total P concentrations (3.65 versus 4.72 g/kg) from late sowing was observed in Livingston.
Late sowing significantly increased calcium (Ca) concentrations in all wheat varieties except Coolah, Lancer and Zanzibar, where late sowing decreased Ca concentrations in Coolah (0.815 versus 0.724 g/kg) but did not influence Ca concentrations in Lancer and Zanzibar. The largest increase (0.584 versus 0.745 g/kg) in Ca concentration under late sowing was detected in Borlaug.
Late sowing decreased ferrous (Fe) concentrations in Coolah wheat and increased Fe concentrations in Cutlass, EGA-Gregory and Zanzibar wheats. Late sowing increased potassium (K) concentrations in all wheat varieties except Coolah, Mitch and Zanzibar, and the largest increase was observed in Dart (2.47 versus 3.30 g/kg). Similarly, late sowing significantly increased magnesium (Mg) concentrations in all wheat varieties except Coolah, Lancer and Mitch. Late sowing increased manganese (Mn) concentrations in all varieties except Coolah, with the largest increase (27.0%) observed for Zanzibar (0.055 versus 0.070 g/kg).
Late sowing consistently increased sodium (Na) concentrations in all wheat varieties except Coolah, Cutlass and Lancer, to significant extents, and the largest increase (0.132 versus 0.213 g/kg) was observed for Livingston.
Late sowing decreased zinc (Zn) concentrations in Coolah (0.027 versus 0.020 g/kg) but increased Zn in all other varieties (p < 0.001).
There was no treatment interaction for copper (Cu) concentrations, but wheat variety significantly influenced Cu concentration. Borlaug had the highest Cu concentration (0.010 g/kg), and Trojan and Livingstone had the lowest (0.006 g/kg).
Table 4 summarises the impact of variety and sowing period on crude protein, crude fibre, starch, phytate and mineral concentrations of samples harvested in 2020.
Table 4.
The impact of variety and sowing period on crude fibre, protein, starch, phytate and minerals from the 2020 wheat harvest.
Significant treatment interactions were observed for all parameters assessed other than starch. Cooler temperature prevailed in 2020 in comparison to 2019. The time of sowing did not influence CP concentrations in all wheat varieties other than Zanzibar, where late sowing significantly decreased CP content from (170.5 versus 141.2 g/kg). Late sowing significantly increased fibre content in Coolah, EGA-Gregory and Lancer but did not influence phytate and starch content in any of the varieties.
In 2020, late sowing significantly reduced Ca concentrations in Borlaug (0.613 versus 0.508 g/kg), Coolah (0.824 versus 0.636 mg/kg), Mitch (0.665 versus 0.531 g/kg) and Zanzibar (0.650 versus 0.514 g/kg) but did not influence Ca concentrations in other wheats. Late sowing significantly reduced the concentrations of Fe, Na, P and Zn in Coolah (p < 0.001). However, late sowing significantly increased Fe concentrations in Borlaug, EGA-Gregory, Lancer, Trojan and Zanzibar; K concentrations in Borlaug, EGA-Gregory, Lancer and Trojan; Mg concentrations in EGA-Gregory, Livingston and Trojan; Mn concentrations in EGA-Gregory and Livingston; Na concentrations in Cutlass, Dart, Trojan and Zanzibar; and P concentrations in Dart, EGA-Gregory, Lancer, Livingston, and Trojan (p < 0.001). Late sowing significantly increased Zn concentrations in all wheats except Coolah, Dart and Mitch.
The effects of variety and sowing time on RVA starch-pasting properties are presented in Table 5. Again, significant treatment interactions between variety and sowing time were observed for all RVA starch-pasting parameters in both years. In 2019, late sowing significantly reduced pasting temperature in Borlaug. Late sowing significantly increased peak viscosities in Coolah and Mitch, but decreases were observed in Cutlass, EGA-Gregory and Trojan. Late sowing significantly increased final viscosities in Dart, EGA-Gregory, Livingston and Trojan.
Table 5.
The impact of variety and sowing period on RVA starch-pasting properties from the 2019 and 2020 wheat harvests.
In 2020, late sowing significantly increased pasting temperatures in Cutlass and Zanzibar, but a decrease was observed in Dart. Peak viscosities were significantly elevated by late sowing in Borlaug, Dart and Mitch but were decreased in Coolah, EGA-Gregory and Livingston. Late sowing significantly increased final viscosities in Borlaug, Coolah, Lancer, Mitch and Trojan wheats, but decreases were observed in Dart and Livingston.
The impact of variety and sowing period on NSP and sugar concentrations in 2019-harvested wheats is shown in Table 6. Wheat variety significantly influenced all assessed parameters with the exceptions of total galactose and soluble xylose. In contrast, significant effects of sowing period were confined to total NSPs, arabinose and xylose concentrations.
Table 6.
The main effect of variety and sowing period on NSP and sugar concentrations from the 2019 wheat harvest (g/kg).
Soluble NSP (SNSP) concentrations were lowest in Livingstone (9.2 g/kg) and Borlaug (9.9 g/kg), and both Coolah (13.8 g/kg) and Dart (13.9 g/kg) were significantly higher. The remaining wheats contained intermediate amounts of SNSPs. Dart had the highest total NSP concentration (77.6 g/kg) and Trojan the lowest (65.2 g/kg). Compared to early sowing, late sowing significantly increased total NSPs (69.3 versus 73.9 g/kg) but did not influence total SNSP content (p > 0.75).
The overall impact of the year of harvest on the composition and RVA profiles of wheat is shown in Table 7. Overall, 2019 was a much hotter year than 2020, and 2019 wheats had higher concentrations of CP (178.4 versus 150.2 g/kg, p < 0.001), phytate-P (3.9 versus 3.7 g/kg, p = 0.033), Ca (0.722 versus 0.650 g/kg, p < 0.001), Fe (0.045 versus 0.041 g/kg, p = 0.020), Mg (1.45 versus 1.36 g/kg), Na (0.153 versus 0.145 g/kg, p = 0.036), P (4.37 versus 4.15 g/kg, p = 0.023), Zn (0.032 versus 0.026 mg/kg, p < 0.001) and Cu (0.0074 versus 0.0066 g/kg, p < 0.001). In contrast, 2020-harvested wheats contained higher concentrations of starch content (742.4 versus 716.9 g/kg, p < 0.001), K (3.27 versus 3.04 g/kg; p = 0.012) and Mn (0.054 versus 0.051 g/kg, p = 0.033) than 2019 wheats. Significant differences in RVA profiles were confined to final viscosity, where 2020 wheats were higher (1860 versus 1778 cP; p = 0.040), and peak time, where 2020 wheats had shorter peak times (5.27 versus 5.32 min; p = 0.039).
Table 7.
The overall impact of year on chemical compositions in wheat.
The influence of variety and year on essential amino acid concentrations is shown in Table 8, where variety had no statistical effects and treatment interactions were not observed. Predictably, the 2019-harvested wheats had higher concentrations of essential amino acids than 2020 (p < 0.001). In descending order, the 2019 wheats contained 20.7% more phenylalanine, 18.8% isoleucine, 17.9% leucine, 16.5% threonine, 16.3% valine, 15.8% histidine, 15.0% arginine, 14.5% methionine and 12.3% lysine than 2020 wheats.
Table 8.
The effect of variety and year on total amino acid concentrations in wheat (g/kg).
4. Discussion
Pearson correlations of selected parameters in all wheat varieties from both harvest years are shown in Table 9. Crude protein concentrations were positively correlated with phytate-P (r = 0.548; p < 0.001) and total P (r = 0.605; p < 0.001) and negatively correlated with starch (r = −0.571; p < 0.001). Starch was negatively correlated with total P (r = −0.487; p = 0.001), and phytate-P was positively correlated with total P (r = 0.582); p < 0.001). The inverse relationship between CP and starch is predictable. The positive relationship between CP and phytate-P is of interest to starch. Raboy et al. [24] reported that protein and phytate content in winter wheat were highly correlated; in contrast, Ma et al. [25] found this was not the case in Chinese winter wheats. In the present study, the linear regression equation was y= 1.969 + 0.0014 X CP, and the relationship between CP and phytate-P was highly significant (p = 0.000253). One possible implication is that the breeding of low-phytate wheat cultivars could compromise their protein contents. Again, the positive relationship between phytate-P and total P was anticipated and has been previously reported by Selle et al. [26]
Table 9.
The pairwise correlations between wheat physio-chemical compositions.
Globally, wheat is the second most commonly used feed grain for livestock and poultry, and in Australia, wheat is dominant in chicken meat production. Thus, differences in protein and amino acid contents in wheat could have economic consequences as imported soybean meal, the key source of protein/amino acids, is an expensive commodity in Australia. To illustrate the potential economic impact, starter, grower, finisher and withdrawal diets based on 2019- or 2020-harvested wheats were formulated to meet 2022 Ross 308 nutrient specifications as shown in Table 10. The EFG broiler growth model was used to predict the broiler growth performance that these diets would support.
Table 10.
The diet composition and calculated nutrient specifications based on wheats harvested in 2019 and 2020.
The predicted growth performance at 29, 35, 42 and 49 days post-hatch are reported in Table 11. Importantly there was a four-point advantage in FCR at 35 days post-hatch in favour of the 2019 wheats when mean predicted body weight was 2644 g/bird, which is close to the average live body weight of birds processed in Australia. The advantage of four points in FCR can be expressed as an improvement of 2.53% (1.539 versus 1.579) in FCR. Given that the landed cost of a broiler diet at a grow-out facility in the order of AUD 650 per tonne, an FCR improvement of 2.53% translates to a saving of AUD 16.45 per tonne of feed. Moreover, as feed cost represents a substantial proportion of total costs, much of this saving becomes additional profit.
Table 11.
The predicted growth performance based on the EFG broiler growth model 1.
5. Conclusions
In conclusion, there were significant impacts of climate-induced factors on the nutritive properties of wheat where high temperature is more likely to increase CP and amino acid content, decrease starch concentration and increase phytate and total NSP levels, but not the soluble NSP content. There was no obvious trend that heat-tolerant wheat varieties are more resilient to the impact of environmental temperatures on nutrient compositions. More inter-disciplinary research between nutritionists and plant breeders is required to optimise yield and quality.
Author Contributions
S.Y.L. and D.K.Y.T. were the principal investigators of the relevant project, and S.Y.L. is the corresponding author. A.K. contributed to experimental design, sample selection, editing, supervision, nutrient and data analyses. V.M. contributed to nutrient analyses. D.K.Y.T. contributed to sample selection, experimental design and validation. P.V.C. contributed to broiler model prediction and economic analysis. R.A.C. contributed to phytate analyses. M.T. contributed to experimental design and NSP analyses. R.T. (Richard Trethowan) and R.T. (Rebecca Thistlethwaite) contributed to experiment design, wheat sample collection and selection. S.M. contributed to nutrient analyses. Y.B. contributed to crop field weather data collection. P.H.S. contributed to experimental design, data analyses and editing the original manuscript. S.Y.L. contributed to experimental design, data analyses and drafting original manuscript. All authors have read and agreed to the published version of the manuscript.
Funding
The research and APC was funded by School of Life and Environmental Sciences, Faculty of Science, The University of Sydney.
Institutional Review Board Statement
Not applicable.
Data Availability Statement
The raw data supporting the conclusions of this article will be made available by the authors on request.
Acknowledgments
We would like to thank the 2021 School of Life and Environmental Sciences for supporting this project.
Conflicts of Interest
Author Peter V. Chrystal was employed by the company Complete Feed Solutions. The remaining authors declare that the research was conducted in the absence of any commercial or financial relationships that could be construed as a potential conflict of interest.
Abbreviations
Non-starch polysaccharides (NSPs); soluble non-starch polysaccharides (SNSPs); feed conversion ratio (FCR); apparent metabolisable energy (AME); thousand kernel weight (TKW); inductively coupled plasma optical emission spectrometry (ICP-OES); ultra-performance liquid chromatography (UPLC); gas chromatography (GC); rapid visco-analysis (RVA); analysis of variance (ANOVA); phytate-phosphorus (phytate-P); calcium (Ca); ferrous (Fe); copper (Cu); zinc (Zn); phosphorus (P); sodium (Na); manganese (Mn); magnesium (Mg); crude protein (CP); amylase trypsin inhibitors (ATI).
References
- Mollah, Y.; Bryden, W.L.; Wallis, I.R.; Balnave, D.; Annison, E.F. Studies on Low Metabolisable Energy Wheats for Poultry Using Conventional and Rapid Assay Procedures and the Effects of Processing. Br. Poult. Sci. 2007, 24, 81–89. [Google Scholar] [CrossRef]
- Rogel, A.; Annison, E.; Bryden, W.; Balnave, D. The Digestion of Wheat Starch in Broiler Chickens. Aust. J. Agric. Res. 1987, 38, 639. [Google Scholar] [CrossRef]
- Hughes, R.J.; Choct, M. Chemical and Physical Characteristics of Grains Related to Variability in Energy and Amino Acid Availability in Poultry. Aust. J. Agric. Res. 1999, 50, 689–702. [Google Scholar]
- Petrović, S.; Vila, S.; Grubišić Šestanj, S.; Rebekić, A. Variation in Nutritional Value of Diverse Wheat Genotypes. Agronomy 2024, 14, 311. [Google Scholar] [CrossRef]
- Ben Mariem, S.; Soba, D.; Zhou, B.; Loladze, I.; Morales, F.; Aranjuelo, I. Climate Change, Crop Yields, and Grain Quality of C3 Cereals: A Meta-Analysis of [CO2], Temperature, and Drought Effects. Plants 2021, 10, 1052. [Google Scholar] [CrossRef] [PubMed]
- Zhang, X.; Shi, Z.; Jiang, D.; Högy, P.; Fangmeier, A. Independent and Com-bined Effects of Elevated CO2 and Post-Anthesis Heat Stress on Protein Quantity and Quality in Spring Wheat Grains. Food Chem. 2019, 277, 524–530. [Google Scholar] [CrossRef] [PubMed]
- Djanaguiraman, M.; Narayanan, S.; Erdayani, E.; Prasad, P.V.V. Effects of High Temperature Stress during Anthesis and Grain Filling Periods on Photosynthesis, Lipids and Grain Yield in Wheat. BMC Plant Biol. 2020, 20, 268. [Google Scholar] [CrossRef] [PubMed]
- Velu, G.; Guzman, C.; Mondal, S.; Autrique, J.E.; Huerta, J.; Singh, R.P. Effect of Drought and Elevated Temperature on Grain Zinc and Iron Concentra-tions in CIMMYT Spring Wheat. J. Cereal Sci. 2016, 69, 182–186. [Google Scholar] [CrossRef]
- Fernie, E.; Tan, D.K.Y.; Liu, S.Y.; Ullah, N.; Khoddami, A. Post-Anthesis Heat Influences Grain Yield, Physical and Nutritional Quality in Wheat: A Review. Agriculture 2022, 12, 886. [Google Scholar] [CrossRef]
- Singh, S.; Gupta, A.K.; Kaur, N. Influence of Drought and Sowing Time on Protein Composition, Antinutrients, and Mineral Contents of Wheat. Sci. World J. 2012, 2012, 485751. [Google Scholar] [CrossRef]
- Choct, M.; Hughes, R.J.; Trimble, R.P.; Angkanaporn, K.; Annison, G. Non-Starch Polysaccharide-Degrading Enzymes Increase the Performance of Broiler Chickens Fed Wheat of Low Apparent Metabolizable Energy. J. Nutr. 1995, 125, 485–492. [Google Scholar] [CrossRef] [PubMed]
- Harland, B.F.; Morris, E.R. Phytate: A Good or a Bad Food Component? Nutr. Res. 1995, 15, 733–754. [Google Scholar] [CrossRef]
- Tahir, M.; Shim, M.Y.; Ward, N.E.; Smith, C.; Foster, E.; Guney, A.C.; Pesti, G.M. Phytate and Other Nutrient Components of Feed Ingredients for Poultry. Poult. Sci. 2012, 91, 928–935. [Google Scholar] [CrossRef]
- Ullah, N.; Christopher, J.; Frederiks, T.; Chenu, K. A Field-Based Technique for Screening Heat Tolerance of Wheat Lines Differing in Maturity at Matched Developmental Phases. In Proceedings of the 20th Agronomy Australia Conference, Toowoomba, Australia, 18–22 September 2022. [Google Scholar]
- Trethowan, R.; Thistlethwaite, R.; Joukhadar, R.; Daetwyler, H.; Tan, D. How Heat Tolerant Are Our Wheats? GRDC: Barton, Australia, 2022. [Google Scholar]
- Jenifer, J.; Bell, T.L.; Khoddami, A.; Pattison, A.L. Panicum Decompositum, an Australian Native Grass, Has Strong Potential as a Novel Grain in the Modern Food Market. Foods 2023, 12, 2048. [Google Scholar] [CrossRef] [PubMed]
- Mahasukhonthachat, K.; Sopade, P.A.; Gidley, M.J. Kinetics of Starch Digestion in Sorghum as Affected by Particle Size. J. Food Eng. 2010, 96, 18–28. [Google Scholar] [CrossRef]
- Gebreegziabher, B.G.; Tsegay, B.A. Proximate and Mineral Composition of Ethiopian Pea (Pisum sativum Var. Abyssinicum A. Braun) Landraces Vary across Altitudinal Ecosystems. Cogent Food Agric. 2020, 6, 1789421. [Google Scholar] [CrossRef]
- Miller, G.A.; Youngs, V.L.; Oplinger, E.S. Environmental and Cultivar Effects on Oat Phytic Acid Concentration. Cereal Chem. 1980, 57, 189–191. [Google Scholar]
- Englyst, H.N.; Cummings, J.H. Digestion of Polysaccharides of Potato in the Small Intestine of Man. Am. J. Clin. Nutr. 1987, 45, 423–431. [Google Scholar] [CrossRef]
- Beta, T.; Corke, H. Effect of Ferulic Acid and Catechin on Sorghum and Maize Starch Pasting Properties. Cereal Chem. 2004, 81, 418–422. [Google Scholar] [CrossRef]
- Gous, R.M. Modeling as a Research Tool in Poultry Science. Poult. Sci. 2014, 93, 1–7. [Google Scholar] [CrossRef]
- Emmans, G.C.; Fisher, C. Problems in Nutritional Theory. In Nutrient Requirements of Poultry and Nutritional Research; Fisher, C., Boorman, K.N., Eds.; Butterworths: London, UK, 1986; pp. 9–39. [Google Scholar]
- Raboy, V.; Noaman, M.M.; Taylor, G.A.; Pickett, S.G. Grain Phytic Acid and Protein Are Highly Correlated in Winter Wheat. Crop Sci. 1991, 31, 631–635. [Google Scholar] [CrossRef]
- Ma, D.; Zuo, Y.; Niu, J.; Zhang, Y.; Guo, T. Variations in Phytic Acid Content and Their Relationship with Protein Content and Kernel Morphological Characters of Chinese Winter Wheat Cultivars. Agric. Sci. Technol. 2012, 13, 108–112. [Google Scholar]
- Selle, P.H.; Walker, A.R.; Bryden, W.L. Total and Phytate-Phosphorus Contents and Phytase Activity of Australian-Sourced Feed Ingredients for Pigs and Poultry. Aust. J. Exp. Agric. 2003, 43, 475–479. [Google Scholar] [CrossRef]
Disclaimer/Publisher’s Note: The statements, opinions and data contained in all publications are solely those of the individual author(s) and contributor(s) and not of MDPI and/or the editor(s). MDPI and/or the editor(s) disclaim responsibility for any injury to people or property resulting from any ideas, methods, instructions or products referred to in the content. |
© 2024 by the authors. Licensee MDPI, Basel, Switzerland. This article is an open access article distributed under the terms and conditions of the Creative Commons Attribution (CC BY) license (https://creativecommons.org/licenses/by/4.0/).