Abstract
Exploring the evolution of livelihood patterns of farm households relocated for poverty alleviation in three prefectures of Guizhou Province, China, can provide a theoretical basis and practical value for achieving sustainable livelihoods of relocated farm households in ethnic minority areas. This study took three ethnic minority autonomous prefectures in Guizhou as the research area. The types and evolution pathways of farm households’ livelihood patterns were divided using 355 tracking and monitoring data from the four phases of relocated farm households’ livelihoods. The evolution characteristics of farm households’ livelihood patterns and changes in their evolution pathways from “before relocation” to 2021 were analyzed. An indicator system of influencing factors was established based on the sustainable livelihood framework. The influencing factors of the evolution path selection and transformation of livelihood patterns were identified using the binary and multiple logistic regression models. The main results are as follows: (1) Implementing the poverty alleviation relocation project shifted the livelihood activities of farm households from agricultural production to non-agricultural industries. The transformation trend of livelihood patterns shifted from agro-dominated, agricultural, agricultural-diversified and balanced types to highly diversified, deeply diversified and subsidy-dependent types. (2) The transformation mode of the evolution pathways of farm households’ livelihood patterns mainly included the stable transformation modes of “activeretentionactive” and “activeretentionretention” and the fluctuating transformation modes of “activeretentionfallback”, “activefallbackactive” and “retentionfallbackactive”. (3) Natural capital promoted farm households to choose fallback pathways, while material and human capital showed an inhibitory impact. In contrary to human capital, social capital promoted farm households to choose retention pathways. Financial and human capital promoted farm households to choose active pathways. (4) Per capita income, the household head age and relocation years positively affected the evolution pathways of the livelihood pattern from the fallback type to the retention type. The number of means of transport, per capita education level, transportation and communication cost, and the presence of civil servants in the household positively affected the evolution pathways of the livelihood pattern from the fallback type to the active type. Policy suggestions are as follows: Expanding local and nearby employment channels, strengthening vocational skills training for farm households, expanding financial access for farm households, improving policy support for ethnic characteristic industries, implementing bottom-line guarantee policies and exploring ethnic interactive activities for resettlement farm households.
1. Introduction
Currently, poverty is a common problem faced by countries worldwide, which is related to social stability and sustainable economic development [1]. As the first project of China’s poverty alleviation “five-batch” policy [2], poverty alleviation through relocation is a national rural development policy aimed at overcoming the poverty alleviation problems in deeply impoverished areas. Its nature is to relocate and resettle impoverished rural residents who live in areas with poor living environments, lack of basic development conditions, fragile ecological environments, restricted or prohibited development and threats of geological disasters [3]. This is an ideal way to break the vicious cycle of “poverty→environmental degradation→further poverty” [4]. Poverty alleviation through relocation highlights the basic principle of “voluntary and comprehensive relocation of the masses” [5].
Qiandongnan Miao and Dong Autonomous Prefecture, Qiannan Buyi and Miao Autonomous Prefecture and Qianxinan Buyi and Miao Autonomous Prefecture (hereinafter referred to as “Guizhou Three Prefectures”) are located in the south of Guizhou Province, China. They used to be part of the contiguous areas of dire poverty in the Yunnan-Guangxi-Guizhou rocky desertified area (one of the fourteen contiguous areas of dire poverty in China), with fragmented arable land, poor ecological environment, concentrated ethnic minorities, low population and cultural levels, numerous poverty alleviation targets and weak development capacity. It was once the most challenging area for poverty alleviation in Guizhou Province [6]. During the thirteenth Five-Year Plan, a total of 893,900 people in the three prefectures of Guizhou were relocated to other areas for poverty alleviation, including 308,100 people in Qiandongnan Prefecture, 247,300 people in Qiannan Prefecture and 338,500 people in Qianxinan Prefecture. The implementation of poverty alleviation relocation has effectively solved the problem of poverty alleviation and development for the impoverished population in the three prefectures of Guizhou [7]. During the fourteenth Five-Year Plan period, the focus of poverty alleviation and relocation work in these three areas has shifted to subsequent support work [8]. For ethnic minority farm households who primarily engaged in agricultural production and life, their experiences are deeply embedded in history, geography, subjectivity, fragility and complexity and have their own uniqueness [9]. After the relocation, production modes, lifestyles and interpersonal relationships of farm households have all changed [10]. How to achieve sustainable livelihood and complete poverty alleviation for relocated farm households has become an urgent problem that governments at all levels face [11]. The livelihood pattern, as an economic activity and means that farm households rely on to maintain their livelihoods (including the way farm households obtain income and lifestyle) [12,13,14], will undergo changes after relocation based on the new social environment, ecological environment and their own family characteristics [15]. Changes in the livelihood pattern of farm households can deeply affect their livelihood sustainability and relocation effectiveness [16,17]. Therefore, exploring the evolution characteristics and evolution pathway changes of farm households’ livelihood patterns after relocation and identifying the influencing factors of the evolution path selection can facilitate the sustainable development of farm households’ livelihoods in ethnic areas. This can also provide a theoretical basis for formulating subsequent support policies and development planning for poverty alleviation relocation in ethnic areas.
Since the concept of livelihood pattern was proposed, scholars have mainly conducted studies from three aspects: the connotation [18] and classification [19,20], farm households’ livelihood pattern transformation [21,22] and its driving factors [23,24] and the impact of the evolution of livelihood patterns on the environment [25,26]. Firstly, research on livelihood pattern classification has been proposed, where livelihood patterns are mainly divided according to the degree of livelihood diversification [27], income source and structure [28] and household development direction [29]. Secondly, research on the transformation pathways of livelihood patterns, according to Zhang et al. [30], defines the transformation pathways of farm households’ livelihood as the dependent, ascending, fallback and advancing types and clarifies the interactive relationship between farm transformation and livelihood evolution pathways according to farm regional system theories. Zhou et al. [21] took farm households in the agro-pastoral ecotone of the Yellow River Basin as the research object and clarified the mechanism of households’ livelihood transition pathway selection. It is found that the choice of agro-pastoral households’ livelihood transition pathways presented the feature of “internal integration”. Tang et al. [22] used the differential model to explore farm households’ livelihood transformation pathways under ecological governance and found that geographical environment and policy changes were the prerequisites for farm households’ livelihood transformation. Thirdly, research on the driving factors of livelihood pattern evolution, including the impact of single factors, such as rural tourism [16], government policies [31], household income [32] and rural land improvement [33] on the choice of livelihood patterns needs to be discussed. Currently, most scholars have studied the impact of livelihood capital on livelihood patterns based on the sustainable livelihood (SLA) framework proposed by the Department for International Development of the UK. Guo et al. [34], He et al. [35] and Ma et al. [36] found that human capital was the most critical factor in choosing livelihood patterns. Zhao et al. [37] and Zhou et al. [38] found that increasing financial and social capital encouraged farm households to choose non-agricultural livelihood activities. In recent years, the research on livelihood patterns in China has gradually been integrated with national policies, including the perspective of poverty prevention [39] and the study of sustainable livelihoods of farm households from the perspective of targeted poverty alleviation [40]. Particularly, the impact of poverty alleviation relocation on farm households’ livelihood patterns has become a current research hotspot [41]. Ma et al. [32] studied the livelihood patterns of farm households in ethnic minority areas of Nujiang Prefecture, Yunnan Province, and found that poverty alleviation relocation shifted the livelihood patterns of farm households and promoted their income. Duan et al. [42] analyzed the evolution characteristics of the livelihood patterns of farm households in the Liupan Mountain area and found that the livelihood patterns of farm households after relocation developed in a diversified direction.
In summary, there is currently limited research on the evolution of livelihood patterns among ethnic minority farm households in the context of relocation for poverty alleviation. Existing research on the evolution of livelihood patterns and evolution pathways is mostly static evaluation or based on the time nodes before and after relocation. Consequently, continuous tracking dynamic monitoring is still lacking. Thus, it is difficult to reveal the temporal characteristics of the evolution of livelihood patterns and evolution pathways of relocated farm households. Regarding the research on the influencing factors of livelihood pattern selection, more exploration has been conducted on the impact of single indicators such as livelihood capital. The influencing factors of the evolution of farm households’ livelihood patterns have not been comprehensively identified and explained. There is even less research on the influencing factors of deeper evolutionary pathways.
As “depressions” for social and economic development, the ethnic areas in the three prefectures of Guizhou have many ethnic minorities, as well as a complex composition, insufficient development motivation and weak adaptability. These areas pose greater difficulties in implementing follow-up support policies. As the research area, they have certain typicality and representativeness. Therefore, based on the livelihood tracking data of 355 households before relocation and in 2019, 2020 and 2021, this article divides the types of livelihood patterns and the evolution pathway types of livelihood models. Based on the sustainable livelihood framework, it fully considers the typicality of four major indicators: farm households’ livelihood capital, family population characteristics, farm households’ resettlement characteristics and farm households’ policy perception in ethnic relocation areas and establishes an indicator system that affects the path selection of livelihood models using binary and multivariate logistic regression models for analysis. The scientific question proposed in this article is answered by analyzing the evolution and evolutionary pathways of the livelihood patterns of farm households. The research focus is as follows: (i) Quantitative evolution characteristics and mutual transformation analysis of households’ livelihood patterns from pre-relocation to 2021; (ii) quantitative variation characteristics and mutual transformation analysis of the evolution pathway of households’ livelihood patterns from pre-relocation to 2021; (iii) identification of factors influencing the selection of livelihood pattern evolution pathways and mutual transformation, and an exploration of the reasons. This study can provide a theoretical basis and practical value for the sustainable development of the livelihoods of relocated farm households in ethnic areas and provide reference suggestions for the formulation of subsequent support policies for poverty alleviation and relocation in ethnic areas.
2. Materials and Methods
2.1. Overview of the Research Area
Qiandongnan Miao and Dong Autonomous Prefecture, Qiannan Buyi and Miao Autonomous Prefecture and Qianxinan Buyi and Miao Autonomous Prefecture of Guizhou are located at the junction of Guizhou, Yunnan and Guangxi Provinces and belong to the transition zone from the Yunnan-Guizhou Plateau to the hills and mountains in northwest Guangxi and the hills and basins on the south bank of the Yangtze River. These regions have a total area of 73,200 km2 and have a subtropical monsoon climate. They also have fragile ecological environments, frequent natural disasters and concentrated ethnic minorities (such as Miao, Buyi, Yi and Dong). As of 2020, the number of ethnic minorities in Qiandongnan, Qiannan and Qianxinan Prefectures was over 3.99 million, 2.54 million and 1.11 million, accounting for 81.7%, 60.1% and 39.7% of the total population of the prefecture, respectively. The minority areas of the three prefectures have weak infrastructure, single employment structure and strong dependence on land resources. Farm households mainly grow crops (such as rice, corn, wheat, potatoes and sweet potatoes) and economic crops (flue-cured tobacco and rapeseed)(Figure 1).
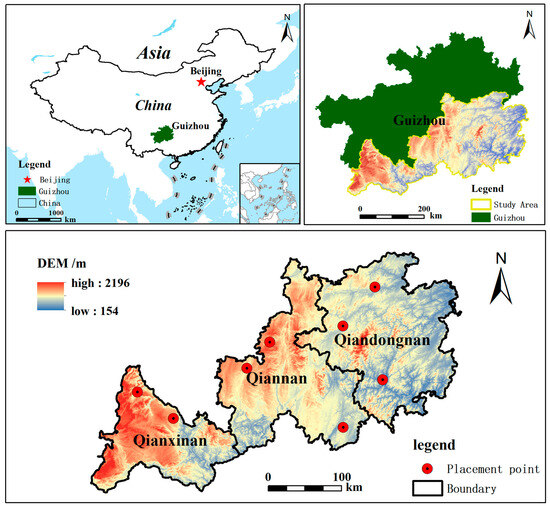
Figure 1.
Resettlement sites for poverty alleviation relocation in the three prefectures of Guizhou Province.
2.2. Data Sources
Based on the principle of on-site investigation, we visited relevant functional departments in Guizhou for three consecutive years from 2019 to 2021 and delved into the relocation and resettlement communities for poverty alleviation. Participatory rural assessment was used to conduct face-to-face interviews with farmers for household surveys, supplemented by community surveys and semi-structured interviews to improve the data. The questionnaire mainly included basic information about family members of relocated farm households, household production income, household expenditure and a satisfaction survey after relocation. Due to the different ages and cultural levels of household members, family representatives were taken as our interviewees who could clearly express and understand their household’s livelihood situation (each household had one family representative member being interviewed, and other family members could provide additional information during the interview).
The survey mainly used the random sampling method to select sample farm households. The sample selection was based on the total size of 893,900 people relocated for poverty alleviation during the thirteenth Five-Year Plan period in three ethnic minority autonomous prefectures of Guizhou, with an average of 4.5 people per household. Sample households were selected from 198,645 households (893,900/4.5) at a ratio of 0.203%. The total number of households surveyed in the three prefectures of Guizhou was ultimately determined to be 403. The tracking samples were divided into four periods: pre-relocation, 2019, 2020 and 2021. In 2019, both the pre-relocation and current-year livelihood information were obtained simultaneously. In 2019, 403 questionnaires were distributed to 11 representative resettlement communities in the selected three regions of Guizhou. Then, 378 valid questionnaires were collected, with an effective rate of 93.8%. In 2020 and 2021, a follow-up survey was conducted on 378 households. A total of 355 valid tracking samples were obtained by 2021, with a sample loss of 23 (6.08%). The effective tracking sample sizes for the Qianxinan, Qiannan and Qiandongnan Prefectures were 159, 105 and 91 households, respectively. The 355 household tracking samples included information on 1778 family members. The basic characteristics of the sample are presented in Table 1.

Table 1.
Basic characteristics of the survey samples in 2021.
Table 1 shows that: (1) From the characteristics of the respondents, the surveyed farmers mainly consisted of young and middle-aged laborers (aged 18–60), accounting for 60.12%, with slightly more men than women. There were 960 Han people, accounting for 53.9%, and 818 ethnic minorities, accounting for 46.1%. (2) From the perspective of family demographic characteristics, the average household size was five people. The household size of 4–6 people was dominant, followed by six or more people. The proportion of these two sizes accounted for 88.73%, and the household sample size was mostly a “2 + 2 + 1” mode of couples + parents + children. (3) From the perspective of household business activities, the annual average income per sample household was USD 2201.13 (RMB 16,100), and 76.34% of households had an average annual income of less than USD 2734.62 (RMB 20,000). The average number of livelihood types per household was 1.96. Up to 72.96% of the sample households were engaged in at least two or more livelihood activities. These results indicate that the production and operation activities of the sample farm households were mainly focused on livestock breeding, crop planting and migrating to work, supplemented by certain individual business activities.
2.3. Classification Criteria for Farm Households’ Livelihood Patterns and Evolution Pathways
Currently, there are no recognized criteria for classifying farm households’ livelihood patterns in China. This article referred to existing research and combined the actual situation of the research objects, starting from the perspective of part-time employment [43,44,45]. According to the proportion of farmers’ income from various livelihood activities and the direction of labor input, livelihood patterns were divided into seven categories: agro-dominated, agricultural, agricultural-diversified, balanced, highly diversified, deeply diversified and subsidy-dependent (Table 2).
Table 2.
Types and classification criteria of livelihood patterns for relocated farm households.
Based on the classification of livelihood patterns of farm households, research suggests that these patterns showed five evolution pathways, as follows: (1) The retention type, where the livelihood patterns do not change. The livelihood patterns may also exhibit changes. For the evolution pathways of variable livelihood patterns, further classification can be made based on the differences in livelihood activities, labor employment and income and dependence on agriculture after the evolution of farm households’ livelihood patterns. (2) The fallback type, where the dependence of labor employment and income on natural resources further increases after the evolution of livelihood activities; (3) vice versa, it is defined as an active type. (4) The concurrent type, where livelihood activities after evolution increase and develop in a balanced manner. (5) The unitary type, where livelihood activities evolve from the balanced development of multiple livelihood activities to an increase in the proportion of income from a certain lifetime activity (Figure 2).
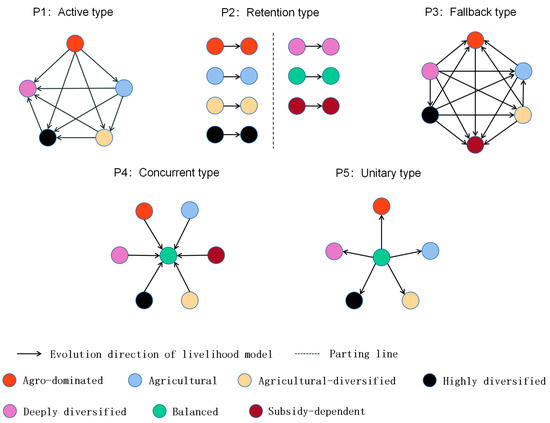
Figure 2.
Classification of evolution pathways of farm households’ livelihood patterns.
2.4. Theoretical Framework
The exploration of the impact mechanism of the evolution pathway selection and transformation of farmers’ livelihood patterns under the background of relocation for poverty alleviation is based on the SLA framework (Figure 3): (1) The external environmental background that affects the livelihood of farmers includes the external environment, external impact and external features. The special characteristics of ethnic culture and economic poverty in relocated areas for poverty alleviation constitute an external environment that affects the livelihoods of impoverished local farmers. The external impact is the impact of poverty alleviation relocation policies on the accessibility of livelihood resources and capital allocation of farmers. External features refer to the demographic characteristics of farm households and the geographical characteristics of the residential community environment. External environmental changes, public policy shocks and family community characteristics all affect the livelihood capital status and livelihood activity choices of farmers [22,30]. (2) In the context of poverty alleviation relocation, the livelihood dynamics of farmers follow the logic of “relocation impact→livelihood capital change→livelihood pattern adjustment”. The impact of relocation leads to changes in the livelihood capital level and structure of farmers, and external factors jointly determine the livelihood pattern and evolutionary pathway of farmers. (3) Farmers choose appropriate livelihood patterns to generate expected livelihood outcomes, which in turn will have an impact on livelihood capital, leading to the next cycle of livelihood for farmers until this transmission mechanism enters a relatively stable state, i.e., sustainable livelihood [46]. This framework demonstrates the ways in which farmers can reconfigure their livelihood capital and construct appropriate livelihood patterns in the face of external environmental changes, thereby achieving sustainable livelihood goals.
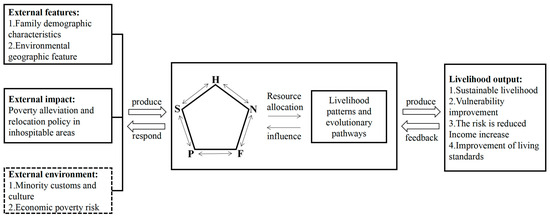
Figure 3.
Sustainable livelihood framework under the background of relocation and poverty alleviation. Note: The dashed box is a supplementary explanation of the mechanism of the entire process of farm households’ livelihood decision-making in the context of poverty alleviation relocation and is not included in the analysis as a specific variable. Source: Zhou et al. [38]; DFID [46].
2.5. Establishment of Influencing Factor Indicator System
The following variables of the indicator system of the influencing factors were set based on the sustainable livelihood theory (Figure 3), the analysis framework of existing research results worldwide [47,48,49,50,51], on-site investigation and comprehensive consideration of the scientificity and availability of farmer data:
- (1)
- Livelihood capital. This study constructed a measurement index system for farm households’ livelihood capital (Table 3). Considering the objective and scientific nature of the research method, this article used the entropy method to assign weights to various indicators of livelihood capital [38,52]. The min–max standardization method was used to eliminate the dimensional effects. After homogenization, a weighted standardization model was used to calculate various livelihood capital values of farm households and their total values in 2021 based on the standardized indicator values and corresponding weights.
Table 3. Indicator system for calculating farm households’ livelihood capital.
- (2)
- Vulnerability background. Referring to the existing research [38], combined with the actual situation of multiple fragile backgrounds, such as frequent natural disasters, large poverty alleviation base, multi-ethnic clustering and ecological fragility in ethnic areas, this study adopted household population characteristics and household resettlement characteristics as the indicators of influencing factors.
- (3)
- Policy system. Supporting or limiting farm households’ behavior can impact their pre-action considerations and post-action outcomes, promoting a shift in their livelihood behavior and affecting the sustainability of their chosen livelihood behavior [53]. In addition, under the policy system and resources, attention also needs to be paid to farm households’ abilities to access and utilize information such as resources and policy systems, which constitutes the knowledge foundation for farm households’ livelihood activity choices. To control the impact of factors at this level, we introduced farm households’ policy perception as a variable.
The specific selection of indicator variables is shown in Table 4.
Table 4.
Selection and explanation of variables influencing the evolution pathway of livelihood patterns.
2.6. Model Construction
2.6.1. Binary Logistic Regression Model
The influencing factors of farm households’ choice of different livelihood pattern evolution pathways after relocation were analyzed using SPSS25.0 [30,34,38]. Due to the small sample size of the concurrent- and unitary-type pathways, quantitative analysis was not conducted. The other three evolution pathways and factors were used as dependent and independent variables. A value of 1 was assigned to one evolution pathway, and 0 was assigned to the other evolution pathways. A binary logistic regression model was constructed to analyze the impact of various livelihood costs on selecting the evolution pathways of farm households’ livelihood patterns:
where represents the probability of forming an evolution pathway of a certain livelihood pattern; , , , represent independent variables; represents a constant term; , , represent the regression coefficients.
2.6.2. Multiple Logistic Regression Model
To reveal the influencing factors that affect the transformation of the evolution pathways of farm households’ livelihood patterns from fallback to retention and active farm households, 1, 2 and 3 were assigned to the evolution pathways of fallback, retention and active farm households, respectively. Using the fallback evolution pathway as a reference, a multiple logistic regression model was constructed to analyze the influencing factors and their influencing degree on the transition from fallback to the retention and active evolution pathways:
where represents the probability of the evolution path of farm households’ livelihood patterns shifting from a fallback type to a retention and active type; , ,, represent independent variables; represents a constant term; ,, represent the regression coefficients.
3. Results
3.1. Analysis of the Evolution of Livelihood Patterns
3.1.1. Quantitative Evolution Characteristics of Livelihood Patterns
An analysis of the changes in the number and proportion of livelihood patterns of seven types of farm households (Table 5) shows that:
Table 5.
Number and proportion of various livelihood patterns for farm households from “before relocation” to 2021.
Overall, before the relocation, the livelihood patterns of farm households were mainly agricultural-diversified and deeply diversified types (67.9%). This is because the farming conditions before relocation were more convenient compared to those after relocation. More farm households were mainly engaged in agricultural activities as their livelihood pattern compared to those after relocation. However, most farm households lived in mountainous and hilly areas, where the arable land was fragmented, with low soil fertility and poor farming conditions. Therefore, only a small number of farm households chose to engage in breeding as their main source of livelihood, while the majority of farm households chose to engage in non-agricultural livelihood activities. After relocation (2019–2021), the livelihood patterns of farm households were mainly highly and deeply diversified types. This is because the relocation and resettlement sites of the sample farm households were all in communities within towns or counties, far from the cultivation and farming sites. Due to changes in livelihood conditions, many farm households reduced or abandoned agricultural livelihood activities and migrated to work. Some farm households participated in vocational skills training organized by the government, and their enthusiasm for independent entrepreneurship increased. They started operating shops, while others worked in production workshops or textile workshops arranged by the government, and livelihood activities gradually became more diverse.
Specifically, from “before relocation” to 2021, the number of agro-dominated (31156), agricultural (24134) and agricultural-diversified types (131404463) showed a U-shaped trend of sudden decrease and then a slight increase. The number of highly diversified (3313612989) and deeply diversified types (110156133169) showed an increasing trend, while the number of balanced (124121) and subsidy-dependent types (14172923) showed fluctuations and growth trends, respectively. It is worth mentioning that in 2020, the number of highly and deeply diversified types showed a downward trend, and the number of balanced and subsidy-dependent farm households reached their peaks. In contrast, the number of agro-dominated, agricultural and agricultural-diversified types showed an upward trend. The field survey indicates that this was due to the impact of COVID-19 in 2020 on farm household choices of livelihood patterns. The research data shows that 33.2% of farm households (118 households) were affected by the pandemic in 2020, with 109 households subject to impacts on their income. The pandemic hindered some farm households from migrating to work or engaging in business. In order to obtain a means of livelihood, they started to engage in some simple farming and breeding industries. As a result, a slight inclination of farm households’ livelihood towards agricultural production occurred. Without farming conditions, some farm households obtained their income mainly from government subsidies, becoming subsidy-dependent.
3.1.2. Analysis of Mutual Transformation of Livelihood Patterns
A livelihood pattern transfer matrix was constructed. Then, chord diagrams (Figure 4) were obtained to visually analyze the mutual transformation of seven types of livelihood patterns from “before relocation” to 2021. From “before relocation” to 2019, the main transformation shifted from agro-dominated, agricultural, agricultural-diversified and balanced livelihood patterns to highly and deeply diversified ones. Particularly, the agricultural-diversified livelihood pattern had the largest number of transfers, with 99 households. From 2019 to 2020, the transformation showed a slight back-flow trend, manifested as a shift from deeply and highly diversified livelihood patterns to agro-dominated, agricultural, agricultural-diversified and balanced livelihood patterns. The number of subsidy-dependent inflows (19 households) exceeded the number of outflows (8 households). From 2020 to 2021, based on the width and trajectory of the transfer line, except for the balanced livelihood pattern, the outflow and inflow of various livelihood patterns were generally balanced, showing strong livelihood stability. Eleven households in the balanced type were transformed into highly and deeply diversified livelihood patterns, respectively.
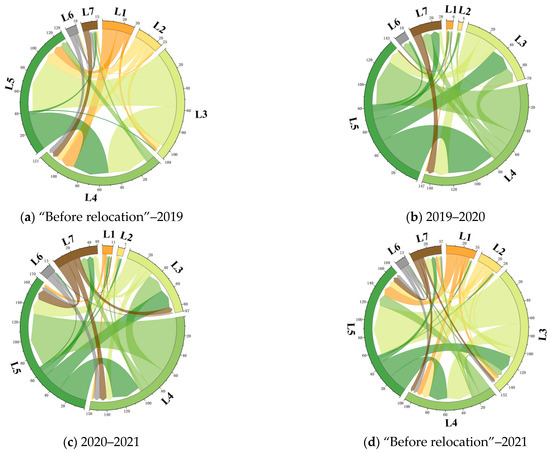
Figure 4.
Visualization of the evolution of livelihood patterns for farm households during “before relocation” to 2021.
Overall, from “before relocation” to 2021, the mutual transformation behavior of the seven types of livelihood patterns was relatively active. Affected by factors such as changes in farming conditions, restrictions on production activities due to the pandemic and government policy support for employment, the transformation between the livelihood pattern types was mainly characterized by the outflow behavior of agro-dominated, agricultural, agricultural-diversified and balanced livelihood patterns as well as the inflow behavior of highly diversified, deeply diversified and subsidy-dependent livelihood patterns.
3.2. Analysis of Changes in the Evolution Path of Livelihood Patterns
The analysis of the number and proportion of the evolution pathways of five types of livelihood patterns from “before relocation” to 2021 (Table 6) shows that from the perspective of the starting and ending points of the evolutionary pathway period, the active type (174 households) had the most pathways. This indicates that relocation positively changed the livelihood pattern of 49.01% of farm households in the sample, followed by the fallback type (85 households), the retention type (84 households), the unitary type (11 households) and the concurrent type (1 household).
Table 6.
Number and proportion of evolution pathways of various livelihood patterns in different years from “before the relocation of farm households” to 2021.
From “before relocation” to 2021, the overall changes in the number of livelihood pattern evolution pathways were relatively fluctuating. The number of active (16484126) and unitary (6112) pathways first decreased and then increased, while the number of retention (136151108) and fallback (48110108) pathways first increased and then decreased. Between 2020 and 2021, the number of active (35.49%), retention (30.42%) and fallback (30.42%) pathways remained relatively consistent.
To study the mutual transformation between the evolution pathways of the livelihood patterns from pre-relocation to 2021, an alluvial plot (Figure 5) was drawn to analyze the visibility of the pathway transformation. Overall, (1) from pre-relocation to 2021, the mutual transformation behavior of livelihood pattern evolution pathways was relatively active. From pre-relocation to 2019 as the starting point, the transfer line’s shape of the active pathway was roughly U-shaped, while the transfer line shapes of the retention and fallback pathways were roughly inverted U-shaped. The active pathway was more likely to shift towards the retention and fallback pathways. The retention and fallback pathways were more likely to shift towards the active pathway. Most unitary pathways from 2020 to 2021 were transferred from the concurrent pathway from pre-relocation to 2019 and from 2019 to 2020. This indicates that the concurrent pathway tended to become unitary pathways. (2) From the perspective of the width and direction of the transfer line, the most common types of pathway transformation were “activeretentionactive” (20), “activeretentionretention” (29), “activeretentionfallback” (32), “activefallbackactive “(35) and “retentionfallbackactive” (30). According to whether the transformation method includes a fallback pathway, it is further divided into stable transformation methods that do not include the fallback pathway and fluctuating transformation methods that include the fallback pathway.
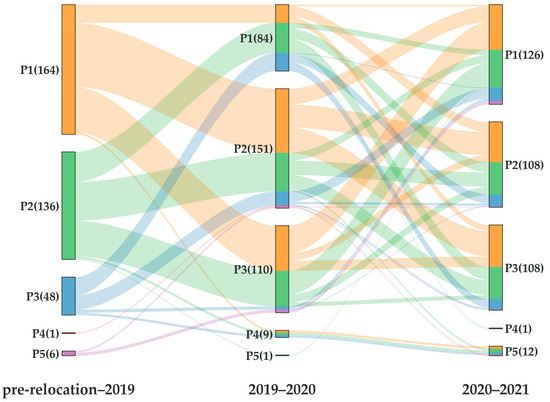
Figure 5.
Visualization of evolution pathways of livelihood patterns of farm households from “before relocation” to 2021.
3.3. Analysis of Factors Influencing the Evolution Pathways of Livelihood Patterns
3.3.1. Multiple Collinearity Test
To prevent collinearity between independent variables from affecting the model estimation results, multicollinearity tests were conducted on 27 factors that may affect the evolution pathway selection of farm households’ livelihood patterns using SPSS 25.0. The test results show that the maximum variance inflation factor (VIF) value was 3.337 (<10), and the minimum tolerance was 0.3 (>0.1). There was no multicollinearity between the influencing factors.
3.3.2. Binary Logistic Regression Analysis of the Impact of Farm Households’ Livelihood Capital on the Evolution Pathway Selection of Livelihood Patterns
Table 7 shows that nature, physical and human capital significantly impacted farm households’ choices of a fallback pathway, with physical and human capital having a significant negative impact and natural capital having a significant positive impact. This indicates that financial capital had a promoting effect on farm households’ choice of a fallback-type evolution pathway. Physical and human capital had an inhibitory effect on farm households’ choice of the retention evolution pathway. Human and social capital had a significant impact on farm households’ choice of a retention evolution pathway, with social capital having a significant positive impact and human capital having a negative impact. This indicates that social capital promoted farm households’ choice of a retention evolution pathway, while human capital inhibited farm households’ choice of a retention evolution pathway. Finance and human capital significantly impacted farm households’ choice of an active evolution pathway, and both had a promoting effect. The richer the financial and human capital, the greater the likelihood that farm households will choose an active evolution pathway.
Table 7.
Binary logistic regression analysis of the impact of various livelihood capital of farm households on the evolution pathway selection of livelihood patterns.
The above phenomenon can be attributed to the abundance of natural capital means that farm households have a larger area of arable land and forest land, creating favorable conditions for developing the breeding industry. Physical capital is the infrastructure and production means required to support farm households’ livelihoods. With richer physical capital, more capital can be used to support production activities, providing conditions for farm households to choose higher-income livelihood activities. More financial capital can enable farm households to have more access to financing. When farm households can allocate more funds, they have more options for different livelihood patterns that engage in non-agricultural production activities. With richer human capital, farm households have stronger abilities to engage in non-agricultural livelihood patterns, as they have more labor, higher education levels, healthier bodies and higher learning ability and physical conditions. Farm households with abundant social capital are more connected to the outside world and thus have a more stable household employment situation and a higher probability of forming a retention evolution pathway.
3.3.3. Multiple Logistic Regression Analysis of Factors Influencing the Transformation of Livelihood Patterns
Table 8 shows that the coefficients of physical, financial and human capital passed the significance tests of 5%, 1% and 1%, respectively. When other independent variables remained unchanged, the incidence of the transition from a fallback type to a retention-type evolution pathway increased by 7.647 times and 1.098 times for each unit increase in physical and human capital, respectively. The occurrence rate of the transition from a fallback pathway to an active evolution pathway increased by 18.605 times and 1.190 times, respectively. For every unit increase in financial capital, the occurrence of the transition from a fallback type to a retention evolution pathway decreased by 0.917 times, and the incidence of the transition from a fallback type to an active evolution pathway decreased by 1.440 times.
Table 8.
Multiple logistic regression results of the impact of various livelihood capital of farm households on the evolution pathway transformation of livelihood patterns.
Analysis shows that with richer financial capital, farm households tended to engage in agricultural production. This contradicts a common understanding that with higher financial capital, farm households have more per capita income and dispensable funds, and the scope of their livelihood activities will also expand. The contradiction may be because more households can receive social donations, donations from relatives and friends, or government subsidies when there is more transfer income in financial capital. Most of these farm households cannot engage in other livelihood activities due to a lack of labor force or problems such as illness and disability. They can only engage in simple agricultural production activities, facilitating the choice of a fallback pathway.
Table 9 shows that during the transformation from a fallback type to a retention-type evolution pathway, three indicators (i.e., per capita income, age of household head and number of years of relocation) had a significant positive impact. When other variables remained unchanged, the occurrence of choosing a retention pathway increased by 8.547 times, 1.036 times and 4.115 times, respectively, for each unit increase in the three indicators. During the transformation from a fallback type to an active-type evolution pathway, four indicators (i.e., the number of means of transport, per capita education level, transportation and communication costs and the presence of civil servants in a household) had a significant positive impact. When other variables remained unchanged, the occurrence of choosing an active pathway increased by 9.244 times, 0.293 times, 51.557 times and 8.010 times for each unit increase in the four indicators.
Table 9.
Multiple logistic regression results of the impact of household livelihood capital subdivision variables on the evolution pathway transformation of livelihood patterns.
4. Discussion
(1) Analysis of the livelihood pattern evolution of relocated farm households shows that, firstly, the poverty alleviation relocation policy had a significant anti-poverty effect in ethnic areas. Relocation has led to significant shifts in the livelihood patterns of households in the three provinces, causing substantial impacts on their livelihoods. There is a trend among these households to shift from agricultural production activities towards non-agricultural production activities. This finding aligns with the research outcomes of Duan et al. [42] and Ma et al. [54] on the evolution of livelihood patterns of relocated poverty-alleviated households. Before the relocation, the livelihood patterns of farm households were characterized as single farming, animal breeding, labor or a combination of crop planting and livestock breeding, labor and agriculture. The livelihood source was single and was greatly affected by the natural environment, and farm households had low economic resilience and weak sustainable development ability [55]. After relocation, the government encouraged rural households to engage in local industrial development across various sectors, such as agricultural modernization, rural tourism and distinctive industries. Specific policies included providing free vocational skills training to farmers, establishing poverty alleviation workshops and industrial parks to create job opportunities, and offering startup funds to encourage individual merchants’ development. Consequently, small-scale individual shops such as restaurants, stores, clothing shops, snack bars, and lottery outlets emerged within and around the resettlement areas. The income structure of farm households was enriched, forming a situation with multiple livelihood patterns, such as migrating to work, salary income, public welfare positions, workshop positions and individual operations. The livelihood pattern gradually transformed towards non-agricultural patterns. Previous research [15,56] has shown that diversified livelihoods after relocation can significantly enhance farm households’ ability to resist risks, which is beneficial for sustainable livelihoods. Policy suggestions are as follows: Relevant departments should expand local and neighboring employment channels, actively carry out employment support work to increase employment rates, increase support for projects such as employment assistance workshops and public welfare positions, expand farm households’ income methods and promote the diversified development of farm households’ livelihood methods.
Secondly, COVID-19 in 2020 has impacted the choice of farm households’ livelihood patterns. Some farm households have been inhibited from going out to work and doing business. The farm households’ livelihood pattern choices have been slightly inclined to agricultural production. Scholars have researched the mechanisms of the impact of epidemic outbreaks on livelihood risks from both agricultural production and migrant labor perspectives [57]. Significant disruptions from epidemic outbreaks have rendered the development of small- and medium-sized enterprises challenging, constraining the short-term cross-basin mobility of rural households and increasing the likelihood of unemployment among urban migrant workers. The epidemic control measures, such as community lockdowns, have led to temporary shortages in the production materials required for agricultural activities. As a result, the stability of rural households’ livelihoods has been significantly affected [58]. Policy suggestions are as follows: The government needs to take emergency measures for disasters such as the epidemic, establish a normal response mechanism, provide precise services based on the needs of farm households, analyze potential job opportunities, establish a “reservoir” of urban employment to provide more job opportunities during crises and ensure stable economic sources for farm households.
(2) Analysis of the evolution pathway of farm households’ livelihood patterns and the influencing factors shows that, firstly, the household labor force, income and education levels of farm households are particularly important in the interactive process of their livelihood evolution paths. Studies have also pointed out that relevant factors can help farm households to perceive livelihood risks, reduce livelihood vulnerability and improve their livelihood adaptability [59,60,61]. Examining the underlying causes, the quantity and skill level of labor significantly impact the efficiency and output of production for rural households. Increased income can enhance living standards, provide better access to education, healthcare and infrastructure and alleviate economic risks. Family members with a solid education may possess greater abilities to tackle new challenges, adopt more effective agricultural techniques, explore new income sources and enhance the sustainability of livelihoods. Within the evolutionary path of rural household livelihoods, these factors interact and mutually influence each other [22]. For instance, well-educated family members may possess the capacity to innovate, thus improving production efficiency and subsequently augmenting household income. On one hand, a higher income can be used to enhance the education level of family members, creating a positive cycle of improvement. Therefore, some scholars proposed to strengthen skills training. Improving the employment and entrepreneurship capabilities of farm households is a feasible pathway for the sustainable development of relocated farm households in ethnic regions [31]. Policy suggestions are as follows: Relevant departments should optimize entrepreneurial financing services, broaden farm households’ financial access, increase their disposable income, strengthen vocational skill training and education levels for farm households and help relocated farm households acquire the necessary skills and knowledge. Thus, relocated farm households can engage in ethnic characteristic industries, including skill inheritance and the production of ethnic cultural products.
Secondly, the age of the household head, length of relocation, transportation and communication costs, and the presence of civil servants in the household had a greater impact on farm households’ choice of evolution pathways. Younger people tended to have more flexibility in learning and adapting to new environments and were more likely to accept new concepts and skills. A longer relocation period indicates that they may have established a certain social network and resources in the new environment. This can help them to adapt and integrate into local societies more rapidly and develop a more stable livelihood pattern [62]. More transportation tools and communication costs provide easier access to transportation and communication information, contributing to improved social connections and access to opportunities for individuals or households [38]. Having civil servants in the household means that individuals can benefit from stable work, providing additional welfare guarantees for the household and promoting a positive transformation of their livelihood patterns. Policy suggestions are as follows: The government should build information release platforms such as a WeChat official account, release policy and job information irregularly, provide public employment services, increase the transparency of the government’s policies to consolidate poverty alleviation, explore ethnic activities in grounded communities, enrich the spiritual and civilized life of the community and enhance the sense of belonging and happiness of relocated farm households.
(3) This study has the following marginal contributions: Firstly, the division of livelihood patterns and livelihood evolution pathway types in this article has certain innovations. Previous research has predominantly focused on categorizing livelihood patterns based on the proportion of a particular income source (such as agricultural or tourism incomes) to the total income [12,13]. This study, however, approaches livelihood patterns from a diversified employment perspective, categorizing them accordingly. It delineates types of evolutionary pathways based on the direction and outcomes of livelihood pattern evolution and the degree of dependency on agriculture. Secondly, the research logic of “external disturbance—analysis of the evolution characteristics of farm households’ livelihood patterns—analysis of the evolution pathway of livelihood patterns—exploration of the influencing factors of pathway selection” was constructed. The research design can provide a reference for other similar studies. Thirdly, this article used tracking and monitoring data from four periods, which will help grasp the subtle differences in different years after relocation and lay a foundation for future research on livelihood patterns using long-term monitoring data. Finally, in identifying the influencing factors of the evolution path selection of farm households’ livelihood modes, this article incorporated family demographic characteristics, farm households’ resettlement characteristics and farm households’ policy perception into the study, breaking through the limitations of the existing research [36,37,38] that only explore livelihood capital indicators or single factors.
Despite the achievements in this study, there are still some limitations to be overcome. Firstly, the sample size of this study is 355 households, which has certain representativeness limitations for the large relocation base in the three prefectures. Secondly, the time span of this study’s data is a four-year period before and after relocation. The evolution of farm households’ livelihood patterns in the new environment after relocation is a long-term process. Thus, the current evolution characteristics and patterns may not be clear enough. Thirdly, there is no further research on which livelihood patterns or evolution pathways are more suitable for sustainable livelihoods of farm households in this study.
Therefore, the following suggestions for further research are proposed: Firstly, long-term continuous monitoring will be conducted on relocated farm households in ethnic areas of Guizhou Three Prefectures, and the number of monitoring households will be increased, and errors will be controlled. Secondly, the advantages and disadvantages of different livelihood patterns and evolution pathways will be analyzed. Strategies to optimize livelihood models and reasonably guide evolution pathways will be proposed. Meanwhile, we will attempt to assess the livelihoods of relocated farm households, clarify the impact of assistance measures on their livelihoods and propose targeted and differentiated sustainable development paths for different types of relocated farm households’ livelihood patterns.
5. Conclusions
Three ethnic minority autonomous prefectures in Guizhou Province were taken as the research area. Using 355 tracking and monitoring data from the fourth phase of relocated farm households’ livelihoods, the evolution status and changes in the evolution path of farm households’ livelihood patterns from “before relocation” to 2021 were analyzed. The binary and multiple logistic regression models were used to identify the influencing factors of the selection and transformation of livelihood pattern evolution paths. The following conclusions are drawn:
- (1)
- Implementing the poverty alleviation relocation project reduced the number of farm households engaged in agricultural livelihood activities and the proportion of agricultural operation income to household income and induced the transfer of livelihood activities from agricultural production to non-agricultural industries. From the perspective of the transformation behavior of livelihood patterns, there were differences in the quantity and direction of mutual transformation within the seven livelihood patterns. The livelihood patterns showed an overall trend of transforming from agro-dominated, agricultural, agricultural-diversified and balanced types to highly diversified, deeply diversified and subsidy-dependent livelihood patterns. We propose policy suggestions to expand local and nearby employment channels and implement the policy of providing basic guarantees.
- (2)
- The evolution pathway of livelihood patterns was a dynamic change: farm households chose livelihood patterns based on their backgrounds, resources and external environment after relocation, and recombined and allocated these resources with changes in farm households’ capital endowment conditions and structure. In terms of time series, the evolution pathways in each year were mainly active, retention and fallback types, with concurrent and unitary types as auxiliary. The transformation methods of the evolution pathway mainly included the stable transformation methods of “active retentionactive”, “activeretentionretention” and the fluctuating transformation methods of “activeretentionfallback”, “activefallbackactive” and “retentionfallbackactive”.
- (3)
- The differences in the endowment of farm households’ livelihood capital led to different evolution pathway selections of livelihood patterns. The factors that significantly impacted farm households’ choice of a fallback pathway included natural, physical and human capital, with natural capital having a significant positive impact and physical and human capital having a significant negative impact. The factors that significantly impacted farm households’ choice of a retention pathway included human and social capital, with human capital having a significant negative impact and social capital having a significant positive impact. The factors that significantly positively impacted farm households’ choice of an active pathway included financial and human capital. We propose policy suggestions to broaden farm households’ financial access, strengthen their cultural and educational level and increase their accumulation of livelihood capital.
- (4)
- Both physical and human capital had a significant positive impact on the evolution pathway selection of farm households’ livelihood patterns from a fallback type to a retention type and an active type, while financial capital had a significant negative impact. Specifically, as for the sub-variables, per capita income, age of the household head and years of relocation positively impacted the evolution pathway of livelihood patterns from a fallback type to a retention type. The number of means of transport, per capita education level, transportation and communication costs and the presence of civil servants positively impacted the evolution pathway of the livelihood pattern from a fallback type to an active type. We propose policy suggestions to strengthen vocational skills training for farm households, improve support policies for ethnic characteristic industries and explore ethnic interactive activities among community farm households.
Author Contributions
Conceptualization, C.Z. (Chenxi Zhang) and T.Y.; methodology, C.Z. (Chenxi Zhang); software, C.Z. (Chenxi Zhang), J.Z., X.W. and Y.Z.; validation, C.Z. (Chenxi Zhang); data curation, C.Z. (Chenxi Zhang); writing—original draft preparation, C.Z. (Chenxi Zhang); writing—review and editing, Z.Z., C.Z. (Changli Zhu), Q.C., Q.F., M.Z., F.T. and F.Z.; visualization, C.Z. (Chenxi Zhang); supervision, Z.Z.; project administration, C.Z. (Chenxi Zhang); funding acquisition, C.Z. (Chenxi Zhang). All authors have read and agreed to the published version of the manuscript.
Funding
This research was funded by the National Natural Science Foundation of China Regional Projects, grant number 41661088, Guizhou Province Philosophy and Social Science Planning Project, grant number 21GZZD39, and the High-Level Innovative Talents Training Program in Guizhou Province, grant number [2016] 5674.
Institutional Review Board Statement
Not applicable.
Data Availability Statement
Data are contained within the article.
Conflicts of Interest
The authors declare no conflicts of interest.
References
- Liu, Y.; Xu, Y. Geographic Identification and Classification of Multidimensional Poverty in Rural China. J. Geogr. 2015, 70, 993–1007. [Google Scholar]
- Xi Jinping’s speech at the National Poverty Alleviation Campaign Summary and Commendation Conference. People’s Daily, 26 February 2021.
- Ye, Q.; Su, H. Policy Practice and Capital Resettlement: Empirical Expression of Poverty Alleviation and Relocation in Guizhou Province. J. China Agric. Univ. (Soc. Sci. Ed.) 2016, 33, 64–70. [Google Scholar] [CrossRef]
- Wu, L.; Zhu, Z.; Luo, Z.; Hu, J. A comprehensive evaluation study on the follow-up support work of relocation and resettlement areas for poverty alleviation in relocated areas: A case study of Hubei Province. Resour. Environ. Yangtze River Basin 2023, 32, 721–728. [Google Scholar]
- Shi, P.; Yu, J. A Study on the Willingness and Influencing Factors of Farmers to Relocate from Different Areas for Poverty Alleviation: An Explanatory Framework Based on Planned Behavior Theory. Resour. Environ. Arid. Areas 2019, 33, 38–43. [Google Scholar] [CrossRef]
- You, X. Study on the Ecological Governance Model of Typical Karst Regions in the Three Southern Prefectures of Guizhou. Guizhou Sci. 2016, 34, 46–51. [Google Scholar]
- National Development and Reform Commission. The 13th Five Year Plan for Relocation and Poverty Alleviation: Great Achievements and Practical Experience. Macroecon. Manag. 2021, 4–9. [Google Scholar] [CrossRef]
- Wang, C.; Zhou, Z.; Chen, Q.; Feng, Q.; Zhu, C. Study on the Livelihood Vulnerability of the Poor Relocated Households in Karst Area: A Case Study of Liupanshui Area. Agriculture 2022, 12, 1577. [Google Scholar] [CrossRef]
- Wei, X.; Fei, M. ‘Bitter and Not Bitter’: A Study on the Life Experience of Immigrants in Ethnic Regions. J. Yunnan Univ. Natl. (Philos. Soc. Sci. Ed.) 2022, 39, 144–152. [Google Scholar] [CrossRef]
- Wu, J.; Chen, S.; Zhou, K.; Chen, X. Influence of Livelihood Capital of Rural Reservoir Resettled Households on the Choice of Livelihood Strategies in China. Water 2022, 14, 4055. [Google Scholar] [CrossRef]
- Wu, J.; Xiong, J.; Yang, H. A study on the impact of poverty alleviation and relocation of farmers in ethnic minority areas on their livelihoods based on quasi natural experiments. China Soft Sci. 2022, 376, 129–138+148. [Google Scholar]
- Musumba, M.; Palm, C.A.; Komarek, A.M.; Mutuo, P.K.; Kaya, B. Household livelihood diversification in rural Africa. Agric. Econ. 2022, 53, 246–256. [Google Scholar] [CrossRef]
- Xi, J.; Zhang, N. A Study on the Evolution of Livelihood Patterns of Rural Tourism Settlement Farmers: A Case Study of Gougezhuang Village in Yesanpo Tourist Area. J. Tour. 2016, 31, 65–75. [Google Scholar]
- Marcel, M. Sociology and Anthropology; Yu, B., Translator; Shanghai Translation Publishing House: Shanghai, China, 2003; pp. 323–394. [Google Scholar]
- Li, C.; Liu, W.; Feng, W.; Li, S. The impact of immigration and relocation on farmers’ livelihood strategies: A surveybased on Ankang area in southern Shaanxi. China Rural Obs. 2013, 31–44+93. Available online: https://kns.cnki.net/kcms2/article/abstract?v=_AqZbjAWWJR50NF7xaY18Ww2nrKVR_ty4sd5Hl9EN5SOSwGbcwGimuOPKRgjMDS4QD1YHTQnrJNAsfyQldfRUvo3Oz22rhE3bHGwkDqhj0fhYsC2oamLm8HoQ8LPyAYHSGWo4tVpdBg=&uniplatform=NZKPT&language=CHS (accessed on 8 July 2023).
- DFID. DFID Sustainable Livelihoods Guidance Sheets. [2018-09-03]. Available online: https://www.ennonline.netldfidsustainableliving (accessed on 8 July 2023).
- Kuang, F.; Jin, J.; He, R.; Ning, J.; Wan, X. Farmers’ livelihood risks, livelihood assets and adaptation strategies in Rugao City, China. J. Environ. Manag. 2020, 264, 110463. [Google Scholar] [CrossRef]
- Ellis, F. Rural Livelihoods and Diversity in Developing Countries; Oxford University Press: Oxford, UK, 2000. [Google Scholar]
- Tsvegemed, M.; Shabier, A.; Schlecht, E.; Jordan, G.; Wiehle, M. Evolution of rural livelihood strategies in a remote sino-Mongolian border area: A cross-country analysis. Sustainability 2018, 10, 1011. [Google Scholar] [CrossRef]
- Khatiwada, S.P.; Deng, W.; Paudel, B.; Khatiwada, J.R.; Zhang, J.F.; Su, Y. Household livelihood strategies and implication for poverty reduction in rural areas of central Nepal. Sustainability 2017, 9, 612. [Google Scholar] [CrossRef]
- Zhou, S.; Zhao, K. Analysis of the Path Selection and Influencing Factors for the Transformation of Agriculture, Animal Husbandry and Livelihood Planning—Taking the Agricultural and Animal Husbandry Interlaced Area of the Yellow River Basin as an Example. Resour. Environ. Arid. Areas 2023, 37, 88–96. [Google Scholar] [CrossRef]
- Tang, H.; Chen, J.; Liu, Q.; Yang, X.; Zhang, X.; Ye, W. The Path, Effect, and Mechanism of Livelihood Transformation for Farmers in the Shiyang River Basin under Ecological Governance. Geogr. Res. 2023, 42, 822–841. [Google Scholar]
- Mao, S.; Qiu, S.; Li, T.; Tang, M. Rural Households’ Livelihood Strategy Choice and Livelihood Diversity of Main Ethnic Minorities in Chongqing, China. Sustainability 2020, 12, 8166. [Google Scholar] [CrossRef]
- He, Y.; Ahmed, T. Farmers’ Livelihood Capital and Its Impact on Sustainable Livelihood Strategies: Evidence from the Poverty-Stricken Areas of Southwest China. Sustainability 2022, 14, 4955. [Google Scholar] [CrossRef]
- Li, C.; Xu, J.; Kong, X. Diversification of Livelihoods of Rural Farmers in Metropolitan Suburbs and Its Impact on Land Use: A Case Study of Daxing District, Beijing. Geogr. Res. 2012, 31, 1039–1049. [Google Scholar]
- Zhang, Y.J.; Pan, Y.; Zhang, X.Z.; Wu, J.X.; Yu, C.Q.; Li, M.; Wu, J.S. Patterns and dynamics of the human appropriation of net primary production and its components in Tibet. J. Environ. Manag. 2018, 210, 280–289. [Google Scholar] [CrossRef]
- Jiao, X.; Pouliot, M.; Walelign, S.Z. Livelihood strategies and dynamics in Rural Cambodia. World Dev. 2017, 97, 266–278. [Google Scholar] [CrossRef]
- Wan, W.; Zhao, X.; Wang, W.; Xue, S. Livelihood risk identification and response strategies for farmers in fragile alpine ecological areas: A case study of the Gannan Plateau. Econ. Geogr. 2017, 37, 149–157+190. [Google Scholar]
- Jiang, J.; Zhao, X.; Zhang, L.; Hou, C.; Li, W.; Yan, J. Analysis of Farmers’ Choice of Alternative Livelihoods and Its Influencing Factors: Taking the Gannan Yellow River Water Supply Area as an Example. J. Nat. Resour. 2012, 27, 552–564. [Google Scholar]
- Zhang, J.; Wu, K.; Wang, Q.; Yang, X.; Zhan, X. Rural Transformation and Livelihood Evolution of Farmers in the Loess Plateau under the Background of Industrial Development: A Case Study of Changwu County, Shaanxi Province. Geogr. Res. 2023, 42, 1285–1306. [Google Scholar]
- Li, X. The Transformation of Livelihood Methods in the Development of Rural Tourism in Tai’an Rural Community in the Three Gorges Reservoir Area. J. Three Gorges Univ. Humanit. Soc. Sci. Ed. 2016, 38, 32–36. [Google Scholar]
- Ma, M.; Chen, S.; Tao, S.; Cao, Z. A Study on the Livelihood Strategies, Livelihood Capital, and Family Income Impact of Relocated Immigrants for Poverty Alleviation in Different Areas: A Case Study of Deep Poverty stricken Areas of Ethnic Minorities in Yunnan. Resour. Environ. Arid. Areas 2021, 35, 1–10. [Google Scholar]
- Wu, J.; Wang, X.; Xiong, G. Research on the Impact of Rural Land Remediation on Farmers’ Livelihood Strategies Based on a Sustainable Livelihood Framework. Soil Water Conserv. Bull. 2020, 40, 269–277+284. [Google Scholar]
- Guo, X.; Zhou, L.; Chen, Y.; Yang, G.; Zhao, Z.; Wang, R. The Impact of Livelihood Capital on Livelihood Strategies of Farmers in Typical Desertification Regions: A Case Study of Hangjin Banner, Inner Mongolia Autonomous Region. J. Ecol. 2017, 37, 6963–6972. [Google Scholar]
- He, R.; Fang, F.; Liu, Y. Research on the Impact of Human Capital on Livelihood Strategies of Farmers in Poor Mountain Areas: A Case Study of Liangshan Yi Autonomous Prefecture, Sichuan Province. Prog. Geogr. Sci. 2019, 38, 1282–1293. [Google Scholar] [CrossRef]
- Ma, G.; Zhou, Z.; Zhu, C.; Wu, Y.; Dan, Y. The Relationship between Livelihood Capital and Livelihood Strategies of Farmers in Stone Desertification Areas: A Case Study of the Comprehensive Demonstration Zone of Stone Desertification in Zhenfeng Huajiang, Guanling, Guizhou Province. Water Soil Conserv. Bull. 2020, 40, 299–307. [Google Scholar]
- Zhao, W.; Yang, S.; Wang, X. A Study on Livelihood Capital and Livelihood Strategies Based on Logistic Regression Model: A Case Study of the Dai Ethnic Group in the Dry Hot Valley of Xinping County, Yunnan Province. Resour. Sci. 2016, 38, 136–143. [Google Scholar]
- Zhou, L.; Li, H.; Li, P. The Impact of Livelihood Capital on Livelihood Strategy Selection of Relocated Farmers in Poverty Alleviation: Based on a Survey of Relocated Farmers in Hunan. Econ. Geogr. 2020, 40, 167–175. [Google Scholar] [CrossRef]
- Zhang, J.; Yang, H.; Wu, J. Research on the Sustainable Livelihood Ability of Farmers in Ethnic Minority Areas from the Perspective of Preventing Poverty Return. Explor. Econ. Issues 2022, 79–88. Available online: https://kns.cnki.net/kcms2/article/abstract?v=_AqZbjAWWJTq-0zOhhBQPCe3wK-06KED48KbGqbr7dNRyVqmoK0hCQsdztOK2C68t7tU2uuxNn6B9XJ8RvX_ii2smaKCYxZ_h0kHekEbVlkKKcbKquODPVmIQKw1sxd4mwHKJoKq-wsUcqdhS-Mzjg==&uniplatform=NZKPT&language=CHS (accessed on 8 July 2023).
- Bi, L. Research on Sustainable Livelihoods of Farmers in Ethnic Minority Areas from the Perspective of Precision Poverty Alleviation. Ph.D. Thesis, Yunnan University for Nationalities, Kunming, China, 2020. [Google Scholar]
- Li, Q.; Zheng, J. Hotspot Analysis and Path Evolution of Research on Relocation for Poverty Alleviation in Different Places: A Literature Visualization Analysis Based on CiteSpace. Rural Econ. Technol. 2022, 33, 5–10. [Google Scholar]
- Duan, X.; Wei, R.; Wang, M. Research on the Changes and Influencing Factors of Livelihood Patterns of Farmers Relocating from Different Areas for Poverty Alleviation: Based on a Survey of Two Counties in Liupan Mountain Area. Resour. Environ. Arid. Areas 2022, 36, 25–33. [Google Scholar]
- Liang, L.; Qu, F.; Zhu, P.; Ma, K. Transformation and Development of Rural System in the Loess Plateau, Analysis of land use behavior and efficiency of different types of part-time farmers: An empirical study based on economically developed regions. Resour. Sci. 2008, 30, 1525–1532. [Google Scholar]
- Chen, X.; Wang, C. Factor analysis of part-time employment behavior among farmers in Suzhou. China Rural Econ. 2007, 25–31. Available online: https://kns.cnki.net/kcms2/article/abstract?v=_AqZbjAWWJTklSBg21rLxWaeVlgUxF6GrCGMor18OSBBG-lE7FALX1vaQTR-xaQuBA8nU0WQw2BgJVLM4yP-6MqN3pAJYLYn5A4tPF3UQHnF6fi9ge5nbx_3tBz-61CEMA-RgftNKKU=&uniplatform=NZKPT&language=CHS (accessed on 8 July 2023).
- Lyu, X.; Peng, W.; Niu, S.; Qu, Y.; Xin, Z. Evaluation of sustainable intensification of cultivated land use according to farming households′ livelihood types. Ecol. Indic. 2022, 138, 108848. [Google Scholar] [CrossRef]
- DFID. Sustainable Livelihoods Guidance Sheets; Department for International Development: London, UK, 2000; pp. 68–125. [Google Scholar]
- Tu, S.Q.C.K.; Fang, Y.; Wang, H.; Xu, K. A Study on the Livelihood Assets and Livelihoods of Farmers in the Half Agriculture and Half Pastoral Areas of Inner Mongolia: Taking Shuangyushu Gacha in Keyou Middle Banner as an Example. Geogr. Sci. 2017, 37, 1095–1103. [Google Scholar]
- Tang, Q.; Bennett, S.J.; Xu, Y.; Li, Y. Agricultural practices and sustainable livelihoods: Rural transformation within the Loess Plateau, China. Appl. Geogr. 2013, 41, 15–23. [Google Scholar] [CrossRef]
- Asante, F.; Guodaar, L.; Arimiyaw, S. Climate change and variability awareness and livelihood adaptive strategies among smallholder farmers in semi-arid northern Ghana. Environ. Dev. 2021, 39, 100629. [Google Scholar] [CrossRef]
- Kühling, M.; Alamsyah, Z.; Sibhatu, K.T. Agrarian change, livelihood dynamics and welfare outcomes: Evidence from plantation crop farmers in Indonesia. J. Environ. Manag. 2022, 311, 114864. [Google Scholar] [CrossRef] [PubMed]
- Zhang, J.; Wu, K.; Yang, X. Research on the Mechanism of Livelihood Differentiation of Farmers in Apple Eugenics Areas on the Loess Plateau: A Comparative Analysis Based on Different Topographic Zones. China Agric. Resour. Reg. 2022. Available online: http://kns.cnki.net/kcms/detail/11.3513.S.20221117.1309.020.html (accessed on 8 July 2023).
- Liu, J.; Guo, S. The impact of sustainable livelihood capital on farmers’ income: An empirical study based on information entropy method. Stat. Decis. 2012, 103–105. [Google Scholar] [CrossRef]
- Wen, J. From Survival Rationality to Social Rationality Choice: A Sociological Analysis of the Motivation of Chinese Farmers’ Employment Abroad. Sociol. Res. 2001, 19–30. [Google Scholar] [CrossRef]
- Ma, M.; Chen, S.; Tao, S. Research on the Poverty Alleviation Effect and Livelihood Development of Relocation in Ethnic Minority Areas: A Case Study of the Three Districts, Three Prefectures, and Nujiang Prefecture. Resour. Environ. Arid. Areas 2021, 35, 16–23. [Google Scholar]
- Chen, S.; Ma, M.; Tao, S. Research on the Impact of Livelihood Capital, Livelihood Strategies, and Livelihood Choice Behavior of Relocated Poverty Alleviation Immigrants from the Perspective of Common Prosperity. J. Hohai Univ. (Philos. Soc. Sci. Ed.) 2023, 25, 94–108. [Google Scholar]
- Wang, S.; Hou, Q. Analysis of Factors Influencing Farmers’ Livelihood Patterns in Qinba Mountain Area, Gansu Province—Empirical Study Based on Binary logistic Model. J. Xihua Univ. (Philos. Soc. Sci. Ed.) 2018, 37, 101–107. [Google Scholar] [CrossRef]
- Chen, S.; Su, S. Livelihood risks and response strategies of farmers under the impact of major epidemics: A case study based on mountainous areas in Fujian. J. Fujian AF Univ. (Philos. Soc. Sci. Ed.) 2020, 23, 1–6. [Google Scholar]
- Li, Y.; Huai, J.; Zhang, X. Research on the influencing factors of farmers’ livelihood resilience in the Loess Plateau under the “meteorological disaster+COVID-19”. Resour. Environ. Arid. Areas 2023, 37, 54–62. [Google Scholar] [CrossRef]
- Li, H.; Zhao, X.; Wang, W.; Li, W. The inherent vulnerability and influencing factors of rural society in the Gannan Plateau. Geogr. Sci. 2020, 40, 804–813. [Google Scholar]
- Zhang, Y.; Long, H.; Tu, S.; Li, Y.; Ma, L.; Ge, D. Analysis of rural economic restructuring driven by e-commerce based on the space of flows: The case of Xiaying village in central China. J. Rural Stud. 2022, 93, 196–209. [Google Scholar] [CrossRef]
- Ma, C.; Yuan, Q.; Wen, Q.; Li, X. Research on the Impact of Rural Industrial Development on Farmers’ Livelihoods: Taking Hongsibao District of Ningxia as an Example. Prog. Geogr. Sci. 2021, 40, 784–797. [Google Scholar] [CrossRef]
- Liu, W.; Xu, J.; Li, J. A Study on the Livelihood Adaptability of Farmers in Relocation for Poverty Alleviation: A Case Study of Migrant Relocation in Southern Shaanxi. China Agric. Resour. Zoning 2018, 39, 218–223. [Google Scholar]
Disclaimer/Publisher’s Note: The statements, opinions and data contained in all publications are solely those of the individual author(s) and contributor(s) and not of MDPI and/or the editor(s). MDPI and/or the editor(s) disclaim responsibility for any injury to people or property resulting from any ideas, methods, instructions or products referred to in the content. |
© 2024 by the authors. Licensee MDPI, Basel, Switzerland. This article is an open access article distributed under the terms and conditions of the Creative Commons Attribution (CC BY) license (https://creativecommons.org/licenses/by/4.0/).