Article

Sustainable Planning Strategy of Dairy Farming in China Based on Carbon Emission from Direct Energy Consumption

1
College of Water Resources and Civil Engineering, China Agricultural University, Beijing 100083, China
2
Key Laboratory of Agricultural Engineering in Structure and Environment, Ministry of Agriculture and Rural Affairs, Beijing 100083, China
3
College of Information and Electrical Engineering, China Agricultural University, Beijing 100083, China
*
Author to whom correspondence should be addressed.
Agriculture 2023, 13(5), 963; https://doi.org/10.3390/agriculture13050963
Submission received: 13 March 2023 / Revised: 22 April 2023 / Accepted: 25 April 2023 / Published: 26 April 2023

Abstract

:
The mechanical and electrical development in dairy farming in China increases energy-related carbon emission (CE). To support the sustainable planning strategy of the department, this study calculated the CE and the carbon emission intensity (CI) of the direct energy consumed in dairy farms from 21 provinces in China. Through four dimensions analysis including the national level, farm scale, inter-provincial distribution, and main producing area, this study illustrates the impact of the environment, production, and management on CE. The total CE of nationwide dairy farming was about 2.4 Tg CO2 eq. in 2019, and the CIs of the 21 provinces varied from 0.009 to 0.216 kg CO2 eq. per kg of milk. The results indicate that the management mode applied in large-scale dairy farms (500 heads and above) varies considerably due to inadequate adaptation to climate. In general, semi-arid and semi-humid regions are more suitable for dairy farming than arid and humid regions. In the main milk-producing area, the spatial aggregation effect is visible in the carbon reduction potential. The present study suggests that further steps to promote sustainability and milk productivity are embodied when the replacement of fossil fuels and the management standardization are adapted to regional characteristics.

Graphical Abstract

1. Introduction

Considered as the largest energy consumer and carbon emitter, China accounts for more than 30% of global greenhouse gas (GHG) emissions. To achieve the carbon-neutral goal by 2060, broader and more intensive mitigation actions need to be taken [1,2]. In 2018, the GHG emissions from the livestock sector are about 298 Tg CO2 eq. in China, nearly half of that from agriculture [3]. As an important part of animal husbandry, dairy farming has received special attention and scrutiny for its environmental impact [4,5].
In 2019, the national milk productivity exceeded 32 Tg, with a stock of 10.45 million head cows [6]. The farms with more than 100 head cows reached 64%, showing an increase of 31% compared with this value in 2011 [7]. The increase in herd size leads to the intensification of dairy farming, which is negatively correlated with ecological efficiency [8]. With the increase in quality control and environmental protection, the proportion of free-range farming decreases notably and intensive farms take on more production tasks [9]. To fit this situation, the application of machines and standardized management spread rapidly [6]. The mechanization and electrification of dairy farming reduce labor costs and result in a significant increase in direct energy consumption and GHG emissions. In on-farm production, direct energy consumption mainly involves feed production, wastewater processing, cattle management, milk extraction, and water supply [10].
While electricity is mainly used for cattle management in barn, milk extraction, and pumping water, diesel is consumed by farm machineries, such as tractors, trucks, and heavy machineries with diesel engines [11]. Houston et al. [12] studied the direct energy consumption of small farms in Canada and reported that electricity is mainly used for cooling, illumination, and ventilation. Through a review of energy consumption in dairy farms, Shine et al. [13] concluded that 48.9 kWh is consumed to produce 1 ton of milk on average and milk cooling is the largest consumer of electricity. Pagani et al. [14] investigated direct and indirect energy consumption of dairy farms in Missouri, USA and in Emilia-Romagna, Italy. They found that on average, an increase of 1 GJ in energy consumption can lead to a rise in milk productivity of 115 kg per cow per year in America, and 149 kg in Italy. Moerkerken et al. [15] studied representative dairy farms in Netherlands and reported that the energy efficiency is 56.3 kWh per ton of milk for small farms, and medium and large farms are 49.3 and 42.6 kWh per ton of milk, respectively. The current situation in Netherlands manifested that the intensification and mechanization deteriorate energy efficiency with 16 kWh per ton of milk, but the promotion of sustainability is expected to eliminate that negative impact.
To reveal the influence of farm management on the carbon footprint of milk production and financial performance for dairy farms in Ontario, Canada, Jayasundara et al. [16] calculated the GHG emissions from intensive farms and pointed out that large-scale farms are more likely to reduce CE and improve productivity. Ilyas et al. [17] studied dairy farms in New Zealand and reported that the carbon footprint of energy consumption in barn system is 11% higher than grazing system. That difference is due to imported feed supplements, machinery usage, and fossil fuel consumption for on-farm activities. Zira et al. [18] studied dairy and beef farming systems in southwestern Europe and indicated that the carbon emission equivalent is 1.4~1.5 kg CO2 eq. per kg of fat and protein corrected milk (FPCM) at farm gate. Based on survey data in Shandong and Heilongjiang, Huang et al. [19] estimated the nationwide GHG emissions of dairy farming to be about 45 Tg CO2 eq. They attributed this to that half of dairy farms in China adopt high recycling system and further propelling of which is able to create a reduction of 7~21% in GHG emissions. Wang et al. [20] evaluated the potential mitigation options at farm level in Guanzhong plain, they reported that direct energy usage and feed transportation are responsible for 3~9% and 1~2% of the total GHG emissions, respectively. However, the management mode, the scale of dairy farms, and the breed of cattle vary by climate and geographical conditions [21,22,23]. Simultaneously, to optimize the distribution of milk production, the government integrates the dominant factors and makes the construction focus on the regions with high-quality milk sources, such as northeast regions, Inner Mongolia, and north and central China [7]. Policy bias causes differences in the process of mechanization and management standardization in provinces, which is reflected in a variety of practices in dairy farming [24]. For most cattle farms, technology upgrading and management optimization have a great potential to improve energy efficiency [16,25]. Additionally, by replacing fossil fuels with electricity and taking advantage of clean energy such as biogas and solar energy, farms are able to promote the composition of energy utilization and thus reduce carbon emission (CE) [26]. For the energy-environment performance in China’s agricultural sector, although the technology in Shanxi and Yunnan are at the forefront under contemporaneous frontier, most provinces do not perform efficiently in energy utilization referring to global frontier [27]. From the perspective of improving ecological efficiency, it is difficult to formulate targeted policies and support measures while the differences in CE caused by various practices are unclear [28,29,30]. The existing studies related to dairy farming are insufficient to provide valid conclusions.
Therefore, the aim of this study is to quantify CE from direct energy consumption of dairy farming through on-farm practices. Forage planting, manure application, and energy transposition are not included. To determine the ecological benefit, we calculated and compared the carbon emission intensity (CI) by farm scales and provinces, which refers to CE per kg of milk. These were determined by (1) calculating and illustrating the CE related to direct energy consumption of dairy farming in China, (2) demonstrating the inter-provincial distribution of CE and CI, and (3) analyzing the carbon reduction potential (CRP) and the impact factors in the main producing area. The analysis results also allow us to make recommendations on carbon reduction related to energy utilization and management practices in cattle farms.

2. Materials and Methods

2.1. Data Acquisition

The conditions of cattle breeding and farm management in 2019 were obtained from the China dairy yearbook [7]. The corresponding data of milk productivity and direct energy cost were from the Ministry of Agriculture and Rural Affairs of the People’s Republic of China (MOA) [9]. Based on the current breeding situation, the number of lactating cows is assumed to be 50% of the total stock, and the lactating period is assumed to be 305 days per year [9]. According to the MOA and the Dairy Association of China (DAC), dairy farms are categorized into four groups by herd size: backyard (1~9 heads), small-scale farm (10~49 heads), medium-scale farm (50~499 heads), and large-scale farm (500 heads and above). The environmental temperatures were obtained from the National Meteorological Information Center, which are the average values for provinces from 1981 to 2010 [31]. The regions in China are divided into four classes in terms of arid and humid conditions: humid region (HR), semi-humid region (SHR), semi-arid region (SAR), and arid region (AR) by the People’s Republic of China yearbook [32]. The specific situation of the regional division is shown in Table 1. The aridity index refers to the ratio of the annual mean of potential evapotranspiration to the annual mean of precipitation.
Based on the given information, the direct energy costs in this study consist of electricity, coal, and diesel. The direct energy consumption that are less than 1% are not included [13,33]. The electricity prices for provinces are the flat segment prices for the purpose of agriculture, which were collected from the State Grid Corporation of China [34]. The price of coal is the base price, and the price of diesel is the national average in 2019, both of which were collected from the National Development and Reform Commission [35].

2.2. The Calculations of CE and CI

As the direct energy costs per cow were collected by different farm scales in provinces, the direct energy used per cow could be calculated based on the prices of energy. Given the increasing proportion of installed clean energy power generation [36,37], the national carbon emission factor of electricity is 0.5839 t CO2 eq./MWh, which is used by the Ministry of Ecology and Environment of China in 2020 [38]. The GHG emissions of coal and diesel are the sum of methane (CH4), nitrous oxide (N2O), and carbon dioxide (CO2) emissions. According to the corresponding default emission factors (EF) and the 100-year global warming potential (GWP) value from the Intergovernmental Panel on Climate Change [39,40,41], we calculated the carbon emission equivalents of coal and diesel. CEE, CEC, and CED stand for carbon emissions from electricity, coal, and diesel consumption, respectively. And j = (1, 2, 3) stands for CH4, N2O, and CO2, respectively.
C E E = e l e c t r i c i t y     0.5839 C E C = c o a l   E F j G W P j C E D = d i e s e l E F j G W P j C E p , i = C E E p , i + C E C p , i + C E D p , i
The functional unit (FU) of this study is kg CO2 eq. per kg of milk, referring to the annual CO2 equivalent generated by direct energy consumption to obtain 1 kg of milk. The carbon emission of each province (CEp) is calculated based on the stock Xp of lactating cows, the breeding proportion μp,i of different scales, and the corresponding CEp,i per cow, when i = (1, …, n) stands for scale groups of farms.
C E p = X p i = 1 n μ p ,   i C E p , i s . t .   i = 1 n μ p , i = 1 0   <   μ p , i   1 1     n     4
The carbon emission intensity of each province (CIp) is the ratio of the weighted average of CEp,i per cow per year to the weighted average of milk productivity Yp,i per cow per year, where the weight is the breeding proportion μp,i in the province.
C I p = i = 1 n μ p , i     C E p , i i = 1 n μ p , i     Y p , i s . t .   i = 1 n μ p , i = 1 0   <   μ p , i     1 1     n     4

2.3. Main Milk-Producing Area and CRP Analysis

In this study, there are data from 21 provinces collected in detail. We screened out 14 provinces as the main producing area for having the characteristics as follows: (1) they all hold Holstein as the dominating cattle breed according to the DAC, and (2) most of the dairy farms in the province are medium scale and large scale [7]. In consequence, the CRP of energy consumption is capable to be analyzed on the basis of a production year and individual subject. According to the framework of total factor energy efficiency, CE is an undesirable output [42]. Thus, the CRP is expressed as the ratio of the difference value between actual output (AO) and intended output (IO) to IO.
I O = 1 n i = 1 n C E c o w , i A O p = C E c o w , p C R P p =   ( A O p I O ) / I O
In Formula (4), CRPp is the carbon reduction potential of each province. Additionally, AOp is the actual CE from direct energy consumption per cow per year in the province, which means the IO is the average of CEcow in the main producing area. CRPE, CRPC, and CRPD denote carbon reduction potential of electricity, coal, and diesel consumption, respectively.

2.4. Data Process and Analysis

The data were processed in Microsoft Excel (Microsoft Excel, 2019). The results were imported into Python (Pycharm, 2021) for geographic information system (GIS) analysis of the inter-provincial distribution. We used SPSS (IBM SPSS Statistics, 25.0) for correlation analysis and Origin (OriginLab, 2021b) to present the results. All data were tested for normality and homogeneity of variance. The results were expressed as mean ± standard deviation (SD). One-way analysis of variance (ANOVA) was used to compare CIs among farms with different herd sizes. The double-tail correlation between CEE and environmental temperature was tested at provincial level in the main milk-producing area, as well as direct energy cost and milk productivity. Within the 95% confidence interval, p < 0.05 is a significant correlation.

3. Results

To illustrate the state of CE from dairy farming in China, we analyzed the results from the four dimensions including the national level, farm scale, inter-provincial distribution, and main producing area. As CE is closely related to direct energy consumption, the characteristics of energy use are also illustrated.

3.1. Overview of CE from Dairy Farming

In 2019, 100% of intensive farms in China are equipped with milking machines, and 95% have applied tractors for total mixed ration. Consequently, the contents of fat and protein in milk sampling from intensive farms are higher than the national average, and the somatic cell count (SCC) and total bacteria count (TBC) are lower than the national level. The quality parameters of milk sampling from intensive farms and the national average are presented in Table 2.
The nationwide overview of CE from direct energy consumption of dairy farming is presented in Figure 1. The total CE is 2.4 Tg CO2 eq. in 2019. The proportion of CEE varies by provinces from 25% to 100%, and CEC from 0 to 75%. For the country, the proportions of CEE and CEC are 60% and 37%, respectively. In some provinces, e.g., Hebei, Shanghai, Zhejiang, and Fujian, CEE accounts for 100% of the total CE, indicating that electricity is the only energy source. Meanwhile, more than 70% of CE is from coal consumption in Ningxia, Shaanxi, and Shanxi. Although CED only accounts for 3% in general, but it is extremely high in Qinghai reaching 54%. In Chongqing and Sichuan, CED accounts for 14% and 21%, respectively. It is worth noticing that almost no CEC is produced in provinces where CED is high, which implies farms tend to exclude coal as energy source in these regions.

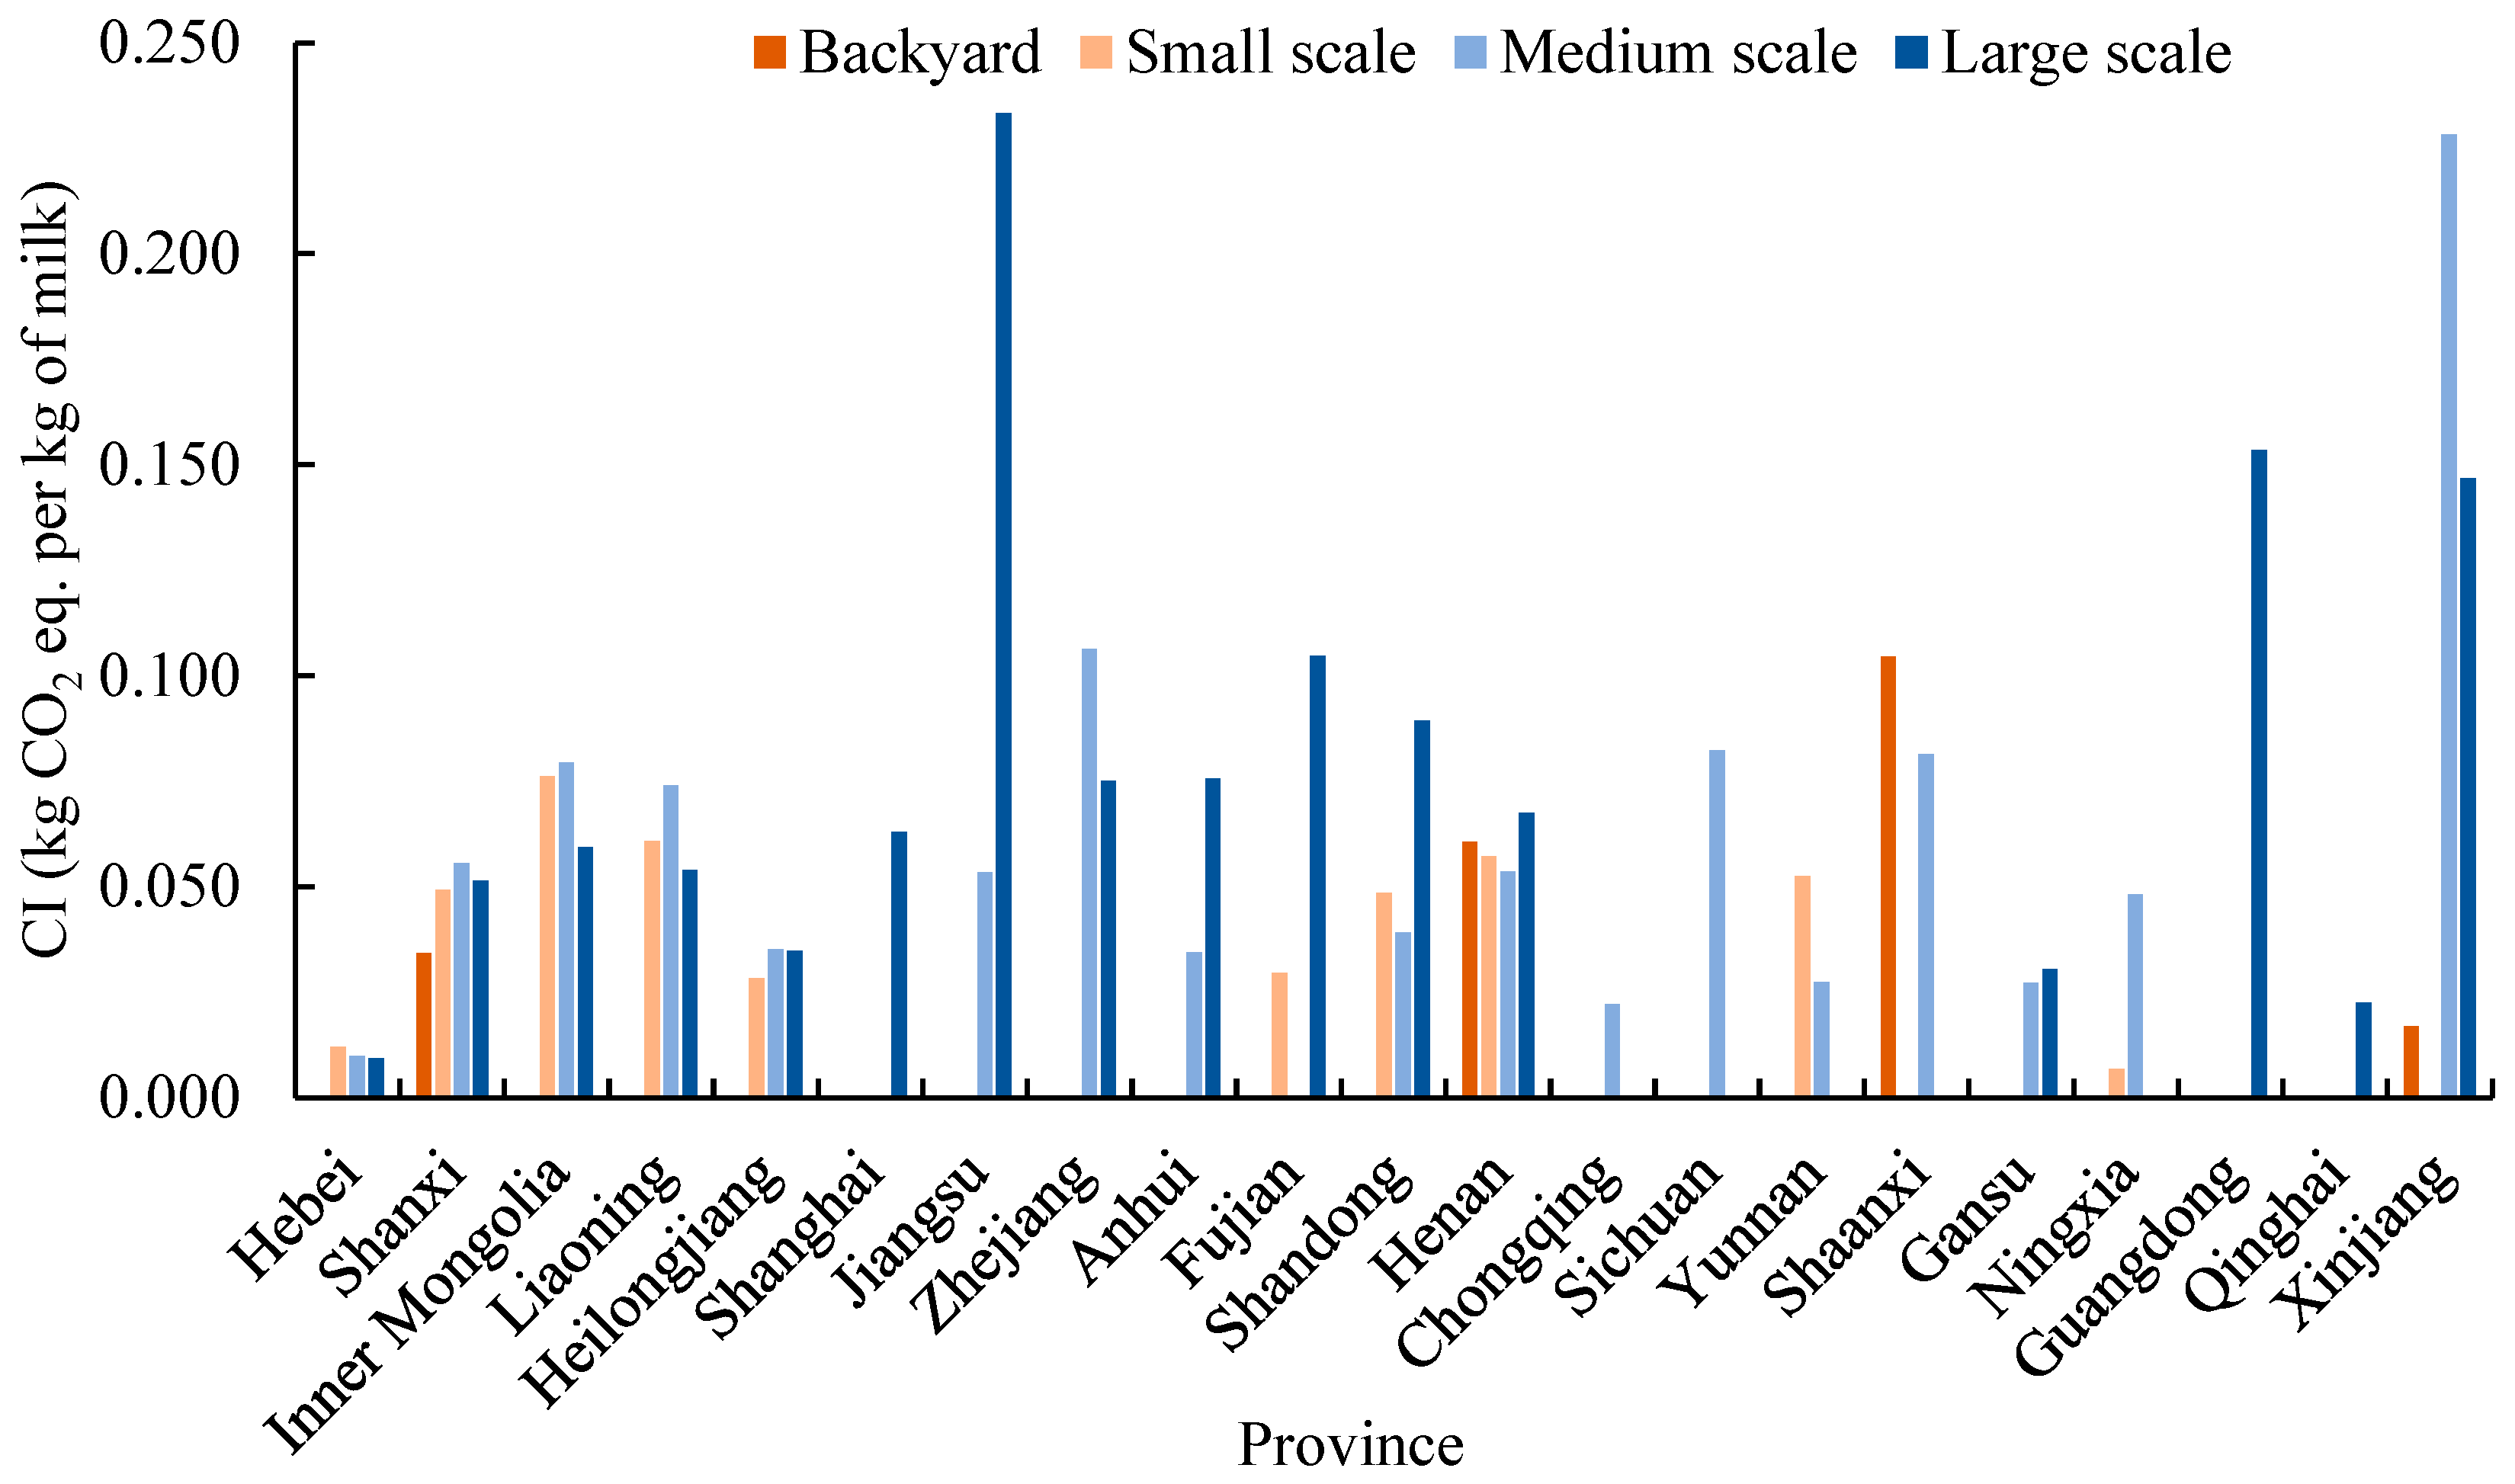
3.2. CIs of Dairy Farms with Different Herd Sizes

Among 21 provinces, only four have a certain amount of backyard farms, while nearly half of them maintain small-scale farms. The occupancy of medium-scale and large-scale farms are 81% and 76%, respectively. In Figure 2, the minimum CI is found on small-scale farms in Ningxia (0.007 kg CO2 eq. per kg of milk), while the maximum occurs on the large-scale farms in Jiangsu (0.233 kg CO2 eq. per kg of milk). There are a considerable number of dairy farms of all four sizes in both Shanxi and Henan. Although the medium-scale farms in Shanxi and Henan have similar stock and CE, the CI of medium-scale farms is the highest in Shanxi, while it is the lowest in Henan. In Shanghai, Guangdong, and Qinghai, only large-scale farms are abundant, while Chongqing and Sichuan are dominated by medium-scale farms. Notably, the CIs of different farm scales in Xinjiang are obviously different (about 12.4 times at most), while the CIs of all scales in Hebei are low.
In terms of the mean value of CI from direct energy consumption (Table 3), the small-scale group is the lowest, and its distribution is the most concentrated in the four groups. By contrast, the mean value of the large-scale farms is the highest, it also has the largest range of variation. The CI of the large-scale group is nearly twice that of the small-scale group, the large-scale farms fail to present the due advantage of energy utilization and CE on the whole. The results also suggest that the management mode of small-scale farms is more mature, while the practices of large-scale farms vary greatly among provinces. ANOVA result shows no significant difference among all groups (p > 0.05), indicating that no significant correlation is found between farm scale and CI.

3.3. The Inter-Provincial Distribution of CI and CE

Based on limited data, this study only analyzed dairy farms in 21 provinces. The average CI of these provinces is 0.069 kg CO2 eq. per kg of milk while the national value is 0.068 kg CO2 eq. per kg of milk. The difference between the average and the national value is 0.001 kg CO2 eq. per kg of milk, which is 1.47% of the national value. It is within the acceptable limit. The CI and CE of each province are shown in Figure 3.
The CIs of provinces vary from 0.009 to 0.216 kg CO2 eq. per kg of milk (Jiangsu to Hebei). From the GIS analysis of the inter-provincial distribution, provinces in SAR and SHR have lower CIs than in AR and HR. The level of CIs is relatively higher in SHR than in SAR. The CIs of coastal provinces are higher than that of inland provinces at the same latitude, such as Shandong versus Henan and Jiangsu versus Anhui.
To the total CE of each province, the stock of dairy cattle is also a crucial factor. Xinjiang has 1.54 million heads of dairy cattle, ranking the highest in the country. Although the CI of Xinjiang is merely 0.082 kg CO2 eq. per kg of milk, its CE is far ahead and 52.1% higher than that of Shandong. On the contrary, Jiangsu and Guangdong have low CEs (115.19 and 19.34 Gg CO2 eq., respectively) due to the small stock despite their CIs being relatively high.

3.4. CRP in the Main Milk-Producing Area

According to the criteria in Section 2.3, the 14 provinces that have the criteria of main milk-producing area are distributed mainly in the middle, eastern, and northeast of SAR and SHR, and a small part in AR and HR. The average productivity of milk in the area is (7.19 ± 1.30) ton per cow per year. At the level of high productivity, the baseline of CEE, CEC, and CED are 291.24, 203.40, and 10.52 kg CO2 eq. per cow per year, respectively. In Figure 4, the negative results signify less environmental impact than the baseline.
According to Figure 4, There are nine provinces in total have replaced diesel with electricity for showing −1 as the result of CRPD. Four provinces have scored −1 at CRPC. Although provinces concentrate in the middle region that are supposed to pay more attention on CRPC, Jiangsu is special for being the only outsider. It is revealed that provinces in northeast region have advantage in CRP while the eastern region is at the inferiority position. Hebei, Liaoning, and Heilongjiang have an excellent performance on CRP for having a negative output in CRPE, CRPC, and CRPD. Further, Hebei is noteworthy for having negative CRPE among the three provinces using pure electricity as energy source. Alternatively, in the five provinces having positive CRPE, Jiangsu has the highest CRPC at 4.81 and Shandong has the highest CRPD at 5.49, representing the extra CE compared with the baseline of CEC and CED, respectively. The CRPD of Jiangsu (3.21) is also unsatisfactory.

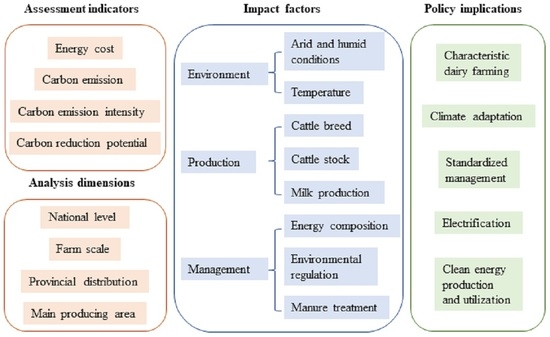
3.5. Impact Factors in the Main Milk-Producing Area

For intensive farming in barns, ambient temperature has a significant impact on dairy cattle. Generally, the higher the temperature is, the more energy will be consumed by ventilation and cooling to mitigate heat stress, resulting in higher CEE and direct energy cost per cow. Correspondingly, cattle farms in cold regions provide heating measures to calves and lactating cows in winter to reduce the occurrence of diarrhea and other diseases. As little coal and diesel are used for heating in winter, only CEE is analyzed in this study.
The analysis results are shown in Figure 5. In the main producing area, the average temperature of the hottest month is the highest in Zhejiang (28.5 °C), while it is the lowest in Ningxia (17.7 °C). At the same time, the CEEs of them are also the extreme values (645.44 versus 70.44 kg CO2 eq. per cow per year). In the coldest month, the average temperature of Heilongjiang (−28.2 °C) is the lowest while that of Shanghai (4.3 °C) is the highest. However, the CEEs of them rank 12th and second (90.84 and 618.26 kg CO2 eq. per cow per year), respectively. The CEE per cow shows a significant correlation with the temperature of the hottest month (p < 0.01), and the analysis with the temperature of the coldest month does not show the expected result. The direct energy cost per cow shows a significant correlation with milk production (p < 0.01), while CE shows no correlation with it (p > 0.05).

4. Discussion

4.1. Nationwide Overview of Dairy Farming

For the sustainable development of dairy farming, targeted policies that are compatible with the current situation should be made. According to previous research, the result verifies that intensive farming in barns is more prevalent in China [17]. It is easier for intensive farms to promote breeding environments and sanitary conditions, which is conducive to guaranteeing animal health and milk quality. In addition, more automation equipment and key technology could be applied to production in intensive farms. Additionally, intensive farming enables farms and regions to arrange centralized processing of feed and manure, which is more efficient and effective, and appealing to preferential policy and inclined resources. Accordingly, intensive and mechanized production became the mainstream in dairy farming. It is the common choice of the government and farmers.
The total CE from direct energy consumption of dairy farming is consistent with previous studies [19,20], which discussed the GHG emissions for dairy farms based on onsite surveys and investigations in Shandong, Heilongjiang, and Guanzhong Plain. Accordingly, there are about 50% of dairy farms in China should pay more attention to the environmental impact based on the current situation. The energy structure varies significantly among provinces. In addition, provinces with similar cattle stock, such as Shanxi and Henan, present different CE when the energy technology are applied on disparate degrees [27].
In a long time, as management practices in small-scale dairy farming adapt to regional characteristics, the impact of climate on farm productivity and efficiency decreases [43]. However, medium-scale and large-scale farms are still new rising things in this department, especially for farms that maintain cows over 10 thousand heads [7]. Due to great differences exist among provinces, the development of management practices is unbalanced and inadequate, which is incompatible with the rapid amplification of farm scale. With dry land and little precipitation, more energy is required to fulfill water supply in AR [44]. Alternatively, farms in HR take on more pressure of cooling and ventilation in cowsheds, resulting in high energy consumption and CI. Influenced by marine monsoon, coastal and inland provinces present differences in CI as well. Therefore, disparate goals and ecological policies should be set to adapt to regional differences.
To adapt to the sufficient sunshine and lack of water, small-scale farms and grazing are common in provinces such as Xinjiang and Xizang, and more than 2/3 of the cow stock is dual-purpose cattle [7]. That leads to low milk productivity and direct energy consumption at the same time. However, the breeding of local livestock breeds maintains the diversity of ecological species. It is also widely proven that suitable intensity and duration of cattle grazing is beneficial to ecosystem function maintenance and carbon sequestration [45,46,47]. In addition, the diverse milk sources and dairy products enrich the supply structure of the milk market. In the long term, they are indispensable to the healthy development of dairy farming. Sichuan, Yunnan, and other places raising milk yak, milk buffalo and other breeds are also suitable for this situation. For agriculture systems with such merits, the relative improvement of their ecological benefits should be pursued, rather than absolute limits [8,48].

4.2. Dairy Farming in Main-Milk Producing Area

Similar to other industries [49], the spatial aggregation effect is also visible on dairy farming. To adapt to the rapid amplification of farm scale, more efficient and environmental management modes should be standardized and applied according to regional characteristics.
In recent years, it has become a consensus in scale farms to relieve the heat stress of cows using fan cooling in summer [50,51]. Alternatively, heating practices differ greatly among cattle farms. Heat supplements include hot water pipelines, electric heaters, heating lamps, etc. Some farms supplement heat to cow sheds to relieve cold stress and improve animal welfare, while others do not pay enough attention to this problem. Due to the contradiction between heating and ventilation in winter, neither the calves shed nor dairy shed have formed a widely approved management mode [51]. As cold stress and disease affect the weight and behavior of pre-weaned calves, and poor ventilation increases the risk of airborne disease transmission [52], ventilation strategy and heating technology in winter need to be upgraded, especially in the northeast region.
Normally, more energy cost accompanies more investment in machines and equipment, which implies a farm has better management ability reflected in higher productivity [53]. According to the results, Jiangsu, Zhejiang, Shanghai, and Anhui fit this situation. However, Shanghai manages to perform well in CRP at the same time. Compared with other provinces, Shanghai has advanced CE technology and management systems [42], which is embodied in green energy source and standardized management in dairy farming. That is conducive to high productivity and energy efficiency [7].
According to the research on regional energy efficiency in China, Jiangsu and other eastern provinces are in the superior position of both energy technology and efficiency [54,55]. Consequently, the cooling and ventilation stress and high consumption of fossil fuels should take primary responsibility for unsatisfactory results. For farms in the middle and eastern regions, the replacement of fossil fuels with electricity is helpful to reduce CRP. Further, the production and usage of clean energy in dairy farms, such as biogas fermentation, combined heat and power technology (CHP), and photovoltaic power, is proven to be beneficial both economically and environmentally [7,15]. As reported by DAC, in addition to the advanced management, all dairy farms in Hebei are equipped with manure treatment facilities. Accordingly, biogas fermentation and CHP are promoted on a large scale to recycle waste and reduce direct energy consumption [7]. Although these measures may cause an increase in initial investment, the promised high productivity and energy efficiency are very persuasive [56], which increases the competitiveness of enterprises in the long view.

5. Conclusions

To support the sustainable planning strategy of dairy farming, this study calculated CE from direct energy consumption and analyzed the impact of environment, production, and management on it.
Overall, electricity consumption is the main source of CE for the country and energy structure varies greatly among provinces. By the common choice of the government and farmers, intensive dairy farming in barns is more prevalent in China. From the perspective of farm scale, the management mode of small-scale farms is more mature than others. Alternatively, the development of management practices adapted to regional characteristics is supposed to improve the undesirable situation of large-scale farms. As depicted by the GIS analysis of CI, SAR and SHR are more suitable for dairy farming than AR and HR, and inland provinces have lower CIs than coastal provinces. For provinces breeding local species, characteristic breeding should be encouraged to maintain ecosystem function and various milk supplies.
In the main milk-producing area, the spatial aggregation effect is visible. Provinces concentrated in the middle region are expected to work on CRP. Additionally, provinces in the northeast region have an obvious advantage in CRP while the eastern region is at the inferior position. In addition, high temperature has a significant influence on CEE, and more attention needs to be paid to the environmental regulation of cattle sheds in winter, especially in the northeast region. In general, elevating the direct energy cost is helpful to improve productivity. On this basis, improving and popularizing standardized management will further increase milk productivity and energy efficiency. The replacement of fossil fuels with clean energy is conducive to the optimization of energy structure and the application of energy technology, which could promote the energy-environment performance and the sustainability of dairy farming.

Author Contributions

Conceptualization, X.D.; methodology, S.D.; formal analysis, X.D. and Q.W.; investigation, X.D. and J.G.; data curation, X.D.; writing—original draft preparation, X.D.; writing—review and editing, Y.Z., Q.W. and Z.S.; supervision, Z.S., Y.Z. and S.D.; funding acquisition, Z.S. and Y.Z. All authors have read and agreed to the published version of the manuscript.

Funding

This research was funded by the earmarked fund, grant number CARS36.

Institutional Review Board Statement

This study did not require ethical approval.

Data Availability Statement

The data presented in this study are openly available online, reference number [6,7,9,31,32,34,35,38,39].

Conflicts of Interest

The authors declare no conflict of interest.

References

  1. Chen, B.; Zhang, H.Y.; Li, W.; Du, H.Y.; Huang, H.; Wu, Y.; Liu, S.M. Research on provincial carbon quota allocation under the background of carbon neutralization. Energy Rep. 2022, 8, 903–915. [Google Scholar] [CrossRef]
  2. Yuan, R.; Ma, Q.; Zhang, Q.; Yuan, X.; Wang, Q.; Luo, C. Coordinated effects of energy transition on air pollution mitigation and CO2 emission control in China. Sci. Total Environ. 2022, 841, 156482. [Google Scholar] [CrossRef]
  3. FAOSTAT (FAO Statistical Databases). Available online: http://www.fao.org/faostat/en/#home (accessed on 25 October 2020).
  4. Bassignana, C.F.; Merante, P.; Belliére, S.R.; Vazzana, C.; Migliorini, P. Assessment of Agricultural Biodiversity in Organic Livestock Farms in Italy. Agronomy 2022, 12, 607. [Google Scholar] [CrossRef]
  5. Zhuang, M.; Shan, N.; Wang, Y.; Caro, D.; Fleming, R.M.; Wang, L. Different characteristics of greenhouse gases and ammonia emissions from conventional stored dairy cattle and swine manure in China. Sci. Total Environ. 2020, 722, 137693. [Google Scholar] [CrossRef] [PubMed]
  6. NBSC (National Bureau of Statistics of China). China Rural Statistical Yearbook 2020; China Statistics Press: Beijing, China, 2020.
  7. DAC (Dairy Association of China). China Dairy Yearbook; China Agricultural Press: Beijing, China, 2020. [Google Scholar]
  8. Martinsson, E.; Hansson, H. Adjusting eco-efficiency to greenhouse gas emissions targets at farm level? The case of Swedish dairy farms. J. Environ. Manag. 2021, 287, 112313. [Google Scholar] [CrossRef] [PubMed]
  9. MOA (Ministry of Agriculture and Rural Affairs of the People’s Republic of China). Available online: http://www.moa.gov.cn/nybgb/2023/202302/ (accessed on 23 November 2021).
  10. IDF (International Dairy Federation). A common carbon footprint approach for the dairy sector: The IDF guide to standard life cycle assessment methodology. In Bulletin of the International Dairy Federation; International Dairy Federation: Brussels, Belgium, 2015; Volume 479, p. 20. [Google Scholar]
  11. Safa, M.; Samarasinghe, S. CO2 emissions from farm inputs “Case study of wheat production in Canterbury, New Zealand”. Environ. Pollut. 2012, 171, 126–132. [Google Scholar] [CrossRef] [PubMed]
  12. Houston, C.; Gyamfi, S.; Whale, J. Evaluation of energy efficiency and renewable energy generation opportunities for small-scale dairy farms: A case study in Prince Edward Island, Canada. Renew. Energy 2014, 67, 20–29. [Google Scholar] [CrossRef] [Green Version]
  13. Shine, P.; Upton, J.; Sefeedpari, P.; Murphy, M.D. Energy Consumption on Dairy Farms: A Review of Monitoring, Prediction Modelling, and Analyses. Energies 2020, 13, 1288. [Google Scholar] [CrossRef] [Green Version]
  14. Pagani, M.; Vittuari, M.; Johnson, T.G.; De Menna, F. An assessment of the energy footprint of dairy farms in Missouri and Emilia-Romagna. Agric. Syst. 2016, 145, 116–126. [Google Scholar] [CrossRef]
  15. Moerkerken, A.; Duijndam, S.; Blasch, J.; van Beukering, P.; Smit, A. Determinants of energy efficiency in the Dutch dairy sector: Dilemmas for sustainability. J. Clean Prod. 2021, 293, 126095. [Google Scholar] [CrossRef]
  16. Jayasundara, S.; Worden, D.; Weersink, A.; Wright, T.; VanderZaag, A.; Gordon, R.; Wagner-Riddle, C. Improving farm profitability also reduces the carbon footprint of milk production in intensive dairy production systems. J. Clean Prod. 2019, 229, 1018–1028. [Google Scholar] [CrossRef]
  17. Ilyas, H.M.A.; Safa, M.; Bailey, A.; Rauf, S.; Pangborn, M. The Carbon Footprint of Energy Consumption in Pastoral and Barn Dairy Farming Systems: A Case Study from Canterbury, New Zealand. Sustainability 2019, 11, 4809. [Google Scholar] [CrossRef] [Green Version]
  18. Zira, S.; Röös, E.; Rydhmer, L.; Hoffmann, R. Sustainability assessment of economic, environmental and social impacts, feed-food competition and economic robustness of dairy and beef farming systems in South Western Europe. Sustain. Prod. Consump. 2023, 36, 439–448. [Google Scholar] [CrossRef]
  19. Huang, X.; Shi, B.; Wang, S.; Yin, C.; Fang, L. Mitigating environmental impacts of milk production via integrated maize silage planting and dairy cow breeding system: A case study in China. J. Clean Prod. 2021, 309, 127343. [Google Scholar] [CrossRef]
  20. Wang, X.Q.; Kristensen, T.; Mogensen, L.; Knudsen, M.T.; Wang, X.D. Greenhouse gas emissions and land use from confinement dairy farms in the Guanzhong plain of China—using a life cycle assessment approach. J. Clean Prod. 2016, 113, 577–586. [Google Scholar] [CrossRef]
  21. Hou, J.; Styles, D.; Zhang, W. Improving nutrient and economic efficiency of dairy intensification depends on intensive use of scattered cropland. Sustain. Prod. Consump. 2022, 30, 454–466. [Google Scholar] [CrossRef]
  22. Kiesse, T.S.; Corson, M.S.; Wilfart, A. Analysis of milk production and greenhouse gas emissions as a function of extreme variations in forage production among French dairy farms. J. Environ. Manage. 2022, 307, 114537. [Google Scholar] [CrossRef] [PubMed]
  23. Rotz, A.; Stout, R.; Leytem, A.; Feyereisen, G.; Waldrip, H.; Thoma, G.; Holly, M.; Bjorneberg, D.; Baker, J.; Vadas, P.; et al. Environmental assessment of United States dairy farms. J. Clean Prod. 2021, 315, 128153. [Google Scholar] [CrossRef]
  24. Ranasinghe, R.D.A.K.; Korale-Gedara, P.M.; Weerasooriya, S.A. Climate change adaptation and adaptive capacities of dairy farmers: Evidence from village tank cascade systems in Sri Lanka. Agric. Syst. 2023, 206, 103609. [Google Scholar] [CrossRef]
  25. Henriksson, M.; Flysjö, A.; Cederberg, C.; Swensson, C. Variation in carbon footprint of milk due to management differences between Swedish dairy farms. Animal 2011, 5, 1474–1484. [Google Scholar] [CrossRef] [Green Version]
  26. Egas, D.; Ponsá, S.; Llenas, L.; Colón, J. Towards energy-efficient small dairy production systems: An environmental and economic assessment. Sustain. Prod. Consump. 2021, 28, 39–51. [Google Scholar] [CrossRef]
  27. Jiang, M.J.; Hu, X.J.; Chunga, J.; Lin, Z.Y.; Fei, R.L. Does the popularization of agricultural mechanization improve energy-environment performance in China’s agricultural sector? J. Clean Prod. 2020, 276, 124210. [Google Scholar] [CrossRef]
  28. Wilkes, A.; Wassie, S.; Odhong, C.; Fraval, S.; van Dijk, S. Variation in the carbon footprint of milk production on smallholder dairy farms in central Kenya. J. Clean Prod. 2020, 265, 121780. [Google Scholar] [CrossRef]
  29. Meneses, F.; Montenegro, N.; Schapheer, C.; Perez-Quezada, J.F. Historical Changes in Agricultural Systems and the Current Greenhouse Gas Emissions in Southern Chile. Agronomy 2023, 13, 240. [Google Scholar] [CrossRef]
  30. Tran, D.X.; Pearson, D.; Palmer, A.; Dominati, E.J.; Gray, D.; Lowry, J. Integrating ecosystem services with geodesign to create multifunctional agricultural landscapes: A case study of a New Zealand hill country farm. Ecol. Indic. 2023, 146, 109762. [Google Scholar] [CrossRef]
  31. NMIC (National Meteorological Information Center). Available online: https://data.cma.cn/data/weatherBk.html (accessed on 16 March 2022).
  32. GOV (the Government of China). Available online: http://www.gov.cn/guoqing/2005-09/13/content_2582628.htm (accessed on 19 April 2022).
  33. Uzal, S. Comparison of the Energy Efficiency of Dairy Production Farms Using Different Housing Systems. Environ. Prog. Sustain. Energy 2013, 32, 1202–1208. [Google Scholar] [CrossRef]
  34. SGCC (State Grid Corporation of China). Available online: http://www.sgcc.com.cn/ (accessed on 18 March 2022).
  35. NDRC (National Development and Reform Commission). Available online: https://www.ndrc.gov.cn/fggz/zcssfz/hysj/ (accessed on 2 April 2022).
  36. Zhao, Y.; Cao, Y.; Shi, X.; Li, H.; Shi, Q.; Zhang, Z. How China’s electricity generation sector can achieve its carbon intensity reduction targets? Sci. Total Environ. 2020, 706, 135689. [Google Scholar] [CrossRef]
  37. Liu, J.P.; Wei, D.L.; Wu, L.; Yang, H.; Song, X.H. Synergy and heterogeneity of driving factors of carbon emissions in China’s energy-intensive industries. Ecol. Indic. 2022, 142, 109161. [Google Scholar] [CrossRef]
  38. MEE (Ministry of Ecology and Environment of the Peoples’s Republic of China). Available online: https://www.mee.gov.cn/ (accessed on 3 December 2021).
  39. IPCC (The Intergovernmental Panel on Climate Change). Available online: https://www.ipcc-nggip.iges.or.jp/ (accessed on 25 October 2021).
  40. Myhre, G.; Shindell, D.; Bréon, F.M.; Collins, W.; Fuglestvedt, J.; Huang, J.; Koch, D.; Lamarque, J.F.; Lee, D.; Mendoza, B.; et al. Anthropogenic and Natural Radiative Forcing. In Climate Change 2013: The Physical Science Basis; Cambridge University Press: Cambridge, UK; New York, NY, USA, 2013. [Google Scholar]
  41. Li, P.; Zhang, A.; Huang, S.; Han, J.; Jin, X.; Shen, X.; Hussain, Q.; Wang, X.; Zhou, J.; Chen, Z. Optimizing Management Practices under Straw Regimes for Global Sustainable Agricultural Production. Agronomy 2023, 13, 710. [Google Scholar] [CrossRef]
  42. Shah, W.U.; Hao, G.; Yan, H.; Yasmeen, R.; Jie, Y. The role of energy policy transition, regional energy efficiency, and technological advancement in the improvement of China’s environmental quality. Energy Rep. 2022, 8, 9846–9857. [Google Scholar] [CrossRef]
  43. Reidsma, P.; Ewert, F.; Lansink, A.O.; Leemans, R. Adaptation to climate change and climate variability in European agriculture: The importance of farm level responses. Eur. J. Agron. 2010, 32, 91–102. [Google Scholar] [CrossRef]
  44. Dew, J.J.W.; Jack, M.W.; Stephenson, J.; Walton, S. Reducing electricity demand peaks on large-scale dairy farms. Sustain. Prod. Consump. 2021, 25, 248–258. [Google Scholar] [CrossRef]
  45. Giltrap, D.L.; Kirschbaum, M.U.F.; Laubach, J.; Hunt, J.E. The effects of irrigation on carbon balance in an irrigated grazed pasture system in New Zealand. Agric. Syst. 2020, 182, 102851. [Google Scholar] [CrossRef]
  46. Barneze, A.S.; Abdalla, M.; Whitaker, J.; McNamara, N.P.; Ostle, N.J. Predicted Soil Greenhouse Gas Emissions from Climate × Management Interactions in Temperate Grassland. Agronomy 2022, 12, 3055. [Google Scholar] [CrossRef]
  47. Zhang, Z.; Hua, T.; Zhao, Y.; Li, Y.; Wang, Y.; Wang, F.; Sun, J.; Sun, J. Divergent effects of moderate grazing duration on carbon sequestration between temperate and alpine grasslands in China. Sci. Total Environ. 2023, 858, 159621. [Google Scholar] [CrossRef]
  48. Chen, R.; Kong, Y. Redefine carbon footprint performance with the total factor productivity: A case from a regional food production system. Ecol. Indic. 2022, 144, 109540. [Google Scholar] [CrossRef]
  49. Liu, X.J.; Jin, X.B.; Luo, X.L.; Zhou, Y.K. Multi-scale variations and impact factors of carbon emission intensity in China. Sci. Total Environ. 2023, 857, 159403. [Google Scholar] [CrossRef]
  50. Zhao, W.Y.; Choi, C.Y.; Ru, L.; Shi, Z.X.; Li, H. Effect of Rearing Systems on Growth Performance, Lying/Standing Behavior, Morbidity, and Immunity Parameters of Pre-Weaned Dairy Calves in a Continental Zone in Winter. Agriculture 2022, 12, 1496. [Google Scholar] [CrossRef]
  51. Yan, G.; Liu, K.X.; Hao, Z.; Li, H.; Shi, Z.X. Development and evaluation of thermal models for predicting skin temperature of dairy cattle. Comput. Electron. Agric. 2021, 188, 106363. [Google Scholar] [CrossRef]
  52. Zhao, W.Y.; Choi, C.Y.; Li, G.M.; Li, H.; Shi, Z.X. Pre-weaned dairy calf management practices, morbidity and mortality of bovine respiratory disease and diarrhea in China. Livest. Sci. 2021, 251, 104608. [Google Scholar] [CrossRef]
  53. Hou, N.; Zhu, Q.Y.; Zhao, W.Z.; Luo, Y.Y.; Liu, W.W. Study on the impact of green management of paper enterprises on carbon performance in the background of carbon peaking and carbon neutrality. Energy Rep. 2022, 8, 10991–11002. [Google Scholar] [CrossRef]
  54. Liu, X.X.; Zhong, S.Y.; Yang, M. Study on the decoupling relationship of energy-related CO2 emissions and economic growth in China: Using the new two-dimensional decoupling model. Ecol. Indic. 2022, 143, 109405. [Google Scholar] [CrossRef]
  55. Sun, L.; Liu, W.; Li, Z.; Cai, B.; Fujii, M.; Luo, X.; Chen, W.; Geng, Y.; Fujita, T.; Le, Y. Spatial and structural characteristics of CO2 emissions in East Asian megacities and its indication for low-carbon city development. Appl. Energy 2021, 284, 116400. [Google Scholar] [CrossRef]
  56. Lambotte, M.; De Cara, S.; Brocas, C.; Bellassen, V. Carbon footprint and economic performance of dairy farms: The case of protected designation of origin farms in France. Agric. Syst. 2021, 186, 102979. [Google Scholar] [CrossRef]
Figure 1. CE from direct energy consumption in dairy farms of different sizes in China (Gg CO2 eq. per year). The nodes represent the sources of CE, which are types of energy, provinces, and farm scales from left to right in order. The width of the lines linking the nodes denotes the amount of CE.
Agriculture 13 00963 g001
Figure 2. CI of direct energy consumption in dairy farms with different herd sizes in provinces.
Agriculture 13 00963 g002
Figure 3. CI and CE from direct energy consumption per year in dairy farms in provinces. The warmer the color tone is, the higher the value is. The grey areas indicate no calculated results due to incomplete data.
Agriculture 13 00963 g003
Figure 4. The CRP of direct energy consumption of dairy farming in the main milk-producing area.
Agriculture 13 00963 g004
Figure 5. Correlation among milk production, CEE, direct energy cost, and environmental temperature in the main milk-producing area. The warmer the color tone is, the higher the value is.
Agriculture 13 00963 g005
Table 1. Characteristics of four classes of arid and humid regions in China.
Arid and Humid ConditionsAridity IndexAnnual Precipitation (mm)Natural VegetationLand Utilization
HR≤1.00>800ForestPaddy field mostly
SHR1.00~1.50>400Forest and GrasslandDryland mostly
SAR1.50~4.00<400GrasslandAnimal husbandry and irrigation agriculture
AR≥4.00<200DesertAlpine animal husbandry and oasis irrigated agriculture
Sources: the Government of China.
Table 2. Quality parameters of milk sampling from intensive farms and the national average.
Quality ParametersUnitNational AverageIntensive Farms
PCg/100 g3.253.34
FCg/100 g3.823.91
SCC104/mL28.7122.75
TBC104 CFU/mL27.536.06
PC is milk protein content, FC is milk fat content, SCC is somatic cell count, and TBC is total bacteria count. Sources: Ministry of Agriculture and Rural Affairs of the People’s Republic of China.
Table 3. Attributes of CI from direct energy consumption in dairy farms with different herd sizes from 21 provinces. Max = maximum, Min = minimum.
Farm ScaleCI (kg CO2 eq. per kg of Milk)
MaxMinMean ± SD
Backyard0.1040.0170.054 ± 0.038
Small scale0.0760.0070.042 ± 0.022
Medium scale0.2280.0100.062 ± 0.050
Large scale0.2330.0090.079 ± 0.057
Sources: calculation results in this study.
Disclaimer/Publisher’s Note: The statements, opinions and data contained in all publications are solely those of the individual author(s) and contributor(s) and not of MDPI and/or the editor(s). MDPI and/or the editor(s) disclaim responsibility for any injury to people or property resulting from any ideas, methods, instructions or products referred to in the content.

