Abstract
Urbanization has provided greater demand for food, and the search for strategies capable of reducing waste is essential to ensure food security. Lettuce (Lactuca sativa L.) culture has a short life cycle and its harvest point is determined visually, causing waste and important losses. Using vegetation indices could be an important alternative to reduce errors during harvest definition. The objective of this study was to evaluate different vegetation indices to predict the growth rate and harvest point of lettuce. Twenty-five genotypes of biofortified green lettuce were evaluated. The Green Leaf Index (GLI), Normalized Green Red Difference Index (NGRDI), Spectral Slope Saturation Index (SI), and Overall Hue Index (HUE) were calculated from images captured at 1, 8, 18, 24, and 36 days after transplanting (vegetative state). The diameter and average leaf area of plants were measured using QGIS software. Green mass, number of leaves, and plant and stem diameter were measured in the field. The means were compared using the Scott–Knott test (p ≤ 0.05) and simple linear regression models were generated to monitor the growth rate, obtaining R2 values ranging from 62% to 99%. Genetic dissimilarity was confirmed by the multivariate analysis presenting a cophenetic correlation coefficient of 88.49%. Furthermore, validation between data collected in the field versus data obtained by imaging was performed using Pearson’s correlations and showed moderate to high values. Overall, the vegetation indices SI, GLI, and NGRDI were efficient for monitoring the growth rate and determining the harvest point of different green lettuce genotypes, in attempts to reduce waste and losses. It is suggested that the definition of the harvest point based on vegetation indices are specific for each genotype.
1. Introduction
Every strategy to improve food security is of fundamental importance. The interest and importance of these actions have increased, including in the scientific area. It is now a consensus opinion to say that food waste reflects directly on the lack of food and consequently on the price, causing hunger. It is estimated that food production should increase by 30% by 2030 due to population growth [1].
Among the main vegetables, lettuce (Lactuca sativa L.) stands out and is present daily in food. Lettuce, which belongs to the Asteraceae family, is considered an annual and herbaceous plant and is among the most popular and consumed vegetables in Brazil and worldwide. More than 1.5 million tons of this crop are produced in Brazil, and its activity is concentrated near the large centers called “green belts” [2,3].
With the country facing the search for a healthier diet, especially post-COVID-19, lettuce cultivation in Brazil has increased considerably. In this context, producers have increased cultivation areas. Despite all the benefits, growing lettuce presents great difficulty in defining the harvesting point, causing significant losses and waste [4], mainly due to the plant presenting a short cycle and early bolting [5].
The main parameter that defines the development of the lettuce crop is the number of leaves [6], and in small and large areas of cultivation, the growth rate and harvest point are identified visually. However, in large plantation areas, producers face difficulties in performing this monitoring, causing significant waste and losses [7]. The use of digital images collected by UAVs can be useful and assist in decision-making. Thus, new strategies to define the harvest point in lettuce are needed.
Image phenotyping has been used to assist in the selection and characterization of quantitative and qualitative variables in specific individuals through non-destructive analyses [8]. Unmanned aerial vehicles (UAVs) with attached cameras and sensors perform analyses and follow the stages of crop development, from the visible electromagnetic spectrum to the infrared spectrum [9]. The cost, time, and labor to obtain information in the field and laboratory are reduced when remote sensing is employed.
Vegetation indices are based on reflectance, and their values vary according to the vegetation cover and its biophysical characteristics [10]. There have been reports of the potential use of images in several plant species [11,12,13,14,15,16]. In lettuce, vegetation indices are being used to differentiate pigment levels present in the leaves and to estimate leaf area indices using infrared images [17,18,19]. For eucalyptus cultures, remote sensing has proven efficient at monitoring plantations using vegetation indices. Overall, remote sensing is a low-cost technique and can be applied in large extensions [20]. Studies of the prediction of growth rate and harvest point of vegetables from images have been insufficient.
In this context, the objective of this study was to evaluate different vegetation indices to predict the growth rate and harvest point of lettuce.
2. Materials and Methods
2.1. Genetic Material and Place of Experiment
The experiment was conducted at the Experimental Vegetable Station (18°42′43.19″ S and 47°29′55.8″ O, 873-m altitude) of the Federal University of Uberlândia (UFU), Monte Carmelo campus, Minas Gerais, Brazil.
Twenty-five genotypes were evaluated (Figure 1), with two commercial controls (cv. Grand Rapids and Uberlândia 10,000) and 23 biofortified tropicalized green lettuce lines belonging to the UFU germplasm bank registered with BG α BIOFORT Software [21].
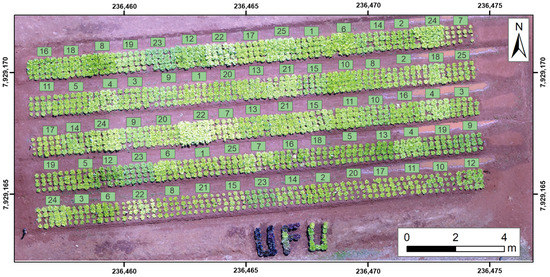
Figure 1.
Distribution of green lettuce genotypes in the field. 1: UFU-206#1#6#1; 2: UFU BIOFORT189E8; 3: UFU-197#3#1#1; 4: UFU-125#1#1#1; 5: UFU-7#1#2#1; 6: UFU BIOFORT155E12; 7: UFU BIOFORT120E21; 8: UFU BIOFORT189E22; 9: UFU-197#2#1#1; 10: UFU-199#3#1#1; 11: UFU-206#1#1#1; 12: UFU BIOFORT206E32; 13: UFU BIOFORT197E34; 14: UFU-197#2#2#1; 15: UFU BIOFORT155E39; 16: UFU BIOFORT189E43; 17: UFU-206#1#4#1; 18: UFU-125#2#2#1; 19: UFU-206#1#2#1; 20: UFU BIOFORT189E48; 21: UFU-206#1#5#1; 22: UFU-040#5#5#1; 23: UFU MC BIOFORT; 24: Grand Rapids; and 25: Uberlândia 10,000.
The genotypes employed in this study were derived from seven successive self-fertilizations between the cultivars PIRA 72 and Uberlândia 10,000 from 2013 to 2018. The seedlings were produced in expanded polyethylene trays with 200 cells filled with coconut fiber commercial substrate. Transplanting was performed when the lettuce plants presented four definitive leaves. The seedlings were transferred to 1.3-m beds fabricated with a rotary bed former.
The following physical and chemical characteristics of the soil were assessed: clayey texture (>50%); pH in CaCl2 = 4.9; Ca = 3.3 cmolc dm−3; Mg = 1.3 cmolc dm−3; H + Al = 4.9 cmolc dm−3; SB = 4.90 cmolc dm−3; SOM = 3.9 dag kg−1; P (rem) = 79.1 mg dm−3; K = 0.29 cmolc dm−3, CEC = 9.80 cmolc dm−3; and BS% = 50. Cultivation was performed as recommended for lettuce culture [22]. Climate conditions were monitored daily during the experiment.
The experiment was conducted in a randomized block design with three repetitions, totaling 75 plots. The plots consisted of 20 plants, with spacing of 0.25 × 0.25 m between plants.
2.2. Acquisition and Processing of Aerial Images
During the execution of the experiment, five flights were performed on different days after transplanting (DAT) (1, 8, 18, 24, and 36 DAT). The aerial images were captured using a Phantom 4 Advanced drone model, with a visible camera (RGB) that had a resolution of 20 megapixels.
Using DroneDeploy software, the flights were performed following the parameters of 20 m in height, 80% longitudinal overlap, and 75% lateral overlap. The orthoimage was generated using Pix4d software. The calculation of the vegetation indices (Table 1) and the image reclassification were performed using R software, version 3.6.3 [23], and the R package FieldImageR [24].

Table 1.
Vegetation indices used in the experiment.
The Overall Hue Index (HUE) was calculated and used to form the mask layer and reclassify the RGB image, excluding the soil. After calculating the Green Leaf Index (GLI), Normalized Green Red Difference Index (NGRDI), and Spectral Slope Saturation Index (SI), the average index for each plot was obtained for all flights.
Growth rate monitoring was performed with non-destructive methods using imagery. In addition to vegetation indices, leaf area in software (LAS) and plant diameter in software (PDS) were extracted using QGIS software, version 3.0, for all flights. PDS was measured using the Raster Calculator tool with six central plants measured.
To obtain LAS, the pixel values in the green band were extracted from the RGB image. Using QGIS software, version 3.0, and the function r. recode, a classification from 1 to 0 could be assigned for the soil and plant, respectively. Thus, the contour of the plants was measured, enabling the calculation of the average leaf area in the respective plots.
2.3. Evaluation of Agronomic Data in the Field
At the commercial point (36 DAT), in addition to capturing images, the green mass (GM) was measured in the field by weighing the leaves, counting the number of leaves (NL), and determining plant diameter (PD) and stem diameter (SD). Six central plants from each plot were used for the evaluations.
2.4. Experimental Flowchart
The methodological steps, including image processing and data analysis, are presented in the experimental flowchart (Figure 2).
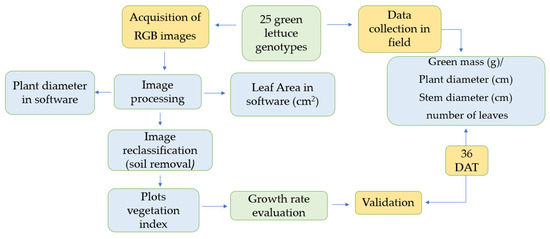
Figure 2.
Flowchart of the experiment steps: data collection in the field and information obtained using images.
2.5. Statistical Analysis
The results measured in the field and the data from images extracted in the last flight (36 DAT) were subjected to analysis of variance using the F test (p ≤ 0.05). Furthermore, means were compared using the Scott–Knott test (p ≤ 0.05). A dendrogram was obtained through multivariate analysis using the Unweighted Pair-Group Method Using Arithmetic Averages (UPGMA). This method was applied to prove the genetic diversity among the treatments of the experiment. To validate vegetation indices, experiments with demonstrably dissimilar treatments (greater number of branches of the dendrogram) were necessary, increasing the spectrum of efficiency of the indices evaluated [17].
Pearson’s correlation between the variables collected in the field and from the images was determined individually between the genotypes (per se), and the significance of the coefficients was verified. Simple linear regression models were generated after the observation of the correlations to monitor the growth rate and the ideal harvest point for the lettuce culture. Graphs were generated for the response variables LAS and PDS and the vegetation indices GLI, NGRDI, and SI at different DAT. Statistical analyses were performed using R [23] and Genes version 1990.2019.91 [28] software.
3. Results
During the experiment, maximum temperatures ranged from 18.8 °C to 32 °C and minimum temperatures ranged from 5.7 °C to 20.9 °C (Figure 3).
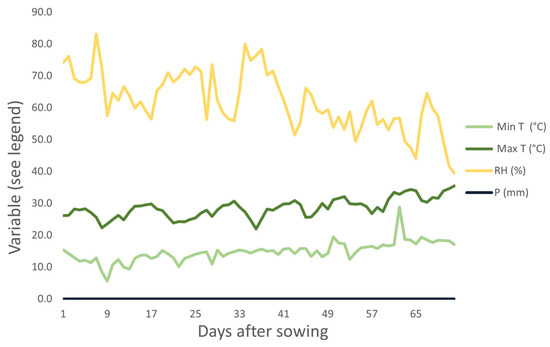
Figure 3.
Climate conditions during the execution of the experiment (August and September 2019) in Monte Carmelo, Minas Gerais, Brazil. Humidity (RH), minimum temperature (Min Temp), maximum temperature (Max Temp), and precipitation (P).
3.1. Germplasm Evaluation
The lettuce genotypes differed from one another for the vegetation indices GLI, SI, and NGRDI and the variable NL (Table 2). There were no differences in the characteristics of GM, PD, and SD.
Table 2.
Means for the data collected in the field. Green mass (GM), plant diameter (PD), stem diameter (SD), and number of leaves (NL) in the green lettuce genotypes.
NL was highlighted for the genotypes UFU BIOFORT189E8, UFU-125#1#1#1, UFU-7#1#2#1, UFU BIOFORT155E12, UFU BIOFORT189E22, UFU-197#2#1#1, UFU-199#3#1#1, UFU-206#1#1#1, UFU BIOFORT206E32, UFU BIOFORT197E34, UFU BIOFORT189E43, UFU-125#2#2#1, UFU BIOFORT189E48, UFU-040#5#5#1, and Uberlândia 10,000, the values of which were superior to those of the other genotypes and the commercial control cv. Grand Rapids (Table 2). The increase in NL, compared with that in cv. Grand Rapids, was 45.4% for UFU BIOFORT189E22, 44.9% for UFU BIOFORT189E43, and 42.35% for UFUBIOFORT197E34.
The genotypes showed different behaviors (p ≤ 0.05) among the vegetation indices SI, GLI, and NGRDI (Table 3). UFU-206#1#6#1, UFU-125#1#1#1, UFU BIOFORT120E21, UFU-197#2#1#1, UFU BIOFORT155E39, UFU BIOFORT189E48, UFU-206#1#5#1, and UFU-040#5#5#1 did not differ from genotype Uberlândia 10,000 or the commercial cultivar Grand Rapids in the vegetation index SI.
Table 3.
Means for the data obtained from image analysis. Plant diameter in software (PDS), leaf area in software (LAS), Spectral Slope Saturation Index (SI), Normalized Green Red Difference Index (NGRDI), and Green Leaf Index (GLI) of the green lettuce strains.
For GLI, the genotypes UFU BIOFORT189E8, UFU-197#3#1#1, UFU-7#1#2#1, UFU BIOFORT155E12, UFU BIOFORT189E22, UFU-199#3#1#1, UFU BIOFORT206E32, UFU BIOFORT197E34, and UFU BIOFORT189E43 were superior to the others. Regarding NGRDI, the genotypes UFU-7#1#2#1, UFU BIOFORT189E22, UFU-199#3#1#1, UFU BIOFORT206E32, UFU BIOFORT197E34, UFU-197#2#2#1, UFU BIOFORT189E43, and UFU MC BIOFORT1 showed average increments of 24%, 14.1%, 20%, 35.8%, 28.2%, 11.17%, 28.8%, and 26.47%, respectively, which were all higher than the readout for the commercial cv. Grand Rapids (Table 3).
The indices GLI and NGRDI had approximately 67% similarity in the choice of genotypes with the largest estimates of vegetative development. Both indices selected the genotypes UFU-7#1#2#1, UFU BIOFORT189E22, UFU-199#3#1#1, UFU BIOFORT206E32, UFU BIOFORT197E34, and UFU BIOFORT189E43.
3.2. Genetic Dissimilarity
The dendrogram (UPGMA) obtained by the generalized Mahalanobis distance confirmed the existence of genetic dissimilarity among the genotypes evaluated. The cophenetic correlation coefficient was 88.49%. A cut-off line was drawn at 31.23% dissimilarity, and the formation of four groups was identified (Figure 4).
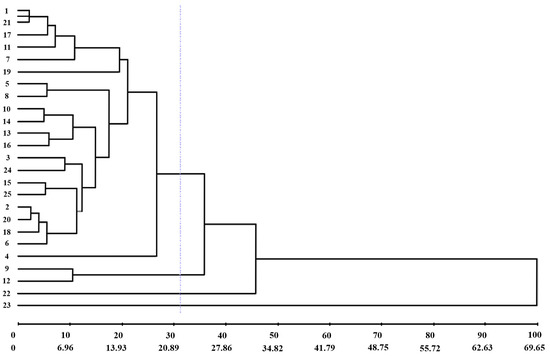
Figure 4.
UPGMA dendrogram obtained by a generalized Mahalanobis distance of 25 green lettuce genotypes. 1: UFU-206#1#6#1; 2: UFU BIOFORT189E8; 3: UFU-197#3#1#1; 4: UFU-125#1#1#1; 5: UFU-7#1#2#1; 6: UFU BIOFORT155E12; 7: UFU BIOFORT120E21; 8: UFU BIOFORT189E22; 9: UFU-197#2#1#1; 10: UFU-199#3#1#1; 11: UFU-206#1#1#1; 12: UFU BIOFORT206E32; 13: UFU BIOFORT197E34; 14: UFU-197#2#2#1; 15: UFU BIOFORT155E39; 16: UFU BIOFORT189E43; 17: UFU-206#1#4#1; 18: UFU-125#2#2#1; 19: UFU-206#1#2#1; 20: UFU BIOFORT189E48; 21: UFU-206#1#5#1; 22: UFU-040#5#5#1; 23: UFU MC BIOFORT; 24: Grand Rapids; and 25: Uberlândia 10,000. Purple line: cut-off line at 31.23% dissimilarity.
Group I consisted of 84% of the genotypes analyzed; Group II comprised the genotypes UFU-197#2#1#1 and UFU BIOFORT206E32; and Groups III and IV comprised only one genotype each, UFU-040#5#5#1 and UFU MC BIOFORT1, respectively.
3.3. Monitoring Growth Rate
The acquisition of RGB images using UAVs enabled the monitoring of the growth rate in the lettuce crop over DAT (Figure 5).
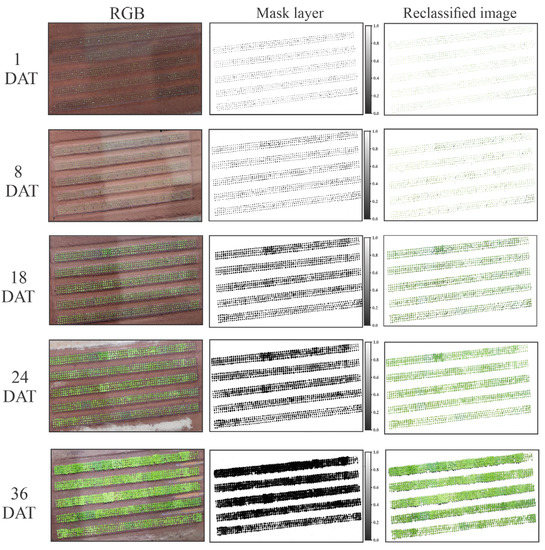
Figure 5.
RGB image, mask layer, and reclassified image of the flights obtained by UAVs during the experiment on different days after transplanting (1, 8, 18, 24, and 36 DAT).
The images were reclassified, or the soil was removed in an automated manner using the vegetation indices and the RGB image. This step was performed to obtain better reproducibility and noise reduction of the image (Figure 6). After analysis of the pixel values in the histogram obtained by the vegetation indices, the HUE index enabled the discrimination of the plant and soil, using a cut-off value of 1.5 for the formation of the mask layer.
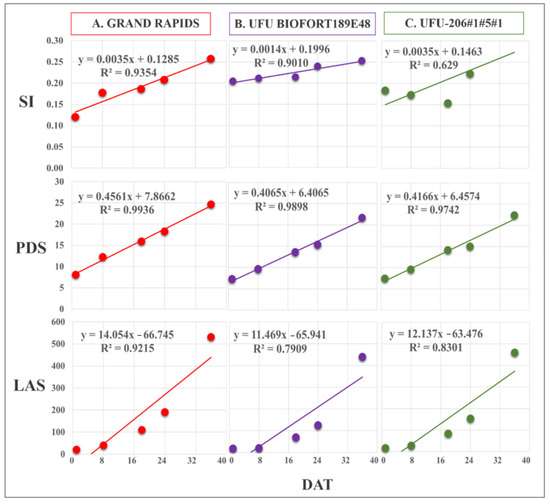
Figure 6.
Regression equations of Spectral Slope Saturation Index (SI), leaf area in software (LAS) (cm2), and plant diameter (PDS) obtained by imaging on different days after transplanting (DAT). The presented genotypes were selected based on their performance for growth rate monitoring using the vegetation index. (A) superior (Grand Rapids), (B) intermediate (UFU BIOFORT189E4), and (C) inferior (UFU-206#1#5#1).
The evaluation of the PDS and LAS extracted using the images revealed growth over the DAT. The diameter obtained by the QGIS software showed a variation among the genotypes of 5.6 to 9.21 cm in the first flight (DAT 1); 7.86 to 13 cm in the second flight; and 10.6 to 18.56 cm, 11.1 to 21.5 cm, and 11 to 24.6 cm in the third, fourth, and fifth flights, respectively. For LAS, the lowest values were observed for the first flight (DAT 1) and the highest values were found for the fifth flight (DAT 5), which varied from 6.74 cm2 to 531.8 cm2 among the genotypes.
Obtaining the LAS and PDS values from the images was efficient. The regression equations presented values of the determination coefficient (R2) between 78% and 99% for the genotypes evaluated. The vegetation indices SI, GLI, and NGRDI with the PDS and LAS values were coherent for lettuce growth rate, with an increase in the values observed over the flights for the genotypes (Figure 6, Figure 7 and Figure 8).
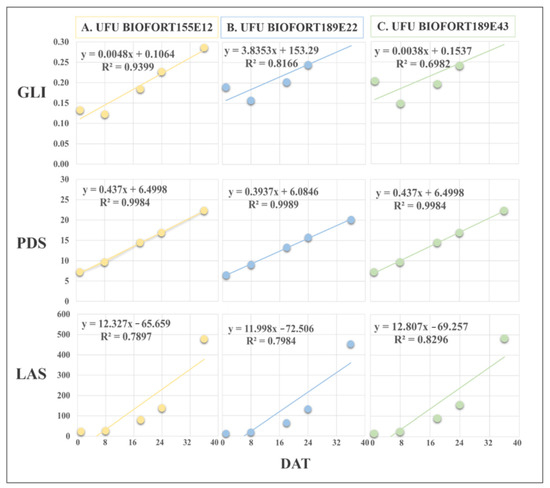
Figure 7.
Regression equations of Green Leaf Index (GLI), leaf area in software (LAS) (cm2), and plant diameter (PDS) obtained by imaging on different days after transplanting (DAT). The presented genotypes were selected based on their performance for growth rate monitoring using the vegetation index. (A) superior (UFU BIOFORT155E12), (B) intermediate (UFU BIOFORT189E22), and (C) inferior (UFU BIOFORT189E43).
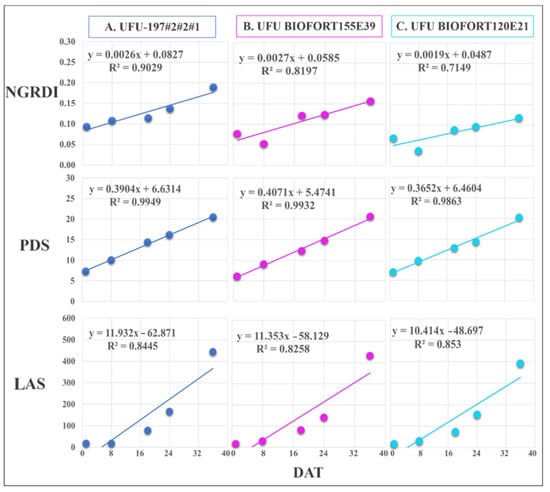
Figure 8.
Regression equations of Normalized Green Red Difference Index (NGRDI), leaf area in software (LAS) (cm2), and plant diameter (PDS) obtained by imaging on different days after transplanting (DAT). The presented genotypes were selected based on their performance for growth rate monitoring using the vegetation index. (A) superior (UFU-197#2#2#1), (B) intermediate (UFU BIOFORT155E39), and (C) inferior (UFU BIOFORT120E21).
Grand Rapids and the genotype UFUBIOFORT189E48 had good adjustments in the regression, with R2 = 93.5% and 90%, respectively. The genotype UFU-206#1#5#1 had an R2 = 62.9%, indicating that the linear regression did not explain the genotype behavior throughout its cycle (Figure 6).
GLI was efficient at determining the plant cover, along with the development and harvest point of the genotypes UFU BIOFORT155E12 (R2 = 94%) and UFU BIOFORT189E22 (R2 = 81%). The regression equation of genotype UFU BIOFORT189E43 referring to GLI had an R2 = 69.8%.
NGRDI best estimated the development of genotypes UFU BIOFORT155E39 and UFU 197#2#2#1 (R2 = 81.9% and 90.2%, respectively) in lettuce crop monitoring using RGB images. Compared with the genotypes above, UFU BIOFORT155E21 had a regression equation with an R2 = 71.4%.
3.4. Validation of the Image Phenotyping Technique
The vegetation indices showed different behaviors for the genotypes under study and enabled the analysis of each genotype individually (Figure 9).
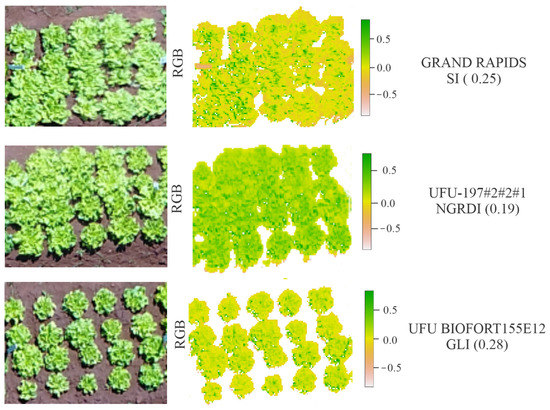
Figure 9.
Representation of the behaviors of the vegetation indices: Spectral Slope Saturation Index (SI), Normalized Green Red Difference Index (NGRDI), and Green Leaf Index (GLI) for lettuce genotypes Grand Rapids, UFU-197 #2#2#1, and UFU BIOFORT 155E12.
Commercial cv. Grand Rapids and the genotypes UFU BIOFORT189E48, UFU BIOFORT189E43, UFU BIOFORT155E39, UFU BIOFORT155E12, UFU-206#1#5#1, and UFU BIOFORT189E22 had high correlations between GM values collected in the field and LAS from image analysis (0.78, 0.81, 0.82, 0.88, 0.88, 0.99, and 1.00, respectively). A high and positive correlation was found between PDS from image analysis and PD in the field. This behavior was observed for the genotypes UFU BIOFORT155E48, UFU-206#1#5#1, UFU BIOFORT120E21, UFU BIOFORT155E43, UFU BIOFORT155E39, and UFU BIOFORT189E22 (0.83, 0.85, 0.92, 0.98, 1, and 1, respectively) (Table 4).
Table 4.
Correlations per se between data collected in the field and data obtained by imaging at 36 days after transplanting (DAT) of nine green lettuce genotypes. Plant diameter in software (PDS), leaf area in software (LAS), Spectral Slope Saturation Index (SI), Normalized Green Red Difference Index (NGRDI), Green Leaf Index (GLI), green mass (GM), plant diameter (PD), stem diameter (SD), and number of leaves (NL).
A positive correlation was found of the vegetation indices SI, GLI, and NGRDI with the variables determined in the field: GM, PD, SD, and NL. The values presented a variation of 0.55–1.0 for the genotypes UFU BIOFORT155E12, UFU BIOFORT120E21, and UFU-206#1#5#1 in relation to SI. A positive correlation was verified of GLI and NGRDI with all the characteristics analyzed in the field for the genotypes UFU BIOFORT189E22 and UFU BIOFORT155E39. Furthermore, the highest correlation values were observed in the association of these indices with GM in UFU BIOFORT189E22 (0.99 and 1.00, respectively) and UFU BIOFORT155E39 (0.99 and 0.97, respectively). This second genotype also showed the highest correlation values with NL (0.97 for NGRDI and 0.99 for GLI) (Table 4).
PDS and LAS positively correlated with GM, PP, SD, and NL. This result was observed for the genotypes UFU BIOFORT155E12, UFU BIOFORT120E21, UFU BIOFORT189E22, UFU BIOFORT189E48, and UFU-206#1#5#1. In Grand Rapids, GLI and NGRDI positively correlated with PD and SD. In addition, PDS and LAS had high correlations with GM (0.97 and 0.78, respectively) and NL (0.94 and 1.0, respectively) (Table 4).
4. Discussion
In the present study, the climate was not very favorable, as the optimal temperature for the development of the lettuce culture is approximately 18 °C [29], but despite the irregular weather conditions, the plants did not suffer alterations.
The agronomic characteristics presented in the lettuce crop could be related to climate, genetic factors, and photoperiod [30,31]. These characteristics are defined and used as tools for product selection. Lettuce with greater GM is often selected by the consumer [31].
A greater NL on the lettuce plant positively impacts its commercialization. This characteristic can be used as a parameter to define climatic adaptations of the genotypes [32]. Other studies have revealed genotypes with better performance in NL compared to the commercial cv. Grand Rapids [33,34,35]. This result highlights the efficiency of genetic improvement in the lettuce crop, generating products of higher quality than those available on the market.
Remote sensing has become a tool with the potential to assist in monitoring and decision-making regarding crops. The evaluation of plant development by images is linked to records over time [36]. Therefore, the vegetation indices are an important tool in the evaluation of the vegetative development and identification of the harvest point in the lettuce crop.
Data analysis revealed the existence of genetic variability among the characterized genotypes. This information validates the use of phenotyping using images [17,18]. Furthermore, knowing the genetic variability among genotypes is essential for the selection of the best genotypes in breeding programs [37].
Variability was identified in vegetative development among the evaluated strains. The high correlation values highlight greater reliability in the clustering generated, and the closer these values are to one, the better the representativeness and quality of the cluster [38].
Similarity in the vegetative development of the strains was observed for the GLI and NGRDI. Similar behavior of the indices that use RGB (red, blue, and green) can be explained by their having similar detection characteristics for vegetation. GLI can be used to evaluate vegetation and has a good correlation with the chlorophyll content present in plants [39,40]. NGRDI has a strong relationship with chlorophyll content at different times of crop development, in addition to presenting strong potential to estimate the biomass of vegetation [41,42]. HUE has been used in different vegetation covers to differentiate between vegetation and non-vegetation pixels [43].
The vegetation indices analyzed by means of images were expressed differently among the lettuce genotypes. This difference occurred, for instance, when there were different levels of carotenoids [17,18]. When studying wheat crops, researchers found that the NDVI values among cultivars were influenced by the phenological stages of the crop and the amount of nitrogen present in the soil [44,45].
Plant phenotyping using images is more consistent than that using the conventional phenotyping method and can be useful in breeding programs [46,47]. In a study conducted with lettuce, researchers found a correlation of 0.68 between the anthocyanin contents quantified in the laboratory and the vegetation indices CIG, CIV, GNDVI, and NDVI [17].
Research with information extracted from images has revealed high correlations between the indices and different phenotypic characteristics of some crops. In brachiaria grass, a correlation of 0.92 was observed between control (%) and NDVI values extracted using images [48]. In corn, digital images were used to evaluate crop performance [46].
Studies have shown that the measurements of the leaf area of lettuce crops are performed via the traditional approach of counting leaves and electronic meters, which may or may not be destructible [49]. However, in large plantation areas, producers face difficulties in performing this monitoring, causing significant waste and losses [7]. In this context, the evaluation of leaf area and plant diameter obtained through images becomes a fast, effective, and low-cost tool for the use of plant phenotyping. The results presented in this work suggest that the methodology of collecting information through images adequately monitors the development of lettuce plants over time.
The monitoring of leaf area in different years in other crops, such as eucalyptus, using NDVI, SRI, and SAVI revealed equations with R2 values ranging from 6.1% to 67.2% [20]. This study obtained R2 values ranging from 78% to 92% for leaf area obtained through images. This result highlights the efficiency in phenotyping by imaging in the characterization of the development of lettuce plants. Regression models were generated for the respective vegetation indices and genotypes during winter. However, it is suggested to use the methodology during another season of the year and for other lettuce segments.
The information obtained in the present work indicates that phenotyping technology using RGB images to analyze and obtain information regarding vegetation indices, leaf area, and lettuce plant diameter has great potential. These results could facilitate the monitoring of the growth rate of lettuce plants and enable the determination of their harvest point. Image phenotyping is a low-cost technology and tool using RGB sensors, which can assist in decision-making and reduce the labor and costs associated with the existing crops. Image phenotyping is also a useful tool in genetic improvement, facilitating the characterization and selection of plants.
5. Conclusions
The vegetation indices SI, GLI, and NGRDI with the PDS and LAS values were coherent for lettuce growth rate, with an increase in the values observed over the flights for each genotype.
The correlations between data collected in the field and data obtained by imaging ranged from moderate to strong. Overall, the vegetation indices SI, GLI, and NGRDI were efficient for monitoring the growth rate and determining the harvest point of different green lettuce genotypes, in attempts to reduce waste and losses.
It is suggested that the definition of the harvest point based on vegetation indices be specific for each genotype.
Author Contributions
Conceptualization, G.M.M., A.C.S.S., R.B.d.A.G. and J.M.Q.L.; methodology, A.L.A.R. and P.H.d.S.A.; software, A.L.A.R., R.B.d.A.G. and P.H.d.S.A.; validation, A.L.A.R. and P.H.d.S.A.; formal analysis, G.M.M., A.C.S.S., J.M.Q.L. and H.C.R.M.C.; investigation, A.L.A.R. and G.M.M.; resources, G.M.M., A.C.S.S., J.M.Q.L. and H.C.R.M.C.; data curation, G.M.M. and R.B.d.A.G.; writing—original draft preparation, A.L.A.R.; writing—review and editing, G.M.M., A.C.S.S., J.M.Q.L., H.C.R.M.C. and R.Y.Y.; visualization, A.C.S.S. and R.Y.Y.; supervision, G.M.M.; project administration, G.M.M.; funding acquisition, G.M.M. and A.C.S.S. All authors have read and agreed to the published version of the manuscript.
Funding
This research was funded by the Brazilian National Council for Scientific and Technological Development (CNPq) Grant No 308824/2020-2, the Minas Gerais Research Foundation (FAPEMIG), the Coordination for the Improvement of Higher Education Personnel (CAPES), and the Federal University of Uberlândia (UFU).
Institutional Review Board Statement
Not applicable.
Data Availability Statement
Not applicable.
Conflicts of Interest
The authors declare no conflict of interest.
References
- Maggio, A.; Scapolo, F.; Crekinge, T.V.; Serraj, R. Global drivers and megatrends in agri-food systems. In Agriculture & Food Systems to 2050—Global Trends, Challenges and Opportunities; Serraj, R., Pingali, P., Eds.; Food and Agriculture Organization of the United Nations: Rome, Italy; Cornell University: Ithaca, NY, USA, 2018; Volume 2, pp. 47–83. [Google Scholar] [CrossRef]
- Camara, G.R.; Busato, L.M.; Almeida, B.F.; Moraes, W.B. Elaboration and validation of diagrammatic scale for lettuce powdery mildew. Summa Phytopathol. 2018, 44, 116–121. [Google Scholar] [CrossRef]
- ABCSEM. Associação Brasileira do Comércio de Sementes e Mudas. Available online: http://www.abcsem.com.br/dados-do-setor (accessed on 20 November 2021).
- Carvalho-Filho, J.L.S.; Gomes, L.A.A.; Biguzzi, F.A.; Maluf, W.R.; Ferreira, S. F4 families of crispleaf lettuce with tolerance to early bolting and homozygous for resistance to Meloidogyne incognita race 1. Hortic. Bras. 2009, 27, 335–339. [Google Scholar] [CrossRef]
- Sala, F.C.; Costa, C.P. Retrospective and trends of Brazilian lettuce crop. Hortic. Bras. 2012, 30, 187–194. [Google Scholar] [CrossRef]
- Sediyama, M.A.N.; Pedrosa, M.W.; Salgado, L.T.; Pereira, P.C. Summer and winter performance of lettuce cultivars grown in a hydroponic system. Científica 2019, 37, 98–106. [Google Scholar] [CrossRef]
- Aliotte, J.T.B.; Filassi, M.; Oliveira, A.L.R. Characterization of fruit and vegetable distribution logistics of Campinas Supply Center/SP. Rev. Econ. Social. Rural 2022, 60, e252673. [Google Scholar] [CrossRef]
- Dhondt, S.; Wuyts, N.; Inzé, D. Cell to whole-plant phenotyping: The best is yet to come. Trends Plant Sci. 2013, 18, 428–439. [Google Scholar] [CrossRef]
- Sousa, C.A.F.; Cunha, B.A.D.B.; Martins, P.K.M.; Molinari, H.B.C.; Kobayashi, A.K.; Souza, M.T., Jr. New approach for plant phenotyping: Concepts, current tools and perspectives. Rev. Bras. Geogr. Fís. 2015, 8, 660–672. [Google Scholar] [CrossRef]
- Ponzoni, F.J.; Shimabukuro, Y.E.; Kuplich, T.M. Sensoriamento Remoto da Vegetação, 2nd ed.; Oficina de Textos: São Paulo, Brazil, 2012; 176p. [Google Scholar]
- Zhang, J.; Naik, H.S.; Assefa, T.; Sarkar, S.; Reddy, R.V.C.; Singh, A.; Ganapathysubramanian, B.; Singh, A.K. Computer vision and machine learning for robust phenotyping in genome-wide studies. Sci. Rep. 2017, 7, 44048. [Google Scholar] [CrossRef]
- Fernandez-Gallego, J.A.; Kefauver, S.C.; Gutiérrez, N.A.; Nietotaladriz, M.T.; Araus, J.L. Wheat ear counting in-field conditions: High throughput and low-cost approach using RGB images. Plant Methods 2018, 14, 22. [Google Scholar] [CrossRef]
- Makanza, R.; Zaman-Allah, M.; Cairns, J.E.; Magorokosho, C.; Tarekegne, A.; Olsen, M.; Prasanna, B.M. High-throughput phenotyping of canopy cover and senescence in maize field trials using aerial digital canopy imaging. Remote Sens. 2018, 10, 330. [Google Scholar] [CrossRef]
- Beloti, I.F.; Maciel, G.M.; Gallis, R.B.A.; Finzi, R.R.; Clemente, A.A.; Siquieroli, A.C.S.; Juliatti, F.C. Low-altitude, high-resolution aerial imaging for field crop phenotyping in Cucurbita pepo. Genet. Mol. Res. 2020, 19, 18598. [Google Scholar] [CrossRef]
- Silva, M.F.; Maciel, G.M.; Gallis, R.; Barbosa, R.L.; Carneiro, V.Q.; Rezende, W.S.; Siquieroli, A.C.S. High-throughput phenotyping by RGB and multispectral imaging analysis of genotypes in sweet corn. Hortic. Bras. 2022, 40, 92–98. [Google Scholar] [CrossRef]
- Elangovan, A.; Duc, N.T.; Raju, D.; Kumar, S.; Singh, B.; Vishwakarma, C.; Gopala Krishnan, S.; Ellur, R.K.; Dalal, M.; Swain, P.; et al. Imaging Sensor-Based High-Throughput Measurement of Biomass Using Machine Learning Models in Rice. Agriculture 2023, 13, 852. [Google Scholar] [CrossRef]
- Clemente, A.A.; Maciel, G.M.; Siquieroli, A.C.S.; Gallis, R.B.A.; Medeiros, L.M.; Duarte, J.G. High-throughput phenotyping to detect anthocyanins, chlorophylls, and carotenoids in red lettuce germplasm. Int. J. Appl. Earth Obs. Geoinf. 2021, 103, 102533. [Google Scholar] [CrossRef]
- Maciel, G.M.; Gallis, R.B.A.; Barbosa, R.L.; Pereira, L.M.; Siquieroli, A.C.S.; Peixoto, J.V.M. Image phenotyping of inbred red lettuce lines with genetic diversity regarding carotenoid levels. Int. J. Appl. Earth Obs. Geoinf. 2019, 81, 154–160. [Google Scholar] [CrossRef]
- Maciel, G.M.; Gallis, R.B.A.; Barbosa, R.L.; Pereira, L.M.; Siquieroli, A.C.S.; Peixoto, J.V.M. Image phenotyping of lettuce germplasm with genetically diverse carotenoid levels. Bragantia 2020, 79, 224–235. [Google Scholar] [CrossRef]
- Berger, R.; Silva, J.A.A.; Ferreira, R.L.C.; Candeias, A.L.B.; Rubilar, R. Vegetation indices for the leaf area index estimation in clonal plantations of Eucalyptus saligna Smith. Ciênc. Florest. 2019, 29, 885–899. [Google Scholar] [CrossRef]
- Maciel, G.M.; Siquieroli, A.C.S.; Gallis, R.B.A.; Pereira, L.M.; Sales, V.F. Programa de computador BG α Biofort. Depositor: Federal University of Uberlândia. BR512019002403-6. Deposit: 1 February 2019. Concession: 23 October 2019. Available online: https://busca.inpi.gov.br/pePI/servlet/ProgramaServletController (accessed on 10 March 2023).
- Filgueira, F.A.R. Novo Manual de Olericultura: Agrotecnologia Moderna na Produção e Comercialização de Hortaliças, 3rd ed.; Editora UFV: Viçosa, Brazil, 2013; 421p. [Google Scholar]
- R Core Team. R: A Language and Environment for Statistical Computing; R Foundation for Statistical Computing: Vienna, Austria, 2020; Available online: https://www.r-project.org/ (accessed on 20 January 2023).
- Matias, F.I.; Caraza-Harter, M.V.; Endelman, J.B. FIELDimageR: An R package to analyze orthomosaic images from agricultural field trials. Plant Phenome J. 2020, 3, e20005. [Google Scholar] [CrossRef]
- Escadafal, R.; Belghith, A.; Bem, M.H. Indices spectraux pour la télédétection de la dégradation des milieux naturels en Tunisie aride. In Proceedings of the Actes du Sixième Symposium International. Mesures Physiques et Signatures Spectrales en Télédétection, Val d’Isèr, France, 17–24 January 1994. [Google Scholar]
- Louhaichi, M.; Borman, M.M.; Johnson, D.E. Spatially located platform and aerial photography for documentation of grazing impacts on wheat. Geocarto Int. 2001, 16, 65–70. [Google Scholar] [CrossRef]
- Tucker, C. Red and Photographic Infrared Linear Combinations for Monitoring Vegetation. Remote Sens. Environ. 1979, 8, 127–150. [Google Scholar] [CrossRef]
- Cruz, C.D. Genes: A software package for analysis in experimental statistics and quantitative genetics. Acta Sci. Agron. 2013, 35, 271–276. [Google Scholar] [CrossRef]
- Fontes, P.C.R.; Nick, C. Olericultura Teoria e Prática, 2nd ed.; Editora UFV: Viçosa, Brazil, 2019; 632p. [Google Scholar]
- Queiroz, J.P.S.; Costa, A.J.M.; Neves, L.G.N.; Seabra Junior, S.; Barelli, M.A.A. Phenotypic stability of the lettuce in different periods and cropping environments. Rev. Ciênc. Agron. 2014, 45, 276–283. [Google Scholar] [CrossRef]
- Oliveira, A.C.B.; Sediyama, M.A.N.; Pedrosa, M.W.; Garcia, N.C.P.; Garcia, S.L.R. Genetic divergence and discard of variables in lettuce cultivated under hydroponic system. Acta Sci. Agron. 2003, 26, 211–217. [Google Scholar]
- Diamante, M.S.; Seabra, S., Jr.; Inagaki, A.M.; Silva, M.B.; Dallacort, R. Production and resistance to bolting of loose-leaf lettuce grown in different environments. Rev. Ciênc. Agron. 2013, 44, 133–140. [Google Scholar] [CrossRef]
- Medeiros, D.C.; Freitas, K.C.S.; Veras, F.S.; Anjos, R.S.B.; Borges, R.D.; Cavalcante, N.J.G.; Nunes, G.H.S.; Ferreira, H.A. Quality of lettuce seedlings depending on substrates with and without biofertilizer addition. Hortic. Bras. 2008, 26, 186–189. [Google Scholar] [CrossRef]
- Ferreira, L.L.; Aniceto, R.R.; Montenegro, I.N.A.; Ribeiro, T.S.; Almeida, D.G.; Porto, V.C.N. Adaptability and development of cultivars of lettuce in the Brejo microregion, Paraiba. Sci. Plena 2013, 9, 040202-1. [Google Scholar]
- Mendes, F.T.C.; Freitas, A.S.; Alcantra, E.; Marques, R.F.P.V.; Oliveira, A.S.; Barbosa, R.A.; Padua, M.C.; Junqueira, R.R. Agronomic performance of lettuce cultivars in aquaponics. Res. Soc. Dev. 2021, 10, 2525–3409. [Google Scholar] [CrossRef]
- Pandit, S.; Tsuyuki, S.; Dube, T. Estimating above-ground biomass in sub-tropical buffer zone community Forests, Nepal, using Sentinel 2 data. Remote Sens. 2018, 10, 601. [Google Scholar] [CrossRef]
- Araujo, J.C.; Telhado, S.F.P.; Sakai, R.H.; Ledo, C.A.S.; Melo, P.C.T. Univariate and multivariate procedures for agronomic evaluation of organically grown tomato cultivars. Hortic. Bras. 2016, 34, 374–380. [Google Scholar] [CrossRef][Green Version]
- Cruz, C.D.; Regazzi, A.J.; Carneiro, P.C.S. Modelos Biométricos Aplicados ao Melhoramento Genético, 3rd ed; Editora UFV: Viçosa, Brazil, 2014; 668p. [Google Scholar]
- Hunt, E.R.; Hively, W.D.; McCarty, G.W.; Daughtry, C.S.T.; Forrestal, P.J.; Kratochvil, R.J.; Carr, J.L.; Allen, N.F.; Fox-Rabinovitz, J.R.; Miller, C.D. NIR-Green-Blue high-resolution digital images for assessment of winter cover crop biomass. GIsci. Remote Sens. 2011, 48, 86–98. [Google Scholar] [CrossRef]
- Ballesteros, R.; Ortega, J.F.; Hernandez, D.; Campo, A.D.; Moreno, M.A. Combined use of agro-climatic and very high-resolution remote sensing information for crop monitoring. Int. J. Appl. Earth Obs. Geoinf. 2018, 72, 66–75. [Google Scholar] [CrossRef]
- Hunt, E.R.; Cavigelli, M.; Daughtry, C.S.T.; McMurtrey, J.E., III; Walthall, C.L. Evaluation of digital photography from model aircraft for remote sensing of crop biomass and nitrogen status. Precis. Agric. 2005, 6, 359–378. [Google Scholar] [CrossRef]
- Poley, L.G.; Mcdermid, G.J. A systematic review of the factors influencing the estimation of vegetation aboveground biomass using unmanned aerial systems. Remote Sens. 2020, 12, 1052. [Google Scholar] [CrossRef]
- Beniaich, A.; Silva, M.L.N.; Avalos, F.A.P.; Menezes, M.D.; Cândido, B.M. Determination of vegetation cover index under different soil management systems of cover plants by using an unmanned aerial vehicle with an onboard digital photographic camera. Semin. Ciênc. Agrár. 2019, 40, 49–66. [Google Scholar] [CrossRef]
- Reznick, J.P.K.; Pauletti, V.; Barth, G. Field estimate with NDVI of grain yield and quality of wheat flour. Rev. Bras. Eng. Agríc. Ambient. 2021, 25, 801–806. [Google Scholar] [CrossRef]
- Rissini, A.L.L.; Kawakami, J.; Genu, A.M. Normalized difference vegetation index and yield of wheat cultivars under different application rates of nitrogen. Rev. Bras. Ciênc. Solo 2015, 39, 1703–1713. [Google Scholar] [CrossRef]
- Makanza, R.; Zaman-allah, M.; Cairns, J.E.; Eyre, J.; Burgueno, J.; Pacheco, A.; Diepenbrock, C.; Magorokossho, C.; Terekegne, A.; Olsen, M.; et al. High-throughput method for ear phenotyping and kernel weight estimation in maize using ear digital imaging. Plant Methods 2018, 14, 49. [Google Scholar] [CrossRef]
- Walter, A.; Liebisch, F.; Hund, A. Plant phenotyping: From bean weighing to image analysis. Plant Methods 2015, 11, 14. [Google Scholar] [CrossRef]
- Alvarenga, C.B.; Mundim, G.S.M.; Santos, E.A.; Gallis, R.B.A.; Zampiroli, R.; Rinaldi, P.C.N.; Prado, J.R. Normalized difference vegetation index for desiccation evaluation with glyphosate + 2,4-D in magnetized spray solution. Braz. J. Biol. 2023, 83, e246579. [Google Scholar] [CrossRef]
- Zuffo, A.M.; Juffo Júnior, J.M.; Silva, L.M.A.; Silva, R.L.; Menezes, K.O. Growth analysis in lettuce cultivars in southern Piauí. Rev. Ceres 2016, 63, 145–153. [Google Scholar] [CrossRef]


Disclaimer/Publisher’s Note: The statements, opinions and data contained in all publications are solely those of the individual author(s) and contributor(s) and not of MDPI and/or the editor(s). MDPI and/or the editor(s) disclaim responsibility for any injury to people or property resulting from any ideas, methods, instructions or products referred to in the content. |
© 2023 by the authors. Licensee MDPI, Basel, Switzerland. This article is an open access article distributed under the terms and conditions of the Creative Commons Attribution (CC BY) license (https://creativecommons.org/licenses/by/4.0/).