Abstract
The scientific evaluation of the development of rural industrial integration is of great significance to understanding the changes occurring in the industrial structure of China’s agricultural sector. Combined with the practical problems related to the development of China’s rural industrial integration on the basis of four dimensions, i.e., agricultural industrial chain extension, agricultural multifunctionality, agricultural service industry integration development and the economic effect of rural industrial integration, the level of China’s rural industrial integration development is calculated for the period from 2008 to 2020 by means of the entropy method, and its spatial–temporal evolution characteristics and the regional heterogeneity of its driving factors are discussed on the basis of kernel density estimation, hotspot analysis and a fixed effect panel data model. The results showed the following: (1) From 2008 to 2020, the level of rural industrial integration development in 31 provinces in China improved to varying degrees. The growth rate of agricultural service industry integration was the highest, while the economic effect of rural industrial integration was second; the growth rate of the agricultural industrial chain extension was the lowest, and agricultural multifunctionality exhibited a fluctuating upward trend, peaking in 2017. In terms of spatial distribution, the representative provinces and cities with high and low levels of each dimension were different. (2) Rural industrial integration development in China was characterized by a regional imbalance, with polarization in the central and western regions. In terms of spatial distribution, an “east–middle–west” ladder pattern was obvious. The hotspots were mainly concentrated in the southeast region, and they showed a gradually expanding trend, while the coldspots were mainly concentrated in the northwest region, and they showed a trend of gradually decreasing size. (3) In terms of driving factors, the urbanization level, rural human capital, rural transportation facilities, rural ecological environment, intensity of financial support for agriculture and rural digitalization had significantly positive effects, while the degree of industrial upgrade had a significantly negative effect. Each driving factor had different effects on the rural industrial integration development in the eastern, central and western regions.
1. Introduction
Rural industrial integration refers to the intensive allocation of capital, technology and resource elements across borders with respect to agriculture through industrial linkage, industrial agglomeration, technological penetration, institutional innovation and by other means, which causes the primary, secondary and tertiary industries in rural areas to become closely connected, which allows them to achieve coordinated development and ultimately achieve the extension of the agricultural industrial chain, the expansion of the industrial scope and an increase in farmers’ income [1]. As a result of China’s long-term dual economy, the rural development process is faced with the problem of “five modernizations“, namely the rapid nonagricultural transformation of agricultural production factors [2], the rapid aging and weakening of rural social subjects [3], the increasing “waste“ of village construction land [4], the serious pollution of rural water and soil environments [5] and the deep poverty of rural poor areas [6], which restrict the sustainable development of rural areas. In 2020, the average consumption level of rural residents, corresponding to a population of more than 500 million, was CNY 13,713, which was approximately half that of urban residents. The proportion of basic consumption, as measured by food, clothing and housing, was 59.46%, while the proportion of service-oriented consumption was only 37.85%. The consumption structure is still at a low level. The huge rural market is not fully developed. Rural industrial integration, through the integration, optimization and reorganization of resources, elements, technology and market demand, constantly affects all aspects of the agricultural system and is an important starting point for comprehensively promoting the consumption of urban and rural residents and promoting rural revitalization, especially industrial prosperity [7]. In 2015, the No.1 Central Document of the Central Government first proposed that rural industrial integration is an inevitable requirement for accelerating the transformation of the agricultural development mode and exploring the path of agricultural modernization in the Chinese context. In line with the No.1 Central Document of the Central Government from 2016 to 2021, work deployment has adhered to the theme of rural industrial integration. It can be seen that rural industrial integration has become an important strategic choice for solving China’s “three rural” problems at this stage, and it is also an area of research interest in the field of rural economies. Thus, it is relevant to ask how the development of rural industrial integration in China is progressing? What are the characteristics of its spatial–temporal evolution? What is the relationship between regions? What are the drivers? Thinking about and performing empirical research on the above issues could not only enable us to observe the change trends in the process of rural industrial integration development but could also provide a basis for the impact mechanism of rural industrial integration development and thus provide a new perspective for understanding changes in the agricultural industrial structure of contemporary China.
2. Literature Review and Theoretical Framework
2.1. Literature Review
Rural industrial integration originated from the concept of industrial integration. In the 1960s, Rosenberg pointed out that the conditions necessary for industrial integration were the wide application and diffusion of technology in more industries [8]. Some scholars regarded industrial integration as a dynamic process, which was divided into three stages: early, mid and late stages, which further improves the conceptual clarity of industrial integration in a high-tech environment [9]. Nishimitsu Nimura, a Japanese scholar, first applied the concept of industrial integration to solving the problem of agricultural and rural development and put forward the concept of “six industries”, that is, agricultural production extends to the secondary and tertiary industries and thus forms a complete agricultural value industry chain in which production, processing, sales and services are integrated [10]. As rural industrial integration has increasingly become an effective means of solving the problem of sustainable agricultural development, Chinese scholars have also begun to explore practical application of this theory in China to promote rural industrial integration. Scholars have taken Gudianzi Town, Jilin City [11], Hebi Agricultural Silicon Valley [12] and Fujian Anxi Tea Manor [13] as examples to analyze the main current rural industrial integration development model and have found that the integration effect is constrained by factors such as the system, factors, social and economic development level. With the advancement of rural industrial integration, rural communities have demonstrated a pattern of commercial and residential combinations. Taking rural areas in Zhejiang Province as an example, Zhu explored how these mixed-use communities realize the sustainable development of the economy, society and environment [14]. In order to continuously promote the development of new industries, new formats and new models in rural areas, the Chinese government has successively issued a series of policy documents, such as the Notice of the Ministry of Agriculture and Rural Affairs on the Implementation of the Action to Promote the Integration of Primary, Secondary and Tertiary Industries in Rural Areas; the National Strategic Plan for Promoting Agriculture by Quality (2018–2022); and so on, which regard rural industrial integration as an important means of alleviating rural decline and boosting rural industries. In recent years, big data, the Internet of Things, blockchain, cloud computing and other technologies have undergone accelerated development. The digital economy has effectively expanded the potential boundaries for the integration of rural industries with respect to their access to resources, elements and markets [15]. Feng compared three cases—the “one after another” integration mode in Cheng County, Gansu Province; the “Internet plus agriculture” integration mode in Pingli County, Shaanxi Province; and the “cultural creativity + agriculture” integration mode in Ruyang County, Henan Province—and found that although the latter was established relatively late, it achieved a good agricultural value addition [16]. Under the lens of social innovation, she took the region of Tomé-Açu in Eastern Amazon, Brazil, as an example and analyzed the cooperative mechanism for a locally based agro-industrial complex that added value to agricultural production [17]. At the same time, due to differences in resource endowment, location conditions, production capacity, etc., some scholars have proposed that different regions should explore rural industrial integration differently and develop characteristic industries, which have resulted in “one village, one product” and homogeneity being avoided [18].
Secondly, as the development of the rural industrial integration has relatively rich connotations, its measurement is often carried out on the basis of multiple indicators. With respect to the type of rural industrial integration, Chen described an evaluation index system for rural industrial integration consisting of four integration modes: industrial extension, technology penetration, function expansion and organizational innovation [19]. On the basis of the relationships between primary, secondary and tertiary industries, Yu constructed a rural industrial integration development index consisting of four types: industrial restructuring, industrial extension, industrial intersection and industrial penetration [20]. On the basis of the strategic plan for agricultural industry integration issued by the central government, Zhang took agricultural internal integration, agricultural industry chain extension, agricultural multifunctionality expansion, industrial technology penetration and the interest linkage mechanism as indicators for the characterization of rural industry integration development [21]. In addition, relevant research and evaluation criteria also include the province [22], city [23] and county [24]. Finally, scholars have verified the effect of rural industrial integration on income at the micro and macro levels. From a micro perspective, Yang found that participation in rural industrial integration had a poverty-reduction effect on the income dimension of farmers [25]. Political post, residential land ownership, farmland ownership, age and employment satisfaction were shown to be the main factors affecting the participation of local farmers in rural industrial land changes [26]. Further, other scholars evaluated the role of rural heterogeneity in promoting farmers’ income in the process of rural industrial integration [27]. Specifically, the extension of the agricultural industrial chain and supporting services for rural industrial development significantly improved the income level of farmers in underdeveloped areas [28]. The establishment of e-commerce platforms in rural areas will have spillover effects and will increase rural income through the “digital dividend”, with the marginal income effects maximizing in poor villages [29]. From a macro perspective, Wang used system-generalized moment estimation and a fixed effect model to empirically analyze the positive impact of rural industrial integration on farmers’ income and regional heterogeneity [30]. In view of the internal mechanism of rural industrial integration in narrowing the urban–rural income gap, Li analyzed it from the perspective of rural economic growth and urbanization using an intermediary effect model [31]. In addition, some scholars have also reported that rural industrial integration indirectly promotes urban and rural residents’ consumption via the mechanism of narrowing the urban–rural income gap [32].
It can be easily understood from the existing literature that there is a rich body of currently available research results regarding the qualitative and quantitative analysis of rural industrial integration, which helps to clarify the current situation of China’s rural industrial integration development and the inter-relation with rural economic development, as well as laying a solid foundation for the gradual improvement in the agricultural multisubject interest linkage mechanism and policy guarantee system. However, even so, there are still shortcomings in the existing research, mainly reflected in the following aspects: First, the academic community has not yet formed a set of recognized and complete indicator systems that are able to reflect the level of rural industrial integration and development. Existing measurement indicator systems for rural industrial integration are mainly built around different types of integration models and are not able to quantify the economic effects of rural industrial integration. Second, the current situation of rural industrial integration development is not fully understood. Relevant research is mainly based on the comprehensive level of rural industrial integration development, without comprehensive consideration of the time series characteristics and spatial patterns of the integration model and the effects of integration in each region. Third, few scholars have analyzed the mechanisms driving rural industrial integration. The effect of rural industrial integration on income has been verified many times, but this kind of research immediately presents a “prescription” and lacks a “pharmacological” analysis. The deep-seated reasons affecting the development of rural industrial integration in various regions need to be further explored.
In view of the shortcomings of the existing literature, in this paper, we intend to expand the existing research on rural industrial integration in four different dimensions. The potential contributions are as follows: First, China’s ultimate goal in promoting rural industrial integration is to broaden the potential channels for employment and increased income among farmers, narrow the gap between urban and rural areas and achieve common prosperity. Therefore, on the basis of the existing indicator systems, the economic effect of rural industrial integration is incorporated in the construction of an evaluation indicator system developed against the background of achieving common prosperity. Second, we scientifically portray the evolution trend of the rural industrial integration mode and effect in different regions with respect to their temporal and spatial dimensions. Third, we systematically analyze the distribution dynamics, regional differences and spatial differences in China’s rural industrial integration development in order to address the shortcoming represented by the many static studies and the insufficiency of dynamic analysis. Fourth, we identify and investigate the driving factors of rural industrial integration development and explore the possible regional heterogeneity of the driving factors, so as to identify the important focus of promoting rural industrial integration development in the next stage for each region.
2.2. Theoretical Framework
The specific logic of rural industrial integration is shown in Figure 1. The driving force for the extension of the agricultural industrial chain is the change in market demand. With the increasing living standards of urban and rural residents, agricultural producers and processors have higher requirements in terms of both the quantity and quality of agricultural products. In order to meet market demand, more and more complex specialized production departments, such as breeding, rough processing and deep processing, are inserted between initial production and final consumption [33]. The division of labor in the agricultural industrial chain is more refined, which increases the level of intermediate products of agricultural products. The original industrial chain is divided into agriculture-related industries, while the auxiliary industries serving agriculture, forestry, animal husbandry and fishery are also growing rapidly, which is reflected in the continuous extension of the agricultural industrial chain.
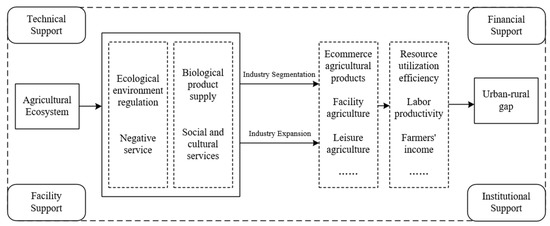
Figure 1.
Theoretical framework of rural industrial integration.
Agricultural multifunctionality is the basis of rural industrial integration. The agricultural ecosystem provides society with a supply of biological products and ecological environmental regulation services through natural factors such as soil, light, water, biology and artificial inputs such as labor and capital. At the same time, it also produces “negative” services, such as soil erosion caused by the application of pesticides and fertilizers [34]. A prominent feature of agriculture is seasonality. During the slack season, labor, capital, land and other production factors are idle. New industries, such as leisure agriculture and facility agriculture generated by the integration of agriculture and other industries fully activate idle production factors and improve the efficiency of resource utilization in rural areas.
The development of the agricultural service industry assists in the development of rural industrial integration. China’s dual-structure urban–rural system has triggered the continuous one-way flow of production factors such as capital, land and labor from rural to urban areas, which has led to rural areas facing practical difficulties such as weak infrastructure, low levels of informatization and a poor financing environment, and has hindered the integration of agriculture and secondary and tertiary industries [35]. By providing financial support and technical support in each link of the vertical extension of the industrial chain and the horizontal expansion of agricultural functions, the agricultural service industry has derived innovative agriculture-related products [36] and has thus created a good external environment and public services for rural industrial integration and promoted the high-quality and efficient development of rural industrial integration.
The goal of rural industrial integration is to achieve common prosperity. Common prosperity is a prominent feature of the Chinese path to modernization. Although China has rid itself of absolute poverty, relative poverty still exists [37,38]. Under the basic law that the division of labor promotes individual production efficiency and thus improved productivity, rural industrial integration takes agriculture as a unified subject to participate in the division of labor with other industries and absorbs the achievements of relevant subindustries that have been highly developed in the secondary and tertiary industries so as to improve the added value and competitiveness of agriculture; this has provided dividends to farmers in the agricultural industrial value chain in the countryside and has thus narrowed the urban–rural gap and achieved common prosperity.
3. Materials and Methods
3.1. Evaluation System of Rural Industrial Integration
Building a reasonable indicator system is an important basis for effectively measuring the development level of China’s rural industrial integration. The existing research provides a relatively rich selection of indicators for rural industrial integration. On the basis of an existing theoretical framework, this paper constructs an evaluation system for assessing rural industrial integration development with respect to the following four dimensions: agricultural industrial chain extension, agricultural multifunctionality, integrated development of agricultural services and economic effect of rural industrial integration, mainly following the principles of scientificity, particularity, accessibility and comparability.
3.2. Assigning Weights to the Indicators
In order to be able to reliably determine the level of rural industrial integration development, in this study, the entropy value method (EVM) was used to determine the weight of each indicator (Table 1). The entropy method is based on the “difference-driven” principle, which highlights local differences and is used to obtain the optimal weight from the actual data of each sample, which reflects the utility value of the indicator information entropy value and avoids artificial influence factors, so the given indicator weight is more objective, which thus gives it higher reproducibility and credibility [39,40]. In the process of determining the weight of the indicators, the entropy method depends on the discreteness of the data themself [41] and also deals with the information overlap of multiple indicators [42]. The greater the difference between the best solution and the worst solution of an index in the index layer, the greater the degree of variation and the smaller the entropy value, which indicates that the more useful the information provided by the index, the greater the weight. Conversely, the greater the entropy value of the index, the smaller the weight. The descriptive statistical analysis results of each indicator are shown in Table 2. Due to space limitation, the weight calculation formula and process are not shown.

Table 1.
Evaluation index system of rural industrial integration development.
Table 2.
Descriptive statistical results of indicators.
3.3. Kernel Density Function Approach
In order to clarify the distribution dynamics and evolution laws of China’s rural industrial integration development, the kernel density function approach was used to analyze the distribution location, distribution trend and distribution extension of rural industrial integration development. The distribution location reflects the level of rural industrial integration development. The distribution trend reflects the spatial difference and polarization trend of rural industrial integration development [43]. The distribution extension reflects the spatial difference between the region with the highest level of rural industrial integration development and other regions in the study area [44].
For the independent and evenly distributed sample data, X1, X2, ……, Xn, the form of the kernel density estimation is
where h is the bandwidth, n is the number of observations, i represents each province and xi represents independent identically distributed observations.
3.4. Hotspot Analysis
In order to describe the spatial differentiation of rural industrial integration development in China, this study used a hotspot analysis to explore the local spatial clustering distribution characteristics of rural industrial integration and measured the clustering relationship between each unit and its surrounding units [45]. The research identified the spatial distribution of the hotspots and coldspots of China’s rural industrial integration development by measuring Getis–Ord, . The calculation formula is
where is the agglomeration index of spatial unit i and Z is the significance of the agglomeration index. When is significantly positive, this indicates that the score around unit i is relatively high and belongs to a hotspot area; conversely, when it is significantly negative, it indicates a coldspot area.
3.5. Data Source
In this paper, 31 provinces (cities, districts) in China were selected as the study area, with a time span ranging from 2008 to 2020. Hong Kong, Macao and Taiwan were not included in the sample due to a lack of data. The missing data for some years were supplemented through linear interpolation. Table 3 shows the data sources of each indicator in detail.
Table 3.
Data sources of evaluation index system.
4. Results and Analysis
4.1. Temporal Characteristics of Rural Industrial Integration
On the basis of the statistical data of various evaluation indicators of 31 provinces (cities and autonomous regions) in China from 2008 to 2020, the weighted sum of each indicator was used to obtain a comprehensive score for the rural industrial integration development status. Due to space limitations, the data are only listed for some years (Table A1). In 2008 and 2020, the average values of the rural industrial integration development index were 0.1564 and 0.3293, respectively, with an average annual growth rate of 8.51%, and the growth rate was fast. The standard deviations were 0.0450 and 0.0905, respectively, and the absolute difference widened by 101.1%. The coefficients of variation were 0.2876 and 0.2748, respectively, and the relative gap was reduced by 4.45%, indicating that the comprehensive scores of the rural industrial integration of 31 provinces in China improved to varying degrees during the study period, but the situation of a large regional gap still existed.
A multidimensional evaluation line chart of China’s rural industrial integration development from 2008 to 2020 was drawn on the basis of the four dimensions in the constructed evaluation index system (Figure 2). The scores of the four dimensions of rural industrial integration development showed an increasing trend of fluctuation to varying degrees. The extension of the agricultural industrial chain demonstrated the smallest increase with an increment of 0.0215. A possible reason for this is that agriculture has not yet expanded to the large-scale division of labor and cooperation with the developed subindustries in secondary and tertiary industries. Therefore, the extension of the industrial chain was relatively short, and the contribution rate to rural industrial integration was low. The integrated development of the agricultural service industry was in the leading position with an increment of 0.0797. This growth rate was the highest. The development of the agricultural service industry is able to solve problems related to the slow diffusion of advanced technology and the low efficiency of agricultural public services and can provide good policy and institutional environments to promote the prosperity of rural industries. The economic effect of rural industrial integration was in second place with an increment of 0.0406. The integration of rural industries promotes a diversified development of the rural economy, creates more employment opportunities, broadens the channels for farmers to increase income and narrows the urban–rural income gap. The dimension of agricultural multifunctionality exhibited a fluctuating upward trend with an increment of 0.0311, and it reached a peak in 2017, which indicates that further efforts are needed in the future to take agricultural multifunctionality into consideration in order to realize economic transformation, create new agricultural formats and develop new points of economic growth in rural areas.
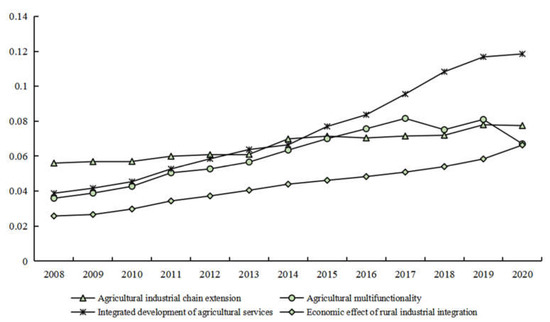
Figure 2.
Evaluation on four dimensions of rural industrial integration.
4.2. Spatial Pattern of Rural Industrial Integration
To explore the evolution of the spatial pattern of China’s rural industrial integration development, in this paper, the evaluation results in 2008 and 2020 were selected, and ArcGIS10.2 was used to produce a map visualization (Figure 3). According to the natural breakpoint grading method (Jenks), the rural industrial integration development index was classified into four grades: lower-level areas, low-level areas, high-level areas and higher-level areas. In 2008, Chongqing, Guizhou, Tibet and six other provinces were considered lower-level regions, accounting for 19.4% of all provinces. Shanxi, Neimenggu, Jilin and 10 other provinces were low-level regions, accounting for 32.3% of the total provinces. Tianjin, Shanghai, Anhui and eleven other provinces were high-level regions, accounting for 35.4% of all provinces. Beijing, Jiangsu, Zhejiang and four other provinces were higher-level regions, accounting for 12.9% of all provinces. In total, 17 provincial rural industrial integration development indexes were lower than the national average. In 2020, four provinces, including Shanxi, Neimenggu and Guizhou were considered lower-level regions, accounting for 12.9% of all provinces. Liaoning, Heilongjiang, Jilin and ten other provinces were low-level regions, accounting for 32.3% of the total number of provinces. Hebei, Shanghai, Anhui and 12 other provinces were high-level regions, accounting for 38.7% of all provinces. Jiangsu, Zhejiang, Shandong and five other provinces were higher-level regions, accounting for 16.1% of all provinces. A total of 18 provincial rural industrial integration development indexes were lower than the national average. From 2008 to 2020, the number and spatial distribution showed considerable change. Areas with a high rural industrial integration development index gradually moved to the southeast, while areas with a low rural industrial integration development index gradually moved to the northwest. The “east–middle–west” ladder pattern was obvious.
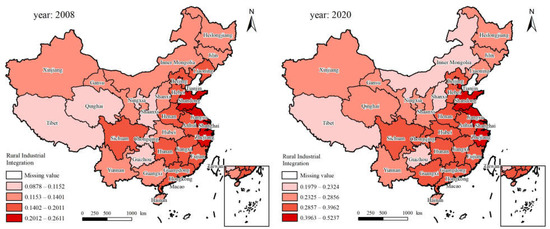
Figure 3.
The spatial distribution of rural industrial integration.
Based on ArcGIS software, the initial and final years of the study period were selected to further depict the spatial evolutionary characteristics for the four dimensions.
- 1)
- Dimension of agricultural industrial chain extension (Figure 4): During the study period, the scores of Liaoning, Zhejiang and Gansu showed a downward trend, while the scores of the other provinces showed an upward trend to varying degrees. Shanghai and Shandong were always at a high level, which was mainly distributed in the eastern region. In 2020, the scores of the agricultural industrial chain extension in these two provinces were 0.1922 and 0.1299, respectively, which were greater than 0.1000, indicating that the agricultural industrial chain extension capacity had achieved remarkable results. Shanghai and Shandong were early implementers of agricultural industrialization, and the integration model of production, supply and marketing driven by leading enterprises continues to this day, leading other provinces in China. Shanxi, Neimenggu, Chongqing, Qinghai and Xinjiang were at the low level.
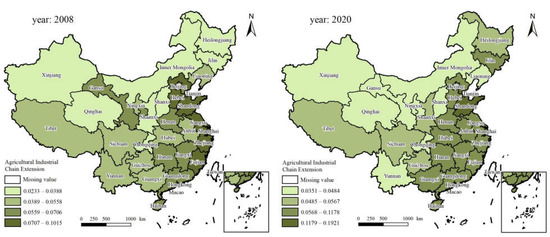 Figure 4. The spatial distribution of agricultural industrial chain extension.
 - 2)
- Dimension of agricultural multifunctionality (Figure 5): During the study period, the scores of Hainan showed a downward trend, while the scores of the other provinces showed an upward trend to varying degrees. In 2008, Beijing, Tianjin, Chongqing and 12 other provinces were categorized as belonging to high-level or higher-level regions, which were mainly distributed in the southeast and southwest. In 2020, the number of provinces and their spatial distribution showed great changes with respect to 2008. The number of provinces considered to belong to high-level and higher-level areas decreased to seven. High-value clusters gradually formed in the Yangtze River Delta, while the high-value areas in the southwest continued to shrink. It is worth noting that Tianjin steadily improved its capacity for agricultural multifunctionality, leaping from a high level in 2008 to a higher level in 2020. The agricultural business model newly implemented in Fujian, Henan, Hunan and Guangdong has not yet achieved economic transformation, leading to the low level of agricultural multifunctionality.
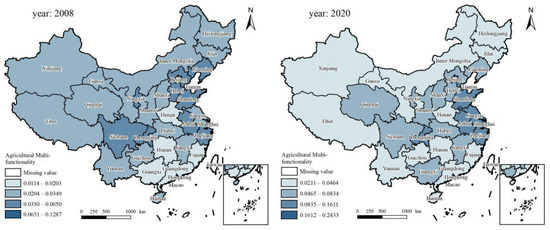 Figure 5. The spatial distribution of agricultural multifunctionality.
 - 3)
- Dimension of the integrated development of agricultural services (Figure 6): During the study period, each province made steady progress, and their scores increased to varying degrees. The provinces belonging to the higher level changed between the initial stage (Jiangsu, Zhejiang, Shandong, Guangdong and Sichuan) and the final stage (Jiangsu, Zhejiang and Shandong). Jiangsu, Zhejiang and Shandong belong to the Yangtze River coastal economic zone where the tertiary industry is highly developed, and it lays a good foundation for the integrated development of agricultural services. Tibet has always belonged to the lower level. As provinces relying on traditional agriculture and animal husbandry, their agricultural loan investment, agricultural technology investment and rural fixed asset investment are relatively low, leading to the low integrated development of agricultural services.
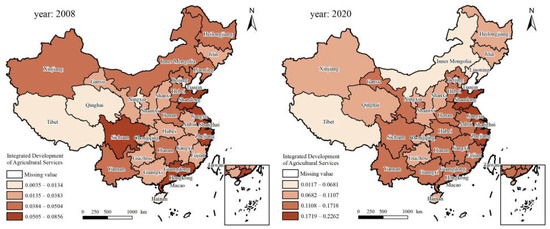 Figure 6. The spatial distribution of integrated development of agricultural services.
 - 4)
- Dimension of the economic effect of rural industrial integration (Figure 7): The economic effect of rural industrial integration in all provinces showed a steady and positive trend. The economic effect of rural industrial integration in Heilongjiang, Zhejiang and Fujian were at a higher level, with scores of 0.0900, 0.1083 and 0.0947, respectively, in 2020. Among them, the per capita net operating income of rural residents in Heilongjiang ranked the highest in China. The urban–rural income ratio and the urban–rural consumption ratio were 1.9245 and 1.6502, respectively. The urban–rural gap was small. The agricultural labor productivities of Zhejiang and Fujian were CNY 10.6798 million and CNY 8.7672 million, respectively, which were the highest values in China. Guizhou, Shaanxi, Gansu, Yunnan and Tibet belonged to the lower level. The urban–rural income gap was nearly triple, and the agricultural labor productivity was low, leading to these five provinces belonging to the lower level.
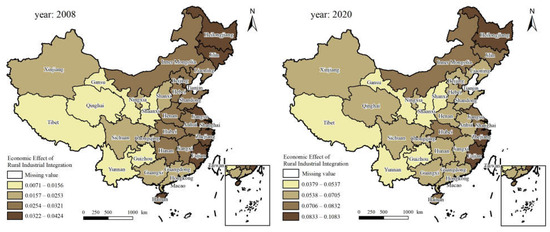 Figure 7. The spatial distribution of economic effect of rural industrial integration.
4.3. Dynamic Evolutionary Characteristics of Rural Industrial Integration
In order to explore the overall distribution and change trend of rural industrial integration development in different regions and periods of time in China, this paper drew a kernel density function chart of rural industrial integration in the whole country and the eastern, central and western regions between 2008 and 2020, as shown in Figure 8. Figure 8a depicts the nationwide distribution dynamics of the rural industrial integration. From the movement of the wave crest, the main peak of the distribution curve of the rural industrial integration continued to move to the right, indicating that the development level of the national rural industrial integration continued to improve. The height of the main peak underwent a rising-first-and-then-falling change process, and the width increased continuously, indicating that the regional imbalance of rural industrial integration in China was increasing. The existence of tailing and the increase in the width of the tailing indicated that the gap between the high-level and low-level regions in the development of rural industrial integration in China widened.
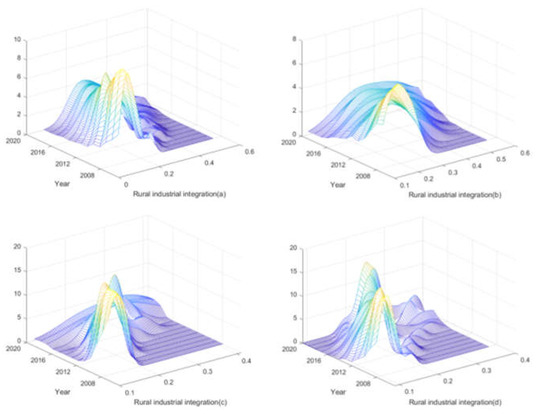
Figure 8.
Kernel density estimation of rural industrial integration.
Figure 8b–d show the distribution dynamics of rural industrial integration development in the eastern, central and western regions. From the distribution location, the main peaks of the kernel density curve in the eastern, central and western regions moved to the right, indicating that the level of rural industrial integration development in the eastern, central and western regions was constantly improving. With respect to extensibility, there was a tailing phenomenon in the eastern, central and western regions, which indicates that the regional disparity between the high-level regions and low-level regions was widening. Specifically, the height of the main peak in the eastern region decreased, and the width of the peak increased, indicating that the overall difference in the development of rural industrial integration in the eastern region was expanding. The peak height in the central region rose first and then decreased. The width continued to increase, and the double peak gradually disappeared, indicating that the polarization phenomena in the central region was weakened but the internal difference was expanding. The peak height in the western region underwent a rising–falling–rising process, and the width increased continuously, gradually forming a double peak distribution trend, indicating that the differences in the rural industrial integration development within the region increased and that the phenomenon of polarization was serious. In conclusion, the level of rural industrial integration development in the eastern, central and western regions constantly improved but the internal differences gradually increased. There were polarization phenomena in the central and western regions, while the polarization phenomena in the central region was not obvious, and there were generally no strong polarization phenomena nationwide.
4.4. Spatial Differentiation Characteristics of Rural Industrial Integration
In order to further study the spatial differentiation characteristics of China’s rural industrial integration development, ArcGIS software was used to calculate the Moran’s I index of the overall rural industrial integration development in 2008 and 2020, and we obtained values of 0.3225 and 0.3375, respectively. These positive values both passed the significance test with a confidence of 1%, indicating that there was an obvious spatial agglomeration between similar observations of China’s rural industrial integration development index. The Moran’s I index showed an increasing trend, indicating that the spatial heterogeneity of China’s rural industrial integration decreased during the study period. With respect to regional differences in the overall spatial heterogeneity, local spatial differences may have expanded [46].
In order to comprehensively reflect the change trend of regional differences, in this paper, we explored whether there was an autocorrelation relationship between local research units in adjacent spaces in China’s rural industrial integration. The scores of the Getis–Ord Gi* of China’s rural industrial integration development index were calculated, and they were layered in order from high to low according to the natural breakpoint grading method (Jenks) in order to generate a distribution map of rural industrial integration development coldspots and hotspots (Figure 9). Through a comparative analysis, the following conclusions can be drawn: (1) In 2008, the hotspots of China’s rural industrial integration development were found in seven provinces, which included Jiangsu, Zhejiang and Shanghai; the coldspots were contained in eight provinces that included Guizhou, Yunnan and Sichuan. (2) In 2020, the number of hotspots in China’s rural industrial integration development had decreased to six, with Shandong decreasing. The number of coldspots had decreased to seven, with Guizhou and Yunnan decreasing and Heilongjiang increasing. In general, between 2008 and 2020, there was a significant change in China’s rural industrial integration development coldspots and hotspots, showing a trend of spatial pattern evolution from low hotspots to high hotspots. The hotspots were mainly concentrated in the southeast coastal areas of China. It can be inferred that while a province is located within a hotspot area, the rural industrial integration development index of the surrounding areas will also be high. The coldspot area in the northwest gradually decreased in size. However, the rural industrial integration development indexes of the provinces in the coldspot area were not improved through the driving effect of the nearby areas.
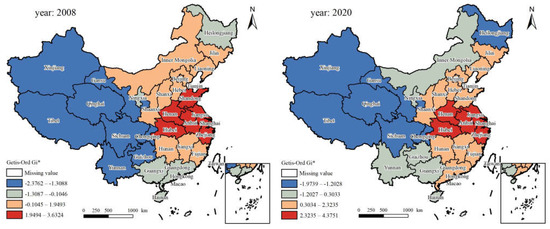
Figure 9.
The hotspots and coldspots distribution of rural industrial integration.
5. Analysis of the Driving Factors
5.1. Selection of Variables
The above analysis showed that the rural industrial integration development exhibited significant spatial differences. It was necessary to analyze its driving mechanism to provide inspiration for proposing optimization strategies. By referring to the existing research [47,48,49,50,51,52] and combining it with the actual situation, representative influencing factors of rural industrial integration development were selected, namely the urbanization level, rural human capital, rural transportation facilities, rural ecological environment, intensity of fiscal support for agriculture, degree of industrial upgrading and rural digitalization (Table 4).
Table 4.
Driving factors of rural industrial integration development.
In this study, a panel data model was used to explore the socioeconomic factors affecting the rural industrial integration development. Stationarity tests on the data were conducted using four methods: LLC, IPS, ADF-Fisher and PP-Fisher. The data consisted of a stationary series following testing using at least two methods. The results showed that there were both nonstationary and stationary series among the variables, and the original series could not be regressed at this time. In order to eliminate the influence of time factors on the variables, a unit root test was carried out after taking the logarithms of all of the variables. It was found that seven variables, such as lnRID and lnURB, constituted the stationary series (Table 5).
Table 5.
Panel data stability test results.
The measurement model was set as follows:
where i refers to the region; t refers to the time; Cons is a constant term; β1, β2, β3, …β7 are the regression coefficients; and εit is a random error term.
Furthermore, a fixed effect model and a random effect model were used to regress the sequence, and the Hausman test showed that the fixed effect model was superior to the random effect model. The regression of the panel data using the fixed effect model was dependent on assumptions such as there being no heteroscedasticity and no autocorrelation; otherwise, the estimation results would be biased. The results of the modified Wald test for heteroscedasticity, the Woolridge test for autocorrelation and the Friedman test for contemporaneous correlation rejected the original assumptions that “the variances of disturbance terms in different sections are equal“, “there is no autocorrelation“ and “there is no contemporaneous correlation“, respectively; that is, the panel data model exhibited heteroscedasticity, autocorrelation and contemporaneous correlation. In line with the existing research [53], this study used a clustering robust standard error to correct the standard deviation of the ordinary least squares model regression, and the estimation results are shown in Table 6.
Table 6.
Regression results of driving factors.
5.2. Total Regression Analysis
Specifically, the elastic coefficient of the urbanization level to rural industrial integration development was 0.8265, which was significant at the 1% level, indicating that urbanization development is the foundation of rural industrial integration development. On the one hand, the rapid development of urbanization will accelerate the transfer of the rural surplus labor force, increase nonagricultural income, promote increased consumption levels in rural areas, change the consumption structure of rural residents, constantly increase consumption demand, create a multiplier effect with investment and promote the improvement in rural infrastructure and public service facilities. On the other hand, urbanization brings advanced technology to agricultural production, improves the level of agricultural mechanization, promotes the formation of family farms and greatly improves the agricultural production efficiency, and thus realizes the economies of scale. The elastic coefficient of rural transportation facilities for rural industrial integration development was 0.4055, which was significant at the level of 5%. An expressway is a bridge and link connecting surrounding cities and rural central towns that is characterized by an excellent road quality and high transport efficiency, and it effectively counterbalances the shortcomings of agricultural products that are difficult to store and promotes the formation of circulation markets and Taobao villages for agricultural products; thus, expressways have a significant positive impact on rural industrial integration development. The elastic coefficient of the rural ecological environment to the rural industrial integration development was 0.1351, which was significant at the 5% level, which indicates that rural ecological resources have been transformed into ecological capital in the process of rural industrial integration. The capitalization of ecological resources follows the evolutionary path of “ecological resources–ecological assets–ecological capital“ [54], and the transition from its natural attribute to its economic attribute occurs due to the process of mining, developing and utilizing the diversified functions of agriculture, which transforms the rural ecological environment as a “public good“ into a tradable “market product“. Therefore, rural ecological capitalization is an effective means for promoting rural industrial integration development. The elastic coefficient of the intensity of the fiscal support for agriculture on rural industrial integration development was 0.2788, which was significant at the 1% level, which indicated that in the process of achieving rural industrial integration development, it is necessary not only to rely on the decisive role of the “invisible hand“ of the market in resource allocation but also to effectively harness the role played by the “visible hand“ of the government in terms of macrocontrol. In addition, in the process of implementing a combined policy of fiscal support for agriculture (including productive and nonproductive expenditures), the government, on the one hand, has strengthened the input of productive expenditures in order to improve agricultural production conditions while, on the other hand, it has strengthened the management of nonproductive expenditures to prevent “capital rent seeking“ behavior, which ultimately led to policy distortion at the expense of farmers’ interests. The elastic coefficient of rural digitalization for rural industrial integration development was 0.1792, which was significant at the 1% level. The impact of rural digitalization on rural industrial integration was mainly reflected in the reduction in costs related to information exchange and the optimal allocation of resources [55]. On the one hand, rural digitalization improves the timeliness and accuracy of information exchange in the upstream, middle and downstream parts of the agricultural industry chain, thereby breaking regional barriers and achieving a smooth cycle of production, supply and marketing. On the other hand, the penetration and wide application of modern digital technology in traditional agriculture has resulted in the intelligent control of the whole process of agricultural production, processing and marketing, which has resulted in the achievement of effective resource allocation and thus improved land productivity, labor productivity and agricultural management efficiency, and ultimately promoted the deep integration of agriculture as well as secondary and tertiary industries.
5.3. Regional Regression Analysis
Furthermore, in order to identify the driving factors in different regions in more detail and to subsequently formulate targeted policies for rural industrial integration development, in this paper, China was divided into eastern, central and western regions according to the standards of the NBS. The level of urbanization had a positive impact on rural industrial integration development in Eastern, Central and Western China, passing the significance test at the 5% and 10% levels, respectively. The elasticity coefficient was greater in the central region than in the eastern region and the western region. In 2020, the urbanization rates in the east, middle and west were 71.65%, 61.57% and 56.16%, respectively. This shows that the impact of the urbanization level on rural industrial integration displayed an inverted “U” shape. The rapid development of urbanization has led to the occupation of a large number of cultivated land resources, which, coupled with the lagging effect of technology promotion, has slowed the transformation of the agricultural industry from extensive operations to large-scale and intensive operations. Therefore, the role of urbanization in promoting rural industrial integration has been weakened. Rural human capital had a positive impact on rural industrial integration development in Eastern China, as it was significant at the 5% level. In 2020, the per capita lengths of schooling of rural residents in the eastern, central and western regions were 8.33 years, 8.06 years and 7.19 years, respectively. With continuous improvements in education, workers are often able to engage in agricultural services such as post- and telecommunications, transportation, epidemic prevention, insurance and publicity, which significantly impact rural industrial integration. Rural transportation facilities had a positive impact on rural industrial integration development in the eastern, central and western regions, passing the significance test at the 5% and 10% levels, respectively. The elasticity coefficient was greater in the eastern region than in the central and western regions. The eastern region belongs to the coastal economic zone, which has an insurmountable geographical advantage in the process of industrial agglomeration and factor inflow, which causes rural transportation facilities to have the greatest impact on rural industrial integration development. This effect decreases, in turn, due to the large-scale loss of industries and factors in the central and western regions. The intensity of fiscal support for agriculture had a positive impact on rural industrial integration development in the western region, as it was significant at the 1% level. The level of rural industrial integration development was relatively high in the eastern and central regions, and the marginal effect of further fiscal support improving the level of rural industrial integration development showed a decreasing trend, which also indicated that the “fiscal dependence“ of rural industrial integration development in the western region was greater than that in the eastern and central regions. The degree of industrial upgrade had a negative impact on rural industrial integration development in the eastern and central regions, and it passed the significance test at the 10% and 5% levels, respectively. This reflects the gradual expansion of the marginal productivity gap between industries and the decreasing adaptability of the rural labor force to industry, which are not conducive to the integration of agriculture and secondary and tertiary industries. Rural digitalization had a positive impact on rural industrial integration in the central region, and it passed the significance test at the 5% level. The rural digitalization level in the eastern region was high, but the elasticity coefficient was not significant, indicating the presence of a high-level trap in the process of promoting rural industrial integration. Research has shown that the effect of promoting rural digitalization on rural industrial integration exhibits a human capital threshold effect [51]. The level of rural human capital in the western region had not yet crossed the threshold, leading to rural digitalization having no significant impact on rural industrial integration.
6. Discussion
On the basis of the practical problems faced by China’s rural industrial integration development, in this paper, the development level of China’s rural industrial integration was calculated in 31 provinces between 2008 and 2020 by employing the entropy method with respect to the following four dimensions: agricultural industrial chain extension, agricultural multifunctionality, integrated development of agricultural services and the economic effect of rural industrial integration. By means of kernel density, a hotspot analysis and a fixed effect panel data model, the spatial–temporal evolutionary characteristics and driving factors of rural industrial integration development were analyzed. We found that during the study period, the comprehensive scores of rural industrial integration in 31 provinces in China were improved to varying degrees and the regional imbalance increased, which is consistent with the research results of Yu [20]. The increase in the integrated development of agricultural services was the greatest, followed by the economic effect of rural industrial integration. The increase in the agricultural industrial chain extension was the smallest, while agricultural multifunctionality exhibited a fluctuating upward trend, peaking in 2017. Rural industrial integration expanded the scale of production and operation and broadened the sources of farmers’ income. At the same time, attention should also be paid to non-point-source pollution in agriculture caused by the application of pesticides and fertilizers in the process of large-scale production, thus exacerbating the deterioration of the ecological environment [56]. Natural capital, land capital and labor capital are all factors of economic production [57]. Especially in poor parts of China, the advantages of good ecological resources have not been fully utilized in the process of traditional industrialization. These unique ecological advantages present an important opportunity to transition their agricultural ecological function towards an economic function. Although studies have verified that market intervention in rural resource allocation has improved agricultural production efficiency and farmers’ income level [58], it cannot be ignored that in reality, the rural ecological environment is noncompetitive and nonexclusive so as to avoid the over-exploitation of resources, which would lead to a “tragedy of commons”. Therefore, in order to realize the sustainable development of agriculture, the government should strengthen its supervision of the performance of order contracts in various integration models [59]. Secondly, the level of rural industrial integration displayed an obvious spatial agglomeration phenomenon. The hotspot area in the southeast gradually expanded, and the coldspot area in the northwest gradually decreased in size. The “east–middle–west” ladder pattern was obvious, which is consistent with the research results of Chen [19]. Rural industrial integration has a spatial spillover effect. Therefore, in hotspots, rural industrial clusters were formed by strengthening factor diffusion and the siphoning of external resources. The coldspot area was a gathering area characterized by the rural industrial integration of a low level with a slow growth rate. The coldspot area generated an obvious negative transmission effect in space, making it difficult to achieve improvement in its level of rural industrial integration development in the short term by relying solely on its own development.
This paper also explored the driving mechanism of regional differences in rural industrial integration by identifying and investigating the influencing factors and sources of possible regional heterogeneity. Urbanization had a negative effect on labor force and land elements in the agricultural production system but a positive effect on technical elements [47,60]. Attention has paid to the positive and negative effects of the process of urbanization on elements, whereby it is not allowed to occupy agricultural production resources, which would reduce the basic conditions of agricultural production. It is necessary to make up for the lack of land resources by improving the level of mechanical technology, which would enhance the positive impact of urbanization on rural industrial integration. Human capital can be divided into primitive labor, consisting of pure physical strength and human capital, which includes labor skills. The latter is the decisive factor of economic growth [48]. Workers with an education at the secondary level have greater professional knowledge of the operation of machinery, sanitation and epidemic prevention; are the backup force for the development of new entities in agricultural operation; and play a greater role in driving rural industrial integration. Reductions in transportation costs have improved the degree of trade freedom between regions [61] and promoted rural industrial integration, which is consistent with the research results of Zhang [21]. However, the impact of this on the rural industrial integration development of specific regions is dependent on the role played by the region in industrial agglomeration or diffusion; that is, industrial inflow or industrial outflow. The degree of industrial upgrade inhibited rural industrial integration, which contradicted Zhang’s research results [52]. A possible reason for this is that the scale returns and marginal output of labor in secondary and tertiary industries were higher than those in the agricultural sector, which thus inevitably led to the transfer of surplus labor in the agricultural sector to the secondary and tertiary industries, so as to seek a higher marginal output [62]. However, with the intelligent promotion of industry, as well as the service industry, the technological progress promoted the transformation and upgrade of secondary and tertiary industries, and the “substitution effect“ with respect to skilled labor became increasingly obvious, which hindered the free flow of the labor force among industries, which was not conducive to the integration of agriculture and secondary and tertiary industries. There was a high-level trap in the positive impact of rural digitalization on rural industrial integration, which is consistent with Wang’s research results [63]. Since Steven Roach reported that the use of computers on a massive scale does not impact economic performance [64], the “paradox of information technology productivity” has caused widespread debate in the academic community. Due to the threshold effect of information technology investment, it remains to be studied whether there is a “productivity paradox” between rural digitalization and rural industrial integration.
This study has the following shortcomings: First, as the basic unit of national governance, the county seat is the junction between urban and rural areas and holds an important position as the link between the former and the latter. It is also the market of origin for agricultural products. It has a certain industrial and commercial foundation, which provides excellent conditions for the integration of rural industries. However, due to the lack of county-level data related to the relevant indicators, the research scale used in this paper remained at the provincial level. In the future, theoretical and empirical research on rural industrial integration could be expanded on the basis of county-level data. Second, the development of rural industrial integration is affected by many factors, such as regional resource endowment, the economic development level, policy systems, etc. In the future, the deep reasons for regional differences in rural industrial integration development could be explored in combination with the particularities of China’s agricultural production and functional positioning or pilot and nonpilot areas without sticking to the division on the basis of geographical location into eastern, central and western regions.
7. Conclusions and Suggestions
In this study, it was found that the level of rural industrial integration in China was uneven between regions. The representative provinces and cities selected exhibited differences with respect to agricultural industrial chain extension, agricultural multifunctionality, integrated development of agricultural services and economic effect of rural industrial integration. However, similar values of the rural industrial integration development index in China showed an obvious spatial agglomeration. Areas with a high level of rural industrial integration gradually moved to the southeast, forming hotspots; areas with a low level of rural industrial integration gradually moved to the northwest, forming coldspots. As a result of the comprehensive effects of different external factors such as urbanization level, rural human capital, rural transportation facilities, rural ecological environment, intensity of fiscal support for agriculture, degree of industrial upgrade and rural digitalization, a significant degree of spatial heterogeneity was found in terms of rural industrial integration between the eastern, central and western regions.
On the basis of the above research conclusions, in this paper, we propose the following policy recommendations. First, the local government should select a development model that is suitable for local rural industrial integration depending on the local conditions and rationally promote the implementation of a rural industrial integration development policy corresponding to this classification. For areas with a higher level of rural industrial integration development, the government is encouraged to focus on “awards“, which would allow them to appropriately reduce administrative intervention and guide the transformation of rural industrial integration in an ecological and digital direction. For areas with a high level of rural industrial integration and development, government support should focus on “refinement“, adjusting existing policies to “develop strengths and avoid weaknesses“, considering the positive externalities of higher-level areas and improving the effect of radiative driving mechanisms. For areas with a low level of rural industrial integration development, it is suggested to focus on “stability“ and to consolidate the integrated operation mode of production, supply and marketing in the agricultural industrial chain. For areas with a lower level of rural industrial integration development, it is necessary to prioritize “help“ and the provision of fiscal assistance. At the same time, attention should be paid to weighing the support reasonably to avoid the development of “fiscal dependence“ as a result of excessive support. Secondly, the government should strengthen the top-level design by combining it with an understanding of the driving factors of rural industrial integration development and optimizing the existing rural industrial integration system and mechanism, which would further adjust the existing agricultural policies and guarantee the development of rural industrial integration. For example, the government can promote the equalization of basic public services in the process of new urbanization; form a modern rural characteristic education system with vocational and technical education and training as the core; improve the rural transportation infrastructure network; strengthen coordination in regional highway construction; improve subsidies for environmentally friendly agricultural materials; introduce the concept of a garden design in the process of ecological environmental governance; develop adaptive agriculture; optimize fiscal expenditure in support of agriculture; establish a financing model for rural industrial integration development led by the government and participated in by all sectors of society; accelerate the construction of digital infrastructure, such as 5G base stations, in rural industrial clusters; and build a digital network in rural areas, thus promoting the deep integration of agriculture with secondary and tertiary industries. Finally, measures should be taken to regulate and guide the production behavior of new agricultural operation subjects. As the main body of rural economic development, new agricultural operation subjects such as family farms, professional cooperatives and agricultural enterprises play an important role in promoting rural industrial integration. Therefore, universities and research institutions can unite in carrying out various forms of training lectures for new agricultural operation subjects; improve the level of professional knowledge, digital thinking and ecological environmental awareness; cultivate a group of new professional farmers in knowledge and skills; and continuously optimize the structure of agricultural practitioners.
Author Contributions
Conceptualization, R.W. and W.L.; methodology, J.S.; software, D.H.; validation, R.W., J.S. and D.H.; formal analysis, R.W.; investigation, J.S.; resources, W.L.; data curation, W.L.; writing—original draft preparation, R.W.; writing—review and editing, W.L.; visualization, D.H.; supervision, J.S.; project administration, R.W.; funding acquisition, W.L. All authors have read and agreed to the published version of the manuscript.
Funding
This research was funded by the China Postdoctoral Science Foundation (2021M692655), the Research Funds of Northwest A&F University (Z1090220194), the Social Science Foundation of Ministry of Education (21YJC630086) and the Social Science Foundation of Shaanxi Province (2022R036).
Institutional Review Board Statement
Not applicable.
Informed Consent Statement
Not applicable.
Data Availability Statement
Not applicable.
Acknowledgments
We would like to thank MDPI for editing this paper. We would like to thank Liu Wenxin for his valuable suggestions for revising this academic paper. We also appreciate the constructive suggestions and comments on the manuscript from the reviewer(s) and editor(s).
Conflicts of Interest
The authors declare no conflict of interest.
Appendix A
Table A1.
Rural industrial integration score in China from 2008 to 2020.
Table A1.
Rural industrial integration score in China from 2008 to 2020.
| Region | 2008 | 2010 | 2012 | 2014 | 2016 | 2018 | 2020 |
|---|---|---|---|---|---|---|---|
| Beijing | 0.2473 | 0.3356 | 0.3814 | 0.4298 | 0.4098 | 0.4168 | 0.5007 |
| Tianjin | 0.1646 | 0.2026 | 0.2562 | 0.3435 | 0.4495 | 0.4446 | 0.4587 |
| Hebei | 0.2011 | 0.2147 | 0.2465 | 0.2937 | 0.3172 | 0.3546 | 0.3891 |
| Shanxi | 0.1202 | 0.1440 | 0.1691 | 0.1850 | 0.2585 | 0.2200 | 0.2266 |
| Inner Mongolia | 0.1283 | 0.1284 | 0.1516 | 0.1861 | 0.2052 | 0.2145 | 0.2226 |
| Liaoning | 0.1932 | 0.2212 | 0.2758 | 0.3448 | 0.3339 | 0.2948 | 0.2600 |
| Jilin | 0.1243 | 0.1507 | 0.1780 | 0.2201 | 0.2432 | 0.2679 | 0.2724 |
| Heilongjiang | 0.1304 | 0.1398 | 0.1672 | 0.2003 | 0.2178 | 0.2532 | 0.2645 |
| Shanghai | 0.1894 | 0.1955 | 0.2174 | 0.2517 | 0.2772 | 0.2974 | 0.3257 |
| Jiangsu | 0.2391 | 0.2634 | 0.3422 | 0.4108 | 0.4858 | 0.5223 | 0.5238 |
| Zhejiang | 0.2611 | 0.3020 | 0.4152 | 0.3671 | 0.3919 | 0.4922 | 0.5133 |
| Anhui | 0.1595 | 0.1834 | 0.2279 | 0.2861 | 0.3246 | 0.4005 | 0.3963 |
| Fujian | 0.1688 | 0.2017 | 0.2436 | 0.2818 | 0.3091 | 0.3513 | 0.3750 |
| Jiangxi | 0.1570 | 0.1755 | 0.2048 | 0.2160 | 0.2540 | 0.3305 | 0.3515 |
| Shandong | 0.2469 | 0.2889 | 0.3363 | 0.3843 | 0.4532 | 0.4652 | 0.4961 |
| Henan | 0.1608 | 0.1644 | 0.2024 | 0.2406 | 0.2719 | 0.3300 | 0.3419 |
| Hubei | 0.1397 | 0.1475 | 0.1777 | 0.2327 | 0.2640 | 0.3241 | 0.3510 |
| Hunan | 0.1534 | 0.1701 | 0.1942 | 0.2328 | 0.2809 | 0.3416 | 0.3635 |
| Guangdong | 0.1812 | 0.1683 | 0.2038 | 0.2305 | 0.2427 | 0.2777 | 0.3213 |
| Guangxi | 0.1277 | 0.1326 | 0.1547 | 0.1783 | 0.2140 | 0.2765 | 0.3284 |
| Hainan | 0.1389 | 0.1536 | 0.1917 | 0.1704 | 0.2207 | 0.2574 | 0.2857 |
| Chongqing | 0.1081 | 0.1262 | 0.1565 | 0.2194 | 0.2795 | 0.3376 | 0.3158 |
| Sichuan | 0.1770 | 0.1915 | 0.2345 | 0.2917 | 0.3532 | 0.3296 | 0.3534 |
| Guizhou | 0.1117 | 0.1173 | 0.1313 | 0.1446 | 0.1788 | 0.2126 | 0.2325 |
| Yunnan | 0.1349 | 0.1470 | 0.1676 | 0.1882 | 0.2066 | 0.2404 | 0.2616 |
| Tibet | 0.0878 | 0.0966 | 0.1094 | 0.1247 | 0.1610 | 0.1693 | 0.1979 |
| Shaanxi | 0.1153 | 0.1313 | 0.1552 | 0.1913 | 0.2325 | 0.2449 | 0.2751 |
| Gansu | 0.1402 | 0.1416 | 0.1577 | 0.1875 | 0.2053 | 0.2489 | 0.2604 |
| Qinghai | 0.0990 | 0.1149 | 0.1268 | 0.1567 | 0.1750 | 0.2155 | 0.2437 |
| Ningxia | 0.1142 | 0.1222 | 0.1389 | 0.1789 | 0.1890 | 0.2287 | 0.2524 |
| Xinjiang | 0.1260 | 0.1446 | 0.1670 | 0.1843 | 0.2113 | 0.2267 | 0.2475 |
References
- Su, Y.Q.; You, Y.T.; Wang, Z.G. Convergence Development of Primary, Secondary and Tertiary Industries: Theoretical Discussion, Situation Analysis and Suggestions. China Soft Sci. 2016, 308, 17–28. [Google Scholar]
- Yang, Y.; Liu, Y.S.; Long, H.L. The study on non-agricultural transformation co-evolution characteristics of “population-land-industry”: Case study of the Bohai Rim in China. Geogr. Res. 2015, 34, 475–486. [Google Scholar]
- Liu, Y.S. Research on the urban-rural integration and rural revitalization in the new era in China. Acta Geogr. Sin. 2018, 4, 637–650. [Google Scholar]
- Wang, Y.; Li, G.B. Research on the mechanism of rural spatial involution in the transition period. City Plan. Rev. 2022, 46, 69–76. [Google Scholar]
- Wang, Y.S.; Liu, Y.S. Pollution and restructuring strategies of rural ecological environment in China. Prog. Geogr. 2018, 37, 710–717. [Google Scholar]
- Liu, Y.S.; Li, J.T. Geographic detection and optimizing decision of the differentiation mechanism of rural poverty in China. Acta Geogr. Sin. 2017, 72, 161–173. [Google Scholar]
- Jiang, C.Y. A New Solution to the New Problem—Promoting the Integration and Development of Rural Primary, Secondary and Tertiary Industries. China Dev. Obs. 2015, 122, 18–22. [Google Scholar]
- Rosenberg, N. Technological change in the machine tool industry, 1840–1910. J. Econ. Hist. 1963, 23, 414–443. [Google Scholar]
- Sick, N.; Preschitschek, N.; Leker, J.; Broring, S. A new framework to access industry convergence in high technology environments. Technovation 2019, 84–85, 48–58. [Google Scholar] [CrossRef]
- Yan, J. The Development of Japan’s Sixth Industrialization and Its Implications for Rural Revitalization in China. J. Huazhong Agric. Univ. 2021, 155, 128–137. [Google Scholar]
- Liu, H.Y. A case study on Convergence Development of Primary, Secondary and Tertiary Industries. Econ. Rev. J. 2016, 371, 88–91. [Google Scholar]
- Guo, J.; Zhang, X.R.; Kong, X.Z. The Convergence of Primary, Secondary and Tertiary Industries and Farmers’ Income Generation: One Case study of Convergence of Primary, Secondary and Tertiary Industries in Rural Areas of Henan Province. Issues Agric. Econ. 2019, 471, 135–144. [Google Scholar]
- Lei, P.; Zhou, L. Research on the Development of New Industries, New Formats and New Models in Rural areas: Based on the Survey of Industrial Integration of Anxi Tea Plantation in Fujian. Fujian Trib. 2020, 335, 172–181. [Google Scholar]
- Zhu, X.; Zhang, Z.; Chen, X.; Jia, F.; Chai, Y. Nexus of Mixed-Use Vitality, Carbon Emissions and Sustainability of Mixed-use Rural Communities: The Case of Zhejiang. J. Clean. Prod. 2022, 330, 129766. [Google Scholar] [CrossRef]
- Jiang, C.Y. Developing Digital Economy to Drive the Agricultural Transformation and Rural Industrial Integration. Econ. Rev. J. 2022, 441, 41–49. [Google Scholar]
- Feng, H.X.; Wang, X.L. Research on the Development Mechanism of Rural Industry Convergence Based on the Theory of Six-sector Economy: Based on Microdata and Case Analysis of New Type of Agricultural Business Entities. Issue Agric. Econ. 2020, 9, 64–76. [Google Scholar]
- Futemma, C.; Castro, F.D.; Brondízio, E.S. Farmers and Social Innovations in Rural Development: Collaborative Arrangements in Eastern Brazilian Amazon. Land Use Policy 2020, 99, 104999. [Google Scholar] [CrossRef]
- Chen, X.Y.; Cheng, C.M. The Route of Three Industries Integration under the Strategy of Rural Revitalization: Logical Inevitability and Emprical Judge. Issue Agric. Econ. 2018, 11, 91–100. [Google Scholar]
- Chen, C.B.; Li, S.; Tian, Y. Statistical Evaluation on the Integrated Development Level of Rural Industries. Stat. Decis. 2021, 21, 164–169. [Google Scholar]
- Yu, T. An Evaluation and Analysis of the Integrated Development of Rural Primary, Secondary and Tertiary Industry. Macroeconomics 2020, 11, 76–85. [Google Scholar]
- Zhang, H.; Wu, D. The Impact of Transport Infrastructure on Rural Industrial Integration: Spatial Spillover Effects and Spatio-Temporal Heterogeneity. Land 2022, 11, 1116. [Google Scholar] [CrossRef]
- Zhang, Y.H.; Chen, Z.; Xiao, F.; Zhao, X.J.; Xiao, G.X. Research on the Measurement and Spatial Differentiation of Hunan Rural Industrial Integration Development Level under the Background of High-quality Development. Econ. Geogr. 2022, 12, 1–15. [Google Scholar] [CrossRef]
- Li, Z.; Wang, Y.J.; Hu, Z.Q. Construction and Evaluation about Convergence of Primary, Secondary and Tertiary Industries—A case study in Beijing. Chin. J. Agric. Resour. Reg. Plan. 2019, 40, 111–120. [Google Scholar]
- Zhang, L.; Luo, X.Y.; Wang, X.Y. Integrated Development of Rural Industries in Counties and the Quality of the Farmers’ Life: Empirical evidence from thirty-seven districts and counties in Chongqing. J. Macro-Qual. Res. 2021, 9, 100–113. [Google Scholar]
- Yang, G.Y.; Zhou, C.C. Impact of Rural Industry Convergence on Multidimensional Poverty of Rural Households—Based on Empirical Investigations in Honghe Prefecture of Yunnan Province. Stat. Decis. 2021, 37, 9–15. [Google Scholar]
- Xu, M.Y.; Zhang, Z.F. Farmers’ knowledge, attitude, and practice of rural industrial land changes and their influencing factors: Evidences from the Beijing-Tianjin-Hebei region, China. J. Rural Stud. 2021, 86, 440–451. [Google Scholar] [CrossRef]
- Qi, W.H.; Li, J.J.; Cao, J.M.; Teng, C. Research on the Mechanism and Path of Rural Industry Integration to Improve Farmers’ Income—A New Perspective Based on Rural Heterogeneity. J. Agrotech. Econ. 2021, 8, 105–118. [Google Scholar]
- Zhu, G.L.; Hong, M.Y. Impact of rural industry convergence on rural household income in underdeveloped regions of Tibet. J. Arid Land Resour. Environ. 2021, 1, 14–20. [Google Scholar]
- Peng, C.; Ma, B.; Zhang, C. Poverty alleviation through e-commerce: Village involvement and demonstration policies in rural China. J. Integr. Agric. 2021, 20, 998–1011. [Google Scholar] [CrossRef]
- Wang, L.N.; Li, Y.S. The Impact of Integrated Development of the Primary, Secondary and Tertiary Industries in Rural Areas on Farmers’ Income and Its Regional Heterogeneity. Reform 2019, 12, 104–114. [Google Scholar]
- Li, X.L.; Ran, G.H. How does the rural industrial convergence development affect the urban-rural income gap?—Based on the Dual Perspective of Rural Economic Growth and Urbanization. J. Agrotech. Econ. 2019, 8, 17–28. [Google Scholar]
- Ge, J.H.; Wang, M.; Tang, Y.M. Rural Industrial Integration, Consumption of Urban and Rural Residents and Urban-Rural Income Gap: Can Both Efficency and Fairness Be Achieved? Chin. Rural. Econ. 2022, 3, 50–66. [Google Scholar]
- Cheng, H.; Lu, F.J.; Xie, L.J. Connotation, Evolution and Development Direction of Agricultural Industry Chain Organization in China. Issues Agric. Econ. 2019, 480, 118–128. [Google Scholar]
- Huang, J.; Ma, B.Y.; Li, S.C. Agricultural multi-functionality and land use management in metropolitan areas: A framework and a case study. Geogr. Res. 2019, 38, 1791–1806. [Google Scholar]
- Jiang, C.Y. Thoughts on Developing Agricultural Productive Service Industry. Issues Agric. Econ. 2016, 37, 8–15. [Google Scholar]
- Li, J.; Guo, M.R. Innovation and Development of Agricultural Service Industry in the Internet Environment. J. South China Agric. Univ. 2018, 17, 11–21. [Google Scholar]
- Li, J.C.; Yu, W. Discussion on Statistical Monitoring and Evaluation of Common Prosperity. Stat. Res. 2022, 39, 3–17. [Google Scholar]
- Liu, P.L.; Qian, T.; Huang, X.H.; Dong, X.B. The connotation, Realization Path and Measurement Method of Common Prosperity for All. J. Manag. World 2021, 37, 117–129. [Google Scholar]
- Shan, L.H.; Zhong, H.; Xu, M.M.; An, X.Y. Comparative Study of Different Weighting Methods in Hospital’s Science and Technology Evaluation Based on the Chinese Hospitals’ Science and Technology Evaluation Metrics. Sci. Technol. Manag. Res. 2022, 42, 70–74. [Google Scholar]
- Li, G.; Li, J.P.; Sun, X.L.; Zhao, M. Research on a Combined Method of Subjective-Objective Weighing and the Its Rationality. Manag. Rev. 2017, 12, 17–26+61. [Google Scholar]
- Liao, W.M.; Yu, J.J.; Yuan, R.L. Coupling synergy between poverty alleviation and rural revitalization: A comparison between poverty alleviation counties (cities) based on different time series. China Popul. Resour. Environ. 2020, 30, 132–142. [Google Scholar]
- Sun, L.J.; Xing, X.J.; Zhou, D.Q. Improvement of Entropy Weighting Method. Stat. Decis. 2010, 321, 153–154. [Google Scholar]
- Chen, M.H.; Liu, H.J.; Sun, Y.N. Research on the Spatial Differences and Distributional Dynamic Evolution of Financial Development of Five Megalopolises from 2003 to 2013 in China. J. Quant. Technol. Econ. 2016, 7, 130–144. [Google Scholar]
- Quah, D. Galton’s Fallacy and Tests of the Convergence Hypothesis. Scand. J. Econ. 1993, 4, 427–443. [Google Scholar] [CrossRef]
- Wang, W. The Evaluation of Coordinated Development Level between Urban and Rural and Its Spatial-Temporal Pattern in Yangtze River Economic Zone. Econ. Geogr. 2017, 37, 60–66+92. [Google Scholar]
- Liu, W.X.; Zhao, M.J.; Xu, T. Water poverty in rural communities of arid areas in China. Water 2018, 10, 505. [Google Scholar] [CrossRef]
- Li, J.T.; Liu, Y.S.; Yang, Y.Y.; Jiang, N. Multi-Dimensional Influence of Urbanization on Agriculture-Rural: An Empirical Study Based on Provincial Panel Data. Hum. Geogr. 2019, 3, 137–145. [Google Scholar]
- Lou, J.C.; Liu, Z. An Empirical Analysis of the Impact of Human Capital on Agricultural Economy. Stat. Decis. 2020, 6, 67–70. [Google Scholar]
- Liu, G.; Xie, G.Y. Transportation Infrastructure, Scale of Circulation Organization and Market Segmentation of Agricultural Products Circulation. J. Beijing Technol. Bus. Univ. 2019, 3, 28–40. [Google Scholar]
- Zhang, L.; Wen, T. How Does Digital Inclusive Finance Affect the Integrated Development of Rural Industries? Chin. Rural Econ. 2022, 7, 59–80. [Google Scholar]
- Wang, D.X.; Ran, X.M. Rural digitalization, human capital and integrated development of rural industries: Empirical evidence based on China provincial panel data. J. Chongqing Univ. 2022, 2, 1–14. [Google Scholar]
- Zhang, Y.; Zhou, Y.H. Digital Financial Inclusion, Traditional Financial Competition, and Rural Industry Integration. J. Agrotech. Econ. 2021, 9, 68–82. [Google Scholar]
- Zhao, L.; Fang, C. Distribution Dynamics and Driving Mechanism of China’s Provincial New Urbanization Development Level. J. Quant. Technol. Econ. 2019, 36, 44–64. [Google Scholar]
- Yuan, G.D.; Wang, Q. The Evolutionary Motivation and Path of “Ecological Resources—Ecological Assets—Ecological Capital”. Financ. Account. Mon. 2021, 909, 25–32. [Google Scholar]
- Bashir, M.B.; Adam, A.G.; Abubakar, J.A. The role of national farmers helps line in agricultural information dissemination among crop farmers in Nigeria: A case study of farmers help line centre, NAERLS ABU Aaria. J. Agric. Ext. 2021, 25, 93–103. [Google Scholar] [CrossRef]
- Zhang, Q.; Razzaq, A.; Qin, J.; Feng, Z.; Ye, F.; Xiao, M. Does the Expansion of Farmers’ Operation Scale Improve the Efficiency of Agricultural Production in China? Implications for Environmental Sustainability. Front. Environ. Sci 2022, 10, 918060. [Google Scholar] [CrossRef]
- Zhang, W.M.; Zhang, X.D. The Capitalization of Ecological Resources: An Explanatory Framework. Reform 2019, 299, 122–131. [Google Scholar]
- Razzaq, A.; Xiao, M.; Zhou, Y.; Liu, H.; Abbas, A.; Liang, W.; Naseer, M.A.u.R. Impact of Participation in Groundwater Market on Farmland, Income, and Water Access: Evidence from Pakistan. Water 2022, 14, 1832. [Google Scholar] [CrossRef]
- Razzaq, A.; Liu, H.; Zhou, Y.; Xiao, M.; Qing, P. The Competitiveness, Bargaining Power, and Contract Choice in Agricultural Water Markets in Pakistan: Implications for Price Discrimination and Environmental Sustainability. Front. Environ. Sci. 2022, 10, 917984. [Google Scholar] [CrossRef]
- Yang, J. The Impact of China’s New Urbanization Development Level on Agricultural Industry Structure. Econ. Surv. 2016, 33, 84–89. [Google Scholar]
- Liu, Y. Transport Infrastructure Investment, Regional Economic Growth and the Spatial Spillover Effects—Based on Highway and Marine’s Panel Data Analysis. China Ind. Econ. 2010, 12, 37–46. [Google Scholar]
- Li, L. Study on the Impact of Industrial Structure and Dual Economic Structure Changes on the Urban Rural Income Gap. Stat. Decis. 2014, 414, 103–106. [Google Scholar]
- Wang, A.M. Is There a “Productivity Paradox” in China’s Rural Information?—A Test Based on Threshold Panel Regression Model. China Soft Sci. 2015, 295, 42–51. [Google Scholar]
- Roach, S. America’s Technology Dilemma: A Profile of the Information Economy; Special Economic Study; Morgan Stanley: New York, NY, USA, 1987; pp. 3–12. [Google Scholar]


Disclaimer/Publisher’s Note: The statements, opinions and data contained in all publications are solely those of the individual author(s) and contributor(s) and not of MDPI and/or the editor(s). MDPI and/or the editor(s) disclaim responsibility for any injury to people or property resulting from any ideas, methods, instructions or products referred to in the content. |
© 2023 by the authors. Licensee MDPI, Basel, Switzerland. This article is an open access article distributed under the terms and conditions of the Creative Commons Attribution (CC BY) license (https://creativecommons.org/licenses/by/4.0/).