Article

Phylogenetic Analysis of Ryegrass (Lolium rigidum) Populations and the Proliferation of ALS Resistance in Saudi Arabia

1
Plant Production Department, College of Food and Agriculture Sciences, King Saud University, P.O. Box 2460, Riyadh 11451, Saudi Arabia
2
Center of Excellence in Biotechnology Research, King Saud University, P.O. Box 2455, Riyadh 11451, Saudi Arabia
3
Rice Biotechnology Lab, Rice Research & Training Center, Field Crops Research Institute, Sakha, Kafr EL-Sheikh 33516, Egypt
4
Agronomy Department, Faculty of Agriculture, Al-Azhar University, Cairo 11651, Egypt
*
Author to whom correspondence should be addressed.
Agriculture 2022, 12(2), 290; https://doi.org/10.3390/agriculture12020290
Submission received: 20 December 2021 / Revised: 3 February 2022 / Accepted: 9 February 2022 / Published: 17 February 2022
(This article belongs to the Section Genotype Evaluation and Breeding)

Abstract

:
Morphological and simple sequence repeat (SSR) approaches were used to determine the genetic diversity of 29 ryegrass (Lolium rigidum) genotypes belonging to eight populations collected from several regions in Saudi Arabia. In this study, 50 in Silico-developed SSR markers derived from genomic and expressed sequence tag (EST) microsatellites were examined. Analysis of variance showed highly significant differences in all studied traits. Cluster analysis based on the morphological data of the 29 Lolium genotypes and using PAST (paleontological statistics) software was performed. According to the results, clustering was based mostly on genotype location. The sensitive genotypes for herbicide were clustered in one group. In addition, using EST-SSR markers, we observed the existence of a considerable number of genetic variations among Lolium genotypes. From these markers, only 31 produced reasonable amplification products. The results showed that 23 SSR markers revealed that 74.19% were polymorphic. The number of alleles detected per primer ranged from one to five in the primer LTC SSR1. The tested primers amplified 1434 bands across eight populations, with an average of 46.26 bands per primer. The polymorphism information content (PIC) values ranged from 0.11 to 0.76 for the primers LT EST-SSR5 and LTC SSR1. The unweighted pair group method with arithmetic average (UPGMA) clustering of the 29 genotypes representing eight populations was based essentially on their locations and herbicide-tolerance levels. Most of the populations formed into four clusters, together representing genotypes. Moreover, the tolerant populations were distinguished from the sensitive ones. The relationship between the genetic diversity and geographical source of Lolium rigidum populations of Saudi Arabia was revealed through this study. The results showed that the efficiency of developed SSR markers are transferable across species. They have been helpful to assess the genetic diversity of the ryegrass population as this could be applied to differentiate between tolerant and sensitive populations of ryegrass.

1. Introduction

The genus Lolium includes eight species. Of these, two are cultivated as forage grasses: perennial ryegrass (Lolium perenne) for grazing and turf and Italian ryegrass (L. multiflorum) for making hay and silage. Another species, Lolium rigidum, infests wheat fields [1]. Wild annual ryegrass (Lolium rigidum Lam.) is considered one of the most common weed species affecting wheat yield worldwide. Genetically, L. rigidum is a self-incompatible, variable, cross-pollinating species and is generally considered diploid (2n = 14) [2]. L. rigidum has high degree of genetic variability and is adapted to a wide range of climatic and agricultural conditions. Balfourier et al. and Kloot [3,4] described a high level of genetic variation within the L. rigidum population and also mentioned that pollen-mediated gene flow between populations was 2.2 times greater than the gene flow mediated by seed movement. In Saudi Arabia, L. rigidum is a widespread weed infesting field crops, such as wheat, and farmers use herbicides for controlling annual ryegrass weed populations. The degree of diversity of L. rigidum is not well studied. A phenotypic analysis of the herbarium specimens of Lolium confirmed the separation of the species using several morphological characters. Individual characters did not separate each species, but multiple morphological characters can distinguish between the spp. as their range overlapped between species [5]. Ryegrass (Lolium sp.) is a major weed related to wheat production. Herbicide resistance is an alarming issue in weed plants. Herbicide resistance will lead to a situation where weeds will compete with the crop plants without any resistance to grow, even under herbicide spray. To break the resistance, it would be imperative to assess the genetic variation among the population. The development of molecular marker technologies successfully provides an alternative procedure for assessing genetic diversity and crop improvement. Different types of molecular markers, such as restriction fragment length polymorphism (RFLP), randomly amplified polymorphic DNA (RAPD) [6,7], amplified fragment length polymorphism (AFLP) [8], and simple sequence repeat (SSR) markers have been developed in many plant species, such as rice [9], maize [10], wheat [11], barley [12], sorghum [13], perennial ryegrass [14], tall fescue [15], and timothy [16]. SSRs have been used in many studies as those relating to genetic diversity [17]. In general, SSR markers are widely used in plant molecular genetics due to their abundance in the genome, codominant nature, and high repeatability. SSR markers have been successfully used to assess genetic variation in ryegrass [14,18,19]. Understanding the genetic variation of ryegrass would help develop effective management strategies for herbicide-resistant ryegrass. There are limited number of SSR markers available for ryegrasses (Lolium rigidum). Several methods are used to develop SSR markers; computational approaches that search for the SSR-containing sequences in public databases have been widely applied [20]. Moreover, these studies could also investigate the transferability in cross-species applications such as Lolium perenne and Lolium multiflorum and the exploitation of a comprehensive expressed sequence tag (EST) collection in L. rigidum for SSR identification in L. rigidum. The study was carried out to analyze the genetic diversity among Saudi Arabian ryegrass genotypes based on developed EST-SSR markers and to access the performance of Lolium populations collected from different locations in Saudi Arabia.

2. Materials and Methods

Seeds for 8 ryegrass (Lolium rigidum) populations were collected; 7 were from different regions in Saudi Arabia (Wadi Aldawaseir, Tabuk, Qassim, Hail, Aljouf, Harad and Aldawadmi (Figure 1) [21]) and 1 genotype was from the Syngenta Company, England. In addition to the herbicide-sensitive variety from Syngenta, 4 samples were obtained from 4 heavily infested fields in each of the 7 Saudi Arabian regions, making 29 samples (Table 1). The soil texture of experimental sites was loam-sandy soil. The total organic matter of the soil was 0.5% and EC 1.1 ds/m2.

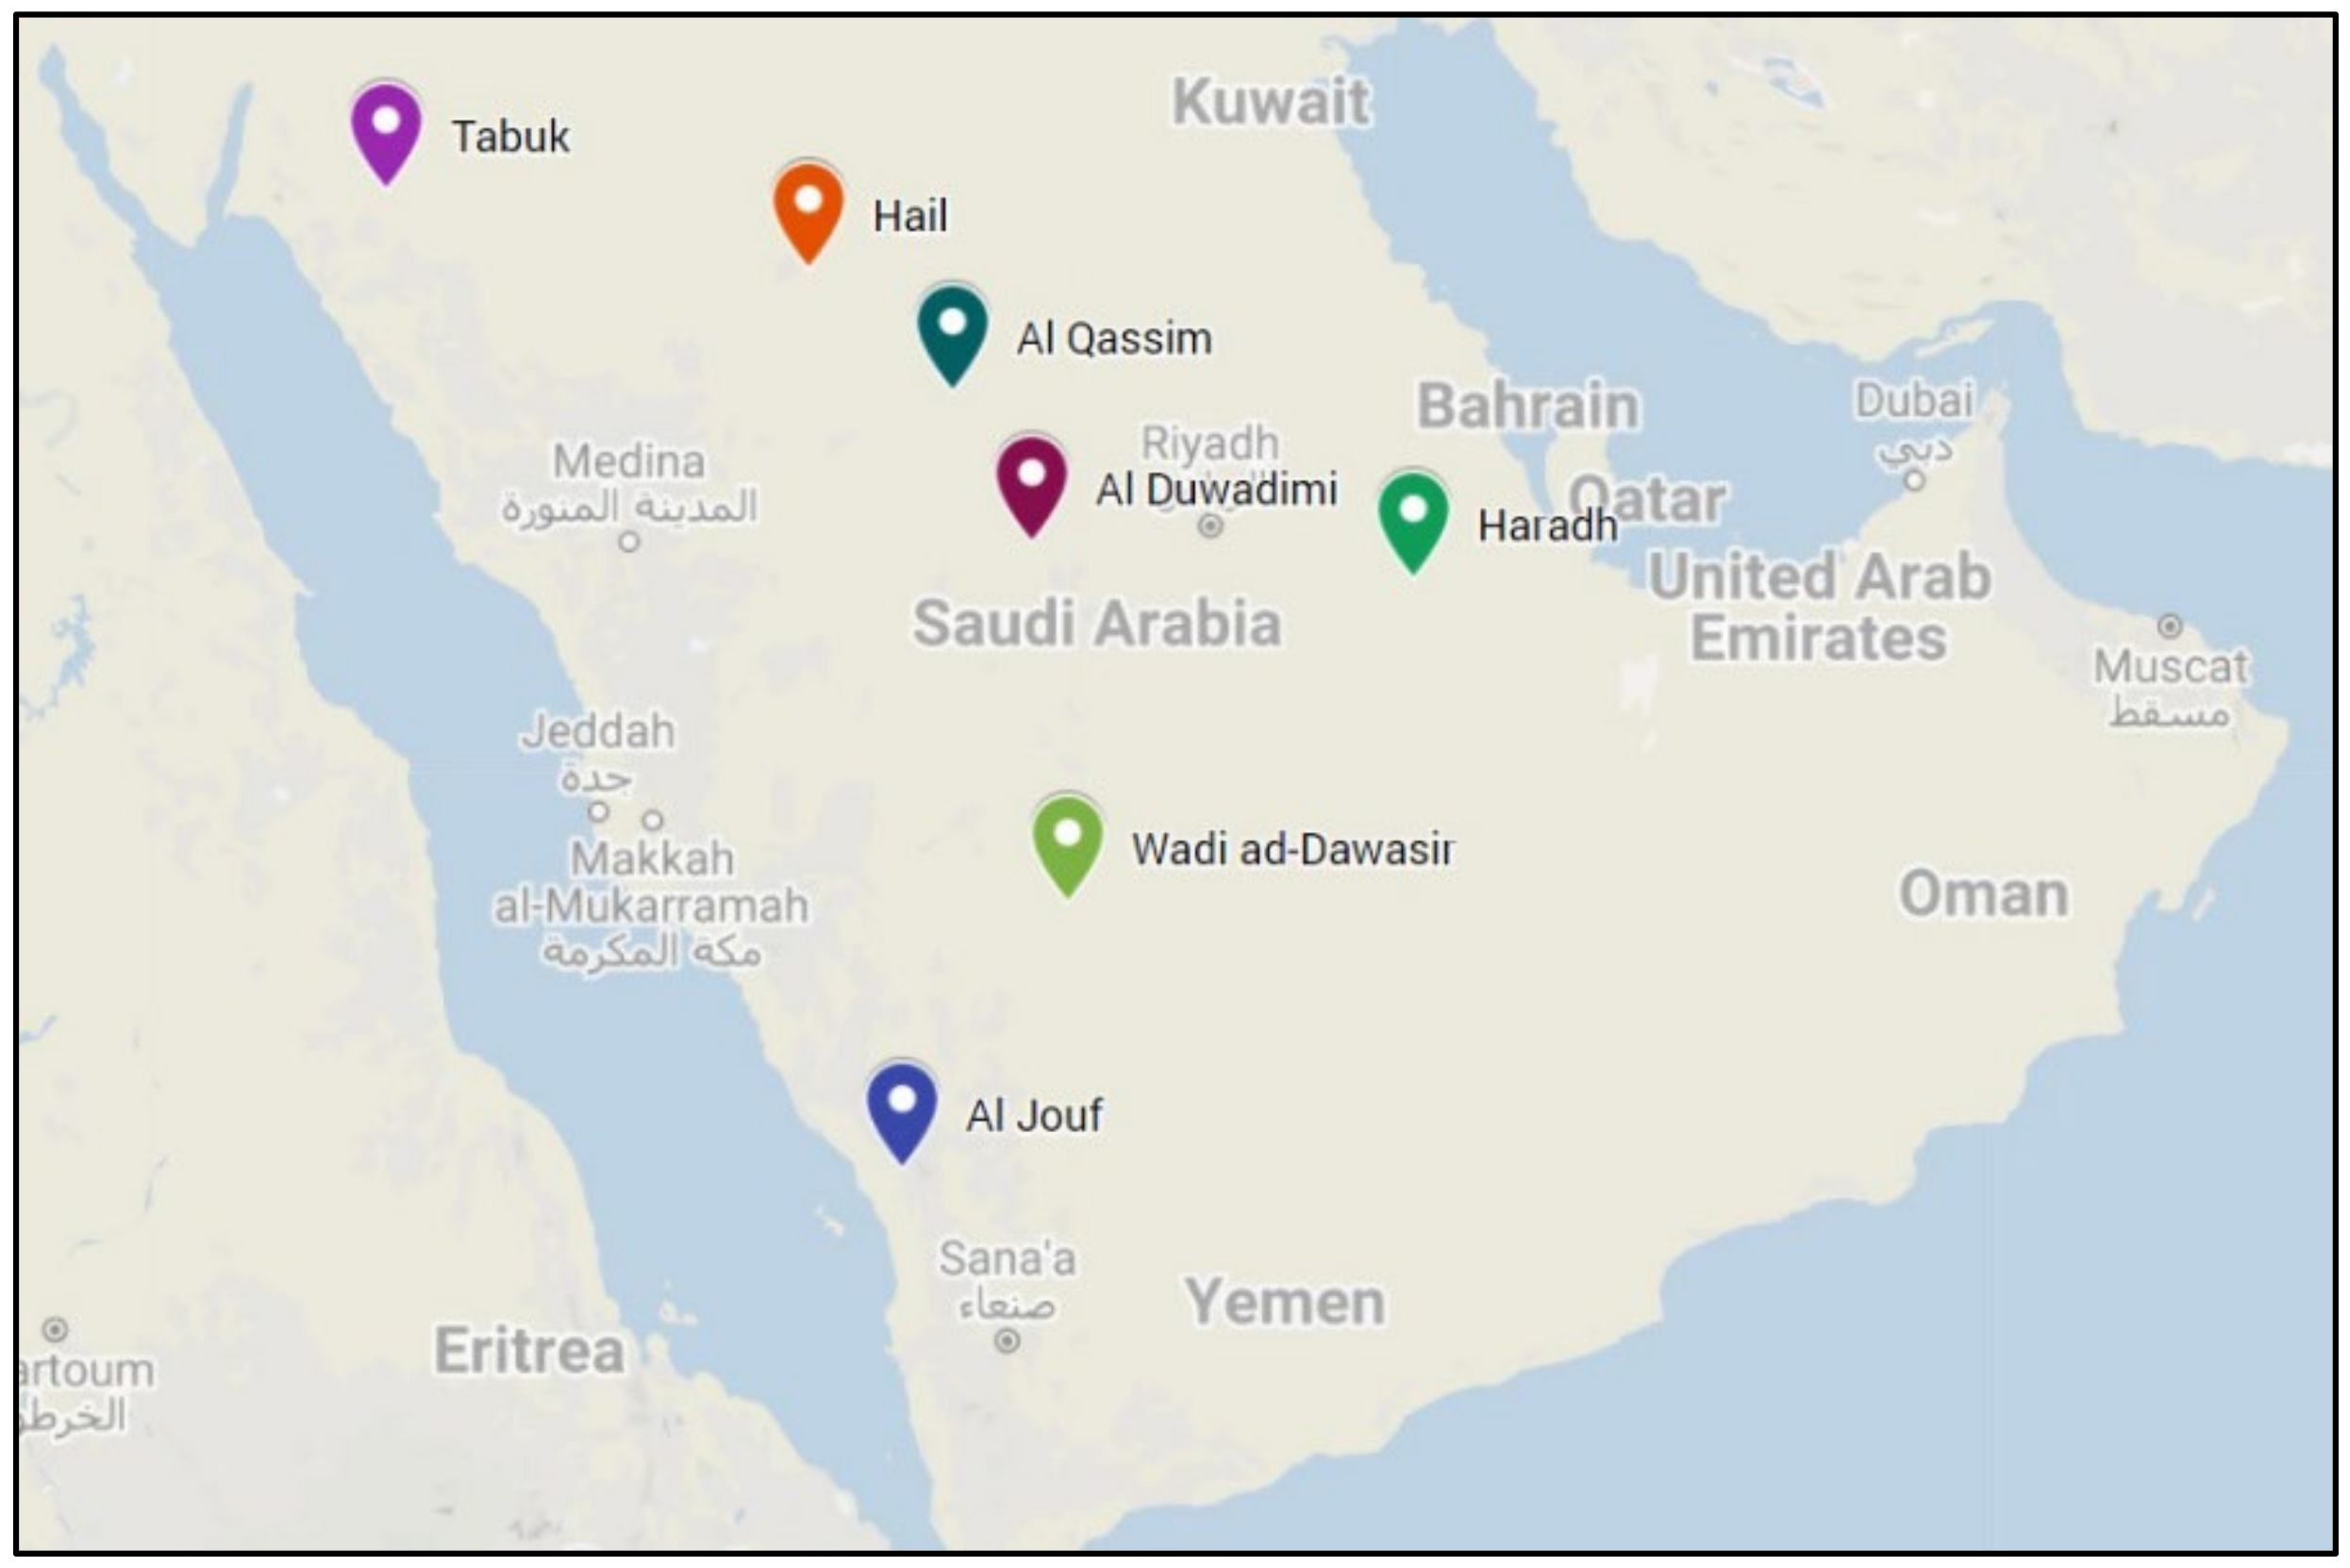
2.1. Field Performance

The experiment was conducted using a RCBD design with 3 replications at Dirab Research and Experimental Station, Food and Agriculture Sciences College, King Saud University. Each plot consisted of 6 rows (25 cm spacing) with lengths of 3 meters. Ryegrass seeds were planted in October 2014, with a seed rate of 200 seeds/ m2. Phosphorus and potassium were added during seedbed preparation at the rate of 200 kg/ha, in the form of calcium superphosphate (15.5% P2O5) and potassium sulfate (48% K2O), respectively. Nitrogen fertilizer was added at the rate of 200 kg/ha in the form of ammonium sulfate (20.6% N) in 4 equal doses (during seedbed preparation, 15, 30, and 45 days after sowing). Other standard cultural practices applied to wheat (as a host crop) were adapted. After complete heading, a one meter-squared sample was taken at random from the middle rows of each plot, to determine plant height (cm), number of tillers/m2, spike length (cm), and fresh and dry weights (g) /m2.
Data were subjected to statistical analysis of variance using SAS and means of treatments were compared by LSD at a p = 0.05% level of significance, according to Gomez and Gomez [22]. Field data was analyzed using PAST3 program, and Weighted Pair Group Method with Arithmetic Average (UPGMA) [23].

2.2. Molecular Analysis

Ten plants were chosen randomly; 1 leaf was collected per plant and bulked as 1 sample and was immediately immersed in liquid N2 upon collection and stored at −80°C until DNA isolation. Genomic DNA was extracted using a Wizard® Genomic DNA Purification Kit (Promega, Madison, WI, USA) according to the manufacturer’s protocol. The genomic DNA was quantified using a Nanodrop2000 spectrophotometer (Fisher Scientific, Wilmington, DE, USA), and its integrity checked by agarose gel electrophoresis (0.8%).
Initially, 50 SSR primers were screened for their successful amplification and reproducibility. These SSR primers consisted of the 30 previously reported SSRs and 20 newly developed SSRs based on the EST sequences retrieved from GenBank (Table 2). The list and sequences of the selected SSR primers based on their successful amplification are presented in Table 2. The SSRs screening and primer designing were carried out using BatchPrimer3v1.0 software [24]. The default criteria were set on the minimum number of repeats, which were as follows: 5 repeating units for mononucleotides and 3 repeating units for dinucleotides, tri-, tetra-, penta- and hexa- nucleotides. Primer pairs were designed on the flanking regions of potential SSRs.
Then, 31 SSRs markers were validated on 29 genotypes of the Lolium rigidum population. The PCR reaction was performed in a 20 μl volume consisting of 50 ng of genomic DNA, 0.5 μM of each primer, and 10 μl of 2X GoTaq Green Master Mix (Promega, Madison, WI, USA). The PCR amplification was performed using the following reaction program: initial denaturation at 94°C for 4 min, followed by 35 cycles of denaturation at 94°C for 30 s, annealing at X°C for 30 s, and extension at 72°C for 30–120 s, followed by a final extension step at 72°C for 15 min. X refers to the respective annealing temperature used for each primer pair (Table 2).
The DNA amplification products were analyzed by electrophoresis on 2.5% agarose gels in 1X Tris borate EDTA (TBE) buffer. The gels were stained with ethidium bromide (1 mg/ml) for 20 min and distained in deionized water for 15 min. The DNA was visualized using a UV Tran illuminator.
The data observed from the SSR analysis were analyzed using the Jaccard similarity coefficient [25]. The resulting similarity coefficients were used to construct a dendrogram using the Unweighted Pair Group Method with Arithmetic Average (UPGMA), employing the PAST3 program [23]. The polymorphic information content (PIC) for each primer was calculated to estimate its allelic variation as follows:
PIC = 1 j = 1 n P i j 2
where Pij is the frequency of the ith allele for marker j, with the summation extending over n alleles, calculated for each marker [26].
The data from the 31 polymorphic SSR markers were subjected to detect the number of subpopulations explaining population structure. Population-structure analysis was performed based on the admixture model-based clustering method in the software package STRUCTURE 2.3.4 [27]. The STRUCTURE harvester software was used to find the correct number (K) of subpopulations. K was tested from 1 to 10 with 3 iterations for each group [28].

3. Results

3.1. Performance of Lolium Populations

Mean square estimates for morphological studied traits across the 29 Lolium genotypes are presented in Table 3. Analysis of variance showed highly significant differences in all studied traits. The resistance indicates the existence of a significant amount of genetic diversity among the tested genotypes. This indicates the ability of Lolium to evolve rapidly in the ecosystem, for better plant adoption to surrounding environments. This rapid change and adaptation gives Lolium an advantage when competing with wheat plants. Mean performance data confirmed the existence of genetic diversity. The results shown in Table 4 illustrate the variations in plant height. The trait range was 59.33 to 86.0 cm for Gouf4 and Harad4, respectively. Samples from Harad, Qassim, and Wadi El-Dawaser were generally taller than other populations. In terms of days to heading, the ALS-susceptible Syngenta genotype flowered late compared to other populations (>100 days), while Wadi El-Dawaser samples were early in flowering (64.67–70.67 days, with an average of 65.25). Long panicles were recorded for Qasseim1 and Dawadmi3 (28.27 and 27.0 cm, respectively). In contrast, Haiel3 had the shortest panicles (19.1 cm), followed by Tabouk3 and Haiel4 (19.2 and 19.7 cm, respectively). As population average, four populations (Dawadmi, Harad, Qasseim, and Syngenta genotypes) had the longest panicles and differed significantly from the remaining four populations.
The number of tillers per m2 varied across the 29 tested Lolium genotypes. Harad4 had the highest number of tillers (1510.33) while Haiel1 had the lowest (1103.67 tillers/m2). As an average of the four samples per location, the Harad population had the highest mean value (1338.25) for the number of tillers trait, while the Dawadmi population had the lowest mean value (1166.33) for the same trait. Fresh weight was a direct indicator for plant vigor, and growth rate showed also significant differences. The highest fresh weight (1735 and 1723.67 g/m2) was showed in Tabook1 and Wadi El-Dawaser1 as well as dry weight (377.03 and 374.6 g/m2) as present in Table 4.
Cluster analysis performed using PAST software and based on the morphological data of the 29 Lolium studied genotypes is presented in Figure 2. The results show clearly that the clustering was largely based on genotype location. In most of the studied locations, the respective genotypes tended to cluster together or nearby each other. This again confirms the weed’s ability to adapt with each growing environment and make genetic changes that may improve its competition with wheat plants.

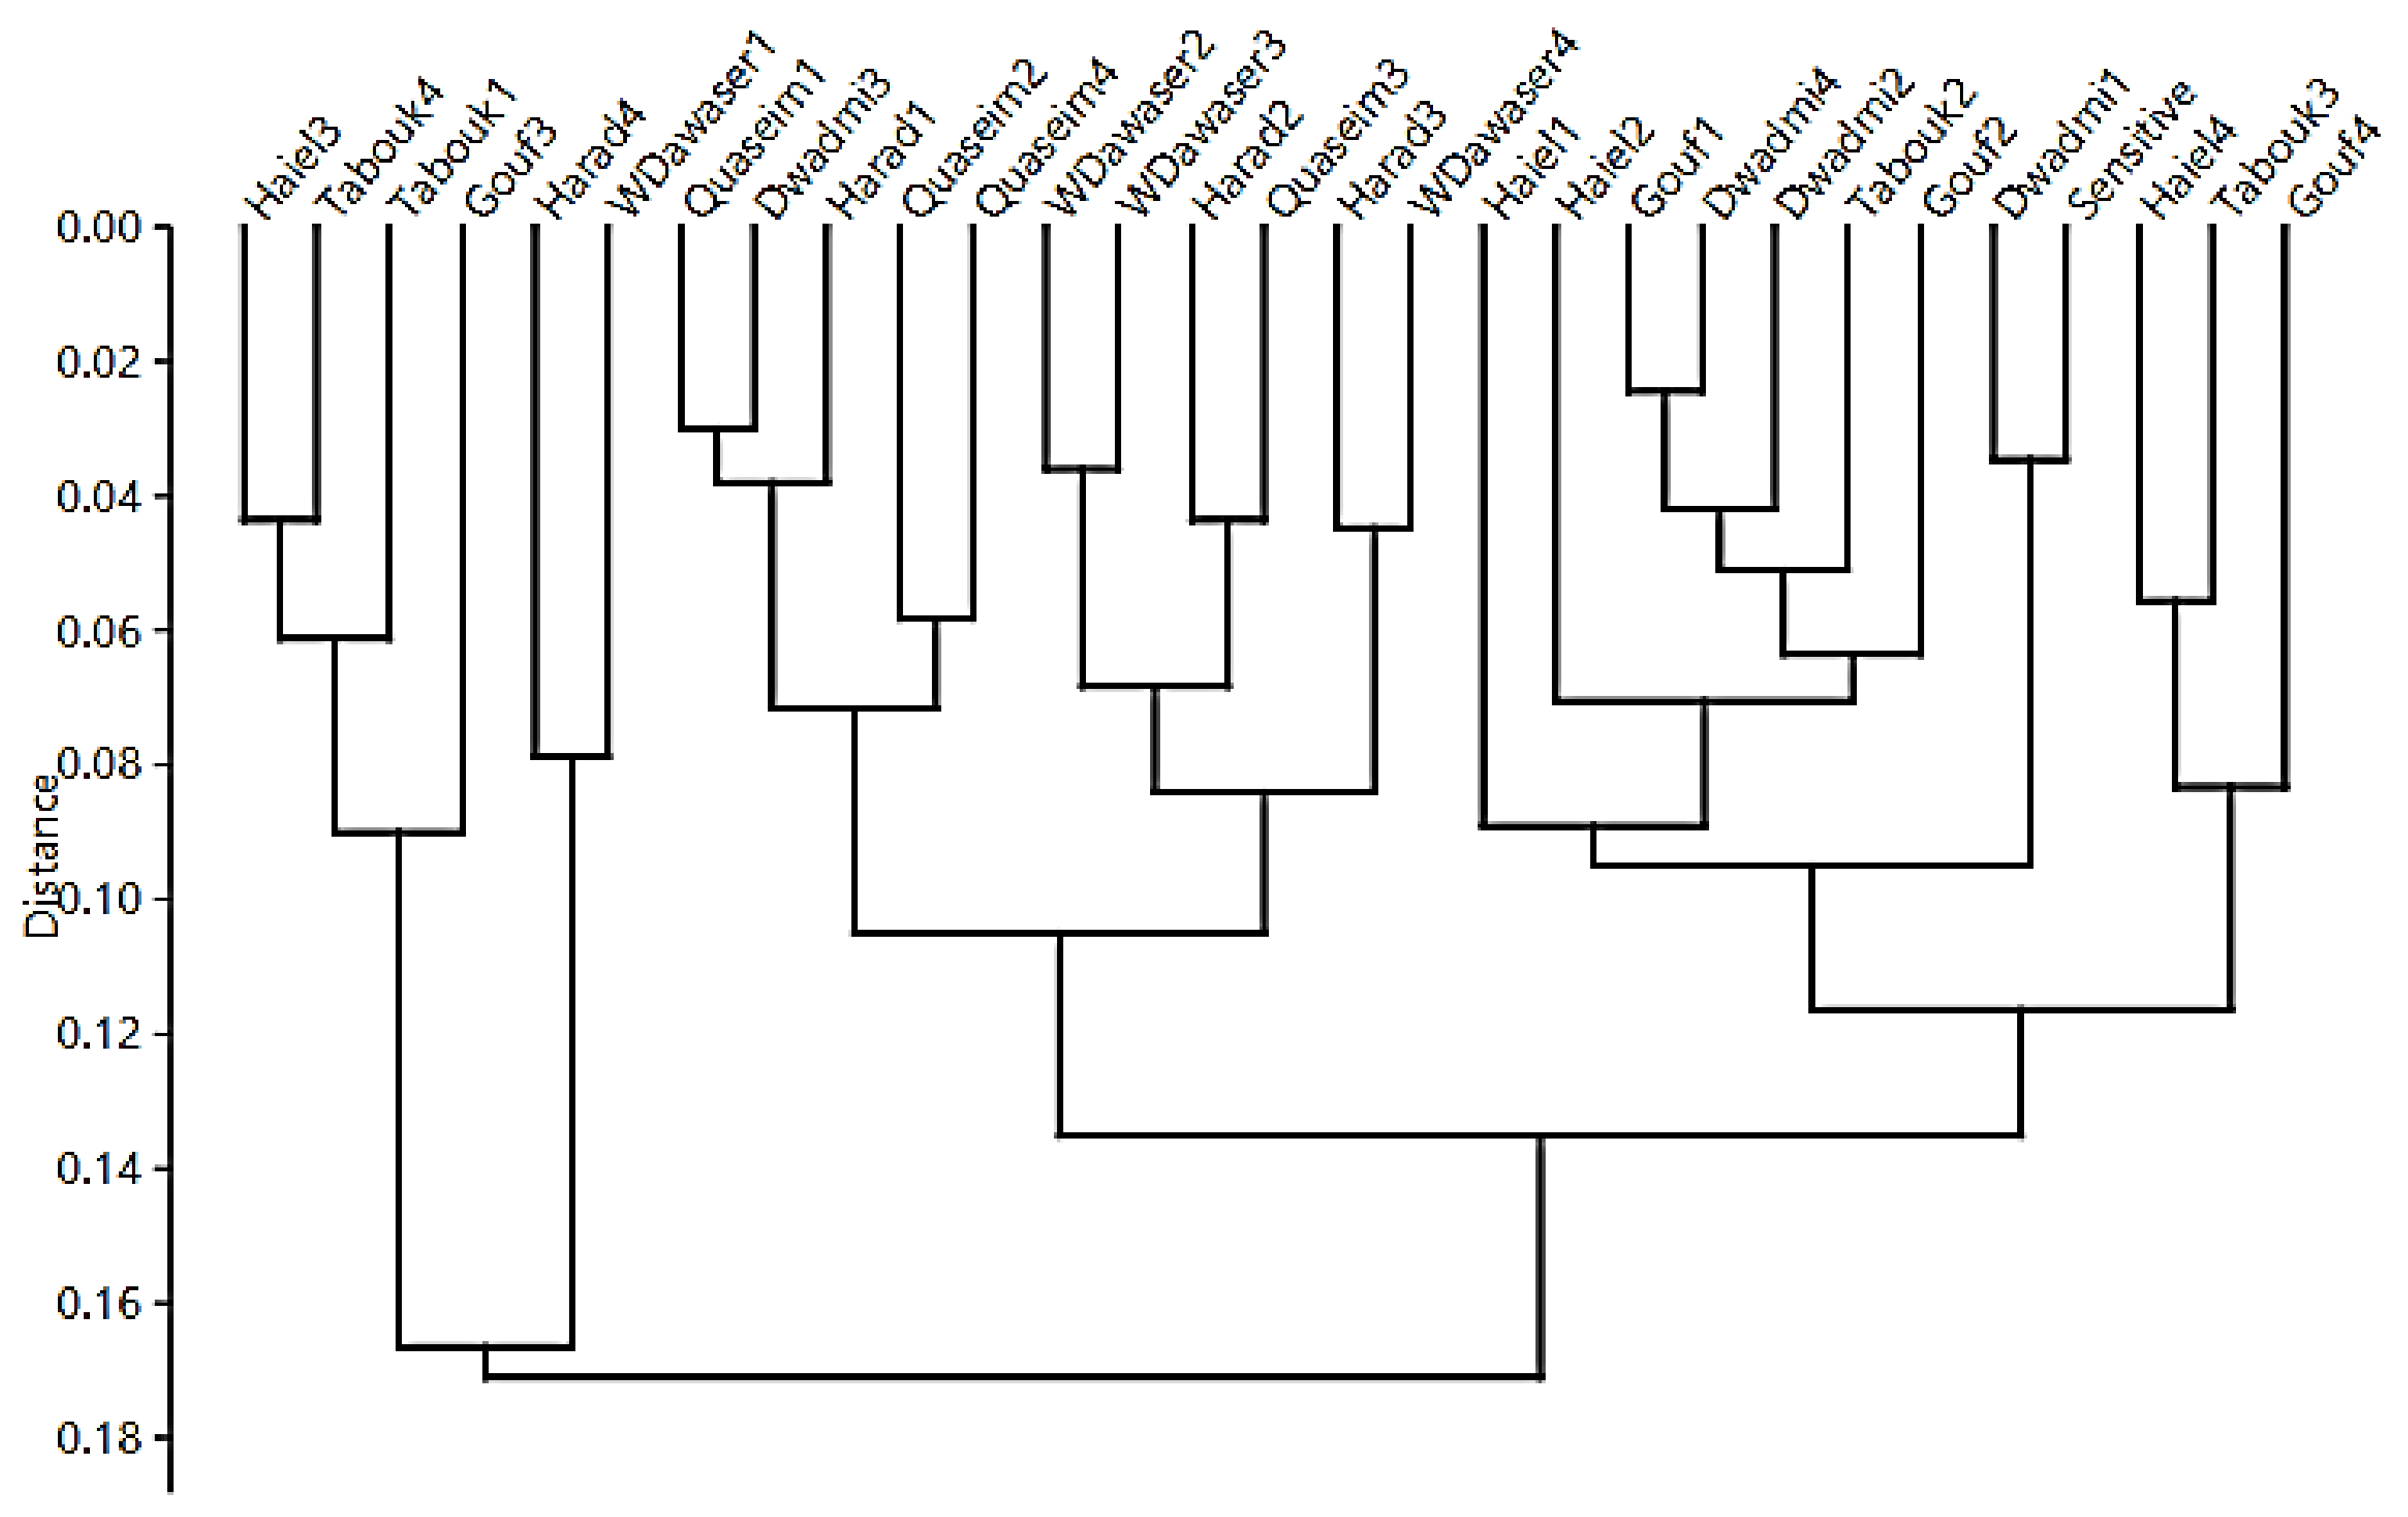
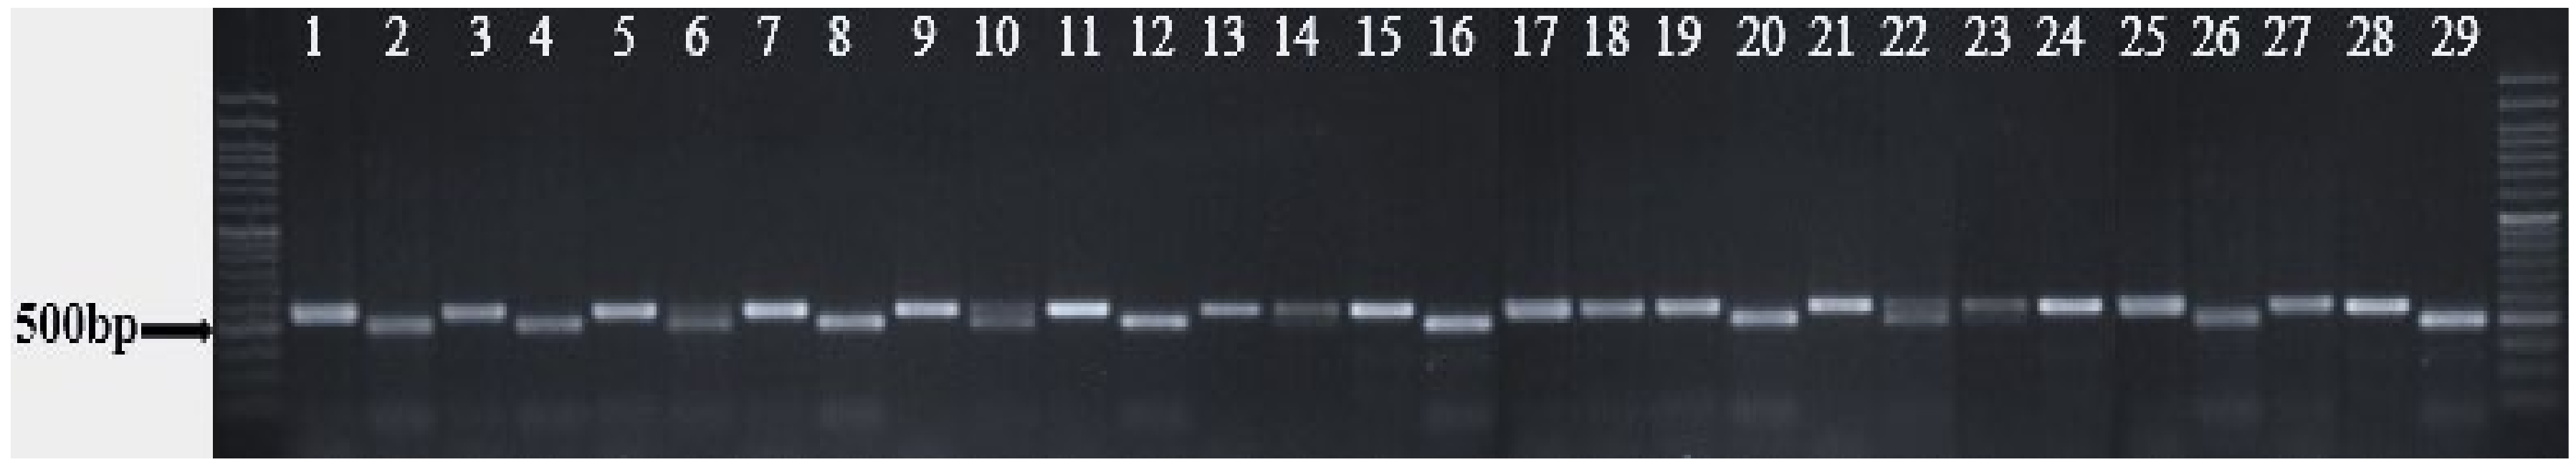
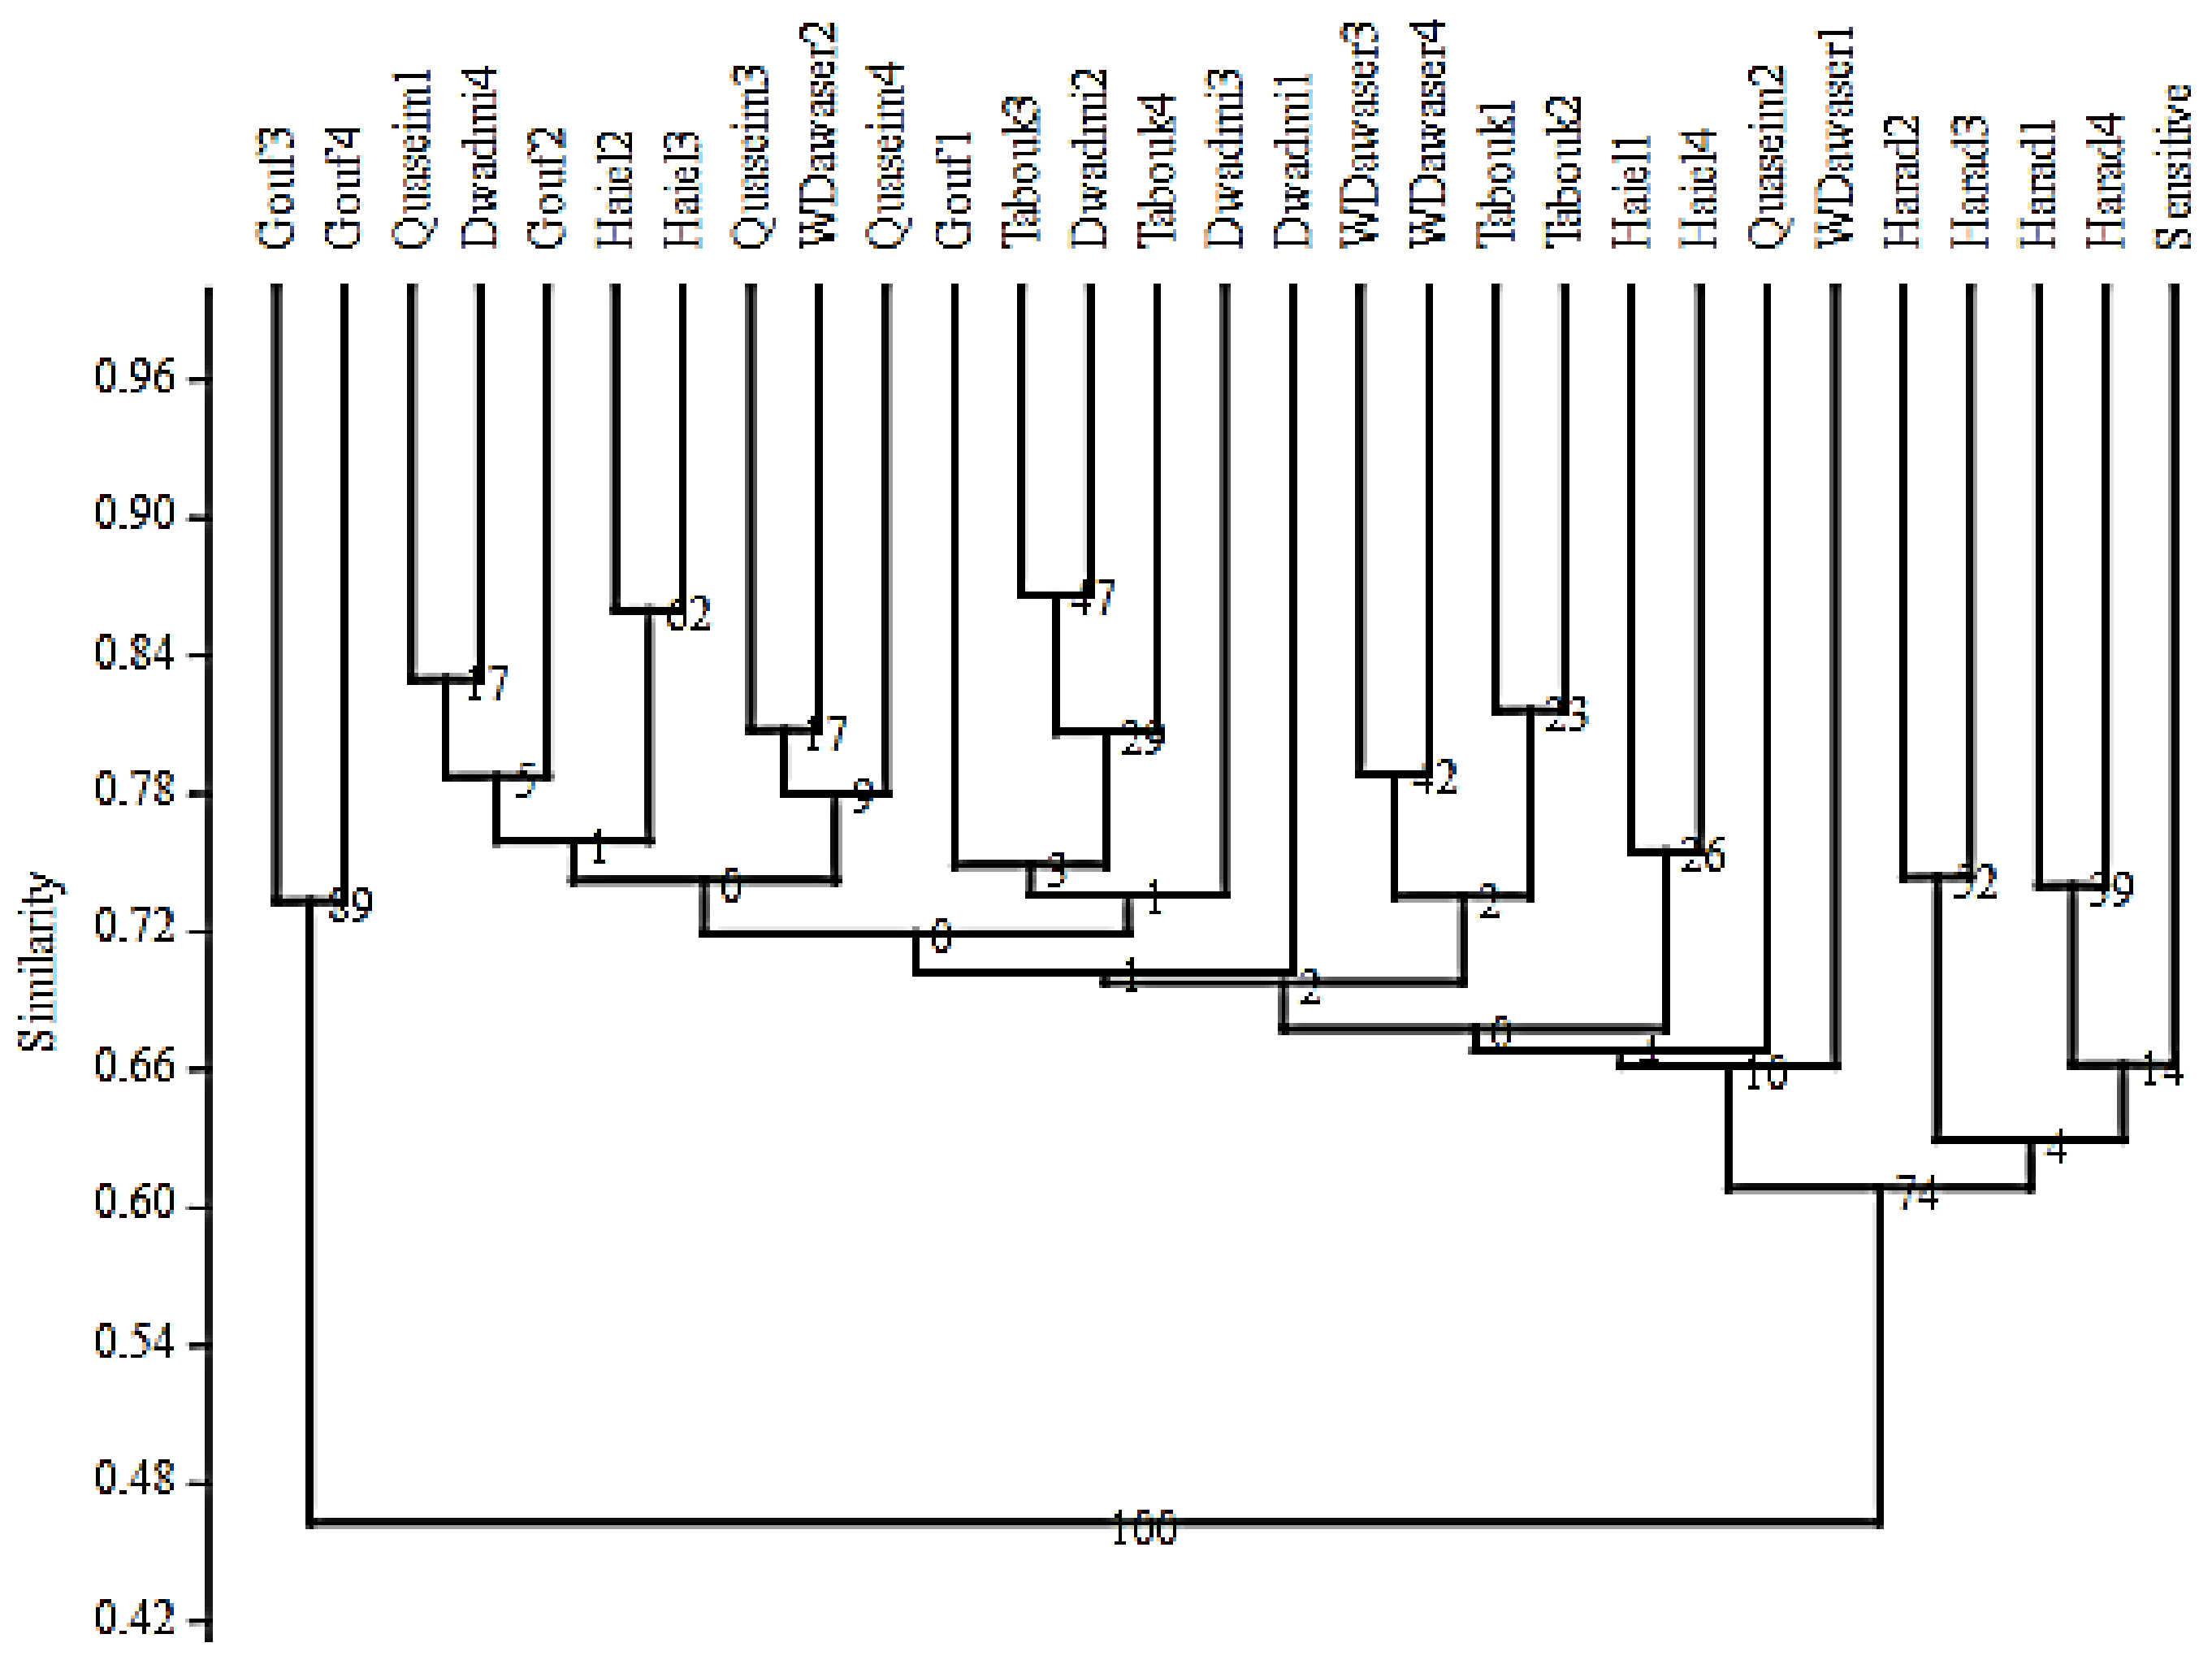
3.2. Molecular Analysis of Lolium Populations

The summary of SSR primers results is presented in Table 5. The tested SSR primers successfully amplified 1434 bands across 29 Lolium genotypes, with an average of 46.26 bands per SSR primer. Eight SSR primers showed monomorphic patterns (Table 5) with a single allele per primer. In contrast, the maximum numbers of alleles were detected in the primer LT C SSR1, with five detected alleles, followed by the primers LP SSR9, LP EST SSR14, LT EST-SSR6, and TF EST SSR1, each with four alleles. The SSR primers detected a total of 75 alleles, of which 67 were polymorphic, with an average of 2.42 alleles/primer. The PIC values ranged from 0.11 for the primer LT EST-SSR5 to 0.76 for the primer LT C SSR1. The wide range of PIC values reflects the differences in primer efficiency in detecting molecular diversity. One representative profile (primer pair LT EST-SSR4) was shown (Figure 3). Based on the SSR banding patterns, similarity coefficients were calculated (Table S1). The closest pair of genotypes was Tabouk3 and Dwadmi2, with an 87% similarity coefficient. On the other hand, the most diverse pair of genotypes was Aljouf 4 and Wadi Aldawaser4, with only 35% similarity. Based on similarity coefficients and using the UPGMA method, a dendrogram explaining the genetic relationship among the 29 tested genotypes was constructed (Figure 4).
The SSR markers successfully identified the Syngenta (sensitive herbicide international check) and Harad genotypes (sensitive herbicide) in one subcluster, with similarity ranging from 61 to 74%. They were distinct from other tolerant Lolium populations that were grouped in one cluster. The Aljouf population showed abnormal clustering, whereas the Gouf3 and Gouf4 genotypes clustered together in one group and the Aljouf 1 and Aljouf 2 genotypes were scattered inside the main group that included the remaining 27 genotypes. The main group was further divided into four subclusters, and at 87% similarity, all genotypes were identified and separated into individual populations.
The analysis of the populations structure of the 29 Lolium genotypes was inferred using STRUCTURE 2.3.4, and the peak of delta K was observed at K = 2, suggesting the presence of two main populations (Figure 5A). The 29 genotypes were distributed to the two main clusters with few admixtures. The first cluster of 18 genotypes (62%) of total 29 genotypes was grouped into cluster one, the second cluster were 11 genotypes (37.9%), and the both two clusters were with few admixture (Figure 5B).

4. Discussion

The current study aimed to identify the genetic variability among 29 Lolium genotypes using morphological and molecular marker performance and microsatellite markers designed from the transcribed regions (i.e., EST-SSRs), as well as some previously reported genomic SSRs. The ryegrass genotypes used in this study were collected from infested wheat fields in seven regions of Saudi Arabia. As would be expected, they were all found to be morphologically distinct when overall morphological performance was examined. The significance of phenological parameters across tested genotypes was evidenced, indicating the ability of ryegrass weed to rapidly evolve and differentiate across regions as a result of the surrounding environment. This was clear based on the amount of genetic diversity detected. This emphasizes the urgent need to build a location-specific management strategy when dealing with ryegrass in wheat fields. Hence, to control seed yield, it is easier to control yield-related parameters. Ozkose and Tamkoc and Acar et al. [29,30] reported that spike length was an important feature that determines generative organ development and seed yield. Dawadmi samples had the lowest mean value for seed yield. Fresh weight was direct indicator for plant vigor, and growth rate showed also significant differences among tested genotypes. Morphological characters are affected mainly by genetic background as well as other factors such as climate, season, soil moisture, form tools, cutting height, format, frequency, and nitrogen fertilization [29,31]. Although morphological characterization is considered an effective discriminating tool for ryegrass varieties [30], this approach is inefficient on account of the time, cost, and accuracy level due to environmental influences. The results clearly showed the clustering was largely based on location and/or genotype background. Genotypes of ryegrass belonging to a specific region tended to cluster together or nearby (Figure 1). This again confirms the weed’s ability to adapt to each growing environment and make genetic changes that may improve its competition with wheat plants. Genotypes, agricultural practices, and the environment influence seed yield through the characteristics related to seed yield, such as panicle length [30].
The simple sequence repeat (SSR) markers are the markers of choice in plant genetic studies due to their genomic abundance, codominant nature, and reproducibility. However, they are not always available for the species to be studied and their isolation could be time-consuming and expensive. The SSRs used in this study were designed based on the transcribed region of the L. rigidum, in a dataset consisting of 50 ESTs retrieved from a gene bank. As EST-SSRs are based on the transcribed genes involved in specific biochemical or physiological pathways, they might provide very close associations with functional genetic loci across the genome, allowing the development of functional markers, which are particularly useful for various breeding applications [32]. A total of 31 primers showed reproducible banding patterns when tested on eight selected samples (one sample/population) and were further used for molecular analysis. These included 12 out of the 15 previously reported primers [33,34] and 19 newly developed SSR markers designed from the EST databases. Analyses of genetic variation using microsatellite markers indicated high genetic diversity among individuals within populations regardless of resistance frequency, as would be expected for a wide-ranging outcrossing weed species [35,36]. Clustering was also based on genotype geographical region. Every four samples representing a particular location tended to cluster together or show low genetic distances among them. The other important revelation was the clear separation of the Syngenta (susceptible check) and Harad populations on one side of the dendrogram. When the overall molecular data were analyzed, the Syngenta (susceptible check) was clustered in one group with Harad populations. These two populations were known to be the Syngenta [21,37]. The existence of numerous subgroups at higher similarity levels also indicates considerable amounts of genetic variation. Hence, this clearly shows the power of SSR markers in detecting Lolium genetic diversity at the molecular level. The results obtained here also report the successful development of in silico–designed SSR markers and their usefulness in diversity assessment studies due to their possible linkage with functional genes. Genetic diversity among individuals or within populations reflects the presence of different alleles in the gene pool. From an individualistic and population point of view, genetic diversity has great importance All phenotypic variation is dependent on the genetic variability of individuals, which also helps them to adapt and evolve in different environmental conditions. Previous studies have revealed the capacity of molecular markers to be highly discriminating between varieties in a range of species, including tomato [38], oilseed rape [39,40], maize [41] and evergreen azaleas [42]. STRUCTURE analysis revealed the potential for genetic variation within populations, and the range spread of resistance alleles through gene flow, where the Harad population (Harad1, Harad2, Harad3, and Harad4) revealed sensitivity for herbicide, were with the herbicide-sensitive variety (Syngenta sample) in one cluster. Admixed individuals with genotypes that were partially assigned to each cluster were identified (Figure 5). These results (of admixed individuals in some populations) indicates that gene flow is common. However, the majority of individuals assign highly to a single cluster. Roberto et al. [43] mentioned that localized gene flow between populations in relation to geographical regions may be pollen movement over distances of 3 km in L. perenne and L. rigidum. Short- and long-distance gene flow may also occur by seed movement on agricultural machinery and vehicles, or by wind or animals over short distances.

5. Conclusions

In this study, a considerable and significant number of genetic variations were detected among 29 studied genotypes. These results explain the significant phenological differences observed in Lolium populations. This would be helpful for applying suitable management schemes to the weeds in wheat fields. The results showed the ability of tested SSRs to differentiate sensitive and tolerant populations at a molecular level. The EST-SSRs proved to be suitable for conducting diversity studies among Lolium species. The development of EST-SSR markers could be a valuable tool for numerous genetic and genomic applications at intra- and inter-specific levels in Lolium spp.

Supplementary Materials

The following are available online at https://www.mdpi.com/article/10.3390/agriculture12020290/s1, Table S1: Similarity matrix among the lolium genotypes pairs as revealed by Jaccard coefficient.

Author Contributions

Conceptualization, visualization, validation and writing—original draft preparation, corresponding author, A.I.G.; methodology and performed the experiments, data curation, T.K.A.-A.; methodology, data curation, E.I.I.; software, analyzed the data, H.M.M.; validation, data curation, K.A.A.; methodology, M.J.; software, formal analysis, M.A.K.; resources, data curation, I.A.-A.; supervision, project administration and writing—review and editing, A.A.-D. All authors have read and agreed to the published version of the manuscript.

Funding

The authors extend their appreciation to the Deanship of Scientific Research at King Saud University for funding this work through Research Group No. [RG-1441-477].

Institutional Review Board Statement

Not applicable.

Informed Consent Statement

Not applicable.

Data Availability Statement

All data, tables and figures are original.

Acknowledgments

The authors extend their appreciation to the Deanship of Scientific Research at King Saud University for funding this work and the Researchers Support and Services Unit (RSSU) for their technical support through Research Group No. "RG-1441-477”.

Conflicts of Interest

The authors declare that they have no conflict of interest.

References

  1. Terrell, E.E. A Taxonomic Revision of the Genus Lolium; Agricultural Research Service, US Department of Agriculture: Washington, DC, USA, 1968. [Google Scholar]
  2. Spoor, W.; Mccraw, J.M. Self Incompatibility in Lolium—A Reply. Heredity 1984, 53, 239–240. [Google Scholar] [CrossRef]
  3. Balfourier, F.; Imbert, C.; Charmet, G. Evidence for phylogeographic structure in Lolium species related to the spread of agriculture in Europe. A cpDNA study. Theor. Appl. Genet. 2000, 101, 131–138. [Google Scholar] [CrossRef]
  4. Kloot, P.M. The Genus Lolium in Australia. Aust. J. Bot. 1983, 31, 421–435. [Google Scholar] [CrossRef]
  5. Bennett, S.J.J.G.R.; Evolution, C. A phenetic analysis and lateral key of the genus Lolium (Gramineae). Genet. Resour. Crop Evol. 1997, 44, 63–72. [Google Scholar] [CrossRef]
  6. Hayward, M.D.; Mcadam, N.J.; Jones, J.G.; Evans, C.; Evans, G.M.; Forster, J.W.; Ustin, A.; Hossain, K.G.; Quader, B.; Stammers, M.; et al. Genetic-Markers and the Selection of Quantitative Traits in Forage Grasses. Euphytica 1994, 77, 269–275. [Google Scholar] [CrossRef]
  7. Hayward, M.D.; Forster, J.W.; Jones, J.G.; Dolstra, O.; Evans, C.; McAdam, N.J.; Hossain, K.G.; Stammers, M.; Will, J.; Humphreys, M.O.; et al. Genetic analysis of Lolium. I. Identification of linkage groups and the establishment of a genetic map. Plant Breed. 1998, 117, 451–455. [Google Scholar] [CrossRef]
  8. Bert, P.F.; Charmet, G.; Sourdille, P.; Hayward, M.D.; Balfourier, F. A high-density molecular map for ryegrass (Lolium perenne) using AFLP markers. Theor. Appl. Genet. 1999, 99, 445–452. [Google Scholar] [CrossRef]
  9. Wu, K.S.; Tanksley, S.D. Abundance, polymorphism and genetic mapping of microsatellites in rice. Mol. Gen. Genet. 1993, 241, 225–235. [Google Scholar] [CrossRef]
  10. Taramino, G.; Tingey, S. Simple sequence repeats for germplasm analysis and mapping in maize. Genome 1996, 39, 277–287. [Google Scholar] [CrossRef]
  11. Roder, M.S.; Plaschke, J.; Konig, S.U.; Borner, A.; Sorrells, M.E.; Tanksley, S.D.; Ganal, M.W. Abundance, Variability and Chromosomal Location of Microsatellites in Wheat. Molecular and General Genetics 1995, 246, 327–333. [Google Scholar] [CrossRef]
  12. Ramsay, L.; Macaulay, M.; degli Ivanissevich, S.; MacLean, K.; Cardle, L.; Fuller, J.; Edwards, K.J.; Tuvesson, S.; Morgante, M.; Massari, A.; et al. A simple sequence repeat-based linkage map of barley. Genetics 2000, 156, 1997–2005. [Google Scholar] [CrossRef] [PubMed]
  13. Peng, Y.; Schertz, K.F.; Cartinhour, S.; Hart, G.E. Comparative genome mapping of Sorghum bicolor (L.) Moench using an RFLP map constructed in a population of recombinant inbred lines. Plant Breed. 1999, 118, 225–235. [Google Scholar] [CrossRef]
  14. Jones, E.S.; Dupal, M.P.; Kolliker, R.; Drayton, M.C.; Forster, J.W. Development and characterisation of simple sequence repeat (SSR) markers for perennial ryegrass (Lolium perenne L.). Theor. Appl. Genet. 2001, 102, 405–415. [Google Scholar] [CrossRef]
  15. Saha, M.C.; Mian, R.; Zwonitzer, J.C.; Chekhovskiy, K.; Hopkins, A.A. An SSR- and AFLP-based genetic linkage map of tall fescue (Festuca arundinacea Schreb.). Theor. Appl. Genet. 2005, 110, 323–336. [Google Scholar] [CrossRef]
  16. Cai, H.W.; Yuyama, N.; Tamaki, H.; Yoshizawa, A. Isolation and characterization of simple sequence repeat markers in the hexaploid forage grass timothy (Phleum pratense L.). Theor. Appl. Genet. 2003, 107, 1337–1349. [Google Scholar] [CrossRef]
  17. Chen, X.; Cho, Y.G.; McCouch, S.R. Sequence divergence of rice microsatellites in Oryza and other plant species. Mol. Genet. Genom. 2002, 268, 331–343. [Google Scholar] [CrossRef]
  18. Jones, S.; Dupal, P.; Dumsday, L.; Hughes, J.; Forster, W. An SSR-based genetic linkage map for perennial ryegrass (Lolium perenne L.). Theor. Appl. Genet. 2002, 105, 577–584. [Google Scholar] [CrossRef]
  19. Jones, E.S.; Mahoney, N.L.; Hayward, M.D.; Armstead, I.P.; Jones, J.G.; Humphreys, M.O.; King, I.P.; Kishida, T.; Yamada, T.; Balfourier, F.; et al. An enhanced molecular marker based genetic map of perennial ryegrass (Lolium perenne) reveals comparative relationships with other Poaceae genomes. Genome 2002, 45, 282–295. [Google Scholar] [CrossRef] [Green Version]
  20. Cardle, L.; Ramsay, L.; Milbourne, D.; Macaulay, M.; Marshall, D.; Waugh, R. Computational and experimental characterization of physically clustered simple sequence repeats in plants. Genetics 2000, 156, 847–854. [Google Scholar] [CrossRef]
  21. Al-Doss, A.A.; Ghazy, A.I.; Salem, A.E.-A.K.; Migdadi, H.M.; Al-Faifi, S.A. Agriculture; Environment. Identification and Distribution of ALS resistant Lolium rigidum populations in Saudi Arabia. J. Food Agric. Environ. 2013, 11, 1311–1314. [Google Scholar]
  22. Gomez, K.A.; Gomez, A.A. Statistical Procedures for Agricultural Research; John Wiley & Sons: New York, NY, USA, 1984. [Google Scholar]
  23. Hammer, Ø.; Harper, D.A.; Ryan, P.D. PAST: Paleontological statistics software package for education and data analysis. Palaeontol. Electron. 2001, 4, 9. [Google Scholar]
  24. You, F.M.; Huo, N.; Gu, Y.Q.; Luo, M.C.; Ma, Y.; Hane, D.; Lazo, G.R.; Dvorak, J.; Anderson, O.D. BatchPrimer3: A high throughput web application for PCR and sequencing primer design. BMC Bioinform. 2008, 9, 253. [Google Scholar] [CrossRef] [PubMed] [Green Version]
  25. Jaccard, P. Nouvelles recherches sur la distribution florale. Bull. Soc. Vaud. Sci. Nat. 1908, 44, 223–270. [Google Scholar]
  26. Anderson, J.A.; Churchill, G.A.; Autrique, J.E.; Tanksley, S.D.; Sorrells, M.E. Optimizing parental selection for genetic linkage maps. Genome 1993, 36, 181–186. [Google Scholar] [CrossRef] [PubMed]
  27. Falush, D.; Stephens, M.; Pritchard, J.K. Inference of population structure using multilocus genotype data: Dominant markers and null alleles. Mol. Ecol. Notes 2007, 7, 574–578. [Google Scholar] [CrossRef] [PubMed]
  28. Pritchard, J.K.; Stephens, M.; Donnelly, P. Inference of population structure using multilocus genotype data. Genetics 2000, 155, 945–959. [Google Scholar] [CrossRef] [PubMed]
  29. Ozkose, A.; Tamkoc, A. Morphological and Agronomic Characteristic of Perennial Ryegrass (Lolium perenne L.) Genotypes. Turk. J. Field Crop. 2014, 19, 231–237. [Google Scholar] [CrossRef] [Green Version]
  30. Acar, Z.; Ayan, I.; Tongel, O.; Mut, H.; Basaran, U. Morphological traits of perennial ryegrass accessions in Black Sea Region of Turkey. In The Contributions of Grasslands to Conservation of Mediterranean Biodiversity; CIHEAM/CIBIO/FAO/SEEP: Zaragoza, Spain, 2010; pp. 117–120. [Google Scholar]
  31. Barre, P.; Turner, L.B.; Escobar-Gutierrez, A.J. Leaf Length Variation in Perennial Forage Grasses. Agriculture 2015, 5, 682–696. [Google Scholar] [CrossRef] [Green Version]
  32. Andersen, J.R.; Lubberstedt, T. Functional markers in plants. Trends Plant Sci. 2003, 8, 554–560. [Google Scholar] [CrossRef]
  33. Saha, M.C.; Mian, M.A.R.; Eujayl, I.; Zwonitzer, J.C.; Wang, L.J.; May, G.D. Tall fescue EST-SSR markers with transferability across several grass species. Theor. Appl. Genet. 2004, 109, 783–791. [Google Scholar] [CrossRef]
  34. Jensen, A.M.D.; Mikkelsen, L.; Roulund, N. Variation in genetic markers and ergovaline production in endophyte (Neotyphodium)-infected fescue species collected in Italy, Spain, and Denmark. Crop Sci. 2007, 47, 139–147. [Google Scholar] [CrossRef]
  35. Kuester, A.; Chang, S.M.; Baucom, R.S. The geographic mosaic of herbicide resistance evolution in the common morning glory, Ipomoea purpurea: Evidence for resistance hotspots and low genetic differentiation across the landscape. Evol. Appl. 2015, 8, 821–833. [Google Scholar] [CrossRef] [PubMed]
  36. Karn, E.; Jasieniuk, M. Genetic diversity and structure of Lolium perenne ssp. multiflorum in California vineyards and orchards indicate potential for spread of herbicide resistance via gene flow. Evol. Appl. 2017, 10, 616–629. [Google Scholar] [CrossRef] [PubMed]
  37. Al-Doss, A.A.; Al-Faifi, S.A.; Ghazy, A.I.; Salem, A.E.A.; Khan, M.A.; Althamrah, M.; Ammar, M.H.; Farooq, M.; Migdadi, H.M. Resistance of Annual Ryegrass against Acetolactate Synthase-Inhibiting Herbicides in Wheat Fields: Field Evaluation and Molecular Analysis. Int. J. Agric. Biol. 2017, 19, 1401–1408. [Google Scholar] [CrossRef]
  38. Noli, E.; Conti, S.; Maccaferri, M.; Sanguineti, M.C. Molecular characterization of tomato cultivars. Seed Sci. Technol. 1999, 27, 1–10. [Google Scholar]
  39. Lee, S.H.; Bailey, M.A.; Mian, M.A.; Carter, T.E., Jr.; Shipe, E.R.; Ashley, D.A.; Parrott, W.A.; Hussey, R.S.; Boerma, H.R. RFLP loci associated with soybean seed protein and oil content across populations and locations. Theor. Appl. Genet. 1996, 93, 649–657. [Google Scholar] [CrossRef]
  40. Lombard, V.; Baril, C.P.; Dubreuil, P.; Blouet, F.; Zhang, D. Genetic relationships and fingerprinting of rapeseed cultivars by AFLP: Consequences for varietal registration. Crop Sci. 2000, 40, 1417–1425. [Google Scholar] [CrossRef]
  41. Pejic, I.; Ajmone-Marsan, P.; Morgante, M.; Kozumplick, V.; Castiglioni, P.; Taramino, G.; Motto, M. Comparative analysis of genetic similarity among maize inbred lines detected by RFLPs, RAPDs, SSRs, and AFLPs. Theor. Appl. Genet. 1998, 97, 1248–1255. [Google Scholar] [CrossRef]
  42. De Riek, J.; Dendauw, J.; Mertens, M.; De Loose, M.; Heursel, J.; Van Bockstaele, E. Validation of criteria for the selection of AFLP markers to assess the genetic variation of a breeders’ collection of evergreen azaleas. Theor. Appl. Genet. 1999, 99, 1155–1165. [Google Scholar] [CrossRef]
  43. Busi, R.; Yu, Q.; Barrett-Lennard, R.; Powles, S. Long distance pollen-mediated flow of herbicide resistance genes in Lolium rigidum. Theor. Appl. Genet. 2008, 117, 1281–1290. [Google Scholar] [CrossRef]
Figure 1. The different sites from which the Ryegrass genotypes were collected.
Agriculture 12 00290 g001
Figure 2. Cluster analysis based on morphological Lolium studied traits using PAST software.
Agriculture 12 00290 g002
Figure 3. SSR amplification profiles of primer pair LT EST-SSR4 Lane M: DNA molecular standards with length (bp) on left and right.
Agriculture 12 00290 g003
Figure 4. Dendrogram explaining the genetic relationships among Lolium genotypes based on the data of 31 (SSR) markers.
Agriculture 12 00290 g004
Figure 5. Genetic structure based on Bayesian clustering of eight populations (29 genotypes); Genetic structure based on Bayesian clustering of eight populations (29 genotypes); (A): K-value, the number of clusters (K) was plotted against ΔK, which showed a sharp peak at K = 2. (B): genetic clustering estimated (K = 2) which indicated that the populations can be grouped into two subgroups using STRUCTURE 2.3.4 software.
Agriculture 12 00290 g005
Table 1. List of Lolium genotypes estimated by different herbicides rate [21].
NoGenotypesResistance index (Resistance Risk)
1SyngentaSusceptible
2Harad1Susceptible
3Harad2Susceptible
4Harad3Susceptible
5Harad4Susceptible
6Quaseim1Resistance
7Quaseim2Resistance
8Quaseim3Resistance
9Quaseim4Resistance
10Haiel1Moderate resistance
11Haiel2Moderate resistance
12Haiel3Moderate resistance
13Haiel4Moderate resistance
14Gouf1Moderate resistance
15Gouf2Moderate resistance
16Gouf3Moderate resistance
17Gouf4Moderate resistance
18W. Dawaser1Low resistance
19W. Dawaser2Low resistance
20W. Dawaser3Low resistance
21W. Dawaser4Low resistance
22Tabouk1High resistance
23Tabouk2High resistance
24Tabouk3High resistance
25Tabouk4High resistance
26Dwadmi1Moderate resistance
27Dwadmi2Moderate resistance
28Dwadmi3Moderate resistance
29Dwadmi4Moderate resistance
Table 2. List of SSR primers used and their basic features.
No.Primer NameForward Sequence (5′→3′)Reverse Sequence (5′→3′)Motif lReference EST Putative Function
1LT EST-SSR2CTTCATCTTC GGTAGCATCGCAAAACTTCGGTGGAGCAAT(TAAA)3gi|13661745|gb|AF321856.1| Lolium rigidum clone FHH-t putative cytochrome P450 mRNA, complete cds
2LT EST-SSR4TCGTGTTCGGTAGCATCGTAGCTACAGGAAAACTAGTGCCAAA(TAAA)4gi|13661743|gb|AF321855.1|Lolium rigidum clone FHH-v putative cytochrome P450 mRNA, complete cds
3LT EST-SSR5TCTAGACAAATCCGCGTCAAGAAGCACAGTTTTGGCAAGG(ATA)4gi|28172922|gb|AF343456.1| Lolium rigidum clone cyt2 cytosolic acetyl-CoA carboxylase (Acc-2) gene, partial cds
4LT EST-SSR6AAAGAAATGCGAGAGCTGGAAGGTCATTGTGGGTAGTGTGC(GCA)4gi|257721363|emb|HB811281.1Sequence 160495 from Patent EP2090662 Genomic DNA
5LT EST-SSR7TTACAACCGCTGATGAAGCAGCCAGGAACTTCACCCTGTA(GGT)4|gi|20975573|emb|AJ310767.1gi|20975573|emb|AJ310767.1| mRNA
6LT EST- SSR8GATATGGCTCGGACGAATAATCGAATGAAAATGCCAATAA(at)5gi|148340742|gb|EF379036.1| Lolium rigidum trnT-trnL intergenic spacer, partial sequence; chloroplast
7LT EST- SSR9AAGGGAATTGGATTTCAGATTCGAATGAAAATGCCAATAA(at)5gi|148340740|gb|EF379034.1|Lolium rigidum trnT-trnL intergenic spacer, partial sequence; chloroplast
8LT EST- SSR10GGCTCGGACGAATAATCTAACGATAAGGATCGAAGGAAAA(at)5gi|148340741|gb|EF379035.1|Lolium rigidum trnT-trnL intergenic spacer, partial sequence; chloroplast
9LT EST-C SSR1AGGAGACCATGAGGCTACACGCTAGTGCAAAGCCATCAC(GGA) 3, (TCA)3 (AG)3gi|13661761|gb|AF321864.1|Lolium rigidum clone Lol-5-v putative cytochrome P450 mRNA, complete cds
10LT EST-C SSR5CAGGGAACAATCATCCAGACCCCAAACGGCAGATACAT(TGC)3gi|13661755|gb|AF321861.1|Lolium rigidum clone Lol-31-b putative cytochrome P450 mRNA, complete cds
11LT EST-C SSR6CTACCTGCAGTGCATCGTCTGCCAAAACTTCGGTAGAGT(TAAA)4 (GCT)3, (CG)4gi|13661747|gb|AF321857.1|Lolium rigidum clone FHH-y putative cytochrome P450 mRNA, complete cds
12LT EST-C SSR8CACGGACACGATCTACAAGAGGTGTCCTCGATTGATTCAC(TGC)3, (GAG)3gi|148596801|dbj|AB097496.1|Lolium rigidum CYP71R4 mRNA for cytochrome P450, complete cds
13LT EST- C SSR9AGGCTTTTGGTTTACACGACCCCCAAAGGACGTACTAAAG(TTA)3, (CAA)3, (AT)3gi|110915824|gb|DQ786854.1|Lolium rigidum NADH dehydrogenase subunit F (ndhF) gene, partial cds; chloroplast
14LT EST- C SSR10AGTTGAACCTTGAACGTTATGTTCGTTTCTGGAGAAGCAACT(ATA)4 (ATT)3, (AC)3, (AT) 3gi|28172922|gb|AF343456.1|Lolium rigidum clone cyt2 cytosolic acetyl-CoA carboxylase (Acc-2) gene, partial cds
15LP EST SSR1GTAGTCCAGCGGAGGTCAATTACCTGGGCAAATCTTG(AG(23)LpSSR006 Lolium perenne clone LpSSR006 SSR marker sequence
16LP EST SSR3GGGGAAATACAGTTCTGCGATGCTCCTGCCTACTTTA(AG)16, (GA)5, (ATGA)3LpSSR020 Lolium perenne clone LpSSR020 SSR marker sequence
17LP EST SSR4ATGCACGGGTTTTATTCATTCGCGAGGCTTAAGGTGT(TG)20, (GA)23LpSSR023 Lolium perenne clone LpSSR023 SSR marker sequence
18LP EST SSR8CTAAACTAAATGTTCATCGTCCTGCTTACTCCTGTT(AC)26LpSSR082 Lolium perenne clone LpSSR082 SSR marker sequence
19LP EST SSR9GACCCCGAGACAGCCTAACGCATATGGTCTTCAGAA(TG)9, (GT)10LpSSR112Lolium perenne clone LpSSR112 SSR marker sequence
20LP EST SSR10CCGTTGCTTGATACTTGGACGAACGAGCATTCTTCCTTTCT(CTA)7DLF008 library Lolium perenne cDNA clone DLF008, mRNA sequence
21LP EST SSR7CCCATACTTCGAGGCATAAAAAATTCCCCCATCAGAGAAC(AC)29LpSSR076 Lolium perenne clone LpSSR076 SSR marker sequence
22LP EST SSR12GTGCAGCAGTTTGAATTGGAAGCATCGGGAGCTATGAATG (GA)14B1A2 (AJ872206.1)Festuca glaucescens x Lolium multiflorum microsatellite DNA, clone B1-A2
23LP EST SSR13AGGTGTCCTGTTGCTTTGGATTTACCCCCAGGGATCAAAT(TG)7B1B3 ( AJ872214.1)Festuca glaucescens x Lolium multiflorum microsatellite DNA, clone B1-B3
24LP EST SSR14CCAACTAGACAAAGGGGATTGGGAGAGCACCATTCATCCAT(TGA)8B2G6a (AJ872228.1)Festuca glaucescens x Lolium multiflorum microsatellite DNA, clone B2-G6
25TF EST SSR1GCACGAGGCTCTTTCCTCTAGGTGCTTGGCCTTCTTCC NFA020No Hits, PCR amplified Saha, 2004
26TF EST SSR3TCTGCAAGGTCACTGGATCAGGAGCAAGAAGGACGGAGAC NFA098No Hits, PCR amplified Saha, 2004
27LP SSR4CAAGTGCCACCATAGATACAACGTGAAGATCACTATAAACACGA(AG)8LPSSRH01D09Kindiger, 2006
28LP SSR6TCTGTGGGTCCTTCTGGATTCGGGTGATGATGTTGACTT(TCGC)6LPSSRH01F02Kindiger, 2006
29LP SSR7ATTGACTGGCTTCCGTGTTCGCGATTGCAGATTCTTG(CA)9LPSSRH01H06Kindiger, 2006
30LP SSR8TGGAATAACGATGAAAAGCATCACGAATTAACAAGAG LPSSRH02D11Kindiger, 2006
31LP SSR9GGACGAACTGCCGAGACACGGGCATGGTGAGAAGGA LPSSRK01A03Kindiger, 2006
Table 3. Analysis of variance for the studied morphological traits.
SovdfPlant HeightDays to HeadingPanicle LengthNo. of TillersFresh WeightDry Weight
Replecation24.1353.1671.83926,329.614,163.0558.977
genotypes28235.059**367.271**18.290**30,039.1**74,686.42**3120.700**
Error566.6047.2082.04211,978.6620,538.24707.568
Sov.: Source of variation, ** significant at 0.01.
Table 4. Means of the traits’ performances for the tested Lolium populations.
PopulationPlant HeightDays to HeadingPanicle LengthNo. of TillersFresh WeightDry Weight
Syngenta66.00103.1725.151240.671256.50278.35
Harad182.3377.6727.101211.331320.33283.80
Harad279.6777.3325.331285.331407.67305.23
Harad383.6777.0023.101346.001499.67324.87
Harad486.0074.6726.271510.331616.00352.53
Quaseim179.6777.0028.271173.001355.33294.90
Quaseim276.0076.3323.771158.671216.67272.63
Quaseim379.6778.3323.271196.001367.00303.60
Quaseim484.6777.3325.271088.001218.00279.33
Haiel166.3382.6720.701103.671291.33288.30
Haiel267.6782.0020.971200.331488.67312.50
Haiel364.6783.3319.101268.671634.00363.10
Haiel464.3381.0019.701378.001497.00329.40
Gouf165.6782.6723.831135.331384.33300.97
Gouf262.0081.3322.701154.331549.67329.87
Gouf362.3383.0023.231377.671671.33362.23
Gouf459.3382.6721.231294.331337.67285.53
WDawaser181.6765.3324.271313.001723.67374.60
WDawaser282.6764.6721.871175.331327.00301.67
WDawaser377.6770.6720.871164.001319.33299.90
WDawaser484.3364.3321.471286.001524.67330.60
Tabouk161.6792.6719.931140.331735.00377.03
Tabouk263.3393.0022.171138.671411.00300.17
Tabouk361.0093.0019.201353.671385.33309.23
Tabouk463.6794.6720.871282.001661.67365.80
Dwadmi165.0074.0025.431150.001275.00277.70
Dwadmi266.6776.3324.371209.671483.00324.93
Dwadmi378.0073.3327.001166.001286.67292.40
Dwadmi466.0073.3325.131139.671406.67308.60
LSD (0.05)4.204.382.33178.73234.0043.44
Table 5. Summary of 31 SSR primers results across 29 Lolium genotypes studied.
No.Primer IDTotal Number of BandsNumber of AllelesPolymorphic Alleles% PolymorphismPIC Value
1LT EST-SSR249221000.50
2LT EST-SSR453331000.61
3LT EST-SSR534221000.11
4LT EST-SSR657441000.61
5LT EST-SSR7321000
6LT EST- SSR8321000
7LT EST- SSR9321000
8LT EST- SSR10321000
9LT C SSR1107551000.76
10LT C SSR564331000.60
11LT C SSR661331000.50
12LT C SSR839221000.30
13LT C SSR9321000
14LT C SSR10321000
15LP EST SSR159221000.50
16LP EST SSR334221000.46
17LP EST SSR435221000.38
18LP EST SSR838331000.48
19LP EST SSR957221000.50
20LP EST SSR1059331000.56
21LP EST SSR746331000.65
22LP EST SSR1242331000.65
23LP EST SSR1332331000.65
24LP EST SSR1444441000.70
25TF EST SSR153441000.69
26TF EST SSR340331000.64
27LP SSR4321000
28LP SSR6321000
29LP SSR747331000.52
30LP SSR832221000.50
31LP SSR996441000.72
Total14347567
Average46.262.422.1674.190.41
Publisher’s Note: MDPI stays neutral with regard to jurisdictional claims in published maps and institutional affiliations.

