Abstract
Variable-rate spray systems with canopy leaf area density information detection are an important approach to reducing pesticide usage in orchard management. In order to estimate the canopy leaf area density using ultrasonic sensors, this article proposed three parameter model equations based on ultrasonic echo peaks for canopy leaf area density estimation and verified the accuracy of the three parameter model equations using laboratory-simulated canopy and outdoor tree experiments. The orthogonal regression statistics results from the laboratory-simulated canopy experiment indicated that parameter is more suitable for canopy leaf area density estimation compared to parameter and when the density ranges from 0.54 to 5.4 . The model equation from parameter has minor systematic errors, and the predicted and observed values of parameter have good agreement with the experimental conditions. The laboratory-simulated canopy and outdoor tree canopy leaf area density verification experiments of parameter were carried out, and the results indicated that the absolute value of the mean relative error is 5.37% in the laboratory-simulated canopy and 2.84% in outdoor tree experiments. The maximum absolute value of the relative error is 8.61% in the laboratory-simulated canopy and 14.71% in the outdoor tree experiments, and the minimum absolute value of the relative error is 3.21% in the laboratory-simulated canopy and 0.56% in the outdoor tree experiments. The laboratory-simulated canopy leaf area density verification results showed that the mean relative errors under canopy leaf area density 0.98 and 4.92 conditions are 6.29% and 5.82%, respectively, which is larger than the mean relative error under 2.95 ; nevertheless, these results proved that this model equation is applicable for canopy information detection and advanced pesticide application development in future.
1. Introduction
Pesticide application is one of the most important factors in agricultural production processes to ensure the quality and yield of agricultural production. The excessive use of pesticides in pest control increases pesticide resistance, environmental contaminants, and labor hazards [1,2]. Precision pesticide application technology based on plant sensing is one of the effective ways to reduce pesticide dosage and cost, especially in orchard management; the tree-canopy sensing technique and variable-rate spray systems can significantly reduce pesticide dosage and off-target drifts [3,4,5]. Variable-rate spray systems based on canopy information detection usually have an automatic adjustment function for the pesticide rate. Variable-rate spray systems developed for pesticide sprayers can adjust the pesticide flow rate in real-time according to the canopy geometric dimension, canopy leaf area density, or spray distance, which is obtained from sensors in real-time; therefore, the pesticide droplet deposition is mainly affected by the tree canopy and sensor detection method [6,7].
Previously, researchers have analyzed the tree-canopy-volume detection methods in forests using images from remote sensing technology, but due to the limitation of image resolution and quality, remote sensing technology is not available in single-tree-canopy-volume detection and cannot accurately detect tree-canopy information in real-time [8,9]. With the development of sensor technology for pesticide applications, sensors such as infrared, laser, machine vision, and ultrasonic are widely used in tree-canopy information detection. In pesticide application practices, infrared sensors could be easily disturbed by external light intensity and canopy color depth, and the detailed size of the target canopy cannot be detected [10,11]. Light Detection and Ranging (LIDAR) systems were used to detect the 3-D structure and canopy density of the trees in the orchard and vineyard, and the results indicated good correlations between the manual and sensor measuring results. As a non-destructive method in canopy detection, LIDAR measuring technology showed potential for pesticide applications; nevertheless, the expensive process unit and 3-D points cloud real-time algorithm still needs to be improved for LIDAR system applications [12,13]. Asaei et al. [14] developed a site-specific orchard sprayer with a machine vision sensor that could detect the spacing of the trees along the orchard rows, and the orchard sprayer avoided pesticide waste compared to a conventional continuous sprayer, which sprays pesticide in the spacing between the trees. The field tests indicated that the site-specific orchard sprayer resulted in 54% less pesticide use compared with conventional sprayers; nevertheless, the vision sensor system requires further research for more orchard models, and it is also easily affected by light conditions. Ultrasonic sensors are a widely used technology in industry, they are less affected by light and weather conditions, which is suitable in many application areas, and they are also more suitable for tree-canopy detection than other sensors under outdoor conditions. Former research showed that ultrasonic sensors could not only be used to measure distance but also detect the tree-canopy information in agriculture applications; considering its low cost and high-reliability characteristics, ultrasonic sensors have a good potential for application [15,16,17,18]. Palleja et al. [19,20] proposed a real-time estimation method of canopy density by using ultrasonic sensors; the experiments in greenhouse and orchards indicated that the ultrasonic signal is highly correlated with the canopy density, and the maximum relative error was about 14.1% under vineyards condition. The system could also be used in apple or vineyard tree monitoring during the whole-life growing season; nevertheless, the accuracy of the real-time detection method still needs improvement. Gil et al. [21] developed a variable-rate multi-nozzle air blast sprayer with ultrasonic sensors; the spray rate was modified according to the crop width, which was detected by the ultrasonic sensor in an undirected way, and the experimental results indicated that the sprayer saved 58% of the pesticide compared to the normal continuous sprayer, and there were no significant differences between the sprayers. Zhai et al. [22] established the canopy model equations of a planar orchard target that could be used to calculate the canopy density in real-time, and this study proposed a time-domain energy analysis method for canopy density detection through ultrasonic echo signal. There was good applicability between the model and planar orchard target when under four layers of leaves; nevertheless, the maximum relative error of the model equations from the experimental data was about 29.92%, which requires improvement for future applications. In order to reduce the relative error of the canopy model from the planar orchard target, Nan et al. [23] designed a cylindrical simulated canopy and established a new model equation for the canopy leaf area density calculation. This model equation considered the mean value of the ultrasonic echo signal for the canopy leaf area density calculation, and the laboratory test results showed that the relative error between the observed and predicted echo signal ranged from 1.02 to 16.8%, and the outdoor test showed that the relative error between the observed and predicted canopy leaf area density ranged from 0.23 to 35.5%. Ou et al. [24] proposed a new algorithm for measuring tree-canopy thickness based on ultrasonic echo signal and verified that the method is effective under laboratory and outdoor conditions. The results indicated that the ultrasonic sensor had a high measurement accuracy for canopy-thickness detection. The maximum relative errors in the laboratory and outdoor test results were 8.8% and 19.4%, respectively; the thickness calculation algorithm also provided a new perspective on ultrasonic echo signal analysis in the tree canopy, this study demonstrated that the ultrasonic echo signal is affected by the canopy thickness and leaves on the ultrasonic waves propagation path.
Previous studies indicated that ultrasonic sensors have good robustness and potential for agriculture applications, and the canopy information, such as the leaf area density and thickness, could be calculated and predicted by the ultrasonic echo signal, which could be very useful for pesticide application in orchard management. Nevertheless, the relative error of the leaf area density equations in these articles is still too large and unstable, which could affect the pesticide droplet deposition and uniformity. The objectives of this article are to establish and analyze the mathematical model equations between the canopy leaf area density and the ultrasonic echo signal and to verify the accuracy and applicability of mathematical model equations through laboratory-simulated canopy experiments and outdoor tree canopy experiments. The simulated leaves used in this paper are beneficial to the repeatability and controllability of the changes in the modeling parameters; the different characteristics of plant species and leaves will have some effect on the accuracy of mathematical modeling. The ultrasonic echo signal intensity is basically affected by the size of the obstacle in the ultrasonic wave’s propagation path, so this study used simulated leaves, which have similar sizes to the Osmanthus tree used in the verification experiment. The mathematical model equation established by the method proposed in this paper could be used in the real-time detection of canopy leaf area density with minor errors, which could also provide an effective and reliable real-time canopy leaf area density estimation solution for variable-rate sprayer system development.
2. Materials and Methods
2.1. Laboratory-Simulated Canopy Experimental Setup
To measure the canopy leaf area density with an ultrasonic sensor, a laboratory-simulated canopy experiment system was built, as shown in Figure 1. The system was composed of a simulated canopy, a computer, a 12V DC power unit (6-QW, Camel Group Co., Ltd., Xiangyang, China), a USB data acquisition card (USB3200, Beijing ART Technology Development Co., Ltd., Beijing, China), an ultrasonic sensor (MB7092-101, MaxBotix, Inc, Brainerd, MN, USA), and a microprocessor control board (STM32F4 development board, Guangzhou Xingyi Electronic Technology Co., Ltd., Guangzhou, China).
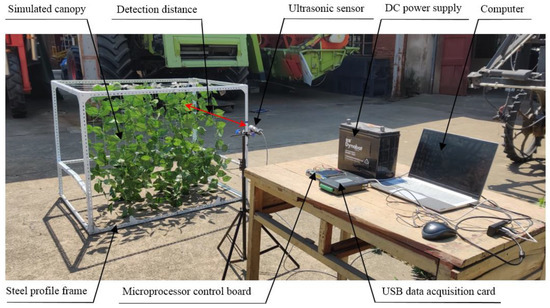
Figure 1.
Simulated canopy leaf area density detection system.
The simulated canopy had a similar leaf distribution and leaf area density to the tree target; it was designed for the laboratory-simulated canopy experiment. The ultrasonic sensor refresh rate was 10 Hz, and it had one pin for the analog voltage envelope output with the acoustic waveform. The maximum measurement range was 7.65 m, and the diffusion angle of the ultrasonic sensor was about 14° [24]. The USB data acquisition card was used to convert the analog voltage envelope output into a digital signal, which had a 12-bit ADC conversion chip to achieve a maximum conversion rate of up to 500 KHz in data receiving and transferring, and the conversion rate used in this system was 125 KHz. An operating software installed in the computer was used to save the digital signal information from the USB data acquisition, the start and stop of the data acquisition task could be manually controlled in the experiment process, and the digital signal sampling frequency and the sampling times could be set through the operating software according to the experimental requirements. The microprocessor control board was supplied by a 12V DC power unit and offered stable voltage input for the ultrasonic sensor, which means that the system is available in the laboratory and outdoor conditions.
The simulated canopy was composed of a steel profile frame, simulated leaves, and nylon wires, the diameter of the nylon wire was 0.468 mm, and it was less than the wavelength of the ultrasonic sensor, so it barely affects the ultrasonic propagation, which is also adopted in reference [24]. The size of the steel profile frame (length × width × height) was 200 cm × 90 cm × 110 cm, and due to the steel profile frame boundary, the size of the simulated canopy was about 140 cm × 75 cm × 80 cm, and the simulated leaf used in the experiments was heart-shaped, and the average area was about 44 cm2. The simulated canopy had 2, 3, 4, or 5 planar leaf layers in the experiments, each layer had many simulated leaves, which were fixed on the nylon wires, and the nylon wires were arranged up and down in the steel profile frame. The nylon wires are moveable in the simulated canopy, which is convenient for adjusting the simulated canopy thickness and leaf area density, similar to the experimental setup used in reference [21]. The leaves on the nylon wires are basically evenly arranged along the wires according to the number of leaves. The temperatures ranged from 20 to 25 °C, and the humidity ranged from 38 to 50%.
2.2. Canopy Leaf Area Density Estimation Equations
The pesticide application with canopy leaf-area-density detection is an effective way for pesticide rate control and reduction. Canopy leaf-area density refers to the sparseness of leaves in the tree canopy, which is an important parameter in describing canopy characteristics and pesticide application target volume assessments. The canopy leaf area density can be expressed as follow:
In Equation (1), () is the canopy leaf area density, n is the total number of leaves in the canopy space, S () is the total area of leaves in the canopy space, V () is the space volume of the canopy space, i is the number of the leaf, () is the area of the leaf.
Ou et al. [24] found out that the ultrasonic echo signal is mostly affected by the detection distance, canopy density, and geometric dimension, and the ultrasonic echo signal contains multiple echo peaks, which are directly related to the leaves in the ultrasonic waves propagation path, and this study indicated that there are multiple reflections happening when the ultrasonic waves pass the tree canopy. Zhai et al. [22] proposed a time-domain energy analysis method that considered the whole range of ultrasonic echo signals in the canopy leaf area density estimation, and there is a correlation between the echo energy and canopy leaf area density; nevertheless, there is also a relative error in the verification results. Based on the former studies and data results, considering the ultrasonic waves propagation process and characteristics in the tree canopy, in order to predict the canopy leaf area density with higher accuracy, this article proposed three parameters (, and ), which are calculated by the ultrasonic echo peaks to estimate the canopy leaf area density. Parameters , , and have different expression equations, as shown in Equations (2)–(4). are the value of peaks in the ultrasonic echo signal, as shown in Figure 2, and the parameters were processed using the MATLAB 2015b software (Math Works, Natick, MA, USA).
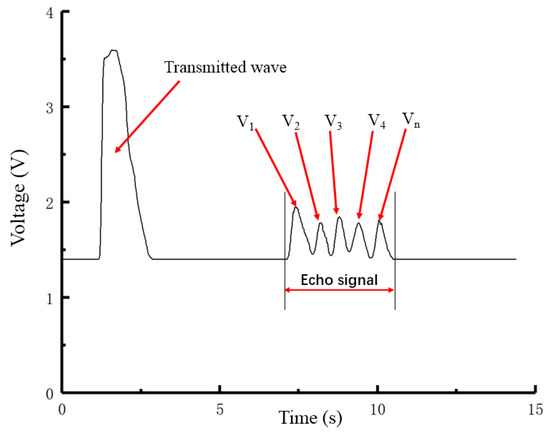
Figure 2.
Schematic of ultrasonic return wave.
In Equations (2)–(4), , and (Voltage) are the proposed parameters for canopy leaf-density estimation, , , , (Voltage) are the peaks values in the ultrasonic echo signal, and n is number of the peaks in the ultrasonic echo signal.
2.3. Experiment to Establish Canopy Leaf Area Density Model
2.3.1. Orthogonal Regression Experiment Design
Based on the former studies used in canopy information estimation, this article used the orthogonal regression central composite experiment setup in the experiment design, which selects the representative experimental points in the multi-factor and multi-level experimental conditions. Through the analysis of orthogonal experimental results, the relationship between the factors and variables based on the experimental results can be concluded, which reduces the work and cost of the experiments compared to full-scale experiments, it also improves the work efficiency, and saves time [22]. In order to conclude the canopy leaf area density model, the experimental factors were canopy leaf area density and the detection distance. The detection distance is the distance between the ultrasonic sensor and the target canopy along the ultrasonic wave direction, as shown in Figure 1, parameters , and are the experimental result values.
According to the normal orchard plant mode and pesticide application requirements, the detection distance in this experiment ranged from 0.5 to 1.5 m, and the canopy leaf area density ranged from 0.54 to 5.4 . The total number of experiments N in this experiment consisted of three parts: the number of orthogonal experiments , the number of zero-level repeated experiments , and the number of axial experiments , where p is the number of experimental factors.
In this experiment, the number of experimental factors p is 2, and the number of zero-level repeated experiments is 3. According to Equation (7), the total number of experiments is 11. Another important parameter, , in the experiment is the star arm parameter, = 1.13 obtained by Equation (8).
In this experiment, the detection distance (m) and canopy leaf area density () were selected as the experimental factors, which were denoted as and . The factor levels coding were as shown in Table 1, and the experimental scheme was designed according to this table, as shown in Table 2. The normative variables of the regression equation were and .

Table 1.
Factor levels coding.
Table 2.
Binary quadratic regression orthogonal combination design coding.
2.3.2. Detection Points Arrangement
The ultrasonic sensor aimed at the simulated canopy direction was installed in front of the simulated canopy, as shown in Figure 1, and the detection point was the position where the ultrasonic wave passes through the simulated canopy. There were 9 detection points arranged in front of the simulated canopy, as shown in Figure 3, and in order to avoid the influence of the steel profile frame boundary during the ultrasonic detection, the left and right edge detection points were 70 cm away from the frame boundary horizontally, and the upper and lower edge points were 30 cm away from the frame boundary vertically. The horizontal spacing between the detection points was 30 cm, and the vertical spacing between the detection points was 20 cm, at each of the 9 detection points, the values of parameters and were obtained by three replicated measurements, and the average values were used as the experimental results. During the experiment period, the environmental temperatures ranged from 20 to 25 °C, and the relative humidity ranged from 40 to 51%.
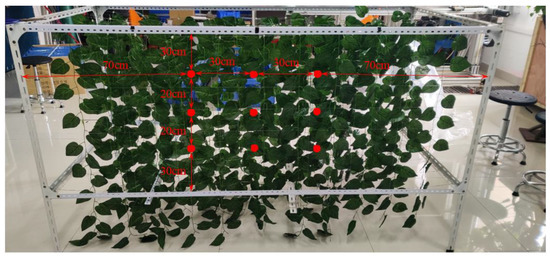
Figure 3.
Detection points in front of Simulated canopy.
2.4. Laboratory-Simulated Canopy Verification
To verify the accuracy and applicability of the canopy leaf area density model equation under laboratory-simulated canopy conditions, this article designed nine verification conditions with different distances and canopy leaf area densities, which were different to the conditions in Table 2. The verification experiments were also carried out with the laboratory-simulated canopy experimental system stated in Section 2.1.
The canopy leaf area density of the nine verification conditions were 0.98, 2.95, 4.92 , respectively, and the detection distances were 0.8, 1.0, 1.2 m, respectively. The detection points were selected as described in Section 2.3.2, and each point was also measured three times.
2.5. Outdoor Tree Canopy Verification
To verify the accuracy and applicability of the canopy leaf area density model equation under outdoor tree canopy conditions, three Osmanthus trees were selected as the experimental objects in place (32°12′22″ N,119°31′14″ E) on April 2022, as shown in Figure 4. The environmental temperature ranged from 10 to 20 °C, and the relative humidity ranged from 45 to 57%. There were 15 detection points that were arranged in front of the canopies randomly. The calculation formula of canopy leaf area density in experiments is expressed in Equation (10) according to former studies and ultrasonic wave propagation law in reference [24].
where, is the volume within the effective detection range (); r is the lower radius of the effective area (m); D is the ultrasonic penetration of canopy distance along the detection direction (m); is the canopy leaf area density by manual measurement (); is the average leaf area (); and Ni is the total number of leaves in the effective volume. According to the definitions, there were 30 leaves collected from the upper, middle, and lower locations of the tree canopy, respectively. Commercial image analysis code IPP (Image Pro Plus, Meyer instruments, Inc., Houston, TX, USA) was used to measure the leaf area after leaf scanning. The average leaf area was about , and the canopy leaf area density of the selected detection points ranged from 1.80 to 5.88 .
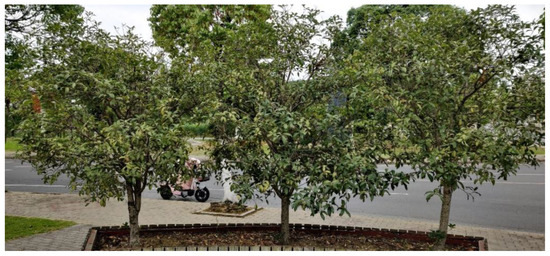
Figure 4.
Osmanthus trees for outdoor verification.
3. Results
3.1. Mathematical Model Analysis
The laboratory-simulated canopy experimental results based on the parameters , , and are shown in Table 3, these results could be used to analyze the relationships between the canopy leaf area density, detection distance, and the parameters.
Table 3.
Laboratory-simulated canopy experimental results.
The regression statistics of canopy leaf area density models based on the three parameters are shown in Table 4. All the coefficient of the models are larger than 0.90, which means the experimental and predicted values of the three parameters are in good agreement. The p-values are all smaller than 0.05, which means the three canopy leaf area models are significant; meanwhile, only the Lack of Fit p-value of is bigger than 0.05, which means that the canopy leaf area model based on parameter is more suitable for estimating the canopy leaf area density.
Table 4.
Analysis of model results.
The analysis of variance of the canopy leaf density model based on is shown in Table 5, the F value of the model is 29.80, and the p-value is 0.0010, which indicate that the mathematical model of the canopy leaf-area density is very significant. The F value of the lack of fit is 13.01, and the p-value is 0.0722, which indicate that the lack of fit of the canopy density model is not significant. The p-value of X1 × X2 is 0.2745, which indicates that X1 × X2 is not significant in the mathematical model equation and could be ignored in the model equation.
Table 5.
Analysis of variance of the mathematical model based on .
After removing X1 × X2 from the mathematical model equation, the new analysis of variance of the canopy leaf-density model based on is shown in Table 6, the F value of the model is 34.01, and the p-value is 0.0003, which indicate that the mathematical model of canopy leaf area density is very significant. The F value of the lack of fit is 12.85, and the p-value is 0.0735, which indicate that the lack of fit of the canopy density model is not significant, and the mathematical model could be used in canopy leaf area density prediction. Based on the above analysis, the model equation is expressed with Equation (11).
where, is the value of predicted parameter (V), is the detection distance (m), and is the canopy leaf area density ().
Table 6.
Analysis of variance of the regression equation.
The scatter plot of the observed versus the predicted parameter from the laboratory-simulated canopy experimental result is shown in Figure 5, which reflects the fitting degree of the mathematical model equation to the experimental data, and the value of predicted parameter was calculated with Equation (11). There is a smaller systematic estimation error between the observed and the predicted parameter , compare with the mean echo voltage parameter used by Nan et al. [23], and there is no systematic underestimation situation in the results shown in Figure 5. Meanwhile, this result showed a stronger linear (R2 = 0.96) than the results in reference [23] (R2 = 0.944), the agreement between the predicted and the observed showed potential for parameter and canopy leaf-area density prediction.

Figure 5.
Scatter plot of observed vs. predicted parameter .
3.2. Laboratory-Simulated Canopy Verification Results
The laboratory-simulated canopy verification experiment was carried out, and the results are listed in Table 7. There were nine conditions under three different detection distance and canopy leaf area density, the detection distance range from 0.8 to 1.2 m, the canopy leaf area density ranged from 0.98 to 4.92 , these experimental conditions are consistent with the real situation of some orchard pesticide applications. The relative error between the observed and predicted is listed in Table 7, and the observed values were calculated from the experimental results according to Equation (4), and the predicted values were calculated according to Equation (11). The maximum absolute value of the relative error is 8.61%, the minimum absolute value of relative error is 3.21%, and the absolute value of the mean relative error is 5.37%. The mean relative errors under the detection distance 0.8, 1.0 and 1.2 m conditions are 4.47%, 4.15%, and 2.49%, respectively, and the mean relative errors under canopy leaf-area density 0.98, 2.95, and 4.92 conditions are 6.29%, −0.99%, and 5.82%, respectively.
Table 7.
Laboratory-simulated canopy verification experiment results.
Zhai et al. [22] established the model equation for canopy-density estimation through similar laboratory-simulated canopy experiments, and the results showed that the maximum and minimum absolute value of relative error are 29.92% and 1.23%, respectively, and the absolute value of the mean relative error was 13.4%. Compared to the results from reference [22], the maximum absolute value, mean value, and value variable based on parameter are much smaller. These results indicated that the equation based on parameter has better applicability and accuracy in laboratory-simulated canopy leaf-area density detection.
3.3. Outdoor Tree Canopy Verification Results
The outdoor tree canopy verification experiment was carried out, and the results are listed in Table 8. There were 15 detection points results with different detection distances and canopy leaf-area densities, and the detection distances were calculated by the time difference between the transmitted wave and peak value V1, according to the ultrasonic distance measurement principle, and considering the real situation of some orchard pesticide applications. The canopy leaf-area density ranges from 1.80 to 5.88 . The maximum absolute value of the relative error is 14.71%, the minimum absolute value of relative error is 0.56%, and the absolute value of mean relative error is 2.84%.
Table 8.
Outdoor tree canopies verification experiment results.
Nan et al. [23] conducted similar outdoor tree-canopy detection experiments with different model equations, and the results showed that the maximum and minimum absolute value of relative error are 35.5% and 0.23%, respectively, and the absolute value of mean relative error is 15.7%. Compared with the results from reference [23], the maximum absolute value, mean value, and value variable based on parameter are much smaller. The outdoor tree canopy verification experiments also proved that the equation based on parameter has better applicability and accuracy in tree canopy leaf-area density detection.
As shown in Table 8, these results verified the accuracy and applicability of the model equation based on parameter , and indicated that the model equation has good potential in canopy leaf-area density prediction and detection for pesticide application in orchards.
4. Discussion
Previous researchers studied and verified the quantitative relationship between the canopy characteristics and the ultrasonic echo signals, compared with the previous method of canopy leaf area-density detection in reference [19,22,23], this article studied new parameters for the detection and prediction of canopy leaf-area density based on the peaks value of an ultrasonic echo signal. Some previous articles demonstrated that the ultrasonic echo signal was affected by the detection distance and canopy leaf-area density, the peaks in the echo signal were affected and coursed by the canopy targets, such as leaves and branches, and the ultrasonic multiple reflection phenomenon was confirmed and studied before. In order to study the detail of the echo signal, Ou et al. [24] proposed a new theory about canopy thickness detection and verified the canopy-thickness calculation formula; the results proved that the peaks in the echo signal were coursed by the ultrasonic multiple reflection phenomenon on the ultrasonic waves propagation path, the peaks indicated that the leaves, branches, or other objects when the ultrasonic sensor was used in canopy detection, this ultrasonic multiple reflection phenomenon provided the theoretical basis for the canopy information detection with ultrasonic sensor.
Previous researchers used average or time-domain parameters of the ultrasonic echo signal in the canopy leaf-area density estimation equations; nevertheless, they require the identification of the echo signal boundary and to process more voltage data out of the echo signal. Considering the theory basis of echo signal in canopy detection, this article proposed parameter , and , which are directly calculated by ultrasonic echo peaks for canopy leaf-area density estimation. Compared with the parameters calculated with a whole ultrasonic echo signal, parameters , , and require fewer signal data and could be suitable in real-time detection. The orthogonal regression analysis of the parameters based on laboratory-simulated canopy experiments showed that the model equation based on parameter is significantly more suitable for canopy leaf-area density estimation, and the interaction factor of the detection distance and the canopy leaf-area density has no significant influence on the parameter prediction. The scatter plot of the observed versus predicted parameter from the laboratory-simulated canopy experiment proved that the predicted and the observed parameter were in good agreement within the experimental conditions.
The laboratory-simulated canopy leaf area density verification results showed that Equation (11) could be used to predict parameter within a good accuracy, the absolute value of the mean relative error is 5.37%, and the maximum absolute value of the relative error is 8.61%. The mean relative errors under the canopy leaf-area density of 0.98 and 4.92 conditions are 6.29% and 5.82%, respectively, which are larger than the mean relative error under 2.95 , this is a result of the ultrasonic wave penetration effect, and the leaves on the ultrasonic waves propagation path have major and complex influences on parameter prediction. When the canopy leaf area density is lower, the ultrasonic wave will pass through the canopy, and when the canopy leaf area density is higher, the penetration distance of the ultrasonic wave is smaller than the canopy thickness, and the ultrasonic echo signal in lower or higher canopy leaf-area density has different reflection characteristics, and the penetration distance changes are mainly affected by the canopy leaf area density.
The outdoor tree canopy leaf area density verification results showed that the absolute value of mean relative error is 2.84%, which is lower than the laboratory-simulated canopy verification result. The maximum absolute value of relative error is 14.71%, which is larger than the laboratory-simulated canopy verification result, which could result from the branches in the tree canopy, which were different from the laboratory-simulated canopy conditions. The branches in the tree canopy will also cause some echo peaks in the ultrasonic echo signal. Even though the ultrasonic echo signal intensity is basically affected by the size of the obstacle in the ultrasonic wave’s propagation path, the shape difference between the leaves in the laboratory and field experiments could also cause some additional data errors. For specific target crop detection, the shape characteristics of the leaves could be considered in the model-building experiments. For agriculture pesticide application, these errors are acceptable to some extent, and these results showed good applicability in canopy leaf-area density detection for Osmanthus trees.
Compared with the previous verification results from reference [22,23], the maximum absolute value, mean value, and value variable based on parameter are much smaller than the previous results in reference [22,23]. These results indicated that the equation based on parameter has better applicability and accuracy in canopy leaf-area density detection.
This article analyzed and established the mathematical model equations for canopy leaf-area density detection with an ultrasonic sensor and studied the relative errors under laboratory-simulated canopy and outdoor trees conditions, and the results showed that the model equations based on parameter have a good accuracy and applicability for real-time canopy leaf-area density estimation in the pesticide application field. For the next development plan, the variable-rate spray system based on the canopy leaf area density detection using ultrasonic sensors is available, and in order to achieve higher accuracy, the leaf area and branch factors should also be considered and studied in future experiments.
5. Conclusions
This article proposed and analyzed three new parameter model equations for canopy leaf-area density estimation, the orthogonal regression experiment based on laboratory-simulated canopy indicated that the model equation based on parameter is suitable for parameter and canopy leaf area density predictions.
The laboratory-simulated canopy and outdoor tree canopy leaf area density verification experiments were carried out within the designed conditions, and these results indicated that the absolute value of the mean relative error is 5.37% in the laboratory-simulated canopy experiment and 2.84% in the outdoor tree experiment, and the maximum absolute value of the relative error is 8.61% in the laboratory-simulated canopy experiment and 14.71% in the outdoor tree experiment, these results proved the applicability of this model equation for pesticide application detection.
The laboratory-simulated canopy verification experiment showed that the relative errors were affected by leaf area density, and the relative errors became larger under higher and lower density conditions; nevertheless the relative error values are acceptable in practice. When using the model building method proposed in this article, it is recommended to consider the characteristics of the target plant species and the leaves, which will improve the accuracy of the model building.
According to the studies above, the model equation based on parameter showed better potential and accuracy for canopy leaf-area density estimation than previous model equations. The previous study demonstrated that the peak values in an ultrasonic echo signal could be used in canopy thickness estimation within an acceptable accuracy [24]. These studies revealed the ultrasonic wave multiple reflection phenome and law in canopy detection and proved that the echo peaks are mostly caused by the leaves and branches in the canopy.
This study established and proved the mathematical models of canopy leaf-area density detection using an ultrasonic sensor and expanded the capability and function of ultrasonic sensors in agriculture pesticide applications. For future research, considering both the canopy thickness and leaf-area density information could be calculated from ultrasonic echo peaks with good accuracy, combining ultrasonic detection and variable-rate spray systems in advanced orchard sprayer development will be one of the most effective ways to reduce chemical usage in orchard management.
Author Contributions
Conceptualization, M.O. and W.J.; methodology, M.O., T.H., M.H., S.Y., M.W., L.J. and X.W.; validation, M.O. and X.D.; formal analysis, T.H., M.H. and S.Y.; data curation, T.H., M.H. and S.Y.; writing—original draft preparation, T.H., M.H. and S.Y.; writing—review and editing, M.O., T.H., M.H. and S.Y.; supervision, M.O. and W.J.; funding acquisition, M.O. and W.J. All authors have read and agreed to the published version of the manuscript.
Funding
This work was funded by the Project of Faculty of Agricultural Equipment of Jiangsu University (grant number NZXB20200204, NZXB20210101), the Jiangsu Agriculture Science and Technology Innovation Fund (JASTIF) (CX(20)3065).
Institutional Review Board Statement
Not applicable.
Informed Consent Statement
Not applicable.
Data Availability Statement
The data are available within the article.
Acknowledgments
The authors thank Faculty of Agricultural Equipment of Jiangsu University and the High-tech Key Laboratory of Agricultural Equipment and Intelligence of Jiangsu Province for the facilities and support.
Conflicts of Interest
The authors declare no conflict of interest.
References
- Appah, S.; Jia, W.; Ou, M.; Wang, P.; Asante, E.A. Analysis of Potential Impaction and Phytotoxicity of Surfactant-Plant Surface Interaction in Pesticide Application. Crop Prot. 2020, 127, 104961. [Google Scholar] [CrossRef]
- Lu, X.; Garcia-Ruiz, F.; Fabregas, F.X. Pesticide dose based on canopy characteristics in apple trees: Reducing environmental risk by reducing the amount of pesticide while maintaining pest and disease control efficacy. Sci. Total Environ. 2022, 826, 154204. [Google Scholar] [CrossRef]
- Abbas, I.; Liu, J.; Faheem, M.; Noor, R.S.; Shaikh, S.A.; Solangi, K.A.; Raza, S.M. Different Sensor Based Intelligent Spraying Systems in Agriculture. Sens. Actuators Phys. 2020, 316, 112265. [Google Scholar] [CrossRef]
- Nan, Y.; Zhang, H.; Xu, Y.; Jiao, X.; Zheng, J.; Liu, D. Research progress on profiling target spray and its control technology in agriculture and forestry. World For. Res. 2018, 31, 54–58. [Google Scholar]
- Salcedo, R.; Zhu, H.; Jeon, H.; Ozkan, E.; Wei, Z.; Gil, E. Characterisation of activation pressure, flowrate and spray angle for hollow-cone nozzles controlled by pulse width modulation. Biosyst. Eng. 2022, 218, 139–152. [Google Scholar] [CrossRef]
- Jeon, H.Y.; Zhu, H. Development of a Variable-Rate Sprayer for Nursery Liner Applications. Trans. ASABE 2012, 55, 303–312. [Google Scholar] [CrossRef]
- Dou, H.; Zhang, C.; Li, L.; Hao, G.; Ding, B.; Gong, W.; Huang, P. Application of Variable Spray Technology in Agriculture. IOP Conf. Ser. Earth Environ. Sci. 2018, 186, 012007. [Google Scholar] [CrossRef]
- Mäkelä, H.; Pekkarinen, A. Estimation of Forest Stand Volumes by Landsat TM Imagery and Stand-Level Field-Inventory Data. For. Ecol. Manag. 2004, 196, 245–255. [Google Scholar] [CrossRef]
- Carreiras, J.M.B.; Pereira, J.M.C.; Pereira, J.S. Estimation of Tree Canopy Cover in Evergreen Oak Woodlands Using Remote Sensing. For. Ecol. Manag. 2006, 223, 45–53. [Google Scholar] [CrossRef]
- Solanelles, F.; Escolà, A.; Planas, S.; Rosell, J.R.; Camp, F.; Gràcia, F. An Electronic Control System for Pesticide Application Proportional to the Canopy Width of Tree Crops. Biosyst. Eng. 2006, 95, 473–481. [Google Scholar] [CrossRef]
- Giles, D.K.; Klassen, P.; Niederholzer, F.J.A.; Downey, D. “Smart” Sprayer Technology Provides Environmental and Economic Benefits in California Orchards. Calif. Agric. 2011, 65, 85–89. [Google Scholar] [CrossRef]
- Rosell Polo, J.R.; Sanz, R.; Llorens, J.; Arnó, J.; Escolà, A.; Ribes-Dasi, M.; Masip, J.; Camp, F.; Gràcia, F.; Solanelles, F.; et al. A Tractor-Mounted Scanning LIDAR for the Non-Destructive Measurement of Vegetative Volume and Surface Area of Tree-Row Plantations: A Comparison with Conventional Destructive Measurements. Biosyst. Eng. 2009, 102, 128–134. [Google Scholar] [CrossRef]
- Rosell, J.R.; Llorens, J.; Sanz, R.; Arnó, J.; Ribes-Dasi, M.; Masip, J.; Escolà, A.; Camp, F.; Solanelles, F.; Gràcia, F.; et al. Obtaining the Three-Dimensional Structure of Tree Orchards from Remote 2D Terrestrial LIDAR Scanning. Agric. For. Meteorol. 2009, 149, 1505–1515. [Google Scholar] [CrossRef]
- Asaei, H.; Jafari, A.; Loghavi, M. Site-Specific Orchard Sprayer Equipped with Machine Vision for Chemical Usage Management. Comput. Electron. Agric. 2019, 162, 431–439. [Google Scholar] [CrossRef]
- Llorens, J.; Gil, E.; Llop, J.; Escolà, A. Ultrasonic and LIDAR Sensors for Electronic Canopy Characterization in Vineyards: Advances to Improve Pesticide Application Methods. Sensors 2011, 11, 2177–2194. [Google Scholar] [CrossRef]
- Jeon, H.Y.; Zhu, H.; Derksen, R.C.; Ozkan, H.E.; Krause, C.R.; Fox, R.D. Performance Evaluation of a Newly Developed Variable-Rate Sprayer for Nursery Liner Applications. Trans. ASABE 2011, 54, 1997–2007. [Google Scholar] [CrossRef]
- Tewari, V.K.; Chandel, A.K.; Nare, B.; Kumar, S. Sonar Sensing Predicated Automatic Spraying Technology for Orchards. Curr. Sci. 2018, 115, 1115–1123. [Google Scholar] [CrossRef]
- Tumbo, S.D.; Salyani, M.; Whitney, J.D.; Wheaton, T.A.; Miller, W.M. Investigation of laser and ultrasonic ranging sensors for measurements of citrus canopy volume. Appl. Eng. Agric. 2002, 18, 367–372. [Google Scholar] [CrossRef]
- Palleja, T.; Landers, A.J. Real Time Canopy Density Estimation Using Ultrasonic Envelope Signals in the Orchard and Vineyard. Comput. Electron. Agric. 2015, 115, 108–117. [Google Scholar] [CrossRef]
- Palleja, T.; Landers, A.J. Real Time Canopy Density Validation Using Ultrasonic Envelope Signals and Point Quadrat Analysis. Comput. Electron. Agric. 2017, 134, 43–50. [Google Scholar] [CrossRef]
- Gil, E.; Escolà, A.; Rosell, J.R.; Planas, S.; Val, L. Variable Rate Application of Plant Protection Products in Vineyard Using Ultrasonic Sensors. Crop Prot. 2007, 26, 1287–1297. [Google Scholar] [CrossRef]
- Li, H.; Zhai, C.; Weckler, P.; Wang, N.; Yang, S.; Zhang, B. A Canopy Density Model for Planar Orchard Target Detection Based on Ultrasonic Sensors. Sensors 2017, 17, 31. [Google Scholar] [CrossRef] [PubMed]
- Nan, Y.; Zhang, H.; Zheng, J.; Bian, L.; Li, Y.; Yang, Y.; Zhang, M.; Ge, Y. Estimating Leaf Area Density of Osmanthus Trees Using Ultrasonic Sensing. Biosyst. Eng. 2019, 186, 60–70. [Google Scholar] [CrossRef]
- Zhou, H.; Jia, W.; Li, Y.; Ou, M. Method for Estimating Canopy Thickness Using Ultrasonic Sensor Technology. Agriculture 2021, 11, 1011. [Google Scholar] [CrossRef]
Publisher’s Note: MDPI stays neutral with regard to jurisdictional claims in published maps and institutional affiliations. |
© 2022 by the authors. Licensee MDPI, Basel, Switzerland. This article is an open access article distributed under the terms and conditions of the Creative Commons Attribution (CC BY) license (https://creativecommons.org/licenses/by/4.0/).