Article

Relationships between Dairy Cows’ Chewing Behavior with Forage Quality, Progress of Lactation and Efficiency Estimates under Zero-Concentrate Feeding Systems

1
Research Institute of Organic Agriculture (FiBL), Ackerstrasse 113, 5070 Frick, Switzerland
2
Bayerische Landesanstalt für Landwirtschaft, Prof-Dürrwaechter-Platz 2, 85586 Poing, Germany
*
Author to whom correspondence should be addressed.
Agriculture 2022, 12(10), 1570; https://doi.org/10.3390/agriculture12101570
Submission received: 2 August 2022 / Revised: 15 September 2022 / Accepted: 22 September 2022 / Published: 28 September 2022
(This article belongs to the Topic Precision Feeding and Management of Farm Animals)

Abstract

:
Adaptivity of eating and rumination behavior are assumed to play a particular role for cows in low-input systems, because they are more frequently challenged by altering forage quality. The present study examined relations between forage quality, chewing behavior and efficiency estimates in dairy cows from Swiss zero-concentrate organic farming systems. A total of 102 Swiss Fleckvieh cows on two organic dairy farms were observed during one full production year. Each farm was visited eight times. At each visit, up to 45 cows were equipped with RumiWatch® (Itin and Hoch GmbH, Liestal, Switzerland) sensor head collars, from which eating and rumination time and the frequency of activity changes were obtained for 48 h. Milk from one complete day was analyzed individually. All offered roughages (pasture herbage, grass silages and hay) were sampled at each visit and analyzed for crude fiber, crude protein and net energy, and a feed quality score was calculated. Metabolic production efficiency was estimated based on entire lactation data, and feed efficiency was estimated based on the individual farm visits. Lactation stage and forage quality significantly affected the chewing sensor variables. Eating time increased and rumination time decreased with the improved nutritive quality of feed. Coefficients of variance of the factor animal in the sensor variables showed a contribution of the individual cow to chewing behavior. Significant correlations between chewing sensor variables and efficiency estimates were not found. In conclusion, chewing behavior under on-farm conditions in low-input dairy farms alters during lactation and during changing forage quality, with significant animal effects, indicating potential for new phenotypes, albeit with no indications for efficiency.

1. Introduction

Low-input dairy production systems, which aim at reducing the use of concentrate feeds, are expanding in Europe [1] and in the US [2], particularly in the organic sector. These farms need cow types well adapted to roughages and pastures with varying nutrient density and digestibility [3,4]. Responses to varying nutritive quality may consist in adapting milk yields, mobilizing and restoring body adipose tissues, altering intake and digestion or avoiding pregnancy. From a biological perspective, the animal’s main goals are to stay healthy and to reproduce [5], while, from the farmers’ economic perspective, the main goal is the efficient conversion of the feed offered to dairy products. These goals are antagonistic, to a certain degree, which is evident from the antagonism between high milk yields and robustness traits across breeds [6]. There is a general trade-off between advanced high-yielding breeds, which are often not flexibly adaptive to changing pasture conditions [7], and well-adapted traditional or dual-purpose breeds, which cope well with the challenges of low-input systems but have lower milk yields [6,8]. Therefore, resilience, adaptability and roughage conversion efficiency are important aspects to characterize suitable breeds and phenotypes for low-input systems [9]. For such characterizations, behavioral traits such as eating and rumination may play a helpful role.
The assessment of feed efficiency on cow level under grazing conditions is challenging. Individual determination of dry matter and nutrient intake is hardly practicable in dairy systems with loose housing and grazing [10]. Thus, calculation of efficiency sensu strictu [11] is hardly possible on such farms. Intake and rumination activity measured with chewing sensors might provide meaningful proxies to estimate intake and responses to feed quality in practice [12]. Several such sensors were brought to market in recent years [13,14], and reasonable correlations of the achieved data with intake could be shown, e.g., for noseband-situated pressure sensors [15,16].
Chewing activity curves, translated into eating and rumination patterns [17], can reflect changes in feed availability and quality [18,19], but they may also express individual responses to feed properties in terms of intake and rumination phenotypes [10,20]. However, such approaches will work only if they provide consistent responses under practice conditions. In order to evaluate the suitability of chewing sensor data for senseful phenotyping, it appears necessary to evaluate (a) the strength of chewing behavior in response to different forage qualities and (b) the correlation of intake and rumination traits with milk production efficiency estimates at the cow level.
Therefore, we conducted a study on two commercial Swiss organic dairy farms with zero-concentrate feeding strategies. Covering a full production season, each of the herds was assessed eight times with chewing behavior sensors at the cow level over 48 h. The sensor data were analyzed to investigate the relationships between foraging behavior and production parameters such as feed quality, lactation stage, performance and efficiency values. Three levels of analysis were (i) the general development of the assessed variables across lactation, (ii) the effects of feed quality on chewing sensor and production variables and (iii) the corrected correlation of chewing sensor data with two different efficiency estimates. The target of the study was to evaluate the potential of chewing sensor data for phenotyping cows under practice conditions for selection on low-input dairy farms.

2. Animals, Materials and Methods

2.1. Farms and Animals

We conducted on-farm assessments on two Swiss organic dairy farms. The animal experiment was controlled and permitted under the Swiss permit number 29374, issued by the veterinary authority in Aarau, Switzerland. The commercial farms were chosen in order to have sites well representative for a low-input but nonetheless dedicated dairy production agriculture in grassland-rich sub-alpine regions. Both farms are economically fully profitable under current conditions and thus they represent a reasonable model for future low-input dairy production in the region. Both farms were located in Central Switzerland (farm 1: close to the city of Aarau; farm 2: close to the city of Luzern; both were in lowland sites with a high proportion of semi-natural grassland).
Both farms followed a zero-concentrate feeding regime with grazing whenever possible. The animals had always ad libitum access to water and forage, the latter either as pasture or as cut grass, grass silage or hay in the barn (Table 1). Salt and mineral mixtures were accessible daily in the barn for each cow. The cows were milked daily in the morning (6.00) and in the evening (17.00). Each farm herd consisted of 40–50 lactating dairy cows of the Swiss Fleckvieh breed [21]. All lactating animals were kept in one group, respectively.
The investigation schedule comprised eight visits per farm, which were intended to cover the whole grazing season (March–November) and as many as possible of different feed quality situations. For reasons of feasibility, we organized the visits always pairwise around a foreseen change in pasture or in feeding schedule. Each farm was visited eight times between August 2017 and April 2019, to collect chewing behavior data in association with feed nutritional quality and lactation status, and to assess the body condition and body weight of the cows. Whereas, initially, all lactating cows were studied at each farm visit, technical errors of sensors or mismatch with validation criteria caused a posteriori exclusion of individual animals. The effective sample size and basic descriptors of the different farm visits are shown in Table 1, and the farm characteristics are displayed in Table 2.

2.2. Data Collection

We equipped up to 45 cows of each herd with RumiWatch® (RW) head collars for at least four days per farm visit, on eight runs in total. RumiWatch® head collars are noseband pressure sensors detecting chewing movements; the signals are translated into temporal eating and ruminating patterns (Itin and Hoch GmbH, Liestal, Switzerland, [17]). After the cows were holstered, they followed their daily routines on the farm.
Individual milk samples from one complete milking (evening and morning) were taken on day 2/day 3 of each farm visit and analyzed for fat, protein, lactose and urea through infrared spectroscopy (Milko-Scan-FT TM, FOSS Hilleroed, Denmark) by Suisselab (Zollikofen, Switzerland). At the end of each visit, cows were weighed with a digital balance with a riffle sheet that cows could walk on and two Trutest weighing bars (M800; Grüter Waagen GmbH, Eschenbach). Further, body condition score was assessed using the method described as ”dBCS” by [22]. Additionally, herd book data on total milk yield (kg), average milk composition (i.e., percentage of milk fat, milk protein and milk lactose content) and length of the respective lactation of each cow in the trial were obtained from the competence center for informatics and genetics of Swiss breeding organizations, Qualitas AG (Zug, Switzerland), and included in the analysis.
We used TinyTag loggers located on a pasture close to each barn to measure relative humidity and temperature in °C and calculated the Temperature–Humidity Index (THI), defined in Equation (1) as
THI = (1.8 × T + 32) − (0.55 − 0.0055 × RH) × (1.8 × T − 26)
where T is the air temperature in °C and RH is the relative humidity in % (Table 1).

2.3. Feed Sampling and Analysis

At each farm visit, we collected representative samples of the actual feedstuffs, including indoor fed hay, grass silage and freshly cut green fodder, as well as pasture. On pasture, samples were collected by cutting, respectively, five plots of 0.25 m2 at 3–5 cm above ground. The plots were randomly chosen spots, distributed across the respective pasture actually grazed. From hay, grass silage or cut grass, we collected five samples filling a 1 L bag from different places of the feedstocks in the barn, respectively. We dried the samples for 24 h at 60 °C to determine dry matter. Dried samples were milled (Cutting Mill SM100, Retsch GmbH, 42781 Haan, Germany) and analyzed with near-infrared spectroscopy (NIRFlex N-500 equipped with a NIRflex Solids measuring cell, Büchi Labortechnik AG, 9230 Flawil, Switzerland) for crude protein (CP), crude ash and crude fiber. The NIRFlex device had been calibrated based on a sample of >100 roughage samples of a wide quality range. Net energy for lactation (NEL) and absorbable protein at the duodenum (APD) were calculated according to the Swiss feed grading system [23].

2.4. Processing and Validation of RumiWatch Data

The first day of each farm visit was considered an adaptation day to the head collars, and data were not used. From each visit, RumiWatch data from day two, 2:00 p.m., to day four, 1:59 p.m., were used for analysis. Raw data recorded by the RumiWatch head collars were converted using the RumiWatch Converter V.0.7.3.36 [24] to calculate eating and rumination patterns, aggregated at 1-h time intervals (minutes per hour). If a cow had spent less than 30 min within two consecutive hours with either ruminating or eating, the data of the corresponding 24 h (defined as time slot from 2:00 p.m. to 1:59 p.m.) were excluded for this cow. If we had to exclude more than 24 h of data from a cow, we excluded that cow for the current visit.
We used the variables rumination time (min/h), eating time (min/h) and number of activity changes, i.e., the frequency of switches between eating, ruminating and idling (n/h; [19]), as descriptors of chewing behavior, which we validated against the following threshold values (aggregated to 24 h): eating, 240–795 min/d; ruminating, 220–720 min/d; and activity changes, 55–300 n/d. The validation ranges for eating and ruminating are larger than the averages given in the review of Beauchemin (2018). This reflected the longer activity time for grazing cows [25]. A descriptive summary of chewing sensor variables by farm in the validated data set is shown in Table 2.

2.5. Definition of Efficiency Parameters

Energy-corrected milk yield (ECM in kg/d) was calculated with a standard of 4% milk fat, 3.2% milk protein and 4.8% milk lactose, applying Formula (2) [23]. We estimated dry matter intake (DMI) in kg per day using Formula (3) proposed by [26].
ECM [kg] = ((MilkFat [%] × 0.38 + MilkProtein [%] × 0.24 + MilkLactose [%] × 0.17) × DMY [kg])/3.14
DMIDeSouza = [(3.7 + Parity × 5.7) + 0.305 × (0.0929 × MilkFat [%] × DMY [kg] + 0.0563 × MilkProtein [%] × DMY [kg] + 0.0395 × MilkLactose × DMY [kg]) + 0.022 × Body weight [kg] + (−0.689 + Parity × −1.87) × BCS] × [1 − (0.212 + Parity × 0.136) × exp(−0.053 × DIM)]
where DMY = daily milk yield in kg, MilkFat = milk fat content in %, MilkProtein = milk protein content in %, MilkLactose = milk lactose content in %, Parity = a two-level categorical variable indicating whether a cow is primiparous (0) or multiparous (1), BCS = body condition score of the cow on a scale of 1 to 5 with 0.25 intervals [22] and DIM = days in milk.
Data were limited to cows with an actual lactation status of maximal 305 days in milk. We had to discard the attempt to apply the formula proposed by [16], which uses RumiWatch variables to estimate DMI, as we partly obtained unrealistically low DMI estimates.
We used herd book data on total lactation milk yield, milk fat, milk protein and milk lactose content and lactation length (Qualitas, Zug, Switzerland) for each cow involved in the trial. Herd book data on lactation milk yield were energy-corrected by applying Formula (2). The resulting energy-corrected lactation milk yield (in kg) was divided by the lactation length (in days) to obtain values for energy-corrected average daily milk yield of total lactation (DECMTL).
We calculated two different efficiency estimates. First, the metabolic milk production efficiency at total lactation level (MPETL) [27] was calculated as
MPETL = DECMTL/(average body weight0.75)
where DECMTL is the average energy-corrected daily milk yield of the total lactation divided by the average metabolic body weight of the respective lactation based on the weighings during our farm visits.
Second, we calculated a day-based feed efficiency value
FEday = ECMday/DMIDeSouza
where ECMday is the energy-corrected daily milk yield measured during the respective farm visit, divided by the actual dry matter intake estimated according to Formula (3).

2.6. Statistical Analysis

All statistical analyses were performed in R (v 3.6.2; [28]).
Because the nutritional values analyzed in the feed were highly correlated, and in order to reduce the dimensions of the data, we performed a Principal Component Analysis (PCA) using the “prcomp” function in R (v 3.6.2, [28]). The broken stick approach was applied to identify the relevant principal components (Table 3). The first principal component (PC1) explained 88% of the variance in feed quality across the different farm visits. Therefore, we used the coefficients from PC1 to calculate a general “feed quality score” using Formula (6).
Feed quality score = DM [g/kg] × 0.51 + CF [g/kg] × 0.50 + NEL [MJ/kg] × −0.50 + CP [g/kg] × −0.49
This feed quality score has only a dimension in the sense of distances on the x-axis. It distinguishes fiber- and dry-matter-rich feed (positive values) from protein- and energy-rich feedstuff (negative values). The score was subsequently used in the models calculating the feed effects of chewing sensor variables.
Furthermore, we categorized three main types of rations according to the respective feeding schedules at each farm visit (Table 1): (1) a pure hay diet indoors, during winter (“hay”), (2) a pasture-only regime in summer (“pasture”) and (3) a pasture-based diet with additional supply of hay, freshly cut grass or grass silage in the barns during spring and autumn or drought periods (“mix”). This classification was used to provide a summarized overview of the feeding regimes (Table 1 and Table 4).
In order to test differences in chemical composition (Table 4) between the rations “hay”, “mix” and “pasture”, respectively, we performed pairwise comparisons as Tukey contrasts on the linear models for the respective chemical component (dependent variable) and ration (independent variable) using the “emmeans” package (version 1.4.5, [29]).
We investigated the effect of days in milk (DIM) and feed quality score on chewing sensor variables, applying linear mixed effects models in the “lme4” package in R (version 1.1-21, [30]). DIM, feed quality score and lactation class (levels: 1st, 2nd or 3rd lactation onwards) were fixed effects:
Model 1: Yijklm = μ + DIMi + FQSj + LCk + herdl + cowm (herdl) + eijklm
where Yijklm = response variable (ruminate time (min/d), eating time (min/d) or activity changes (n/d), μ = overall mean, DIMi = covariate of days in milk i, FQSj = covariate of feed quality score j, LCk = fixed effect of lactation class k (k = 1st, 2nd or 3rd lactation onwards), herdl = random effect of herd l, N = 2, cowm (herdl) = random effect of cow m nested within herd l and eijklm = random error. Intake estimates, body weight and BCS had been excluded from the model to avoid confounding with the efficiency estimates in the subsequent step (Model 2).
To account for repeated measurements, cows nested within farms were used as random effects. We extracted pseudo marginal and conditional R squared estimates with the “MuMIn” package (version 1.43.15, [31]) to assess the variance explained by the models.
In order to display the non-linear relationships of relevant variables with DIM, we calculated smooth splines to show the empirical development of chewing sensor data, performance, body condition score and body weight across lactation. For this, we used an expanded version of model 1, which included DMIDeSouza, BCS and body weight.
The smooth spline calculations were subsequently used to correct chewing sensor data for days in milk with a smoothing parameter (spar) of 0.95. For the last step, we used the estimates from the models for feed effects, which are displayed in Table 5, to correct the chewing sensor variables for effects of the feed quality score. Thereafter, the chewing sensor variables are labeled with “corrected”.
Finally, we applied mixed models in “lme4” with efficiency traits as dependent variables, corrected chewing sensor variables as fixed effects and cow nested within farm as a random effect.
Model 2: Yijklmn = μ + Eati + Rumj + ACk + LCl + herdm + cown (herdm) + eijklmn
where Yijklmn = response variable (MPETL: total lactation average daily metabolic milk production efficiency [kg ECM/kg BW0.75], FEday = day-based feed efficiency value [kg ECM/kg DM intake]), μ = overall mean, Eati = eating time corrected for days in milk and feed quality score i, Rumj = ruminate time corrected for days in milk and feed quality score j, ACk = number of activity changes corrected for days in milk and feed quality score, LCl = fixed effect of lactation class (l = 1st, 2nd or 3rd lactation onwards; applied only in model with MPETL as dependent variable), herdm = random effect of herd l, N = 2, cown (herdm) = random effect of cow nested within herd and eijklmn = random error.
The significance of random effects was tested by comparing models with and without random effects through likelihood ratio tests in the “lmerTest” package [32]. This was done for animal within farm and also separately for farm only. Statistical significance was determined at p < 0.05, with tendency at p > 0.05 and <0.1 in all analyses.

3. Results

3.1. Feed Quality

The three ration types differed significantly regarding their nutritional properties (Table 4). The PCA on the feed analyses shown in Table 3 and Figure 1 revealed that most of the variation (88.4%) was explained by one single component (PC1, Eigenvalue =3.53). PC1 was composed of dry matter content (%), fiber content (g/kg DM), net energy used for lactation (NEL in MJ/kg DM) and protein content (g/kg DM), with a contribution to PC1 of 25.7, 25.5, 24.6 and 24.2, respectively. The broken stick approach revealed that PC1 was the only component explaining more of the variation than expected by chance. Based on this result, the feed quality score was calculated from PC1 (coefficients provided in Materials and Methods section). The farm visits were well distributed along the feed quality score (Figure 1), with farm 2 tending towards more fiber-rich and farm 1 tending towards more protein-rich score values.

3.2. Temporal Development of Intake, Rumination, Body Condition and Yields

Across both farms, all variables of interest for this study were significantly altered with the days in milk (Figure 2, Table 5). While rumination time showed a smoothed U shape, where the early and the late days in milk showed the highest rumination time, eating time had an inverse U shape, with peak eating times in mid-lactation (Figure 2A). The variation in activity changes across DIM was a small but statistically significant decrease over time. While ruminate time did not differ between cows of different lactation classes, eat time was lower in cows from third lactation onwards. Activity changes were less frequent in cows from second lactation onwards.
Table 5. Influence of days in milk (DIM), feed quality score (FQS) and lactation class on chewing behavior traits (Nobservations = 534, Ncows = 102, N farms = 2).
InterceptSlope by DIMSlope by FQSAverage by Lactation Class
123
Response VariableEst. ± SEpEst. ± SEpEst. ± SEpEst. ± SEEst. ± SEEst. ± SEpR2 mR2 c
Rumination time (min/d)466 ± 19*−0.13 ± 0.03***29.1 ± 1.5***440 ± 19445 ± 19455 ± 180.1210.4430.590
Eating time (min/d)651 ± 31*−0.33 ± 0.03***−14.9 ± 1.9***597 ± 31 a581 ± 31 a563 ± 30 b**0.1910.471
Activity changes (n/d)147 ± 7*−0.05 ± 0.01***−0.4 ± 0.50.434138 ± 7 a124 ± 7 b125 ± 7 b***0.0790.514
Est. = estimate, p values show t-test results using Satterthwaite’s method in linear mixed models fit by REML for the intercept, days in milk, feed quality score and the p values of the F-Test with Kenward Roger degrees of freedom for lactation class (1st, 2nd and 3rd lactation onwards) as fixed and cow nested within farm as random effect. a,b Estimates for levels of lactation class are least square means, where different superscript letters in the same row indicate pairwise differences at p < 0.05 in the post hoc analysis. R2 m = marginal R squared, i.e., proportion of variance explained by the fixed effects, R2 c = conditional R squared, i.e., proportion of variance explained by the fixed and random effects. * p < 0.05, ** p < 0.01, *** p < 0.001.
As shown in Figure 2B, body weight and BCS decreased in early lactation, but started to increase again at around 200 DIM. While dry matter intake (DMI), after de Souza et al. (2019), showed an increase at the beginning of the lactation, which leveled out after approximately 50 DIM, ECM clearly showed a negative relationship with DIM.

3.3. Impact of Feed Quality Score and Rations on Chewing Sensor Data and Milk Yield

Rumination and eating time were significantly affected by feed quality score, while the number of activity changes was not (Table 5). Rumination time increased with fiber content in feed (positive feed quality score values), while eating time showed the inverse pattern, namely an increase in eating time with more protein-rich feed (negative feed quality score values). Eating time and number of activity changes decreased with increasing lactation class.

3.4. Relation of Chewing Behavior Traits and Lactation Class with Efficiency Parameters

The three chewing sensor traits rumination time, eating time and number of activity changes, all corrected for days in milk and feed quality score, had no significant relation with the variation in the day-based efficiency parameter, FEday. By contrast, corrected rumination time significantly influenced the total-lactation based MPETL, albeit with a small effect size (Table 6). Moreover, lactation class significantly influenced MPETL, with animals of second lactation and third lactation onwards showing higher MPETL estimates than primiparous animals (i.e., least square means of 0.147 (SE: 0.003), 0.159 (SE: 0.002), and 0.175 (SE: 0.002) for first, second and ≥ third lactation, respectively, all pairwise comparisons with p < 0.001). The marginal R squared values representing the variation explained by the fixed factors were 0.002 and 0.232, for the FEday and MPETL model, respectively, and the conditional R squared values were 0.281 and 0.814, representing the variation explained by the whole model (Table 6).

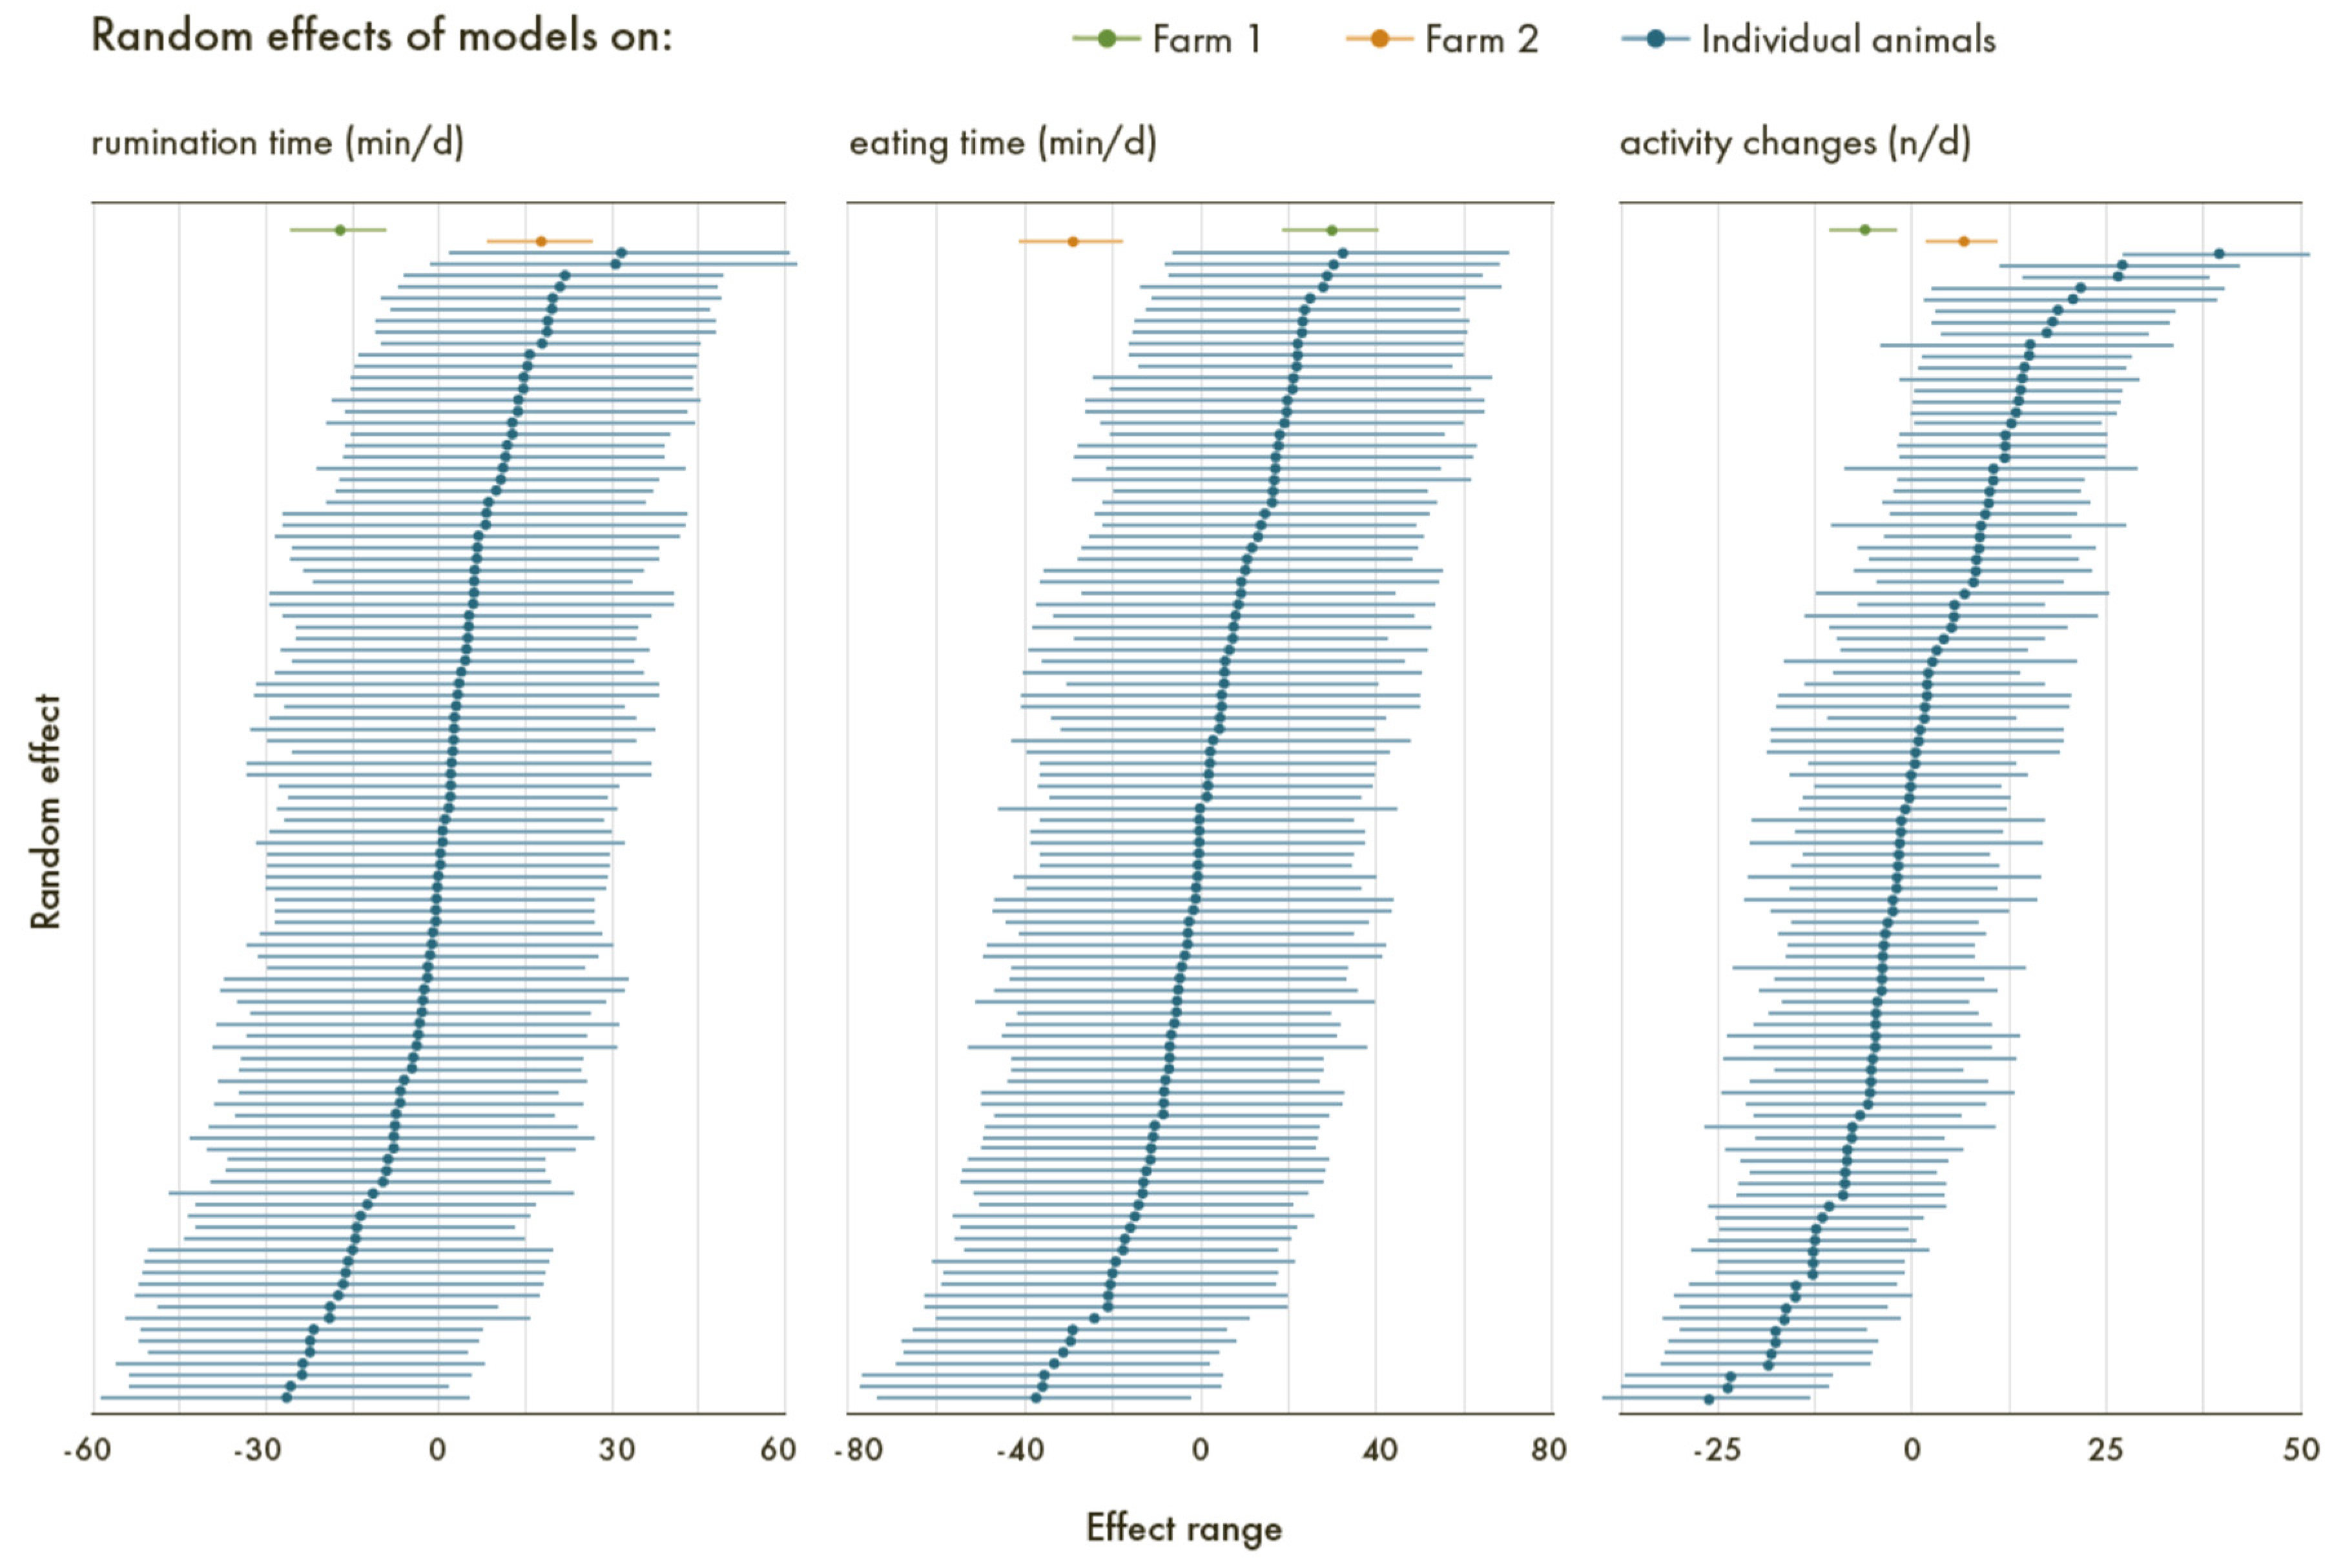
3.5. Animal and Farm Effects

The variability between animals and between farms was observed in all chewing sensor variables (Figure 3). The respective coefficients of animal variability for eating time, rumination time and activity changes were 14.6%, 19.2% and 16.4%.
For all investigated traits, models with animal and farm as random effects differed significantly from models without a random effect at p < 0.001, showing that the inclusion of the random effects was reasonable in order to explain the variation in the data. The only random effect without a significant effect was farm for the variable MPE_TL.

4. Discussion

Grassland-based low-concentrate dairy cattle systems can claim high sustainability in environmental scales, if human-edible feed conversion efficiency [3] and land-surface-related effects such as eutrophication potential are considered [33,34]. However, even if differentiated land use (arable land versus permanent grassland) is one of the core arguments pro low-input dairy production [34], also, in such systems, feed conversion efficiency must not be neglected. The detection of cow types that are resilient in low-input grassland systems and show fair milk yields at the same time is a challenge [6]. For selection in such systems, it is important to have more phenotypic traits besides milk yields, fitness and fertility, because feed intake is almost impossible to control. An increasing number of sensors are currently appearing on the market that detect the chewing movements of the individual animals. Such chewing behavior data may be used for the detection of estrus [35], diseases [36] or the start of parturition [12], and there appears to be potential for estimating intake [15] or even efficiency by such approaches. In particular, the head-collar-based devices appear to have high accuracy, because they directly measure jaw movements [13,17]. For such devices, equations for absolute [16] or relative [15] intake estimates have been developed. Therefore, they might be helpful as indirect proxies for the efficiency of individual cows. Whether or not this is possible under practice conditions on-farm is, however, not proven.
Instead of standardized station experiments, which may be better controlled, but are also always specific cases [37], the immanent diversity of low-input production systems requires repeated data collections and evaluation under varying on-farm practices [1,38]. The current study provides such on-farm-generated data showing the feasibility of sensor-based phenotypic relations between chewing behavior, milk yield development and efficiency estimates in dairy cows with altering forage quality on low-input farms.
We used the system Rumiwatch®, which has high precision in detecting eating and rumination patterns [17,39]. The initial goal had been a sound estimate for intake on pasture with the sensor head collars. However, during the current study, it became clear that none of the existing equations [15,16] would lead to plausible intake data for the herds investigated. In this light, we decided to use intake [26] and efficiency [27] estimates based on cow performance data and evaluate whether or not the sensor data would relate to them.
In a first step, the general sensitivity of chewing sensor variables towards different nutritional quality of forages (pasture, hay and mixed) was assessed. The finding that eating time was strongly affected by feed quality was well in line with earlier studies, which, however, did not report clear feed quality effects on rumination time [40,41,42]. Nonetheless, there are other studies reporting such effects on rumination [18,43,44] and the results of the present study appear plausible in terms of the direction and strength of these effects.
The development of eating time across lactation (Figure 2) reflected common intake curves, and the curve of rumination time along DIM was similar to the one published by Zetouni et al. [20]. The development of rumination time during lactation appeared reciprocal to that of eating time, decreasing when eating time increased and vice versa (Figure 2A). In addition, in the literature [18,19,20], there seems to be a slight partial antagonism between intake (eat time) and rumination time. This points towards a potential time conflict between these activities. Since the eating time development with lactation in our data followed the commonly known intake curve during lactation, we assume that, given an existing time conflict between eating and rumination, the former dominates the curve of the latter. Thus, when a high feed intake is required (as, for instance, during high performance in the first months of lactation), less intensive rumination and, eventually, less efficient feed degradation might happen. This context will, however, need further investigation.
Additionally, our study showed the effects of animal on chewing sensor variables, with considerable variation in the individual effects. The coefficients of variance of the animal effects on eating and rumination time were well in line with the animal variability reported by [20,38]. We could show that the variation among animals is significant, even if corrected for feed effects and days in milk, indicating a potential to phenotype individuals based on sensor variables for foraging behavior. This underlines that sensor-based phenotypes can be related to chewing activity patterns as such, but also in response to feed quality changes and in development during lactation. The practical applicability of these phenotypes with respect to the resilience or productivity of the cow still needs to be further elaborated.
While we were able to link behavioral changes directly to feed quality and stage of lactation, we did not find clear relations between the applied efficiency estimates and the behavioral data. One of the main issues in studies in pasture-based systems is the difficulty to gain an appropriate estimate for feed intake on pasture [45], which was a relevant obstacle for FEday estimates in the current study. None of the efficiency estimates applied was related to chewing sensor variables. Generally, the fact that effect estimates were very small shows that there was no functional relation between chewing behavior and both chosen efficiency parameters. Even though a significant effect of corrected rumination time on MPETL was detected, it had such a small effect size (a longer rumination time of 100 min/day would reduce MPETL by roughly 1%) that its relevance is negligible.
Considering that sensor data were obtained only a few times during the lactation of the individual animals, it appears plausible that the regression on an efficiency parameter, which builds on whole lactation data (MPETL), was weak. However, the rather low frequency of data collection is a real constraint in the practice of pasture-based production systems, and it makes rather limited sense to test sensors at unrealistically high usage frequencies, which are subsequently not affordable. Moreover, the absence of any effects in the FEday model indicates that there was no correlation between chewing behavior and estimated feed efficiency in the studied herds. This makes it rather unlikely that chewing sensors could be successfully used to approximate the efficiency of dairy cows in low-concentrate pasture-based dairy systems. There may be potential if chewing sensor data are used as auxiliary traits in models when intake is known [46], but under barely controllable practice conditions with pasture, as in the current study, the predictive use for efficiency appears limited. The lack of intake data will remain difficult to overcome in pasture-based systems. We have used two efficiency estimates in order to see trends at least, but it appears that the road to efficiency proxies in these contexts is still long.
The curves for body weight and BCS development, as well as intake estimates along the days in milk, are plausibly in accordance with expectations of physiological development in the lactating cow. The ECM curve, which was estimated based on the Swiss herd book test-day data, did not show the expected early-lactation increase, because the first test day is usually one month after parturition.

5. Conclusions

The present study assessed the potential of chewing sensor data as traits for contributing to the estimation of the individual production efficiency of dairy cows in low-input pasture-based systems. Clear animal-related variance in eating and rumination time was found, and effects of nutritional feed quality and days in milk on these variables were detected, which may be useful information in low-input breed phenotyping. After correction for these effects, no notable relation of eating and rumination time with efficiency approximations was found. This lack of effect was found regardless of whether efficiency had been calculated as milk yield over metabolic body weight on lactation level or as milk yield over estimated intake on day level. Thus, in pasture-based systems, the difficulty of quantifying intake remains an obstacle, which cannot be overcome by the use of chewing sensors only. However, the sensor data may serve as interesting phenotypes, in response to feed quality and stage of lactation. To what degree the individual variation of the sensor traits may be indicative of the adaptability and thus resilience of low-input dairy cows is subject to further investigation.

Author Contributions

Conceptualization, F.L., J.K.P., S.A. and A.S.N.; Methodology, F.L., F.N.M., A.B., C.B. and A.S.N.; Software, F.N.M. and A.B.; Validation, A.B., F.N.M. and F.L.; Investigation, J.K.P., C.B. and A.S.N.; Resources, F.L.; Data Curation, F.N.M. and A.B.; Writing—Original Draft Preparation, F.L., F.N.M. and A.B.; Writing—Review and Editing, S.A., J.K.P., C.B. and A.S.N.; Visualization, F.N.M.; Supervision, F.L. and A.S.N.; Project Administration, A.B.; Funding Acquisition, A.S.N. and F.L. All authors have read and agreed to the published version of the manuscript.

Funding

This research was supported by a grant of the European project GenTORE (the European Union’s Horizon 2020 Research and Innovation Program, grant agreement no. 727213). Moreover, we acknowledge the financial support of the Foundation Sur-la-Croix, Basel, Switzerland.

Institutional Review Board Statement

The animal experiment was controlled and permitted under the Swiss permit number 29374, issued by the cantonal veterinary authority in Aarau, Switzerland. The application, approval and control procedures followed the FELASA guidelines and the Declaration of Helsinki.

Informed Consent Statement

Not applicable.

Data Availability Statement

The complete data files for the present study will be uploaded to a public repository and are currently available from the main author upon request.

Acknowledgments

We sincerely thank the farmers who provided access to their animals and information and kindly supported us with their collaboration.

Conflicts of Interest

The authors declare no conflict of interest.

References

  1. Leiber, F.; Schenk, I.K.; Maeschli, A.; Ivemeyer, S.; Zeitz, J.O.; Moakes, S.; Klocke, P.; Staehli, P.; Notz, C.; Walkenhorst, M. Implications of feed concentrate reduction in organic grassland-based dairy systems: A long-term on-farm study. Animal 2017, 11, 2051–2060. [Google Scholar] [CrossRef]
  2. Brito, A.F.; Silva, L.H.P. Symposium review: Comparisons of feed and milk nitrogen efficiency and carbon emissions in organic versus conventional dairy production systems. J. Dairy Sci. 2020, 103, 5726–5739. [Google Scholar] [CrossRef]
  3. Horn, M.; Steinwidder, A.; Gasteiner, J.; Podstatzky, L.; Haiger, A.; Zollitsch, W. Suitability of different dairy cow types for an Alpine organic and low-input milk production system. Livest. Sci. 2013, 153, 135–146. [Google Scholar] [CrossRef]
  4. Horn, M.; Steinwidder, A.; Pfister, R.; Gasteiner, J.; Vestergaard, M.; Larsen, T.; Zollitsch, W. Do different cow types respond differently to a reduction of concentrate supplementation in an Alpine low-input dairy system? Livest. Sci. 2014, 170, 72–83. [Google Scholar] [CrossRef]
  5. Friggens, N.C.; Blanc, F.; Berry, D.P.; Puillet, L. Review: Deciphering animal robustness. A synthesis to facilitate its use in livestock breeding and management. Animal 2017, 11, 2237–2251. [Google Scholar] [CrossRef]
  6. Bieber, A.; Wallenbeck, A.; Leiber, F.; Fuerst-Waltl, B.; Winckler, C.; Gullstrand, P.; Walczak, J.; Wojcik, P.; Neff, A.S. Production level, fertility, health traits, and longevity in local and commercial dairy breeds under organic production conditions in Austria, Switzerland, Poland, and Sweden. J. Dairy Sci. 2019, 102, 5330–5341. [Google Scholar] [CrossRef]
  7. Peyraud, J.L.; Delagarde, R. Managing variations in dairy cow nutrient supply under grazing. Animal 2013, 7 (Suppl. S1), 57–67. [Google Scholar] [CrossRef]
  8. Bieber, A.; Wallenbeck, A.; Spengler Neff, A.; Leiber, F.; Simantke, C.; Knierim, U.; Ivemeyer, S. Comparison of performance and fitness traits in German Angler, Swedish Red and Swedish Polled with Holstein dairy cattle breeds under organic production. Animal 2020, 14, 609–616. [Google Scholar] [CrossRef]
  9. Leiber, F. Let them graze! Potentials of ruminant production outside the feed-food competition. In Managing Healthy Livestock Production and Consumption; El-Hage Scialabba, N., Ed.; Elsevier Academic Press: London, UK, 2022; pp. 137–148. [Google Scholar] [CrossRef]
  10. Seymour, D.J.; Canovas, A.; Baes, C.F.; Chud, T.C.S.; Osborne, V.R.; Cant, J.P.; Brito, L.F.; Gredler-Grandl, B.; Finocchiaro, R.; Veerkamp, R.F.; et al. Invited review: Determination of large-scale individual dry matter intake phenotypes in dairy cattle. J. Dairy Sci. 2019, 102, 7655–7663. [Google Scholar] [CrossRef]
  11. Phuong, H.N.; Friggens, N.C.; de Boer, I.J.M.; Schmidely, P. Factors affecting energy and nitrogen efficiency of dairy cows: A meta-analysis. J. Dairy Sci. 2013, 96, 7245–7259. [Google Scholar] [CrossRef]
  12. Beauchemin, K.A. Invited review: Current perspectives on eating and rumination activity in dairy cows. J. Dairy Sci. 2018, 101, 4762–4784. [Google Scholar] [CrossRef] [PubMed]
  13. Büchel, S.; Sundrum, A. Technical note: Evaluation of a new system for measuring feeding behavior of dairy cows. Comput. Electron. Agric. 2014, 108, 12–16. [Google Scholar] [CrossRef]
  14. Bikker, J.P.; van Laar, H.; Rump, P.; Doorenbos, J.; van Meurs, K.; Griffioen, G.M.; Dijkstra, J. Technical note: Evaluation of an ear-attached movement sensor to record cow feeding behavior and activity. J. Dairy Sci. 2014, 97, 2974–2979. [Google Scholar] [CrossRef]
  15. Leiber, F.; Holinger, M.; Zehner, N.; Dorn, K.; Probst, J.K.; Spengler Neff, A. Intake estimation in dairy cows fed roughage-based diets: An approach based on chewing behaviour measurements. Appl. Anim. Behav. Sci. 2016, 185, 9–14. [Google Scholar] [CrossRef]
  16. Rombach, M.; Sudekum, K.H.; Munger, A.; Schori, F. Herbage dry matter intake estimation of grazing dairy cows based on animal, behavioral, environmental, and feed variables. J. Dairy Sci. 2019, 102, 2985–2999. [Google Scholar] [CrossRef] [PubMed]
  17. Zehner, N.; Umstätter, C.; Niederhauser, J.J.; Schick, M. System specification and validation of a noseband pressure sensor for measurement of ruminating and eating behavior in stable-fed cows. Comput. Electron. Agric. 2017, 136, 31–41. [Google Scholar] [CrossRef]
  18. Tafaj, M.; Kolaneci, V.; Junck, B.; Maulbetsch, A.; Steingass, H.; Drochner, W. Influence of fiber content and concentrate level on chewing activity, ruminal digestion, digesta passage rate and nutrient digestibility in dairy cows in late lactation. Asian-Australas. J. Anim. Sci. 2005, 18, 1116–1124. [Google Scholar] [CrossRef]
  19. Leiber, F.; Probst, J.K.; Zehner, N.; Spengler Neff, A.S. Feeding and rumination behaviour of dairy cows fed by varied feeding regimes. Agrarforsch. Schweiz 2015, 6, 462–469. [Google Scholar]
  20. Zetouni, L.; Difford, G.F.; Lassen, J.; Byskov, M.V.; Norberg, E.; Lovendahl, P. Is rumination time an indicator of methane production in dairy cows? J. Dairy Sci. 2018, 101, 11074–11085. [Google Scholar] [CrossRef]
  21. Swissherdbook. Rasse Swiss Fleckvieh. 2021. Available online: https://www.swissherdbook.ch/unsere-rassen/swiss-fleckvieh/ (accessed on 3 March 2021).
  22. Isensee, A.; Leiber, F.; Bieber, A.; Spengler, A.; Ivemeyer, S.; Maurer, V.; Klocke, P. Comparison of a classical with a highly formularized body condition scoring system for dairy cattle. Animal 2014, 8, 1971–1977. [Google Scholar] [CrossRef] [Green Version]
  23. Jans, F.; Kessler, J.; Münger, A.; Schori, F.; Schlegel, P. Fütterungsempfehlungen ür die Milchkuh. In Fütterungsempfehlungen für Wiederkäuer; Agroscope: Posieux, Switzerland, 2016. [Google Scholar]
  24. Werner, J.; Umstatter, C.; Kennedy, E.; Grant, J.; Leso, L.; Geoghegan, A.; Shalloo, L.; Schick, M.; O’Brien, B. Identification of possible cow grazing behaviour indicators for restricted grass availability in a pasture-based spring calving dairy system. Livest. Sci. 2019, 220, 74–82. [Google Scholar] [CrossRef]
  25. Dohme-Meier, F.; Kaufmann, L.D.; Gors, S.; Junghans, P.; Metges, C.C.; van Dorland, H.A.; Bruckmaier, R.M.; Munger, A. Comparison of energy expenditure, eating pattern and physical activity of grazing and zero-grazing dairy cows at different time points during lactation. Livest. Sci. 2014, 162, 86–96. [Google Scholar] [CrossRef]
  26. De Souza, R.A.; Tempelman, R.J.; Allen, M.S.; VandeHaar, M.J. Updating predictions of dry matter intake of lactating dairy cows. J. Dairy Sci. 2019, 102, 7948–7960. [Google Scholar] [CrossRef] [PubMed]
  27. Hofstetter, P.; Burgos, M.S.; Petermann, R.; Munger, A.; Blum, J.W.; Thomet, P.; Menzi, H.; Kohler, S.; Kunz, P. Does body size of dairy cows, at constant ratio of maintenance to production requirements, affect productivity in a pasture-based production system? J. Anim. Physiol. Anim. Nutr. 2011, 95, 717–729. [Google Scholar] [CrossRef]
  28. R Core Team. R: A Language and Environment for Statistical Computing; R Foundation for Statistical Computing: Vienna, Austria, 2020. [Google Scholar]
  29. Lenth, R. emmeans: Estimated Marginal Means, aka Least-Squares Means. Version 1.4.5. R Package. 2020. Available online: https://CRAN.R-project.org/package=emmeans (accessed on 3 March 2021).
  30. Bates, D.; Mächler, M.; Bolker, B.; Walker, S. Fitting Linear Mixed-Effects Models Usinglme4. J. Stat. Softw. 2015, 67, 1–48. [Google Scholar] [CrossRef]
  31. Bartoń, K. MuMIn: Multi-Model Inference. R Package Version 1.43.15. 2019. Available online: https://CRAN.R-project.org/package=MuMIn (accessed on 3 March 2021).
  32. Kuznetsova, A.; Brockhoff, P.B.; Christensen, R.H.B. lmerTest Package: Tests in Linear Mixed Effects Models. J. Stat. Softw. 2017, 82, 1–26. [Google Scholar] [CrossRef]
  33. Berton, M.; Bittante, G.; Zendri, F.; Ramanzin, M.; Schiavon, S.; Sturaro, E. Environmental impact and efficiency of use of resources of different mountain dairy farming systems. Agric. Syst. 2020, 181, 102806. [Google Scholar] [CrossRef]
  34. Schader, C.; Muller, A.; Scialabba, N.E.; Hecht, J.; Isensee, A.; Erb, K.H.; Smith, P.; Makkar, H.P.S.; Klocke, P.; Leiber, F.; et al. Impacts of feeding less food-competing feedstuffs to livestock on global food system sustainability. J. R. Soc. Interface 2015, 12, 12. [Google Scholar] [CrossRef]
  35. Pahl, C.; Hartung, E.; Mahlkow-Nerge, K.; Haeussermann, A. Feeding characteristics and rumination time of dairy cows around estrus. J. Dairy Sci. 2015, 98, 148–154. [Google Scholar] [CrossRef]
  36. Thorup, V.M.; Nielsen, B.L.; Robert, P.E.; Giger-Reverdin, S.; Konka, J.; Michie, C.; Friggens, N.C. Lameness Affects Cow Feeding But Not Rumination Behavior as Characterized from Sensor Data. Front. Vet. Sci. 2016, 3, 11. [Google Scholar] [CrossRef] [Green Version]
  37. Richter, S.H.; Garner, J.P.; Würbel, H. Environmental standardization: Cure or cause of poor reproducibility in animal experiments? Nat. Methods 2009, 6, 257–261. [Google Scholar] [CrossRef] [PubMed]
  38. Kapp-Bitter, A.N.; Dickhoefer, U.; Kaptijn, G.; Pedan, V.; Perler, E.; Kreuzer, M.; Leiber, F. On-farm examination of sainfoin supplementation effects in dairy cows in a roughage-based feeding system: Indicators of protein utilisation. Livest. Sci. 2021, 248, 104509. [Google Scholar] [CrossRef]
  39. Rombach, M.; Munger, A.; Niederhauser, J.; Sudekum, K.H.; Schori, F. Evaluation and validation of an automatic jaw movement recorder (RumiWatch) for ingestive and rumination behaviors of dairy cows during grazing and supplementation. J. Dairy Sci. 2018, 101, 2463–2475. [Google Scholar] [CrossRef] [PubMed]
  40. Beauchemin, K.A.; Iwaasa, A.D. Eating and ruminating activities of cattle fed alfalfa or orchard-grass harvested at two stages of maturity. Can. J. Anim. Sci. 1993, 73, 79–88. [Google Scholar] [CrossRef]
  41. Teller, E.; Vanbelle, M.; Kamatali, P. Chewing behaviour and voluntary grass silage intake by cattle. Livest. Prod. Sci. 1993, 33, 215–227. [Google Scholar] [CrossRef]
  42. Mazzenga, A.; Gianesella, M.; Brscic, M.; Cozzi, G. Feeding behaviour, diet digestibility, rumen fluid and metabolic parameters of beef cattle fed total mixed rations with a stepped substitution of wheat straw with maize silage. Livest. Sci. 2009, 122, 16–23. [Google Scholar] [CrossRef]
  43. Nishida, T.; Eruden, B.; Hosoda, K.; Matsuyama, H.; Xu, C.; Shioya, S. Digestibility, methane production and chewing activity of steers fed whole-crop round bale corn silage preserved at three maturities. Anim. Feed Sci. Technol. 2007, 135, 42–51. [Google Scholar] [CrossRef]
  44. Kröger, I.; Humer, E.; Neubauer, V.; Kraft, N.; Ertl, P.; Zebeli, Q. Validation of a noseband sensor system for monitoring ruminating activity in cows under different feeding regimens. Livest. Sci. 2016, 193, 118–122. [Google Scholar] [CrossRef]
  45. Kapp-Bitter, A.N.; Dickhoefer, U.; Suglo, E.; Baumgartner, L.; Kreuzer, M.; Leiber, F. Graded supplementation of chestnut tannins to dairy cows fed protein-rich spring pasture: Effects on indicators of protein utilization. J. Anim. Feed Sci. 2020, 29, 97–104. [Google Scholar] [CrossRef]
  46. Egger-Danner, C.; Kock, A.; Furst, C.; Ledinek, M.; Gruber, L.; Steininger, F.; Zottl, K.; Furst-Waltl, B. Indirect traits for feed efficiency. Zuchtungskunde 2018, 90, 467–475. [Google Scholar]
Figure 1. Result of the Principal Component Analysis (PCA) on feed quality parameters. The PCA revealed that PC1 explains more than 88% of the variance in the data, reflecting a gradient from energy- and protein-rich feed (PC1 < 0) to fiber-rich feed (PC1 > 0). The arrows in the lower right indicate the loadings of the different parameters on the first two components (DM = dry matter, NEL = net energy lactation), and the shape of the symbols represents the two different farms. The letters in the symbols reflect the eight different trials (a–h) on each farm to enable the link to Table 1.
Agriculture 12 01570 g001
Figure 2. Influence of days in milk (DIM) on (A) the chewing behavior parameters rumination time (min/d), eating time (min/d) and number of activity changes (n/d), and on (B) the efficiency-related parameters body weight, body condition score (BCS), dry matter intake (DMI) based on the formula of de Souza et al. (2019) and daily energy-corrected milk yield (ECM). Lines represent the smooth splines between DIM and the corresponding variable. Variables have been multiplied or divided by the values added to the labels. Vertical lines represent 120-day intervals of DIM.
Agriculture 12 01570 g002
Figure 3. Plots of the random effects farm and animal from models on chewing sensor variables. The plots show the mean effect (dot) and the confidence interval (horizontal lines) of farm or animal on the respective mean model estimate, represented by the 0 value.
Agriculture 12 01570 g003
Table 1. Experimental setup showing the eight runs per farm, starting date, ration including botanical characterization, Temperature–Humidity Index (THI) and number of cows involved.
RunStarting DateRationBotanical Characterization 1THI 2Ncows
Farm1_a29 August 2017PastureK2-363.839
Farm1_b3 September 2017PastureA362.139
Farm1_c6 June 2018MixedG2 + G454.634
Farm1_d11 April 2018PastureA456.734
Farm1_e23 August 2018MixedA265.039
Farm1_f28 August 2018MixedK3 + L459.239
Farm1_g10 October 2018PastureL3 + G3NA35
Farm1_h15 October 2018MixedG3NA35
Farm2_a5 November 2017MixedA2-343.442
Farm2_b10 November 2017MixedL2-340.942
Farm2_c21 March 2018HayG3-446.327
Farm2_d26 March 2018MixedG1 + G3-442.827
Farm2_e16 November 2018MixedG2 + G3-435.230
Farm2_f21 November 2018HayG3-439.030
Farm2_g16 April 2019MixedG3 + G3-459.021
Farm2_h21 April 2019PastureG356.121
1 botanical composition, assessed following the recommendations of AGFF, 2007 (https://www.eagff.ch/files/images/bilder/Raufutter_produzieren/Futterqualitaet/agff-mb3_1707_D_21_bewertung_von_wiesenfutter_ohne_06.05.pdf (accessed on 15 July 2022)): G = rich in grasses, K = rich in herbs, L = rich in legumes, A = balanced; development stages: 1 = start of shooting, 2 = panicle rises in 50% of the fermenters, 3 = start of panicle pushing, 4 = full panicle pushing. 2 Temperature–Humidity Index.
Table 2. Descriptive summary of chewing sensor variables and cow characteristics by farm.
Data OriginVariableFarm 1
(Observations n = 294)
Farm 2
(Observations n = 240)
Mean ± SDMedianMin–MaxMean ± SDMedianMin–Max
Trial 1Eating time (min/d)609.9 ± 88.8628.6341.3–768.3538.3 ± 71.7542.3325.6–714.2
Ruminate time (min/d)413.1 ± 79.4399.5240.5–606.7490.4 ± 71.9486.9324.5–666.5
Other activity time (min/d)412.8 ± 102.4394.6233.3–692.8401.0 ± 80.8410.0219.6–603.9
Ruminate chews per minute (avg. of 24 h)43.2 ± 6.842.526.6–67.550.3 ± 7.049.831.2–71.4
Ruminate chews per bolus (avg. of 24 h)34.5 ± 6.234.218.7–55.943.7 ± 6.843.828.3–60.7
Activity changes (n/d)121.9 ± 20.0120.077.3–183.0133.1 ± 26.5128.779.3–220.3
Body weight (kg)581.8 ± 61.1583456–787648.4 ± 75.4658441–810
Body condition score2.90 ± 0.292.752.25–3.753.21 ± 0.343.252.50–4.00
ECM (kg/d) 316.6 ± 5.715.16.7–37.021.3 ± 5.721.45.2–33.0
Milk protein (%)3.37 ± 0.303.342.76–5.123.70 ± 0.503.722.77–5.40
Milk fat (%)4.34 ± 0.594.292.96–6.354.44 ± 0.794.491.88–6.98
Milk lactose (%)4.73 ± 0.154.734.27–5.484.67 ± 0.174.693.78–5.13
Days in milk182.5 ± 76.1210.53–300148.7 ± 108.61613–308
HB 2Lactation number3.5 ± 2.821–123.9 ± 2.43.51–10
Lactation yield (kg)6362 ± 181564062295–10,6215857 ± 122658632135–10,208
Lactation length (d)336 ± 10130790–602297 ± 7030680–584
DECMTL 4 (kg/d)19.6 ± 3.219.712.6–26.320.8 ± 2.920.914.4–27.7
Milk proteinTL (%)3.31 ± 0.243.322.72–3.963.42 ± 0.183.433.00–3.86
Milk fatTL (%)4.22 ± 0.434.153.48–5.524.28 ± 0.354.293.37–5.20
Milk lactoseTL (%)4.77 ± 0.104.774.46–5.024.70 ± 0.114.704.43–4.93
1 data generated during the trial, 2 data extracted from herd book data (Qualitas AG, Zug, Switzerland), 3 energy-corrected milk yield measured during the trial, 4 TL = averages of total lactation.
Table 3. Results of the Principal Component Analysis for the feed composition.
PC1PC2PC3PC4
Eigenvalue3.540.270.120.08
% variance88.386.702.882.03
% variance cum.88.3895.0897.97100.00
Variables’ % contribution
Dry matter25.709.6538.6925.97
Crude fiber25.4713.9937.8322.71
NEL24.6533.9011.2930.15
Crude protein24.1842.4612.1921.16
Variables’ coordinate contribution
Dry matter0.95−0.160.210.15
Crude fiber0.950.19−0.210.14
NEL−0.93−0.30−0.110.16
Crude protein−0.920.340.120.13
Table 4. Chemical feed composition and nutritive values aggregated to three ration types (hay, mixed and pasture) across visits and farms.
Ration DM (%)CP
(g/kg DM)
Ash
(g/kg DM)
CF
(g/kg DM)
NEL
(MJ/kg DM)
APD
(g/kg DM)
Hay (n = 57)Mean ± SD89.7 a ± 1.0124.8 c ± 7.991.8 b ± 3.5279.8 a ± 2.75.2 c ± 0.079.2 c ± 5.5
Min–Max88.8–90.7117.4–133.088.5–95.4277.1–282.25.2–5.274.0–85.0
Mixed (n = 274)Mean ± SD32.4 b ± 17.7178.0 b ± 19.6110.4 b ± 24.8236.6 b ± 18.05.8 b ± 0.2100.2 b ± 5.1
Min–Max11.9–67.3149.0–204.872.2–141.8206.9–263.85.5–6.292.5–107.8
Pasture (n = 203)Mean ± SD15.4 c ± 3.4207.5 a ± 15.8113.6 a ± 10.2215.0 c ± 11.96.2 a ± 0.2108.9 a ± 2.8
Min–Max9.3–20.4181.0–228.396.1–130.8195.3–226.65.8–6.5104.0–111.8
DM = dry matter, CP = crude protein, CF = crude fiber, NEL = net energy lactation, APD = absorbable protein at the duodenum. a,b,c Different superscript letters within columns represent significant differences at p < 0.05 between rations based on mean comparisons by Tukey contrasts.
Table 6. Influence of chewing sensor variables corrected for days in milk and feed quality score on metabolic milk production efficiency calculated on the basis of total lactation data (MPETL) and feed efficiency at daily basis (FEday) in Swiss organic dairy cows (Nobservations = 534, Ncows = 102, Nfarms = 2).
InterceptRumination Time CorrectedEating Time Corrected Activity Changes Corrected
Response VariableEstimateSEpEstimateSEpEstimateSEpEstimateSEpR2 mR2 c
MPETL 10.16020.0086***−2.17 × 10−56.32 × 10−6***−5.25 × 10−68.59 × 10−60.542−3.32 × 10−62.89 × 10−50.9080.2320.814
FEday 20.99380.2000***−6.42 × 10−61.40 × 10−40.9631.15 × 10−41.83 × 10⁻⁴ 0.532−5.06 × 10−45.66 × 10−40.370.0020.280
1 MPETL: total lactation average daily metabolic milk production efficiency [kg ECM/kg BW0.75]. 2 FEday: day-based feed efficiency value [kg ECM/kg DM intake]. p values show t-test results using Satterthwaite’s method in linear mixed models fit by REML with the corrected chewing traits ruminate time, eating time and number of activity changes as fixed effects, for both response variables, plus lactation class (3 levels: 1st, 2nd and 3rd lactation onwards) in the MPETL model, and cow nested within farm as random effect in both models. R2 m = marginal R squared, i.e., proportion of variance explained by the fixed effects, R2 c = conditional R squared, i.e., proportion of variance explained by the fixed and random effects. *** p < 0.001.
Publisher’s Note: MDPI stays neutral with regard to jurisdictional claims in published maps and institutional affiliations.

