Article

Technical Efficiency of Mung Bean Producers: The Case of Myanmar

Department of Agricultural and Resource Economics, Kangwon National University, Chuncheon 24341, Korea
*
Author to whom correspondence should be addressed.
Agriculture 2021, 11(12), 1249; https://doi.org/10.3390/agriculture11121249
Submission received: 3 November 2021 / Revised: 7 December 2021 / Accepted: 8 December 2021 / Published: 10 December 2021
(This article belongs to the Section Crop Production)

Abstract

:
Agriculture plays a key role in Myanmar and it is the backbone of the country’s economy. Among the major export-earning crops in Myanmar, mung bean is one of the important, and it creates many opportunities for smallholders. About 90% of the total production of mung bean is exported for overseas or border trade and has extended markets, especially China, Vietnam and EU countries. This study aims to measure the level of technical efficiency of green mung bean producers and determine the factors influencing the technical efficiency of mung bean production in Tatkon Township, Myanmar. Data from 144 farms were analyzed using a DEA model and Tobit regression. The empirical results reveal that about 46% of farmers had an efficiency score of more than 0.90, which indicates that 54% of farmers were relatively inefficient in their production. The results also show that socioeconomics factors, such as age of farmers, farmers participating in associations and soil fertility, had a significantly positive impact on technical efficiency. Gender, education, access to credit and extension services had a positive impact on the technical efficiency of mung bean production in the study area. To reduce inefficiency, the government should consider providing more services to male farmers and older farmers to improve their capacities, as well as providing an extension of services, new technologies, credit and improved variety for mung bean production.

1. Introduction

Myanmar, a nation rich in natural resources, is an agricultural country with a population of 54.41 million (2020 census data), 70% of whom are rural dwellers and most are engaged in agriculture. The agricultural sector supplies food to the country’s growing population every year and also contributes to export earnings. In Myanmar, the agricultural sector includes the crop, livestock and fishery subsectors, contributing to 22.4% of GDP and 19.6% of total export earnings in 2018/19, as well as employing 67.3% of the labor force [1]. Therefore, agriculture plays a key role in Myanmar and it is the backbone of the country’s economy. In Myanmar, there are six crop groups, namely cereal crops, oil crops, pulses, industrial crops, culinary crops and other crops; more than 61 kinds of crop are usually cultivated in Myanmar under different topographic, climate and soil type conditions [1]. Among these crops, pulses are one of the important crops for export earnings and make a contribution to job creation and GDP.
In recent years, people have realized that pulses are a significant opportunity for sustainable food production and security, with this crop being a protein source vital for human health [2]. The cultivation of pulses started in Myanmar under British Rule (1885–1948); they were brought from India and are still exported to India today, in significant numbers [3]. Myanmar farmers extensively grow pulses because pulses are a cash crop in the multiple cropping system and a contingent crop when the main crop fails or cannot be planted due to unfavorable climatic conditions. Farmers grow more than 17 varieties of pulses in Myanmar, especially black gram, green mung bean, butter beans, cow peas, soybeans, chickpeas and pigeon peas, on a commercial scale.
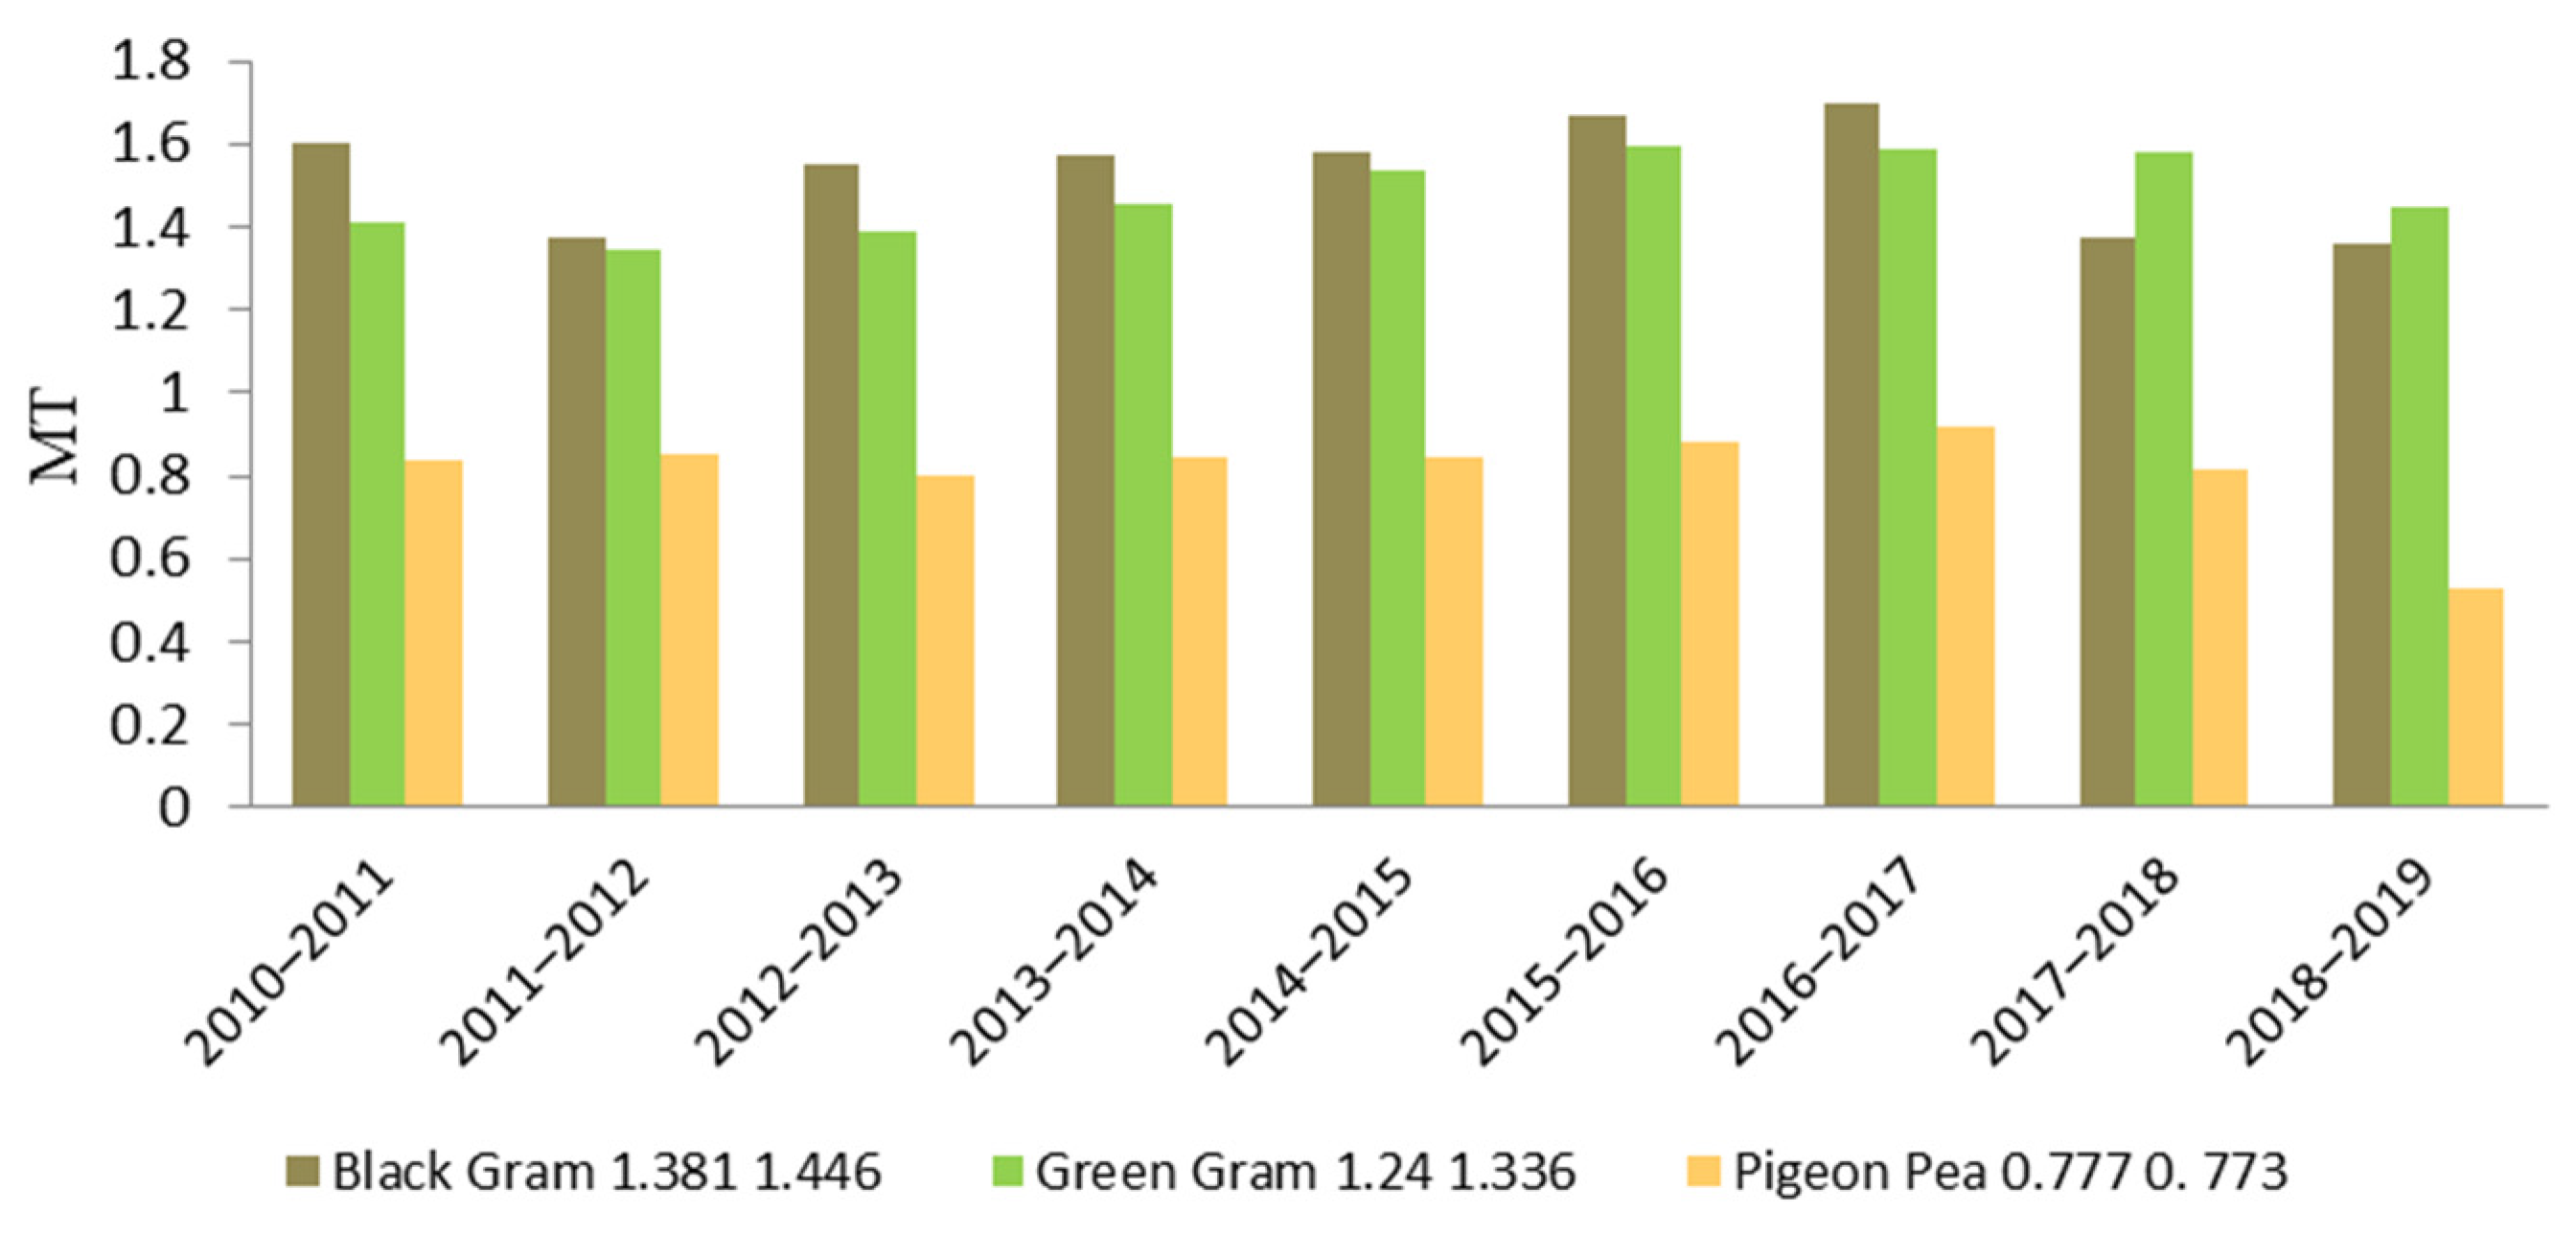
Myanmar is a major pulse-exporting nation among ASEAN countries thanks to the production of various kinds of beans and pulses. Myanmar is the biggest exporter of beans and pulses in Asia and ranked fourth in the world, after Canada, in 2018 [1]. Myanmar’s bean and pulse exports are composed of official (non-border) exports and un-official exports along the borders, mainly to India, Thailand, Bangladesh and China. According to the GIAN Report (2018), black matpe, mung bean and Toor-whole (pigeon pea) are the leading pulse exports in Myanmar, accounting for approximately 80–90% of total exports in the fiscal year 2016/17 [4] (see Figure 1).
About 90% of total production of mung bean is exported for overseas or border trade and has extended markets, especially China, Vietnam and EU countries. Furthermore, mung bean is a low-input crop; thus, it is favored by smallholder farmers. As Myanmar is one of the countries adopting rice intensification, many farmers grow mung bean before and after rice cultivation in a crop-rotation system.
Mung bean is one of the most important crops in Myanmar for its contribution to food security through income generation, as less than 10% of its production is consumed within the country, which is critical in a country where 30% of the rural population lives below the poverty line [5]. Green mung bean is not only better for health than other pulses, but it can also be used as an ingredient in a variety of foods. In Myanmar, it is mainly used for bean sprouts and for making bean vermicelli; thus, farmers grow mung bean over many acres in Myanmar.
In Myanmar, mung bean can be grown for the pre-monsoon, monsoon and post-monsoon seasons based on varieties and land types. In 2018–2019, mung bean was cultivated in almost all regions and states in Myanmar. Mung bean is mainly grown in Bago, Sagaing, Magway, Yangon, Man-dalay, Ayeyerwaddy, Nay Pyi Taw, Kayin and Mon, while other states’ and regions’ production is smaller [1]. Among the 12 mung bean varieties cultivated in Myanmar, farmers mostly cultivate Paedeshwewar (YZ-1), Yezin-11, Yezin-14, Yezin-9 (VR-2001) and Sikepyoyae-1, due to the increased yield per hectare.
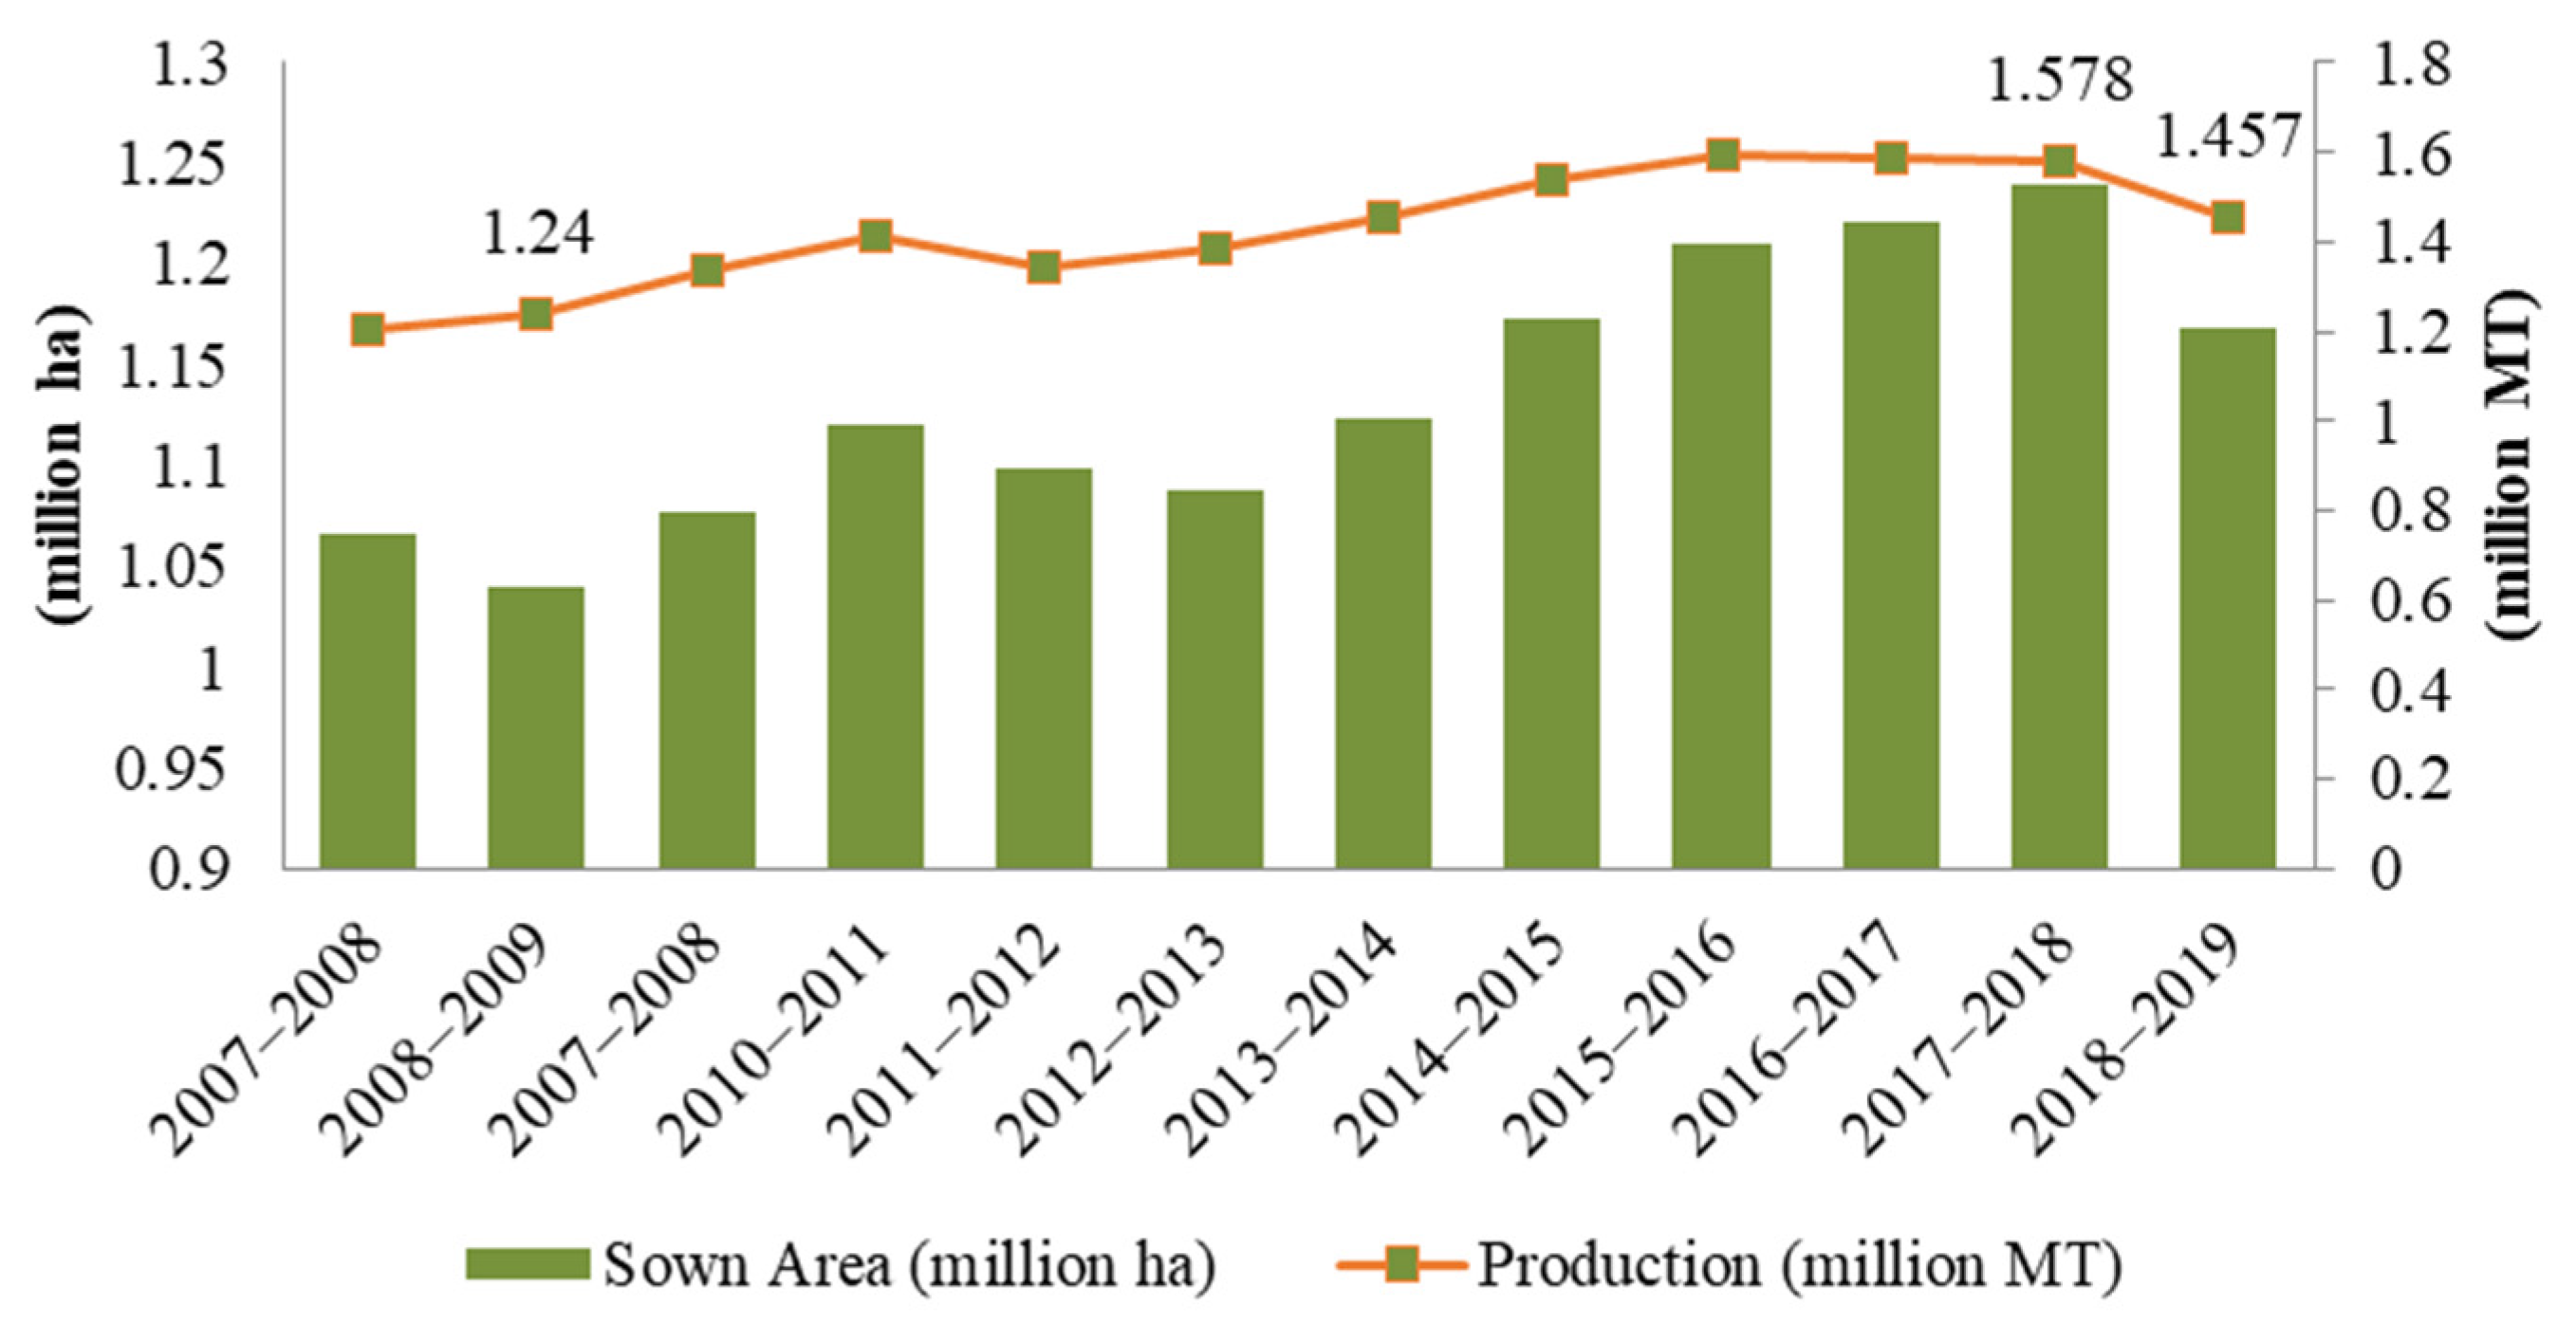
According to the statistical yearbook volumes of CSO (2000–2017), the green mung bean area of 0.04 million ha in 1980 substantially increased to 0.74 million ha in 2000 and to 1.21 million ha in 2016 [1,6], yielding 1.59 million tons, 92% of which was exported [7]. The production of mung bean was 1.578 million metric tons in the 2017/18 fiscal year. In 2018/19, the sown area (in million ha) was 1.169, the yield rate million (in MT/ha) was 1.25 and production was 1.457 million MT [1] (see Figure 2). Even though mung bean production has not significantly decreased in the current situation engulfing Myanmar, this may later result in a problem of low income for farmers.
Smallholder farmers in Myanmar play an important role in the development of agriculture. According to the Myanmar Agriculture Development Strategy (ADS), smallholder promotion should be considered a high priority not only in the rice subsector but also in other subsectors such as pulses, oils and industrial crops. Smallholder production has financial and economic potential to tackle rural poverty and increase rural incomes because it is efficient and competitive throughout the country. Therefore, this study aims to focus on smallholder production of mung bean farmers in Myanmar.
Myanmar’s mung bean producers have a golden opportunity to increase their income as a result of this crop being a major source of agricultural income. Furthermore, the implementation of several projects or programs, as well as technological packages, has promoted mung bean production. That said there are still several limitations regarding this crop, such as limited access to specific inputs, inadequate credit for mung bean production, low levels of experience, inadequate materials, the need for intensive labor and climate change.
Despite there being a considerable market opportunity, many mung bean farmers remain poor due to low productivity and inconsistent production quality. Average mung bean yields in Myanmar are as low as 1.3 tons/ha and yields are even lower in South Asia [5]. This is a challenge because seed quality and current varieties do not have a wide-ranging resistance to pest and diseases [5]. In mung bean production, most farmers generally use excess amounts of chemical pesticides to protect their crops and maintain productivity.
Due to the excessive use of pesticides, the presence of chemical residues affects the export quality of mung bean from Myanmar. Currently, most farms are faced by a scarcity of agricultural labor due to many factors such as urbanization, migration, education and other jobs opportunities [8]. As Myanmar is a developing country, most farmers usually use manual laborers in mung bean production and harvest mung bean pods by hand repeatedly. Therefore, the need for intensive labor in mung bean production is a major risk to the crop’s sustainable production as wages rise and less agricultural labor becomes available [9].
The concern about efficiency is another important concept related to the economy of production. Georg et al. (1999) mentioned that changes in production technology, process efficiency and the environment in which production takes place affects productivity [10]. Farrell et al. (1957) described the concept of efficiency as consisting of three stages of efficiency, namely economic, allocative and technical efficiency (TE) [11]. Technical efficiency is defined by Farrell et al. (1957) as a set of parameters measured in a certain method in relation to a set of firms, and any change in these measurements has an impact on the measurement itself [11]. Put simply, technical efficiency uses a set of inputs to produce a specific output. To measure technical efficiency, two types of analysis methods, such as stochastic frontier analysis (SFA) and data envelopment analysis (DEA), are commonly used. The DEA model has merits and can handle multiple inputs and outputs simultaneously; there is no need to specify restrictive functional forms, unlike the SFA model [12]. Moreover, the DEA model can use variables of different units without requiring standardization.
Data envelopment analysis (DEA), also known as a non-parametric approach, is widely used to estimate firms’ technical efficiency. This method is used to determine an entity’s performance (called DMUs—decision-making units), which varies multiple inputs into multiple outputs [13]. Cooper, Seiford and Zhu (2006) defined DMUs as generic and flexible [14]. The DEA model was first created by Charnes, Cooper and Rhodes (CCR) in 1978 based on Farrell’s first study (1957) [15]. Banker, Charnes and Cooper (1984) introduced the DEA model of efficiency measurement for variable-returns-to-scale (VRS), which divides an entity into scale efficiency and pure technical efficiency [16]. However, the DEA is unable to assume random irregularity [17].
Khan et al. (2019) and Achu et al. (2020) used the DEA model to study the technical efficiency of crop production (Irish potato and maize production in Cameroon, respectively). Khan et al. (2019) [18] found that farmers who were older and more experienced were more efficient and that female-headed households had more possibilities to improve efficiency levels in Irish potato production. In addition, the accessibility of credit also had a significantly positive impact on technical efficiency. Achu et al. 2020) [19] found that farmers’ formal education, use of manure and hired labor, farm experience, participation in a farmers’ organization and acceptable extension services positively influenced maize production efficiency.
Additionally, in Myanmar, several studies on technical efficiency were carried out regarding researchers’ objectives and implications for future development. For example, Yu et al. (2012) and Thuzar et al. (2019) studied technical efficiency in rice production using the DEA model. Yu et al. (2012) [20] found that household size, family labor and farm mechanization had a significantly positive impact on the technical efficiency level of rice farms. Thuzar et al. (2019) [21] found that age of famers, education, farm experience and access to agricultural extension services and improved crop variety had a significantly positive influence on the technical efficiency of rice production.
However, studies related to the technical efficiency of mung bean crop production are rare, and very little is known about it, despite mung bean being an important crop in Myanmar. This study aims to ameliorate this shortcoming. Moreover, increasing mung bean productivity will significantly impact famers’ incomes. As such, this study aims to examine the levels of technical efficiency among mung bean producers and determine the factors influencing the technical efficiency level of mung bean production.
The second section of this paper explains the materials and methods used in this study. In the third section, a description of the data and variables used in this study is found. The technical efficiency results from the data envelopment analysis and results from Tobit regression are presented and discussed in the fourth section. In the last section, the conclusions of this study and some implications for mung bean production are considered.

2. Materials and Methods

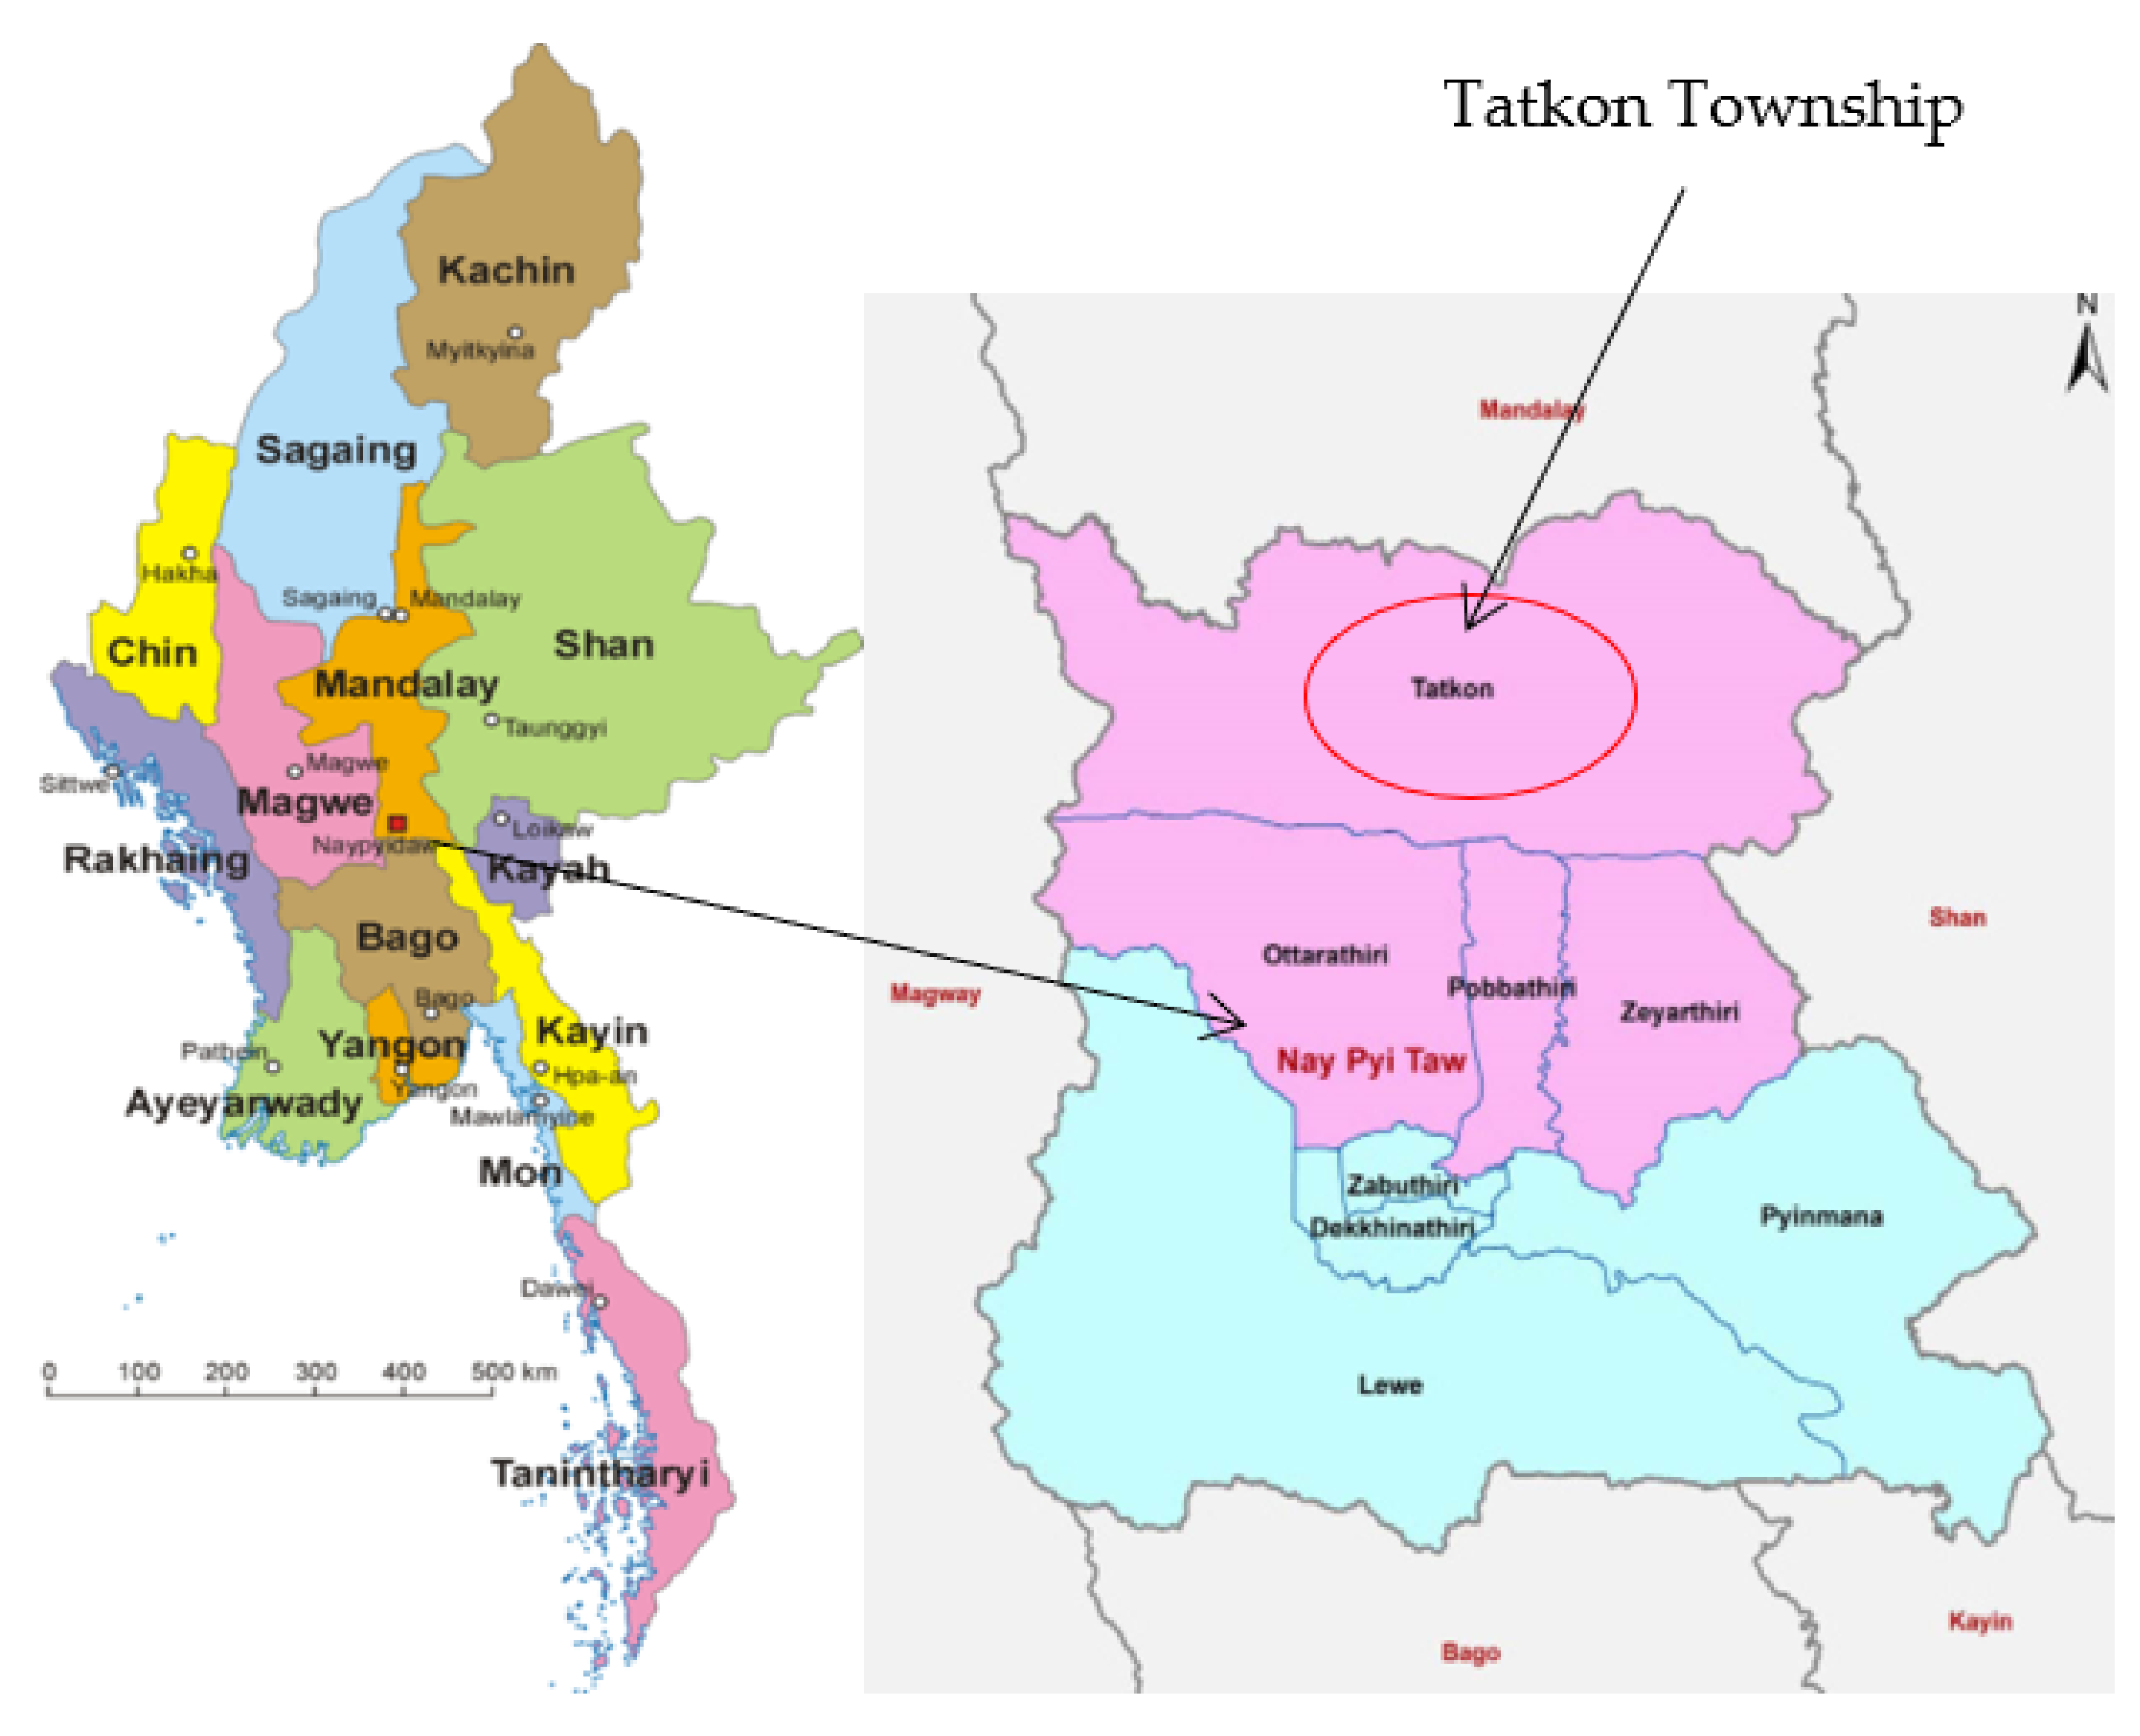
This study was carried out in Tatkon Township in Nay Pyi Taw Union Territory, which is located in the central part of Myanmar (shown in Figure 3). The primary data for this study were randomly collected through survey questionnaires among mung bean farmers in four villages of Tatkon Township in January 2021 for the pre-monsoon season mung bean crop. The total targeted sample size was 150 households, and 144 households returned the surveys. Farmers who responded to this study mainly grow mung bean crop after rice cultivation and experience unfavorable ecological conditions (such as climate, topography and geographical location) for mung bean cultivation. The information was collected regardless of a farmer’s socioeconomic characteristics such as age, education level, farming experience and economic status, to obtain the important information related to the study of technical efficiency in the study area. Secondary data were also collected, namely geographical information and mung bean production data of the study area.
A two-step analysis method was used to address the objectives of the study. In the first step, a non-parametric data envelopment analysis (DEA) was used to measure the levels of technical efficiency among mung bean farmers as an explicit function of discretionary variables. In the second stage, regression based on the Tobit model was used to conduct an econometric analysis to reveal farm and farmers’ characteristic variables that influenced efficiency. To estimate the model, STATA (version 16) software was used.
In this study, a DEA model was used to measure the levels of technical efficiency among mung bean farmers in the study area. Two basic models are usually used in DEA with two different frontiers. The first one is a constant-returns-to-scale (CRS) model, which is suitable when all firms are operating at an optimal scale; this is rare as competition is rife among farmers. The second is a variable-return-to-scale (VRS) model, which is used when different firms are not operating under an optimal scale; this is usually the case due to the competition among farmers [22].
Technical efficiency measurements were introduced by M.J. Farrell (1957) [10] with two orientations: (i) input orientation and (ii) output orientation. The input-oriented DEA minimizes the level of inputs, which demonstrates how much a firm can reduce its input level for a given output level or can achieve the same output level. In an output-oriented DEA, output level is maximized, which shows how much a given firm can increase its output while holding the same level of inputs.
In this study, the output-oriented VRS of the DEA model was utilized to measure the technical efficiency of mung bean farms. Equation (1) of the DEA model for output orientation under VRS was described by Cooper et al. as follows [14]:
Max   θ Subject   to: x i X μ 0 θ y i y μ 0 e λ = 1 λ   0
where θ is a scalar showing by how much the production of each firm can increase output, yi is the amount of output by ith DMU, xi is the amount of input used by ith DMU and λ is a dual variable. The efficiency scores range from 0 to 1. If the efficiency score is equal to 1 (θ = 1), then the current output levels cannot be increased proportionally, indicating that a DUM or firm is technically efficient. Efficiency scores less than 1 indicate that the firm still needs to operate efficiently at a given level of inputs.
In the second step of this study, Tobit regression analysis was used to investigate the factors influencing technical efficiency in mung bean production. The efficiency scores obtained by implementing the DEA analysis in the first stage were used as the dependent variable, and the selected farm and farmer’s socio-characteristics were used as the independent variables in the Tobit regression analysis. The efficiency scores lie in the interval of zero and one (unity) or equal to these boundary values in which zero is the lower limit and one is the upper limit.
According to the empirical studies mentioned in section 1.2, technical efficiency can be influenced by socioeconomic and farm characteristics. Therefore, we include variables such as gender, age, education, farm experience, family size and credit, extension services and training accessed by farmers, participation in a farming association and variety of available water and soil fertility in our regression model. Thus, Equation (2) for the Tobit model can be specified for the study as follows:
Efficiency i = β 0 + β 1 Gen i + β 2 Age i + β 3 Edu i + β 4 Exp i + β 5 Memsize i + β 6 Cred i +   β 7 Ext i + β 8 Train i +   β 9 Asso i +   β 10 Var i +   β 11 Water i +   β 12 Soil i +   μ i
where μi is the error term, β0 is constant or intercept, βi is parameters to be estimated (i = 1, 2, 3 …). Gen represents gender (dummy variable, 1 = male, 0 = female); Age represents the age of the farmer (years); Edu represents the education level of the farmer (1 = monastery, 2 = primary level, 3 = middle level, 4 = higher level); Exp represents farm experiences of farmer (years); Memsize represents the members of family in a household (persons); Cred represents credit accessed by farmer (dummy variable, 1 = yes, 0 = no); Ext represents extension services accessed by the farmer (dummy variable, 1 = yes, 0 = no); Train represents training accessed by the farmer (dummy variable, 1 = yes, 0 = no); Asso represents a farmer’s participation in a farming association (dummy variable, 1 = yes, 0 = no); Var represents variety used in cultivation (such as Yezin 11 or Yezin 14); Water represents the sources water available (dummy variable, 1 = irrigation, 0 = ground water and rain); Soil represents soil fertility (1 = good, 0 = not good).

3. Data

A summary description of the variables for the farm and farmer’s socio-economic characteristics is described in Table 1. In the study area, the majority of the respondents were male heads of households (95.14%), while the remaining 4.86% were female heads of households. The age of the head of household is one major factor that determines farming experience. This result indicated that the average age of respondents was 52 years old, and their age ranged from 21 to 79, with standard deviations of 12.21.
In general, educated farmers could access new agricultural technologies and better manage their farm activities. The education system in Myanmar is recognized as comprising four levels: monastery education level, which assumes 0 years of schooling; primary education level, from 1 to 5 years; secondary (middle) education level, from 6 to 9 years; and higher education, which is longer than 9 years.
The majority of households were primary, secondary and monastery education levels with 42.36, 30.56 and 16.67%, respectively, while the rest of the farmers had undergone higher levels of education. This result showed that most of the farmers had low levels education and that farmers with slightly more education were farming for a livelihood. The average family size of sampled households was about four persons per household, while the average number of dependent family members was about one person per household.
On average, total farm area that was owned by farmers was about 2.18 hectares, with a maximum area of 7.28 hectares; however, the minimum area was 0.40 hectares. For mung bean production, 49% of the farmers sampled cultivated less than 1 hectare and 38% cultivated from 1 to 2 hectares, while the rest of the farmers sampled cultivated more than 2 hectares. Average total farming experience was about 29 years, and experience with mung bean production was about 14 years.
Most of the farmers rely on crop cultivation, but some farmers have an off-farm income from secondary jobs such as livestock husbandry, small businesses, trade, and family members. About 51% of the farmers sampled rely only on crop cultivation for their earnings, with an average income of about MMT 2.9 million per year. The rest of the farmers sampled had an off-farm income, with an average income of about MMT 0.91 million per year from secondary jobs. About 92.36% of the farmers sampled had no access to credit for their production, while the rest of the farmers sampled did have access.
About 66% of the farmers sampled received extension services for mung bean production, while the rest did not. About 54% of the farmers sampled had no access to farming training related to mung bean production, while the rest of the farmers sampled did. Most of the sampled famers (about 90%) in the study area did not participate in any farmer associations, and just 10% of the farmers sampled were members of a farmer association.
Moreover, based on farmers’ perceptions, soil fertility in the study area was good; about 74% of the farmers could cultivate mung bean in the soil. Irrigated mung bean production was rare, with approximately 6% of the farmers growing the crop with irrigation, while 94% of them grew mung bean with others water sources such as ground water and rain (about 65 and 29%, respectively).
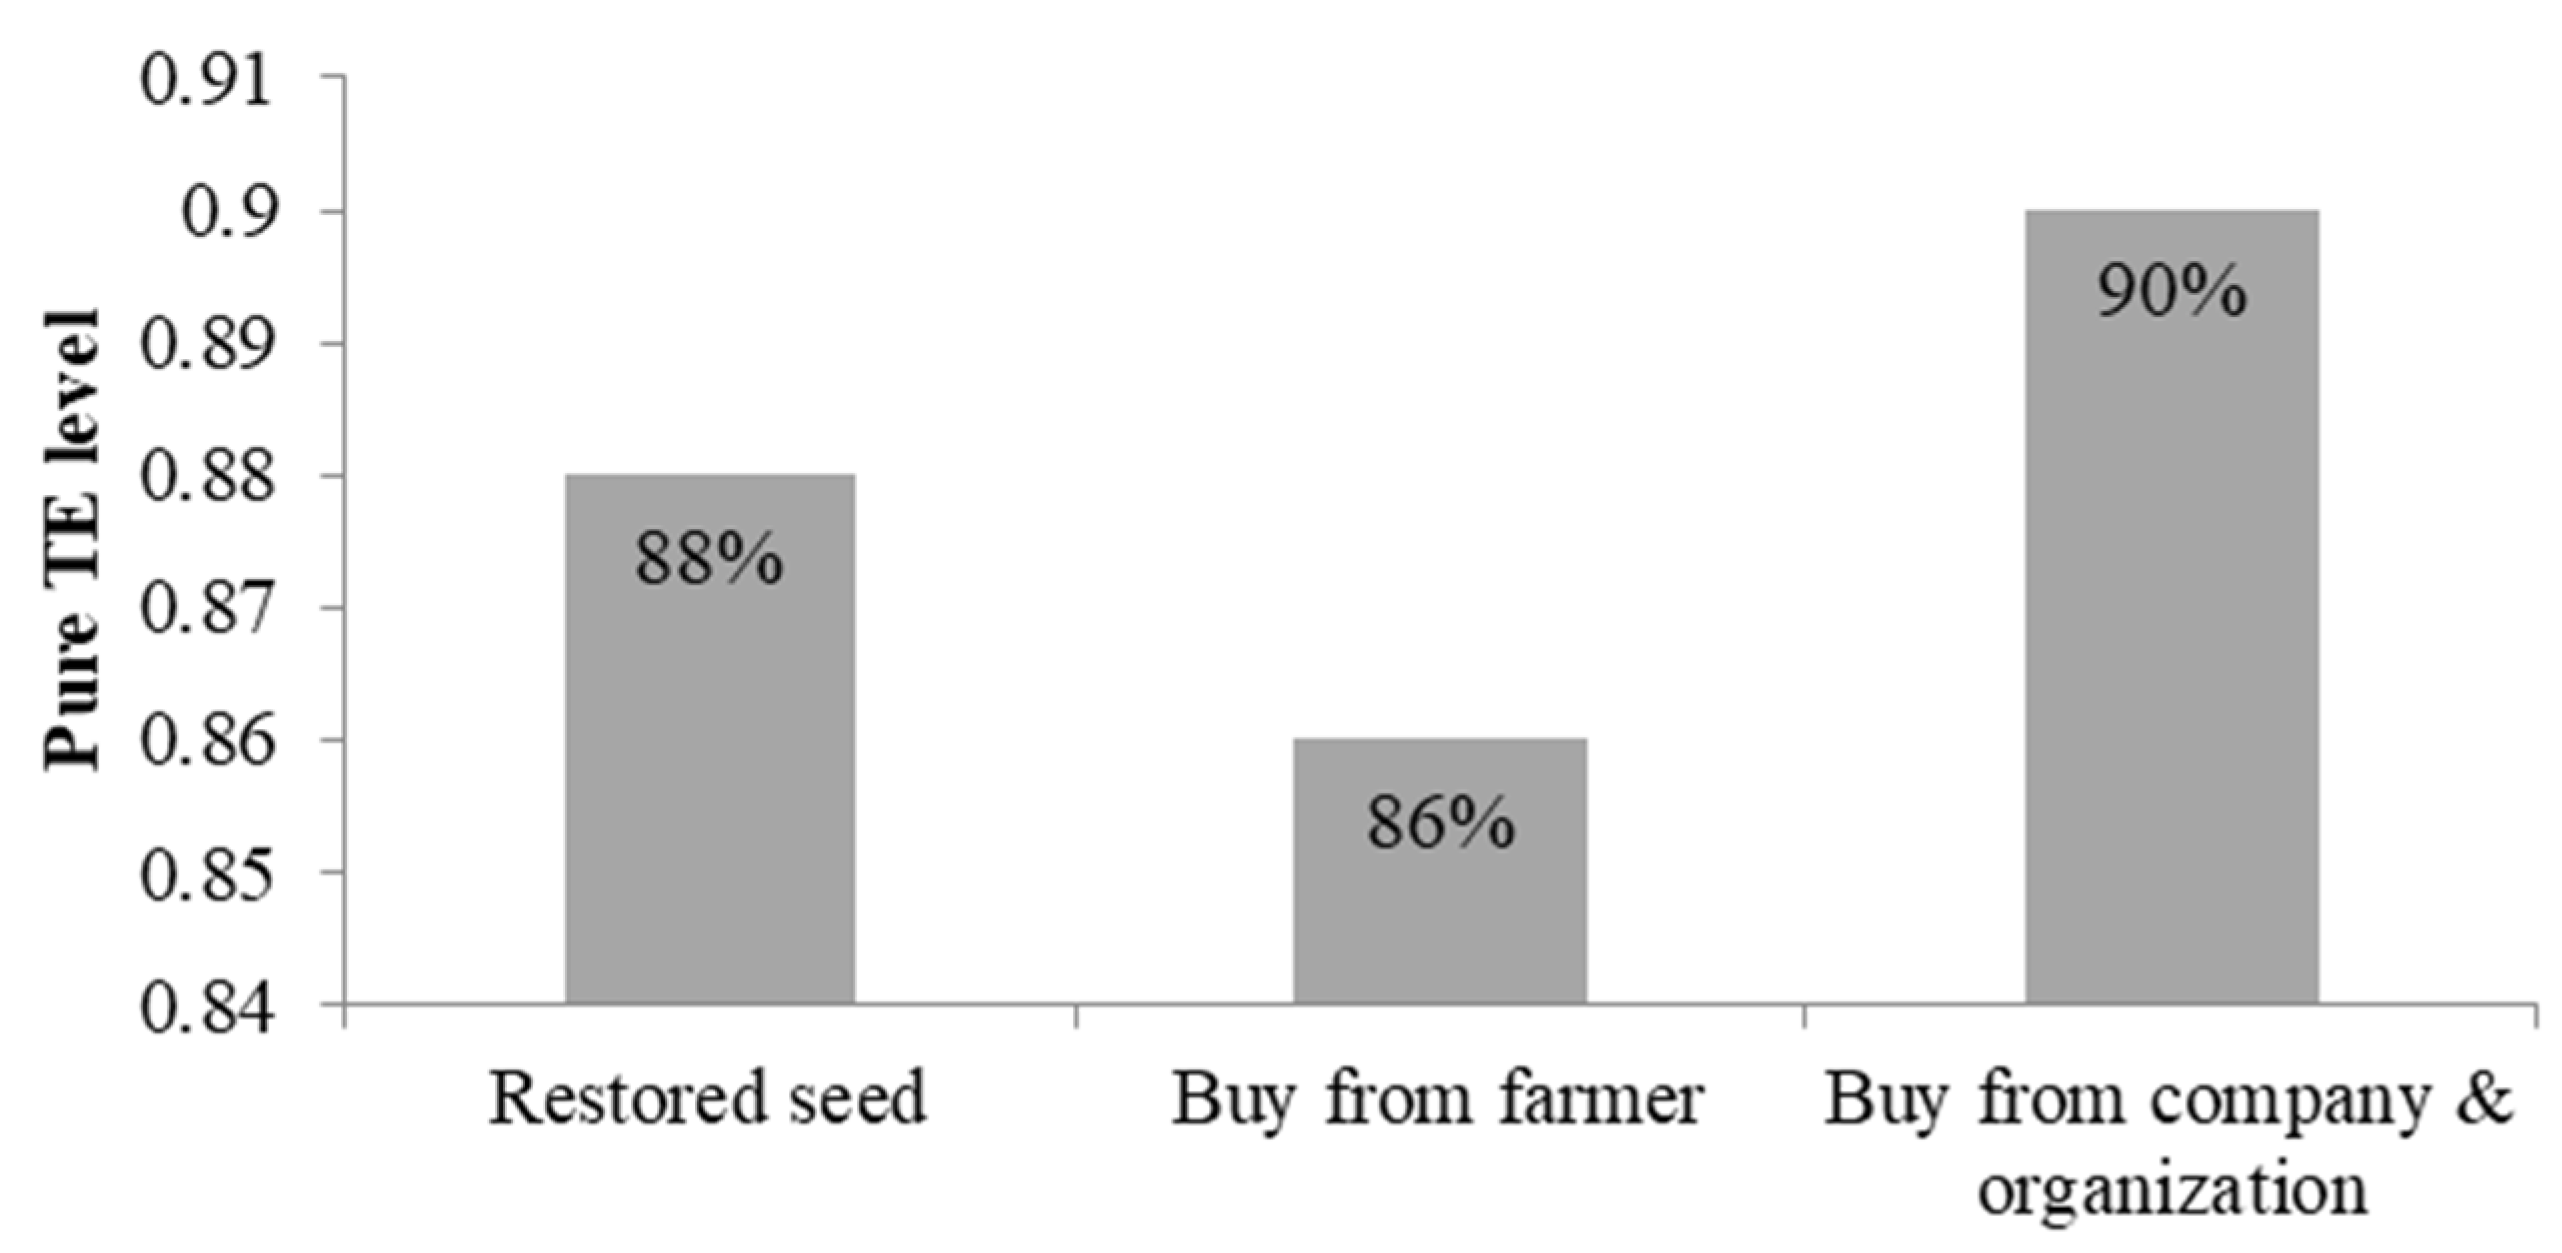
Most farmers in the study area used Yezin 14 (Yoesein) variety (about 62%), while the rest of the farmers used Yezin 11 (Yoeni) variety. These varieties are not only yield-improvement varieties and resistant to yellow mosaic disease, but they can also be grown in the pre-monsoon or late-monsoon seasons. About 74% of the sample farmers restored seed from the previous season for the next cultivation, while the rest of the farmers sampled bought seed from other farmers. However, there were fewer farmers who bought seed from companies or other organizations (about 3% and 6%, respectively).

4. Results and Discussion

4.1. Technical Efficiency Indices

In the DEA model, the variables of seven inputs and one output are used to analyze technical indices (TEIs) or scores. Inputs included the mung bean planted area in hectares, the use of seed rate (kg/ha), labor employed in mung bean production (man-day/ha), the amount of capital (machinery cost/ha) used in land preparation, the quantity of chemical fertilizer applied (kg/ha), the amount of manure applied (cart/ha) and the quantity of pesticide applied (cc/ha) in mung bean production. The summary statistics of variables used in the DEA model are shown in Table 2.
The average output of mung bean harvested was approximately 1.29 ton per hectare, with a minimum of 0.49 tons and a maximum of 2.42 tons per hectare in the study area. The mung bean planted area showed a minimum of approximately 0.20 ha, while the maximum was 5.67 hectares, with an average 1.19 hectares in the mung bean planted area. The average quantity of mung bean seeds was approximately 24.4 kg per hectare, ranging between 10.1 kg and up to 40.3 kg per hectare. The mean labor used in mung bean production for one hectare was approximately 193 man days, with maximum labor of 312 man days and minimum labor of 64 man days, approximately.
In the study area, all farmers sampled used a machine for land preparation, with a minimum cost of MMT 42,007 and a maximum cost of MMT 84,014 per hectare. The mean quantity usage of chemical fertilizer was about 54.7 kg per hectare, but some of the farmers sampled did not use any chemical fertilizer in their cultivation. The average use of cow-dung manure was about six carts per hectare, while the average usage of pesticide was approximately 1933 cc per hectare in a range of 0 cc up to 7413 cc per hectare.
The results of the technical efficiency scores using the VRS-output-oriented DEA efficiency under CRS, VRS and SE are described in Table 3. Farms that had a technical efficiency score of 1 were fully efficient relative to other farms. The result shows that the mean value of overall technical efficiency is 0.87, with a minimum level of 51% and maximum level of 100%. The mean value of pure technical efficiency is 0.882, with a minimum level of 52% and a maximum level of 100%. The average index of scale efficiency is 0.986, with a range of 0.815 up to 1. The majority of the overall technical efficiency scores and pure technical efficiency scores of the farmers sampled fell within the range of 0.80 and 1.00. This result indicates that farmers can still increase their average pure efficiency level by 12% with best practices and managerial skill at a given level of inputs to produce greater output. However, 36% of the farmers are fully technically efficient in the study area.

4.2. Scale Efficiency

Scale efficiency provides useful information for farmers to estimate whether the production scale should be changed so as to increase efficiency. The average result of scale efficiency (SE) score is 0.99, as shown in Table 3, which means that technical efficiency can be increased by 1%, thereby changing the scale of production. The observed returns-to-scale (RTS) of the farmers sampled are presented in Table 4. Among the 144 farmers sampled, about 39% operate under constant-return-to-scale efficiency (CRS). About 49% of the farms operate under an increasing-return-to-scale (IRS), which means that 71 farmers operate below their optimal scale. Thus, these farms could increase their technical efficiency by increasing their scale. The result also indicates that 12% of farms operate under decreasing return-to-scale (DRS), which means that these farms operate above their optimal scale; thus, these farms can increase their technical efficiency by decreasing their scale.

4.3. Factors Influencing Technical Efficiency

The technical efficiency of mung bean farmers was estimated by the DEA model at the first stage. In the second stage, the Tobit model was used to reveal farm and farmer characteristic variables that influence the efficiency of farmers sampled in the study area. Table 5 shows the Tobit regression results for factors influencing technical efficiency. In this table, five of the selected variables—age of farmer, family size, farmer association, water availability and soil fertility—were statistically significant. Other variables such as gender, education, farm experience, access to credit, extension service and training by farmers and variety used were not statistically significant.
The coefficient of age is positive and significant at a 10% level. The coefficient of family size is statistically significant at a 10% level, and it has a negative impact on technical efficiency. Thus, one more family member cannot increase the technical efficiency in mung bean production, and most farmers usually use hire labor for production.
Participating in farmer associations is positively related to efficiency. Producers can obtain more information related to an increase in crop production through the association. The coefficient of water availability is statistically significant at a 10% level, and it has a negative impact on technical efficiency. This means that farmers who usually use ground water and rain as water resources for mung bean cultivation are more technically efficient than those who use irrigation water. Soil fertility is also an important factor for crop cultivation. The result indicates that soil fertility for mung bean production in the study area is statistically significant at a 5% level and has a positive effect.
Some farmer organizations can be found in the study area, meaning they can solve problems and requirements in crop production to access credit for cultivation from cooperatives and certified seed production zones; this is a result of the grouped nature of farmer organizations. For example, a water-use group might seek to reduce water waste, while a cooperative group might help to access loans for the cultivation and growth of seeds from a seed grower association (SGA).
However, there are weaknesses in farmer associations such as farmers’ unwillingness to participate, less unity and declining membership. The result of this study also demonstrates that farmers who are members of farmer associations or organizations are 93% technically efficient, but no members are 87% efficient in their mung bean production (see in Figure 4).
Moreover, in 2011–2012, the government in Myanmar released new and improved local varieties of mung bean, such as Yezin-6, Yezin-8, Yezin-9, Yezin-11 and Yezin-14, to increase production. Therefore, the Yezin-14 variety is one of the new and improved resistant varieties, and farmers mostly use this variety in the study area. However, our results show that, if farmers use this variety, the average efficiency level decreases by 3.4%. This may because many farmers in Myanmar use the seed for cultivation from the previous season. The restoration of seeds from the previous season needs to be addressed in the future.
The use of restored seed may cause many problems, especially for mung bean production. For example, some farmers use chemical pesticides for mung bean cultivation to protect serious cases of yellow mosaics vector virus. Thus, germination can lower the impact of chemical residues, decreasing the yield. The result of this study shows that farmers who use seed bought from companies and organizations are more purely technically efficient on average (90%) than those who buy from other farmers and restore the previous season’s seed (86% and 88%, respectively) (see in Figure 5).

5. Conclusions and Implications

In this study, we estimated the technical efficiency scores of mung bean farms in Myanmar using an output-oriented VRS DEA model. The specific objectives of this study were to measure the technical efficiency level of mung bean producers and determine the factors influencing the technical efficiency of mung bean production.
Our results showed that about 46% of farmers have an efficiency score higher than 0.90. This result indicates that 54% of farmers are relatively inefficient in their production of mung bean. Farmers still need to improve their existing technical efficiency while maintaining the same level of inputs and using existing technology. Our result showed that the age of farmers is positively related to technical efficiency, which is consistent with results of previous studies by Moges et al. (2018) [23] and Khan et al. (2019) [18]. These authors indicated that older farmers were more efficient than younger farmers due to farmers becoming more skillful and knowledgeable as they become older. In addition, farmers’ associations are positively related to technical efficiency, which means that farmers who participate in farmers’ associations derive more benefits from better access to inputs and information to improve their farming practices. This result is consistent with the empirical work of Achu et al. (2020) [19]. The other positively influencing factors related to technical efficiency were gender, education, a farmer’s access to credit and extension services.
According to the results, the government should provide more services, such as information, assistance, new technologies and best-practices and farm managerial skills, to older farmers. Moreover, the government should create more extension services for farmers and should also provide training to government extension staff to improve their capacity to deliver services, knowledge and information to farmers. Opportunities for farmers to access grants or loans for production (mung bean crop) should also be created. In addition, the government should promote farmers who participate in farmers’ associations or organizations to solve problems or requirements related to crop cultivation, and it should also encourage cooperative farming groups to access the credit more easily. Furthermore, it should also support soil fertility and the conservation of soil fertility programs, as improved varieties often promote the production of more certified seeds.

Author Contributions

Conceptualization: P.P.P.A. and J.-Y.L.; methodology: P.P.P.A.; formal analysis: P.P.P.A.; writing—original draft preparation: P.P.P.A.; writing—review and editing: J.-Y.L.; supervision: J.-Y.L. All authors have read and agreed to the published version of the manuscript.

Funding

This research received no external funding.

Informed Consent Statement

Informed consent was obtained from all subjects involved in the study.

Acknowledgments

The authors appreciate the support and cooperation of the Department of Planning and the Department of Agriculture under the Ministry of Agriculture, Livestock and Irrigation, and also thank all farmers and enumerators for collecting data in the study area.

Conflicts of Interest

The authors declare no conflict of interest.

References

  1. The Ministry of Agriculture, Livestock and Irrigation (MOALI). Myanmar Agriculture in Brief, 2018 and 2019; The Ministry of Agriculture, Livestock and Irrigation: Naypyidaw, Myanmar, 2019.
  2. Andrew, L. Pulses Value Chain Analysis in Myanmar; Myanmar Economics Bulletin; Myanmar Development Institute: Naypyidaw, Myanmar, 2019; Available online: https://www.academia.edu/43931122/PULSES_VALUE_CHAIN_ANALYSIS_IN_MYANMAR (accessed on 9 November 2021).
  3. Tun, Y.Y.; Phyo, A. Economic Analysis of Green Mung Bean in Selected Area, Myanmar. Int. J. Sci. Res. 2019, 8, 394–401. [Google Scholar]
  4. The Global Agricultural Information Network (GIAN). Report, USDA Foreign Agricultural Service, BM 802, Myanmar Beans and Pulses Update. 2018. Available online: https://www.fas.usda.gov/data/burma-myanmar-beans-and-pulses-update-2018 (accessed on 9 November 2021).
  5. Sequeros, T.; Schreinemachers, P.; Depenbusch, L.; Shwe, T.; Nair, R.M. Impact and returns on investment of mungbean research and development in Myanmar. Agric. Food Secur. 2020, 9, 5. [Google Scholar] [CrossRef]
  6. Central Statistical Organization (CSO); Government of the Republic of the Union of Myanmar. Statistical Yearbook Volumes (2000–2017); CSO: Naypyidaw, Myanmar, 2017.
  7. Haggblade, S.; Boughton, D.; Kham, L.S.; Thaung, M. Winds of Change: A Rapid Appraisal of Four Pulse Value Chains in Myanmar. Working Paper. 2014. Available online: http://fsg.afre.msu.edu/Myanmar/Pulsesand_BeansValue_ChainDiagnos-tic_final_draft.pdf (accessed on 9 November 2021).
  8. Phyo, A.S.; Grunbuhel, C.M.; Williams, L.; Htway, S.S. Does Selective Mechanisation Make up for Labour Shortages in Rural Myanmar? In IOP Conference Series: Earth and Environmental Science; IOP Publishing: Bristol, UK, 2019; Volume 338, p. 012010. [Google Scholar]
  9. Farnworth, C.; San, A.; Kundu, N.; Islam, M.; Jahan, R.; Depenbusch, L.; Nair, R.; Myint, T.; Schreinemachers, P. How Will Mechanizing Mung Bean Harvesting Affect Women Hired Laborers in Myanmar and Bangladesh? Sustainability 2020, 12, 7870. [Google Scholar] [CrossRef]
  10. Georg, W. Data Envelopment Analysis in the Service Sector; Part of the Harzer Wirtschaftswissenschaftliche Schriften Book Series (HWS); Springer Nature: Basingstoke, UK, 1999; Available online: https://link.springer.com/book/10.1007/978-3-663-08343-6 (accessed on 9 November 2021).
  11. Farrell, M.J. The Measurement of Productive Efficiency. J. R. Stat. Soc. Ser. A 1957, 120, 253–290. [Google Scholar] [CrossRef]
  12. Coelli, T.J.; Rao, D.S.P.; O’Donnell, C.J.; Battese, G.E. An Introduction to Efficiency and Productivity Analysis, 2nd ed.; Springer: Berlin/Heidelberg, Germany, 2005. [Google Scholar]
  13. Violeta, C. Data Envelopment Analysis Approach and Its Application in Information and Communication Technologies. In Proceedings of the Sustainable Agri-Production and Environment (HAICTA 2011), Skiathos, Greece, 8–11 September 2011; Available online: http://ceur-ws.org/Vol-1152/paper37.pdf (accessed on 9 November 2021).
  14. Cooper, W.W.; Seiford, L.M.; Zhu, J. Handbook on Data Envelopment Analysis; Springer: Berlin/Heidelberg, Germany, 2006; 593p, reprinted in 2011. [Google Scholar]
  15. Charnes, A.; Cooper, W.W.; Rhodes, E. Measuring the efficiency of decision-making units. Eur. J. Oper. Res. 1978, 2, 429–444. [Google Scholar] [CrossRef]
  16. Ji, Y.B.; Lee, C. Data envelopment analysis. STATA J. 2010, 10, 267–280. [Google Scholar] [CrossRef] [Green Version]
  17. Duncan, M. Competing Methods for Efficiency Measurement: A Systematic Review of Direct DEA vs. SFA/DFA Comparisons, Working Paper 136. 2002. Available online: https://www.monash.edu/__data/assets/pdf_file/0006/1882131/WP136.PDF (accessed on 9 November 2021).
  18. Mengui, K.C.; Oh, S.; Lee, S.H. The Technical Efficiency of Smallholder Irish Potato Producers in Santa Subdivision, Cameroon. Agriculture 2019, 9, 259. [Google Scholar] [CrossRef] [Green Version]
  19. Achu, E.; Lee, D.S. Factors Influencing the Technical Efficiency of Small-scale Maize Farmers in the Foumbot and Foumban Subdivisions in Cameroon. J. Agric. Life Environ. Sci. 2020, 32, 205–215. [Google Scholar] [CrossRef]
  20. Kang, H.J.; Tun, Y.Y. An Analysis on the Determinants Affecting Productive Efficiency of Myanmar Rice Farms: An Appraisal using Bootstrapping DEA-Based Efficiency Measures. Korean J. Agric. Econ. 2012, 53, 43–59. [Google Scholar]
  21. Linn, T.; Maenhout, B. Measuring the Efficiency of Rice Production in Myanmar Using Data Envelopment Analysis. Asian J. Agric. Dev. 2019, 16, 1–24. [Google Scholar] [CrossRef]
  22. Huguenin, J. Data Envelopment Analysis (DEA), A Pedagogical Guide for Decision Makers in the Public Sector, IDHEA—Cahier 276. 2012. Available online: https://www.semanticscholar.org/paper/Data-Envelopment-Analysis-(DEA)-%3A-A-pedagogical-for-Huguenin/01ccf592671bdbc1d0e728a8bf216226959e56d4 (accessed on 9 November 2021).
  23. Dessale, M.; Tegegne, B.; Beshir, H. Technical Efficiency in Teff Production: The Case of Smallholder Farmers in Jamma District, South Wollo Zone, Ethiopia. J. Econ. Sustain. Dev. 2018, 9. Available online: www.iiste.org (accessed on 9 November 2021).
Figure 1. Major exportable pulse production in Myanmar (million ton). Source: MOALI.
Agriculture 11 01249 g001
Figure 2. Mung bean sown area and production in Myanmar from 2008/09 to 2018/19. Source: MOALI.
Agriculture 11 01249 g002
Figure 3. Map of Nay Pyi Taw Territory (showing study area: Tatkon Township). Source: https://en.wikipedia.org/wiki/Myanmar#/media/File:Burma_en.png (accessed on 30 September 2006) & 2014 Tatkon Township report by Ministry of Labor, Immigration and Population.
Agriculture 11 01249 g003
Figure 4. Average pure TE level by membership of a farmers’ association.
Agriculture 11 01249 g004
Figure 5. Average pure TE level by sources of seed.
Agriculture 11 01249 g005
Table 1. Summary description of farm and farmer’s socio-economic characteristics.
VariableDescription and CategoriesMean SD
GenderDummy variable (1 = male, 0 = female)0.95 0.22
AgeAge of farmer (years)52.2 12.2
Educationlevel (1 = monastery, 2 = primary level, 3 = middle level, 4 = higher level)2.35 0.88
Family sizeNo. of family member in a household (persons)4.21 1.53
No. of dependentNo. of dependent family member in a household (person)1.26 1.08
Farm sizeTotal farm size possessed by farmer (ha)2.18 1.45
Mung bean Farm sizeLess than 1.0 ha 48.6%
1.0–2.0 ha 38.2%
More than 2.0 ha 13.2%
Farming experienceTotal farm experience of farmer in crop cultivation (years)29.3 13.1
Mung bean experienceFarm experience in mung bean production (years)14.0 5.48
CultivationFarmer’s income from cultivation only (MMT million/year)2.93 2.22
Off-farm incomeFarmer’s income from other (MMT million/year)0.91 1.42
CreditCredit access (1 = yes, 0 = no)0.08 0.27
Extension serviceAccess to extension service (1 = Yes, 0 = No)0.66 0.47
TrainingAccess to training related with mung bean production
(1 = yes, 0 = no)
0.46 0.50
MembershipMembership association (1 = yes, 0 = no)0.10 0.31
Soil fertilityDummy variable (1 = good, 0 = not good)0.74 0.44
Water availabilityDummy variable (1 = irrigation, 0 = no irrigation)0.06 0.24
No irrigation
Rain 29%
Ground water 65%
Used varietyDummy variable (1 = Yezin14, 0 = Yezin11)0.62 0.49
Source of VarietyRestore seed from previous season 74.3%
Buy from other farmers 16.7
Buy from a company 2.78%
Buy from another organization 6.25%
Note: 1 hectare = 2.471 acre, “MMT” is Myanmar currency (USD 1 = MMT 1330 in January 2021).
Table 2. Summary statistics of variables used in the data envelopment analysis (DEA) model.
VariablesDescription and UnitMeanStd. Dev
Output
YieldQuantity of mung bean (ton/ha)1.290.42
Inputs
Farm sizeNumber of mung bean farm (ha)1.190.74
Seed rateUse of seed rate (kg/ha)24.46.86
LaborUse of human labor (man-day/ha)19261.94
Capital (Machine)Use of machine in land preparation (MMT/ha)58,92620674
Chemical FertilizerUse of chemical fertilizer (kg/ha)54.779.4
Manure (cow-dung)Use of cow-dung manure (cart/ha)66
PesticideUse of pesticide (cc/ha)19331361
Note: 1 hectare = 2.471 acres. “MMT” is the Myanmar currency (USD 1 = MMT 1330 in January 2021).
Table 3. Frequency distribution of technical efficiency scores in DEA.
Efficiency ScoresOverall TEPure TEScale Efficiency
Number%Number%Number%
1.004128%5236%5639%
0.90–1.002014%1510%8559%
0.80–0.904733%4733%32%
0.70–0.802115%1712%--
0.60–0.7096%75%--
0.50–0.6064%64%--
Mean efficiency0.870 0.882 0.986
Min efficiency0.515 0.522 0.815
Max efficiency1 1 1
Note: Overall TE (CRS—constant return to scale), pure TE (VRS—variable return to scale).
Table 4. Frequency distribution of scale efficiency under variable-returns-to-scale (VRS) frontier.
Return to ScaleFrequencyPercent
Decreasing Return to Scale1711.8%
Constant Return to Scale5638.9%
Increasing Return to Scale7149.3%
Total144100%
Table 5. Tobit regression estimation results for factors influencing technical efficiency (TE).
VariablesCoefficientStd. Errort-Value
Constant0.694 ***0.1614.320
Gender0.1280.0941.360
Age of Farmer0.003 *0.0021.700
Education0.0140.0200.680
Farm experience−0.0030.003−0.910
Family size−0.020 *0.011−1.880
Access to credit0.0460.0700.560
Extension service0.0230.0830.600
Training−0.0410.039−1.140
Farmer association0.118 **0.0362.460
Variety use−0.0340.048−1.190
Water Availability−0.061 *0.036−1.670
Soil Fertility0.095 **0.0372.550
No. of observation144
Log likelihood−5.325
Note: *, ** and *** represents levels of significance of 10%, 5% and 1%, respectively. Robust standard errors are used.
Publisher’s Note: MDPI stays neutral with regard to jurisdictional claims in published maps and institutional affiliations.

