Abstract
To investigate the effect of paddy-upland (PU) rotation system on greenhouse gas emissions, methane (CH4) and nitrous oxide (N2O) emissions were monitored for three years for a PU rotation field (four cultivations (wheat-soybean-rice-rice) over three years) and continuous paddy (CP) field on alluvial soil in western Japan. Soil carbon storage was also calculated using an improved Rothamsted Carbon (RothC) model. The net greenhouse gas balance was finally evaluated as the sum of CO2eq of the CH4, N2O and changes in soil carbon storage. The average CH4 emissions were significantly lower and the average N2O emissions were significantly higher in the PU field than those in the CP field (p < 0.01). On CO2 equivalent basis, CH4 emissions were much higher than N2O emission. In total, the average CO2eq emissions of CH4 plus N2O in the PU field (1.81 Mg CO2 ha−1 year−1) were significantly lower than those in the CP field (7.42 Mg CO2 ha−1 year−1) (p < 0.01). The RothC model revealed that the changes in soil carbon storage corresponded to CO2eq emissions of 0.57 and 0.09 Mg CO2 ha−1 year−1 in the both fields, respectively. Consequently, the net greenhouse gas balance in the PU and CP fields were estimated to be 2.38 and 7.51 Mg CO2 ha−1 year−1, respectively, suggesting a 68% reduction in the PU system. In conclusion, PU rotation system can be regarded as one type of the climate-smart soil management.
1. Introduction
In recent years, the average temperature has risen worldwide and global warming has been pointed out, and it is necessary to drastically and sustainably reduce greenhouse gases (GHG) emissions in order to curb climate change [1]. Agriculture is regarded as a GHG emission sector combined with forestry and other land use (AFOLU sector), and their emissions are estimated to account for about one-quarter of total anthropogenic emissions [1]. It has been pointed out that the greenhouse gases CH4 and N2O emitted from agricultural lands have increased drastically over the past half century due to the expansion of paddy field cultivation worldwide and the increase in nitrogen fertilizer application [2,3]. Since about 90% of paddy rice is produced in Asia [4], various studies have been conducted in Asia to reduce CH4 emissions from paddy fields [5,6,7,8,9,10]. As one of the techniques for reducing CH4 emissions from paddy fields, effectiveness of water management such as intermittent irrigation and extension of the mid-summer drainage period have been clarified [11,12,13]. In this context, rice (Oryza sativa) cultivation systems with extended non-flooded period are expected to be effective for reducing CH4 emissions.
A paddy-upland (PU) rotation system is a land-use system that rotates rice, wheat, and soybean within several years to adjust rice production and increase the production of main crops such as wheat and soybean. Conversion from paddy to upland has several advantages, such as improved water permeability by upland farming, the prevention of excessive soil reduction, and increased soil nitrogen availability. It is also known that conversion from upland to paddy can alleviate the reduction of organic matter and related nutrients, acidification of soil, and proliferation of weeds [14].
Kumagai and Konno [15], Nishimura et al. [16], Nishimura et al. [17], and Shiono et al. [18] reported the effect of PU rotation system on the reduction of methane (CH4) emissions. In these reports, CH4 emissions were remarkably reduced especially in the first year of restored (re-converted) paddy fields by PU rotation systems compared to that in continuous rice (CP) paddy fields; this reduction effect was maintained into the second year of re-converted paddy fields. By contrast, it was reported that dinitrogen monoxide (nitrous oxide: N2O) emissions were increased by upland conversion [17,18,19]. However, reports on the emissions of both CH4 and N2O over several years under PU rotation system are still limited [17,18]. In addition, PU rotation system is known to affect the soil carbon storage. For example, Sumida et al. [20] reported that a longer PU rotation induced a greater degradation of soil organic matter. Shirato et al. [21] reported that PU rotation enhanced CO2 emissions compared to those in CP cropping. Nevertheless, very few studies have reported the net GHG emissions of PU systems in comparison to CP cropping systems based on direct measurement of both CH4 and N2O emissions and changes in soil carbon storage. From the viewpoint of GHG balance between GHG emissions and carbon storage at the PU field, Takakai et al. [22] reported the effects of compost application on the net GHG balance from the PU field in relatively cold north-eastern regions of Japan (PU systems: three years for soybean and three years for rice in lysimeter paddy fields). In this study, net GHG balance was evaluated by integrating CH4 and N2O emissions and carbon dioxide (CO2) emissions calculated from a decline in soil carbon storage. It has been reported that the major component of net GHG emission was CO2 (82–94%) during the soybean cultivation and CH4 (72–84%) during the rice cultivation. Additionally, net GHG emissions during the soybean and rice cultivations were comparable. It is therefore very meaningful and important to quantitatively evaluate the net GHG emissions under PU rotation system on a range of climatic conditions. The objectives of this research were, therefore, to evaluate the effect of PU rotation system on (1) GHG (CH4 and N2O) emissions, (2) changes in soil carbon storage, and (3) the net GHG balance (CO2 equivalents) in comparison with CP system, in relatively warm western Japan.
2. Materials and Methods
2.1. Experimental Plots and Design
The experiment was conducted in two adjacent fields: a CP field (area: 850 m2) and a PU rotation field (area: 1350 m2) in the Shiga Agricultural Technology Promotion Center (Shiga Agricultural Technology Center) in Omi-Hachiman City, Shiga Prefecture, western part of Japan (35°18′ N, 136°1′ E). In the CP field, rice has been cultivated once a year since 1975. In the PU field, four crop cultivations over three years (i.e., wheat-soybean-rice-rice) have been carried out since wheat cultivation started after the rice harvest in 2003. This PU rotation system has been established as the main cultivation system in Shiga Prefecture.
As shown in Table 1, a comparative experiment of the two cropping systems was carried out for a single three-year rotation period from October 2012 to October 2015. In the PU field, wheat was grown from late October after the harvest of rice in 2012, and soybean was grown from late June 2013, after the wheat cropping. Then, the paddy field was restored in 2014, and rice was cultivated in 2014 and 2015. In the CP fields, rice was cultivated in 2013, 2014 and 2015. In both the PU and CP fields, the underdrains were installed at 70 cm depth with intervals of 7 to 10 m. In the PU field, the mole drains were also installed perpendicular to the underdrains before wheat cultivation at about 30 cm depth, with intervals of 3 to 5 m. The soil of the experimental fields was classified as Gleyic Fluvisols according to the World Reference Base Classification [23], or as fine-textured Gray Lowland soil according to the Classification of Cultivated Soil in Japan, Third Approximation [24]. Table 2 shows the selected soil chemistry properties before the experiment (2012). In PU field, the values of T-C and T-N were lower than the values in CP, which was considered due to the influence of three rounds of PU rotation until the start of the survey. Detail information on the estimation of temporal change in T-C using Roth C model is described in Section 2.4. The soil pH, Available N, CEC, and K2O were within range of the improvement target value of Shiga Prefecture in all three years.

Table 1.
Setting of the experimental plots.
Table 2.
Physicochemical properties of the soils in the experimental plots 1.
In this experiment, two treatments, CP and PU, were established. Three sub-plots were prepared for each treatment, which were located at the central part in each field. The area of each sub-plot was 33.3 m2 for the CP field and 46.0 m2 for the PU field. The size of sub-plot was different between CP and PU, reflecting the planting style, because wheat and soybean were cultivated on ridges, which had longer width than the width of the rows of rice. In the PU field, both wheat and soybean were grown based on the Cultivation Technology Guideline of Shiga Prefecture [25]. The wheat cultivar was ‘Nourin No. 61’. The soybean cultivar was ‘Kotoyutaka’. The method used was narrow line non-intertillage cultivation (narrow ridge dense planting cultivation method). In both CP and PU fields, rice was cultivated based on the environmentally friendly crop cultivation standard of Shiga Prefecture [26]. The rice cultivar cultivated was ‘Mizukagami’. N fertilizer with 50% organic N was used. Water management was 3–5 cm shallow water management from puddling to mid-summer drainage, followed by mid-summer drainage for 7–12 days from mid-June to June, intermittent irrigation from mid-summer drainage to pre-harvest drainage, and water drainage in late August. Rice was harvested in early September. Details of cropping management for paddy rice and wheat and soybean are shown in Tables S1 and S2, respectively.
2.2. Measurement of CH4 and N2O Emissions
The CH4 and N2O gas fluxes between the ground surface and the atmosphere in each sub-plot were measured by the closed-chamber method [27]. Gas was basically collected once a week between 9:00 a.m. and 12:00 a.m. Specially, the frequency of measurement was about two to three times per week for the puddling and transplanting stages, before and after mid-summer and pre-harvest drainages in the paddy rice cultivation period, and immediately after the fertilization of wheat and soybean. In contrast, the measurement frequency was biweekly only from January to March in the post-soybean fallow period and the fallow period of paddy.
An acrylic chamber (60 cm long × 30 cm wide × 50 cm high) was used for the measurement of each sub plot. Inside the chamber, a fan for air agitation and a Tedlar bag for pressure control were installed. The chamber base was inserted into the soil at up to 8 cm depth, to cover two lines of wheat, two strains of soybean, and three strains of rice. The height of the chamber was changed to 100 cm with the growth of the crop, i.e., from early May before topdressing at the ripening stage to harvest for wheat, from mid-August to harvest for soybean, and from early July before topdressing at the panicle formation stage to harvest for rice. For gas sampling, the gas in the chamber was mixed several times with a 50 mL syringe, and then 30 mL was sampled three times at 10-min intervals. The gas concentration was analyzed based on the method of Sudo [28] using a gas chromatograph (GC; GC-14A, Shimadzu, Kyoto, Japan) with a flame ionization detector and electron capture detector. The cumulative CH4 and N2O emissions were calculated using the trapezoidal integration method. Cumulative emissions of each gas were converted to cumulative CO2eq emissions (CH4 and N2O combined) based on the global warming potential (GWP) conversion factor of 28 for CH4 and 265 for N2O [29].
The air temperature inside the chamber and the soil temperature (5 cm deep) at the time of collection were measured with a temperature data logger (Ondotori, T & D, Matsumoto, Japan).
2.3. Measurement of Selected Field Properties
Selected soil properties were investigated based on the Soil Nutrient Measurement Method Committee [30] and the Soil Environment Analysis Method Editing Committee [31]. Free iron oxide was extracted by acetate buffer extraction at pH 2.8 [32] and quantified with an atomic absorption spectrophotometer. The available phosphate was measured using the Truog method [33], and the available silica was measured by acetate buffer extraction at pH 4. For available nitrogen, soil samples collected from the plow layer just before puddling in 2015 were incubated for four weeks at 30 °C, and the amount of ammonium ion was determined using the indophenol method.
In the periods other than rice cultivation, the volumetric moisture content (0–12 cm deep) was measured at five locations around the chamber using a portable soil moisture meter (HydroSense, Campbell, UT, USA). From the volumetric moisture content and solid phase ratio (33.0–36.4%), the water-filled pore space (WFPS), defined as the ratio of water volume to the soil void volume, was calculated, and the average value for each plot was determined. For cases in which the calculated values exceeded 100%, they were treated as 100% under saturation. For the cumulative precipitation, we used meteorological observation data from the Shiga Agricultural Technology Center. The redox potential (Eh) was measured at the time of gas sampling of the rice cultivation. The measurement was carried out by connecting a portable Eh meter (PRN-41; Fujiwara Seisakusho, Tokyo, Japan) to a platinum electrode embedded at a depth of 5 cm; measurements were made at four locations around the chamber, and the average value was determined.
2.4. Estimation of Soil C Storage Based on the RothC Model
The change in soil carbon is slow and there may be large spatial variations, and it takes a long time to detect the change by actual measurement. In this study, changes in soil carbon content were calculated using the RothC model, which had been verified to be simple and accurate [34,35,36].
The temporal changes in the soil carbon contents of the CP and PU fields were predicted, using the past data of the survey fields, with the improved RothC model for paddy field soil [34,35,36]. The model calculation was carried out for the data starting in 1995, when the soil C concentration data for the survey fields was available (25.2 g kg−1). The initial soil carbon stock in 1995 was calculated to be 37.5 tC ha−1 based on the plow layer depth and the bulk density of 15 cm and 1.0 g cm−3, respectively. The clay content in the plow soil layer was set as 31.3% [37]. For the precipitation and temperature, we used meteorological observation data (1995–2015) from the Shiga Agricultural Technology Center. The amount of evapotranspiration was estimated using the method of Thornthwaite (1948) [38] with the temperature data, and converted to open pan evaporation, which is required for the model calculation, by dividing it by 0.75. Data including the C concentration; bulk density of the plow soil layer; crop yields of paddy rice, wheat, and soybean were collected from the research results summary for Shiga Prefecture and the Special Research Report of the Shiga Agricultural Research Center Agricultural Experiment Station [39]. Missing values were replaced by the mean of the preceding and proceeding values. The amount of carbon input from crop residues, such as the stubble and roots, was converted from the crop yield data, using the data on the dry matter weight ratio of various crops [34,40]. As the annual rate of soil carbon stock, average values of the above mentioned 12 years from 1995 to 2017 were calculated for both PU and CP fields. This is because long-term data are often more favorable to understand and analyze the relationship between farmland management and the increase or decrease in soil carbon [41] due to relatively small temporal changes and relatively large spatial variation. RMSE (The root mean square error) were calculated from the differences between predicted values by the RothC model and the measured values for each field. The RMSEs in the PU and CP fields were 2.64 and 2.39, respectively, suggesting similar and relatively small error in both fields.
2.5. Estimation of the Net GHG Balance
Finally, the net GHG balance was calculated as the sum of GHG emissions and soil carbon storage during the study period. Annual CO2eq data of both CH4 and N2O emissions were used as the data of GHG emissions, and the amount of soil carbon stored annually in the CP and PU fields were regarded as soil carbon storage and converted to the CO2eq emissions. The calculation formula is as follows.
Net GHG balance (Mg CO2eq ha−1 year−1) = GHG emissions + CO2eq emissions
If the value was positive, it suggested a net emission, and if the value was negative, it suggested a net absorption. The mitigation effect was evaluated by subtracting the CP value from the PU value.
2.6. Statistical Analysis
Two-way analysis of variance with treatment and year as factors (ANOVA) was performed for the annual CH4, N2O and their CO2eq emissions. In this study, differences with p < 0.05 were considered significant [42].
3. Results
3.1. CH4, N2O, and Their Carbon Dioxide Equivalent (CO2eq) Emissions
The CH4 and N2O flux in the three years are shown in Figure 1a,b, respectively, and seasonal changes in precipitation and water-filled pore space (WFPS), and Eh in the three years of the experiment are shown in Figure 1c,d, respectively. CH4, N2O, and CO2eq emissions for the three years are summarized in Table 3.
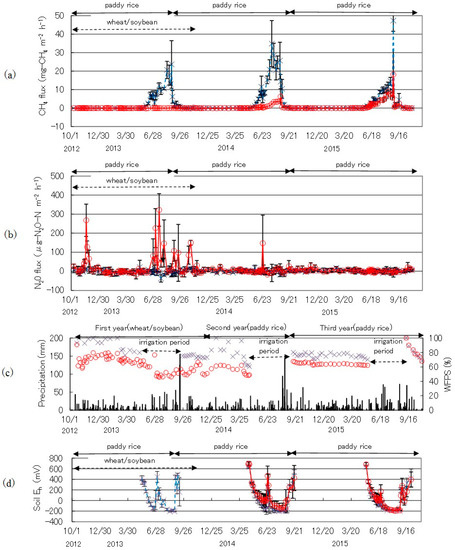
Figure 1.
Changes in (a) CH4 flux, (b) N2O flux, (c) Precipitation and WFPS and (d) Soil Eh, in the three years. ×(Blue): CP, ○(Red): PU, (c)|: precipitation. Error bar is shown as standard deviation. The data in PU was derived from the previous report (Hasukawa et al. [43]).
Table 3.
Annual CH4, N2O and their CO2eq emissions during the survey period (2012–2015).
3.1.1. CH4 and N2O Flux
The CH4 flux in the rice cultivation increased to the mid-summer drainage in both treatments, and temporarily decreased during the mid-summer drainage. In the CP field, the maximum values at the time of mid-summer drainage were 7.9, 11.5, and 4.6 mg CH4 m−2 h−1 in the first, second and third year, respectively. In the PU field, they were 1.0 and 2.3 mg CH4 m−2 h−1 in the second and third year, respectively, which was much lower than those in the CP field. It increased again with watering after the mid-summer drainage, and then decreased immediately after pre-harvest drainage. In the CP field, the maximum values were 23.6, 34.9, and 47.3 mg CH4 m−2 h−1 in the first, second and third year, respectively. In the PU field, they were 6.2, and 18.2 mg CH4 m−2 h−1 in the second and third year, respectively, which were again much lower than those in the CP field, in the third. The CH4 flux after the mid-summer drainage in both treatments tended to be higher than before the mid-summer drainage. In total, the CH4 flux in the CP field remained at a high level throughout the experimental period compared to that in the PU field. In the PU field, the CH4 flux tended to be lower in the first year than in the second year of paddy rice cultivation after upland crops. The CH4 flux in the wheat and soybean cultivations was kept at around 0 mg m−2 h−1 throughout the experimental period in the PU field.
The N2O flux increased significantly just after the base fertilization in both wheat and soybean cultivation in the PU field. The maximum values were 267.5 μg N m−2 h−1 for wheat cultivation and 321.9 μg N m−2 h−1 for soybean cultivation. In the soybean cultivation, the N2O flux after rainfall increased several times. In PU, the maximum value at the time of mid-summer drainage was 147.2 μg N m−2 h−1. It did not increase significantly during the additional fertilization of wheat, topdressing at the panicle formation stage, and topdressing at ripening stage. In the other period, it was maintained at around 0 μg N m−2 h−1. In the CP field, the N2O flux was maintained at around 0 μg N m−2 h−1 throughout the three years.
3.1.2. Precipitation
The cumulative precipitation in 2013, 2014 and 2015 was 1520, 1583 and 1800 mm, respectively. The mean air temperature in 2013, 2014 and 2015 the first year was 14.7, 14.4 and 15.0 °C, respectively. The climate was relatively warm with little annual difference in both precipitation and temperature.
3.1.3. Water-Filled Pore Space
The WFPS at the time of gas collection in the first year ranged from 46 to 91% (average 64%) in the PU field. In the CP field, the WFPS remained at 79 to 100% (average 92%) during the non-flooding period before the inflow of paddy rice cultivation. The WFPS during the non-flooding period until the second year of the inflow of paddy rice cultivation was 48 to 62% (average 56%) in the PU field and 60 to 100% (average 78%) in the CP field. The WFPS during the non-flooding period until the third year of inflow of paddy rice cultivation was 62 to 67% (average 64%) in the PU field and 70 to 80% (average 76%) in the CP field. The WFPS from the harvest of rice to the end of the survey remained at 68 to 100% (82% on average) in the PU field, and 68 to 100% (81% on average) in the CP field. It was high just after harvesting rice in both treatments but tended to decrease gradually. In all three years, the WFPS in both treatments increased in winter when the precipitation and temperature decreased.
3.1.4. Soil Eh
In the CP field, the soil Eh decreased rapidly with the start of flooding and continued to decrease until the start of mid-summer drainage in all three years. It showed a positive value with the mid-summer drainage and became oxidative, but it decreased gradually with the incoming water after the mid-summer drainage and remained at around −200 mV until pre-harvest drainage. After rice harvesting, it showed a positive value and remained at around 600 mV. In the PU field, the soil Eh decreased gradually with the start of spring in the PU field and remained at around 0 mV before the mid-summer drainage in the second and third years.
3.1.5. Annual CH4, N2O, and Their CO2eq Emissions
The annual CH4 emissions in the CP field were 165.3 ± 14.8, 273.5 ± 28.4, and 155.4 ± 7.9 kg CH4-C ha−1 year−1 in the first, second and third year, respectively (Table 3). In the PU field, the annual CH4 emissions were −0.6 ± 1.2, 28.4 ± 5.3, and 81.1 ± 31.1 kg CH4-C ha−1 year−1 in the first, second (first year of paddy rice cultivation after upland crops) and third year (second year of paddy rice cultivation after upland crops), respectively. The annual CH4 emissions in the PU field were significantly lower than those in the CP field in each of the three years (in the first and second year: p < 0.01, in the third year: p < 0.05). On average, therefore, annual CH4 emissions in the PU field was significantly lower than those in the CP field (p < 0.01).
The annual N2O emissions in the CP field were −0.169 ± 0.185, 0.113 ± 0.085, and 0.263 ± 0.109 kg N2O-N ha−1 year−1 in the first, second and third year, respectively. In the PU field, the annual N2O emissions were 2.591 ± 0.322, 0.340 ± 0.338, and 0.342 ± 0.259 kg N2O-N ha−1 year−1 in the first, second and third year, respectively. The annual N2O emissions in the PU field were significantly higher than those in the CP field in the first year (p < 0.01) and were not significantly different in the second and third years. On average, therefore, annual N2O emissions in the PU field was significantly higher than those in the CP field (p < 0.01).
The annual CO2eq-converted CH4 emissions in the CP field were 6.17 ± 0.55 Mg, 10.21 ± 1.06 Mg, and 5.80 ± 0.29 Mg ha−1 year−1 in the first, second and third year, respectively (Table 3). In the PU field, the annual CO2eq-converted CH4 emissions were −0.02 ± 0.05 Mg, 1.06 ± 0.20 Mg, and 3.03 ± 1.16 Mg ha−1 year−1 in the first, second and third year, respectively. The annual CO2eq-converted CH4 emissions in the PU field were significantly lower than those in the CP field in each of the three years (in the first and second year: p < 0.01, in the third year: p < 0.05). On average, therefore, annual GWP of CH4 emissions in the PU field was significantly lower than those in the CP field (p < 0.01).
The annual CO2eq-converted N2O emissions in the CP field were −0.07 ± 0.08 Mg, 0.05 ± 0.04 Mg, and 0.11 ± 0.05 Mg ha−1 year−1 in the first, second and third year, respectively (Table 3). In the PU field, the annual CO2eq-converted N2O emissions were 1.08 ± 0.13 Mg, 0.14 ± 0.14 Mg, and 0.14 ± 0.11 Mg ha−1 year−1 in the first, second and third year, respectively. The annual CO2eq-converted N2O emissions in the PU field were significantly higher than those in the CP field only in the first year (p < 0.01). On average, therefore, annual CO2eq-converted N2O emissions in the PU field was significantly higher than those in the CP field (p < 0.01).
Based on the CO2eq data of both CH4 and N2O, the annual overall CO2eq emissions in the CP field were calculated as 6.10 ± 0.48, 10.26 ± 1.03, and 5.91 ± 0.33 Mg ha−1 year−1 in the first, second and third year, respectively. In the PU field, the annual overall CO2eq emissions were 1.05 ± 0.18, 1.20 ± 0.30, and 3.17 ± 1.17 Mg ha−1 year−1 in the first, second and third year, respectively. The annual overall CO2eq emissions in the PU field were significantly lower than those in the CP field in each of the three years (in the first and second year: p < 0.01, in the third year: p < 0.05). On average, therefore, the annual overall CO2eq emissions in the PU field was significantly lower than those in the CP (p < 0.01). The relative percentage of annual CH4 emissions to annual overall CO2eq emissions throughout three years was 99.7% in the CP field and 74.9 % in the PU field, respectively.
3.2. Predictive Evaluation of Soil Carbon Storage Using the RothC Model
The predicted value of soil carbon storage in the CP field since the start of PU rotation was almost constant, i.e., 0.411 Mg C ha−1 in 2003 and 0.408 Mg C ha−1 in 2015, whereas, in the PU field, it showed a decreasing trend, i.e., 0.411 Mg C ha−1 in 2003 and 0.392 Mg C ha−1 in 2015 (Figure 2). The average changes in the amount of soil carbon per rotation were −0.03 Mg C ha−1 years−1 in the CP field, and −0.15 Mg C ha−1 years−1 in the PU field. Accordingly, the slight decreases in the amount of soil carbon in the CP and PU fields corresponded to increases in CO2eq emissions of 0.09 and 0.57 Mg CO2 ha−1 year−1, respectively.
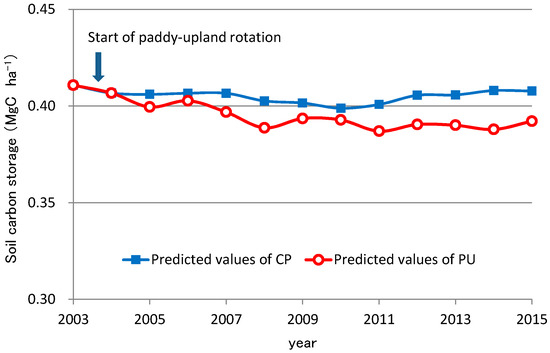
Figure 2.
Estimation of the changes in the amount of soil carbon by RothC model.
3.3. Net GHG Balance
Figure 3 shows the net GHG balance as the sum of both CH4 and N2O emissions and soil carbon storage. The annual overall GHG emissions were 7.42 ± 0.40 Mg CO2eq ha−1 year−1 in the CP field, and 1.81 ± 0.38 Mg CO2eq ha−1 year−1 in the PU field (Table 3). Slight decrease in the amount of soil carbon corresponded to the emission of 0.09 Mg CO2eq ha−1 year−1 in the CP field and 0.57 Mg CO2eq ha−1 year−1 in the PU field, respectively. Accordingly, the net GHG balance was calculated to be 7.51g and 2.38 Mg CO2eq ha−1 year−1 in the CP and PU field, respectively. As a result, the mitigation effect of net GHG emission by the conversion of land use from CP to PU was evaluated as 5.13 Mg CO2eq ha−1 year−1, i.e., a 68% reduction. This result strongly supported that the paddy-upland rotation system can be regarded as one type of the climate-smart soil management under the concept of “climate-smart soils” [44].
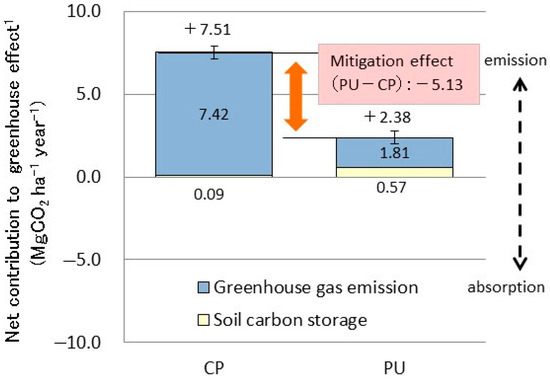
Figure 3.
GHG emission and absorption in the experimental field. 1 CO2 conversion. Error bar is shown as standard deviation in the GHG emission.
3.4. Yield, Quality, and Nitrogen Uptake of Rice, Wheat and Soybean
The yield, quality, and nitrogen uptake of paddy rice, wheat, and soybean are shown in Table 4. The yield of paddy rice was 692 g m−2 in 2013, 532 g m−2 in 2014, and 580 g m−2 in 2015 in the CR field. In the PU field, it was 552 g m−2 in 2014 and 603 g m−2 in 2015. There were no clear differences in both treatments in the yield of paddy rice both in 2014 and 2015. There were no evident differences in appearance quality and brown rice protein content both in 2014 and 2015, nor in the nitrogen uptake of the above-ground parts (unhulled rice + straw). The yield of wheat in the PU field was 507 g m−2, and the yield of soybean was 505 g m−2, the standard yield [25] was secured. The nitrogen uptake or accumulation of the above-ground parts (wheat: grain + straw, soybean: grain + stem + pod) was 10.2 g N m−2 for wheat and 33.8 g N m−2 for soybean.
Table 4.
Yield, quality and nitrogen uptake of paddy rice, wheat and soybean.
4. Discussion
4.1. Temporal Changes in the Mitigation Effect of GHG Emissions and Its Regulatory Factors
The reduction of CO2eq emissions showed a clear temporal trend. As described in the results, the annual overall CO2eq emissions in the PU field and CP were 1.05 and 6.10 in the first year, 1.20 and 10.26 in the second year, and 3.17 and 5.91 Mg ha−1 year−1 in the third year, respectively. Namely, the mitigation effect of the PU system was 89% in the first year of re-converted paddy (the second year), and 47% in the second year of re-converted paddy (the third year), suggesting that the mitigation effect decreases with the period after the re-conversion to paddy. Additionally, proportion of CH4 in CO2eq emissions was much higher than that of N2O in both fields. A similar trend was observed in the case of a PU system in relatively cold north-eastern region of Japan [18]. Additionally, Takakai et al. [22] reported that the effect of reducing CH4 emissions by PU rotation was observed at least until the second year after the conversion, and that the effect disappears in the third year in north-eastern Japan. The reduction effect was probably controlled by soil redox conditions. This is because CH4 production in CP began immediately after transplanting when the soil Eh decreased rapidly to −200 mV as, while little CH4 emission was observed in PU where the soil Eh reached −200 mV only limited period during the two-year period.
In addition, redox condition in soil depend on the WFPS (soil moisture) and application of organic matter during unsubmerged period. The WFPS of the PU field in the post-soybean fallow period and in the paddy fallow period remained at relatively low levels compared to those of the CP field. Shiratori et al. [45] reported that the higher soil moisture before water inflow led to higher CH4 emission rate during rice cultivation. Su et al. [46] reported that by planting winter wheat after rice cultivation from the second crop of rice, drainage is improved and CH4 emissions are reduced. In our survey, the WFPS values in the CP field just before the inflow remained higher in both periods than those in the PU field, which led to increased CH4 emissions in the CP field. Additionally, from the viewpoint of decomposition of applied organic matter, Nishimura et al. [17] reported that CH4 emissions were significantly reduced by PU rotation in the first year of the paddy rice cropping after upland crop cultivation, where there was not much residue incorporated from the previous upland conversion crop; whereas there was no clear difference in the second year of paddy rice cropping after upland crop cultivation in the paddy field tested by lysimeter. In our survey, however, a certain reduction effect of CH4 was observed even in the second year of paddy rice cultivation after upland crops, possibly because the decomposition of rice straw incorporated in autumn was promoted by the low level of WFPS and relatively warm temperature in the fallow period of paddy.
4.2. Effect of Climate on the Mitigation Effect of PU Rotation Systems
To our knowledge, there are only limited number of reports on long-term GHG emissions (CO2eq emissions: CH4 and N2O combined GWP) under PU rotation and CP treatments in Asia, as shown in Table 5. Shiono et al. [18] investigated the emissions in a cooler region in Japan, Cha-un et al. [47] investigated the emissions in Thailand with tropical monsoon climate and this study was conducted in a relatively warm region in Japan. The average temperature was in the order of Cha-un et al. (27.3 °C) > this study (14.9 °C) > Shiono et al. (11.7 °C), and the precipitation was in the order of this study (1529 mm) > Shiono et al. (1238 mm) > Cha-un et al. (1043 mm). The soils investigated were all alluvial soil.
Table 5.
Comparison of previous studies on GHG emission in PU.
From these three survey cases, a remarkable effect of reducing CO2eq emissions in PU was observed regardless of the difference in planting system, temperature and precipitation. The reduction rate was about 75%, i.e., a 75% reduction in Shiono et al. [18] and Cha-un et al. [47], a 76% reduction in our survey. These results clarified that PU rotation is an extremely effective global warming mitigation technology from paddy fields.
The ratio of CH4 reduction in the first year of re-converted rice was large in all cases, i.e., an 84% reduction in Shiono et al. [18], a 63% reduction in Cha-un et al. [47] and an 89% reduction in our survey, which then decreased to 37% in Shiono et al. [18] and 46% in our survey, respectively, in the second year of re-converted rice. In our survey, soybean residue was incorporated, but a similar magnitude of GHG emission reduction was obtained by PU rotation. This could be due to the fact that the WFPS in the PU field after incorporation was lower than that in the CP field, and the aerobic decomposition of organic matter progressed further in the PU field. In Cha-un et al. [47], the same CO2eq emission reduction effect has been obtained even in the field where the residue was incorporated in two crops a year with a large amount of biomass input. This would be because decomposition of organic matter in Thailand proceeded much faster than the other two cases due to more oxidative state, reflecting higher temperature and lower precipitation.
From the viewpoint of soil carbon storage, Takakai et al. [22] reported that the decrease in soil carbon storage is larger in soybean cultivation than in paddy rice cultivation, which may be mainly due to the difference in redox condition between paddy-upland fields and paddy fields. In our survey, the soil carbon content was maintained in the CP field, but decreased in the PU field based on the RothC model. These facts were also consistent with the report that the PU field has disadvantage in terms of soil carbon storage [20].
Based on these results, the importance to evaluate both the CO2eq emission reduction effect and soil carbon storage was demonstrated to understand overall effect of PU rotation system, or any agricultural system in general, on GHG emissions.
4.3. Comprehensive Assessment of Soil Carbon Stocks and GHG Emissions
To find out which of the three GHG components (CH4, N2O, and CO2) has the greatest contribution to the greenhouse effect from farmland, it is necessary to investigate the emissions of all three components in the field. However, there are only a few comprehensive evaluation cases of measuring three GHGs in farmland. In our study, the effect of PU on reducing GHG emissions in a warmer region in Japan was evaluated for the first time from the perspective of net GHG emission balance by integrating CH4 and N2O emissions and CO2 emissions calculated from a decline in soil carbon storage.
As an example of simultaneous evaluation of three component GHGs in paddy fields, Ishibashi et al. [48] reported that CH4 had the greatest contribution to emissions among the three GHGs based on the results of research on a non-tilled direct seeding cultivation of paddy rice in a warmer region in Japan. Additionally, Takakai et al. [22] reported that three components were evaluated simultaneously in soybean and paddy rice after paddy-upland field rotation in a cooler region in Japan, and it was reported that CH4 emissions were the highest in paddy rice and CO2 emissions were the highest in soybean.
In addition, Takakai et al. [22] reported that a large amount of CO2 emissions are generated in soybean fields, especially when immature compost is added, and that the increase in these CO2 emissions may offset the reduction in CH4 emissions by PU rotation, so it was considered necessary to require appropriate organic matter management during paddy-upland rotation. Our results also suggested that CH4 had the greatest contribution to emissions among the three GHGs.
This study revealed that the PU rotation treatment reduced the total CO2eq emissions by about 68% because of the reduction of CH4 emissions in the first and second years of re-converted rice, while the PU treatment had no effect on the yield and quality. Our results also suggested that reducing CH4 emissions would be most effective for reducing GHG emissions from paddy fields. To further reduce the contribution to global warming by PU rotation systems, therefore, the introduction of GHG mitigation measures on water management, such as extending the period of mid-summer drainage for CH4 reduction technology [12] should be considered. In fact, GHG emissions (cumulative CO2eq emissions) were reduced significantly by the extension of the mid-summer drainage period by one week in paddy rice cultivation in combination with the use of coated fertilizer in wheat and soybean cultivations [43]. Further reduction of GHG emissions in PU rotation system by introducing these mitigation measures would be desirable to contribute to the mitigation of global warming.
5. Conclusions
A three year field experiment was carried out to investigate the overall greenhouse effects in the paddy-upland (PU) rotation, i.e., four cultivations (wheat-soybean-rice-rice) over three years, and in the paddy continuous rice (CP) cropping over three years. Total CO2eq emissions (CH4 and N2O combined global warming potential [GWP]) in the PU field (1.81 Mg CO2eq ha−1 year−1), were 76% lower than those in the CP field (7.42 Mg CO2eq ha−1 year−1). Soil carbon budget calculated using an improved Rothamsted Carbon (RothC) model indicated that decrease in soil carbon in the PU and CP fields corresponded to CO2eq emissions of 0.57 and 0.09 Mg CO2eq ha−1 year−1, respectively. Accordingly, the overall greenhouse effects in the PU and CP fields were estimated to be 2.38 and 7.51 Mg CO2eq ha−1 year−1, respectively. Our research revealed, therefore, that a 68% reduction of the overall greenhouse effect was possible by the conversion from the CP field to the PU field. In conclusion, the finding that the PU treatment can reduce overall greenhouse effect considerably compared to the CP treatment would be applicable to paddy rice production systems in a range of areas not only in Japan but also widely in monsoon Asia.
Supplementary Materials
The following are available online at https://www.mdpi.com/2077-0472/11/1/52/s1, Table S1: Outline of paddy rice cropping management, Table S2: Outline of wheat and soybean cropping management.
Author Contributions
H.H., Y.I. and S.T. performed the experiments; H.H., S.S., N.O., T.S. and Y.S. conceived and designed the experiments; H.H. and Y.I. analyzed the data; H.H. wrote the paper; J.Y. assisted consideration and conclusion on this manuscript; Y.S., J.Y. gave many constructive comments on this manuscript. All authors have read and agreed to the published version of the manuscript.
Funding
This study was supported by a project entitled ‘‘Basic Survey on Farmland Soil Greenhouse Gas Emissions’’ in the Ministry of Agriculture, Forestry and Fisheries from 2013 to 2016, Japan.
Data Availability Statement
The data that support the findings of this study are available from the corresponding author upon reasonable request.
Acknowledgments
We thank Kazuyuki Inubushi, Chiba University, and Ryusuke Hatano, Hokkaido University for providing valuable comments throughout the study, and Kazuyuki Yagi of the National Agricultural and Food Research Organization (NARO), Institute for Agro-Environmental Science (present affiliation: King Mongkut’s University of Technology Thonburi), Osamu Nagata of NARO, Hokkaido National Agricultural Research Center for their helpful advice and support. Furthermore, we thank Seiichi Nishimura of NARO, Hokkaido National Agricultural Research Center, for their suggestions in compiling this paper.
Conflicts of Interest
The authors declare no conflict of interest.
References
- Intergovernmental Panel on Climate Change (IPCC). Climate Change 2014: Mitigation of Climate Change. Contribution of Working Group III to the Fifth Assessment Report of the Intergovernmental Panel on Climate Change; Cambridge University Press: New York, NY, USA, 2014. [Google Scholar]
- Fagodiya, R.K.; Pathak, H.; Bhatia, A.; Jain, N.; Kumar, A.; Malyan, K. Global warming impacts of nitrogen use in agriculture: An assessment for India since 1960. Carbon Manag. 2020, 11, 291–301. [Google Scholar] [CrossRef]
- Fagodiya, R.K.; Pathak, H.; Kumar, A.; Bhatia, A.; Jain, N. Global temperature change potential of nitrogen use in agriculture: A 50-year assessment. Sci. Rep. 2017, 7, 1–8. [Google Scholar] [CrossRef] [PubMed]
- FAO. FAOSTAT Database. 2020. Available online: http://faostat.fao.org/ (accessed on 24 February 2020).
- Yagi, K.; Minami, K. Effect of organic matter application on methane emission from some Japanese paddy fields. Soil Sci. Plant Nutr. 1990, 36, 599–610. [Google Scholar] [CrossRef]
- Kimura, M.; Miura, Y.; Watanabe, A.; Katoh, T.; Haraguchi, H. Methane emission from paddy fields (Part 1). Effect of fertilization, growth stage and midsummer drainage: Pot experiment. Environ. Sci. 1991, 4, 265–271. [Google Scholar]
- Gupta, K.; Bhatia, A.; Kumar, A.; Das, K.; Jain, N.; Tomer, R.; Malyan, K.; Fagodiya, R.K.; Dubey, R.; Pathac, H. Mitigation of greenhouse gas emission from rice–wheat system of the Indo-Gangetic plains: Through tillage, irrigation and fertilizer management. Agric. Ecosyst. Environ. 2016, 230, 1–9. [Google Scholar] [CrossRef]
- Yagi, K. Mitigation options for methane emissions in rice. In Encyclopedia of Soil Science; Lal, R., Ed.; Marcel Dekker: Columbus, OH, USA, 2002; pp. 814–818. [Google Scholar]
- Setyanto, P.; Pramono, A.; Adriany, T.A.; Susilawati, H.L.; Tokida, T.; Agnes, T.; Padre, A.T.; Minamikawa, K. Alternate wetting and drying reduces methane emission from a rice paddy in Central Java, Indonesia without yield loss. Soil Sci. Plant Nutr. 2018, 64, 23–30. [Google Scholar] [CrossRef]
- Oo, A.Z.; Sudo, S.; Inubushi, K.; Mano, M.T.; Yamamoto, A.; Ono, K.; Osawa, T.; Hayashida, S.; Patra, P.K.; Terao, Y.; et al. Methane and nitrous oxide emissions from conventional and modified rice cultivation systems in South India. Agric. Ecosyst. Environ. 2018, 252, 148–158. [Google Scholar] [CrossRef]
- Yagi, K.; Tsuruta, H.; Kanda, K.; Minami, K. Effect of water management on methane emission from a Japanese rice paddy field: Automated methane monitoring. Glob. Biogeochem. Cycl. 1996, 10, 255–267. [Google Scholar] [CrossRef]
- Itoh, M.; Sudo, S.; Mori, S.; Saito, H.; Yoshida, T.; Shiratori, Y.; Suga, S.; Yoshikawa, N.; Suzue, Y.; Mizukami, H.; et al. Mitigation of methane emissions from paddy fields by prolonging midseason drainage. Agric. Ecosyst. Environ. 2011, 141, 359–372. [Google Scholar] [CrossRef]
- Malyan, K.; Bhatia, A.; Kumar, A.; Gupta, K.; Singh, R.; Kumar, S.; Tomer, R.; Kumar, O.; Jain, N. Methane production, oxidation and mitigation: A mechanistic understanding and comprehensive evaluation of influencing factors. Sci. Total Environ. 2016, 572, 874–896. [Google Scholar] [CrossRef]
- Nira, R. The present condition of soil fertility of paddy- upland rotation fields and some proposals for its management. In Fertility and Management of Soil in Paddy- Upland Rotation Fields in Japan- Factors of Fertility Change and Approaches for Its Control; Toriyama, K., Kimura, T., Yanai, J., Eds.; Hakuyusha: Tokyo, Japan, 2010; pp. 9–26. (In Japanese) [Google Scholar]
- Kumagai, K.; Konno, Y. Methane emission from rice paddy fields after Upland Farming. Jpn. J. Soil Sci. Plant Nutr. 1998, 69, 333–339, (In Japanese with English summary). [Google Scholar]
- Nishimura, S.; Yonemura, S.; Sawamoto, T.; Shirato, Y.; Akiyama, H.; Sudo, S.; Yagi, K. Effect of land use change from paddy rice cultivation to upland crop cultivation on soil carbon budge of a cropland in Japan. Agric. Ecosyst. Environ. 2008, 125, 9–20. [Google Scholar] [CrossRef]
- Nishimura, S.; Akiyama, H.; Sudo, S.; Fumoto, T.; Cheng, W.; Yagi, K. Combined emission of CH4 and N2O from a paddy field was reduced by preceding upland crop cultivation. Soil Sci. Plant Nutr. 2011, 57, 167–178. [Google Scholar] [CrossRef]
- Shiono, H.; Saito, H.; Nakagawa, F.; Nishimura, S.; Kumagai, K. Effects of crop rotation and rice straw incorporation in spring on methane and nitrous oxide emissions from an upland paddy field in a cold region of Japan. Jpn. J. Soil Sci. Plant Nutr. 2014, 85, 420–430, (In Japanese with English summary). [Google Scholar]
- Chu, H.; Hosen, Y.; Yagi, K. Nitrogen Oxide Emissions and Soil Microbial Activities in a Japanese Andisol as Affected by N-Fertilizer Management. Soil Sci. Plant Nutr. 2004, 50, 287–292. [Google Scholar] [CrossRef]
- Sumida, H.; Kato, N.; Nishida, M. Depletion of soil fertility and crop productivity in succession of paddy rice-soybean rotation. Bull. Natl. Agric. Res. Cent. Tohoku Reg. 2005, 103, 39–52, (In Japanese with English summary). [Google Scholar]
- Shirato, Y.; Nishimura, S.; Minamikawa, K. A new framework for study of irrigated paddy rice and upland crops rotation farming and its relation to soil and plant nutrition science. 6. Paddy-upland rotation and environmental impacts. Jpn. J. Soil Sci. Plant Nutr. 2014, 85, 533–538. (In Japanese) [Google Scholar]
- Takakai, F.; Nakagawa, S.; Sato, K.; Kon, K.; Sato, T.; Kaneta, Y. Net Greenhouse Gas Budget and Soil Carbon Storage in a Field with Paddy–Upland Rotation with Different History of Manure Application. Agriculture. 2017, 7, 49. [Google Scholar] [CrossRef]
- FAO; ISRIC; ISSS. World Reference Base for Soil Resources 2006, A Framework for International Classification Correlation and Communication; World Soil Resources Reports 103; FAO: Rome, Italy, 2006; pp. 1–128. [Google Scholar]
- Nishina, K.; Sudo, S.; Yagi, K.; Sano, T.; Takata, Y.; Obara, H.; Eguchi, S.; Oura, N.; Yano, S.; Ohkoshi, S.; et al. Multi-site monitoring for N2O emission factors of synthetic fertilizer in various soils with different redoximorphic features across Japan. Nutr. Cycl. Agroecosyst. 2015, 103, 87–99. [Google Scholar] [CrossRef]
- Shiga Prefectural Government. Guidelines for Wheat and Soybeans Cultivation That Sell; Shiga Prefectural Government: Otsu, Japan, 2012; pp. 1–177. (In Japanese) [Google Scholar]
- Shiga Prefectural Government. Rice Cultivation Technical Guidance Guidelines; Shiga Prefectural Government: Otsu, Japan, 2015; pp. 201–205. (In Japanese) [Google Scholar]
- Yagi, K. Greenhouse gas generation-absorption. In Soil Environmental Analysis; Hakuyusha: Tokyo, Japan, 1997; pp. 129–138. (In Japanese) [Google Scholar]
- Sudo, S. Recent advances in research on soil redox reacations: Chasing redox reacation in soil. 3. Measurement method of greenhouse gas emission from agricultural field by gas chromatograph. Jpn. J. Soil Sci. Plant Nutr. 2012, 83, 599–605. (In Japanese) [Google Scholar]
- Intergovernmental Panel on Climate Change (IPCC). Climate Change 2013: The Physical Science Basis, Contribution of Working Group1 to the Fifth Assessment Report of the Intergovermental Panel on Climate Change; Cambridge University Press: New York, NY, USA, 2013. [Google Scholar]
- Soil Nutrient Measurement Method Committee. Soil Nutrient Analysis; Yokendo: Tokyo, Japan, 1983; pp. 1–440. (In Japanese) [Google Scholar]
- Soil Environment Analysis Method Editing Committee. Soil Environmental Analysis; Hakuyusha: Tokyo, Japan, 1997; pp. 1–427. (In Japanese) [Google Scholar]
- Asami, T.; Kumada, K. A new method for determining free iron in paddy soils. Soil. Plant Food 1995, 5, 141–146. [Google Scholar] [CrossRef]
- Nanzyo, M.V. 12 Available Nitrogen. In Analysis Methods of Soil Environment; Konno, T., Ed.; Hakuyusha: Tokyo, Japan, 1997; pp. 262–273. (In Japanese) [Google Scholar]
- Shirato, Y.; Yokozawa, M. Applying the Rothamsted Carbon Model for long-term experiments on Japanese paddy soils and modifying it by simple turning of the decomposition rate. Soil Sci. Plant Nutr. 2005, 51, 405–415. [Google Scholar] [CrossRef]
- Shirato, Y. Validation and Modification of Soil Organic Matter Models in Arable Soils in Japan and Thailand. Bull. Natl. Inst. Agro. Environ. Sci. 2006, 24, 23–94, (In Japanese with English summary). [Google Scholar]
- Shirato, Y.; Yagasaki, Y.; Nishida, M. Using diffrent versions of the Rothamsted carbon model to simulate soil carbon in long-term experimental plots subjected to paddy-upland rotation Japanese. Soil Sci. Plant Nutr. 2011, 57, 597–606. [Google Scholar] [CrossRef]
- Nishibori, Y.; Shibahara, F.; Takehisa, T.; Kitagawa, Y.; Kyuma, K. Characterization and Grouping of Paddy Soils in Shiga Prefecture with Reference to Clay Minerals and Microbial Biomass. Bull. Shiga Prefect. Agric. Technol. Promot. Cent. 2009, 48, 35–52, (In Japanese with English summary). [Google Scholar]
- Thornthwaite, C.W. An approach toward a rational classification of climate. Geogr. Rev. 1948, 38, 55–94. [Google Scholar] [CrossRef]
- Shibahara, Y. Studies on Nitrogen Dynamics of Soil Microbial Biomass and its Significance in Paddy Field Ecosystems. Spec. Bull. Shiga Prefect. Agric. Technol. Promot. Cent. 2002, 22, 1–149, (In Japanese with English summary). [Google Scholar]
- Ogawa, K.; Takeuchi, Y.; Katayama, M. Biomass Production and the Amounts of Absorbed Inorganic Elements by Crops in Arable Lands in Hokkaido, and its evaluation. Res. Bull. Hokkaido Natl. Argic. Exp. Stn. 1998, 149, 57–91, (In Japanese with English summary). [Google Scholar]
- Yanai, J.; Shirato, Y.; Nishida, M.; Kasuya, M.; Nira, R.; Tanaka, S. Evaluation and management of long-term changes of soil fertility at the era of paradigm shift. Jpn. J. Soil Sci. Plant Nutr. 2020, 91, 99–105. (In Japanese) [Google Scholar]
- R Core Team. R: A Language and Environment for Statistical Computing; R Foundation for Statistical Computing: Vienna, Austria, 2017. [Google Scholar]
- Hasukawa, H.; Inoda, Y.; Toritsuka, S.; Sudo, S.; Oura, N.; Sano, T. Effects of mitigation strategies on greenhouse gas emissions from a paddy field on gray lowland soil under a paddy-upland rotation system with four-crops over three-years. Jpn. J. Soil Sci. Plant Nutr. 2019, 90, 1–12, (In Japanese with English summary). [Google Scholar]
- Paustian, K.; Lehmann, J.; Ogle, S.; Reay, D.; Robertson, G.P.; Smith, P. Climate-smart soils. Nature 2016, 532, 49–57. [Google Scholar] [CrossRef] [PubMed]
- Shiratori, Y.; Watanabe, H.; Furukawa, Y.; Tsuruta, H.; Inubushi, K. Effectiveness of a subsurface drainage system in poorly drained paddy field on reduction of methane emissions. Soil Sci. Plant Nutr. 2007, 53, 387–400. [Google Scholar] [CrossRef]
- Su, M.; Kuang, F.; Lv, Y.; Shi, X.; Liu, X.; Shen, J.; Zhang, F. Nitrous oxide and methane emissions from paddy soils in southwest China. Geoderma. Reg. 2017, 8, 1–11. [Google Scholar] [CrossRef]
- Cha-un, N.; Chidthaisong, A.; Yagi, K.; Sudo, S.; Towprayoon, S. Greenhouse gas emissions, soil carbon sequestration and crop yields in a rain-fed rice field with crop rotation management. Agric. Ecosyst. Environ. 2017, 237, 109–120. [Google Scholar] [CrossRef]
- Ishibashi, E.; Yamamoto, S.; Akai, N.; Iwata, T.; Tsuruta, H. The influence of no-tilled direct seeding cultivation on greenhouse gas emissions from rice paddy fields in Okayama, Western Japan. 5. Annual emission of CH4, N2O, and CO2 from rice paddy fields under different cultivation methods and carbon sequestration into paddy soils. Jpn. J. Soil Sci. Plant Nutr. 2009, 80, 123–135, (In Japanese with English summary). [Google Scholar]
Publisher’s Note: MDPI stays neutral with regard to jurisdictional claims in published maps and institutional affiliations. |
© 2021 by the authors. Licensee MDPI, Basel, Switzerland. This article is an open access article distributed under the terms and conditions of the Creative Commons Attribution (CC BY) license (http://creativecommons.org/licenses/by/4.0/).