
Predictive Performance of Machine Learning-Based Methods for the Prediction of Preeclampsia—A Prospective Study

 ,
,  and
and
Abstract
1. Introduction
2. Materials and Methods
3. Results
4. Discussion
5. Conclusions
Author Contributions
Funding
Institutional Review Board Statement
Informed Consent Statement
Data Availability Statement
Conflicts of Interest
References
- Poon, L.C.; Shennan, A.; Hyett, J.A.; Kapur, A.; Hadar, E.; Divakar, H.; McAuliffe, F.; da Silva Costa, F.; von Dadelszen, P.; McIntyre, H.D.; et al. The International Federation of Gynecology and Obstetrics (FIGO) initiative on pre-eclampsia: A pragmatic guide for first-trimester screening and prevention. Int. J. Gynaecol. Obstet. 2019, 145 (Suppl. S1), 1–33. [Google Scholar] [CrossRef] [PubMed]
- Abalos, E.; Cuesta, C.; Grosso, A.L.; Chou, D.; Say, L. Global and regional estimates of preeclampsia and eclampsia: A systematic review. Eur. J. Obstet. Gynecol. Reprod. Biol. 2013, 170, 1–7. [Google Scholar] [CrossRef] [PubMed]
- Osungbade, K.O.; Ige, O.K. Public health perspectives of preeclampsia in developing countries: Implication for health system strengthening. J. Pregnancy 2011, 2011, 481095. [Google Scholar] [CrossRef] [PubMed]
- Belay, A.S.; Wudad, T. Prevalence and associated factors of pre-eclampsia among pregnant women attending anti-natal care at Mettu Karl referal hospital, Ethiopia: Cross-sectional study. Clin. Hypertens. 2019, 25, 14. [Google Scholar] [CrossRef] [PubMed]
- Yang, Y.; Le Ray, I.; Zhu, J.; Zhang, J.; Hua, J.; Reilly, M. Preeclampsia Prevalence, Risk Factors, and Pregnancy Outcomes in Sweden and China. JAMA Netw. Open 2021, 4, e218401. [Google Scholar] [CrossRef] [PubMed]
- Backes, C.H.; Markham, K.; Moorehead, P.; Cordero, L.; Nankervis, C.A.; Giannone, P.J. Maternal preeclampsia and neonatal outcomes. J. Pregnancy 2011, 2011, 214365. [Google Scholar] [CrossRef]
- Büyükeren, M.; Çelik, H.T.; Örgül, G.; Yiğit, Ş.; Beksaç, M.S.; Yurdakök, M. Neonatal outcomes of early- and late-onset preeclampsia. Turk. J. Pediatr. 2020, 62, 812–819. [Google Scholar] [CrossRef]
- Weitzner, O.; Yagur, Y.; Weissbach, T.; Man El, G.; Biron-Shental, T. Preeclampsia: Risk factors and neonatal outcomes associated with early- versus late-onset diseases. J. Matern. Fetal Neonatal Med. 2020, 33, 780–784. [Google Scholar] [CrossRef]
- Rolnik, D.L.; Wright, D.; Poon, L.C.; O’Gorman, N.; Syngelaki, A.; de Paco Matallana, C.; Akolekar, R.; Cicero, S.; Janga, D.; Singh, M.; et al. Aspirin versus Placebo in Pregnancies at High Risk for Preterm Preeclampsia. N. Engl. J. Med. 2017, 377, 613–622. [Google Scholar] [CrossRef]
- Rolnik, D.L.; Nicolaides, K.H.; Poon, L.C. Prevention of preeclampsia with aspirin. Am. J. Obstet. Gynecol. 2022, 226, S1108–S1119. [Google Scholar] [CrossRef]
- Chaemsaithong, P.; Sahota, D.S.; Poon, L.C. First trimester preeclampsia screening and prediction. Am. J. Obstet. Gynecol. 2022, 226, S1071–S1097.e2. [Google Scholar] [CrossRef] [PubMed]
- National Collaborating Centre for Women’s and Children’s Health (UK). National Institute for Health and Clinical Excellence: Guidance. In Hypertension in Pregnancy: The Management of Hypertensive Disorders During Pregnancy; RCOG Press: London, UK, 2010. [Google Scholar]
- Baschat, A.A.; Magder, L.S.; Doyle, L.E.; Atlas, R.O.; Jenkins, C.B.; Blitzer, M.G. Prediction of preeclampsia utilizing the first trimester screening examination. Am. J. Obstet. Gynecol. 2014, 211, 514.e1–514.e7. [Google Scholar] [CrossRef]
- Scazzocchio, E.; Figueras, F.; Crispi, F.; Meler, E.; Masoller, N.; Mula, R.; Gratacos, E. Performance of a first-trimester screening of preeclampsia in a routine care low-risk setting. Am. J. Obstet. Gynecol. 2013, 208, 203.e1–203.e10. [Google Scholar] [CrossRef]
- Poon, L.C.; Kametas, N.A.; Chelemen, T.; Leal, A.; Nicolaides, K.H. Maternal risk factors for hypertensive disorders in pregnancy: A multivariate approach. J. Hum. Hypertens. 2010, 24, 104–110. [Google Scholar] [CrossRef] [PubMed]
- Chaemsaithong, P.; Pooh, R.K.; Zheng, M.; Ma, R.; Chaiyasit, N.; Tokunaka, M.; Shaw, S.W.; Seshadri, S.; Choolani, M.; Wataganara, T.; et al. Prospective evaluation of screening performance of first-trimester prediction models for preterm preeclampsia in an Asian population. Am. J. Obstet. Gynecol. 2019, 221, 650.e1–650.e16. [Google Scholar] [CrossRef] [PubMed]
- Jacquemyn, Y.; Zemtsova, O. Risk factors and prediction of preeclampsia. Acta Clin. Belg. 2010, 65, 1–12. [Google Scholar] [CrossRef]
- Goetzinger, K.R.; Tuuli, M.G.; Cahill, A.G.; Macones, G.A.; Odibo, A.O. Development and validation of a risk factor scoring system for first-trimester prediction of preeclampsia. Am. J. Perinatol. 2014, 31, 1049–1056. [Google Scholar]
- Poon, L.C.; Nicolaides, K.H. Early prediction of preeclampsia. Obstet. Gynecol. Int. 2014, 2014, 1–11. [Google Scholar] [CrossRef]
- Abdi, F.; Aghaie, Z.; Rahnemaie, F.S.; Alimoradi, Z. A Systematic Review of First Trimester Biochemical and Molecular Predictive Tests for Preeclampsia. Curr. Hypertens. Rev. 2018, 14, 21–28. [Google Scholar] [CrossRef]
- Kuc, S.; Wortelboer, E.J.; van Rijn, B.B.; Franx, A.; Visser, G.H.; Schielen, P.C. Evaluation of 7 serum biomarkers and uterine artery Doppler ultrasound for first-trimester prediction of preeclampsia: A systematic review. Obstet. Gynecol. Surv. 2011, 66, 225–239. [Google Scholar] [CrossRef]
- Tan, M.Y.; Syngelaki, A.; Poon, L.C.; Rolnik, D.L.; O’Gorman, N.; Delgado, J.L.; Akolekar, R.; Konstantinidou, L.; Tsavdaridou, M.; Galeva, S.; et al. Screening for pre-eclampsia by maternal factors and biomarkers at 11–13 weeks’ gestation. Ultrasound Obstet. Gynecol. 2018, 52, 186–195. [Google Scholar] [CrossRef]
- Vasilache, I.A.; Carauleanu, A.; Socolov, D.; Matasariu, R.; Pavaleanu, I.; Nemescu, D. Predictive performance of first trimester serum galectin-13/PP-13 in preeclampsia screening: A systematic review and meta-analysis. Exp. Ther. Med. 2022, 23, 370. [Google Scholar] [CrossRef]
- Nguyen, T.P.H.; Patrick, C.J.; Parry, L.J.; Familari, M. Using proteomics to advance the search for potential biomarkers for preeclampsia: A systematic review and meta-analysis. PLoS ONE 2019, 14, e0214671. [Google Scholar] [CrossRef] [PubMed]
- Ali, A.; Hadlich, F.; Abbas, M.W.; Iqbal, M.A.; Tesfaye, D.; Bouma, G.J.; Winger, Q.A.; Ponsuksili, S. MicroRNA-mRNA Networks in Pregnancy Complications: A Comprehensive Downstream Analysis of Potential Biomarkers. Int. J. Mol. Sci. 2021, 22, 2313. [Google Scholar] [CrossRef] [PubMed]
- Yao, M.; Xiao, Y.; Yang, Z.; Ge, W.; Liang, F.; Teng, H.; Gu, Y.; Yin, J. Identification of Biomarkers for Preeclampsia Based on Metabolomics. Clin. Epidemiol. 2022, 14, 337–360. [Google Scholar] [CrossRef] [PubMed]
- Deo, R.C. Machine Learning in Medicine. Circulation 2015, 132, 1920–1930. [Google Scholar] [CrossRef] [PubMed]
- Lip, G.Y.; Nieuwlaat, R.; Pisters, R.; Lane, D.A.; Crijns, H.J. Refining clinical risk stratification for predicting stroke and thromboembolism in atrial fibrillation using a novel risk factor-based approach: The euro heart survey on atrial fibrillation. Chest 2010, 137, 263–272. [Google Scholar] [CrossRef] [PubMed]
- Handelman, G.S.; Kok, H.K.; Chandra, R.V.; Razavi, A.H.; Lee, M.J.; Asadi, H. eDoctor: Machine learning and the future of medicine. J. Intern. Med. 2018, 284, 603–619. [Google Scholar] [CrossRef] [PubMed]
- Jhee, J.H.; Lee, S.; Park, Y.; Lee, S.E.; Kim, Y.A.; Kang, S.W.; Kwon, J.Y.; Park, J.T. Prediction model development of late-onset preeclampsia using machine learning-based methods. PLoS ONE 2019, 14, e0221202. [Google Scholar] [CrossRef]
- Schmidt, L.J.; Rieger, O.; Neznansky, M.; Hackelöer, M.; Dröge, L.A.; Henrich, W.; Higgins, D.; Verlohren, S. A machine-learning-based algorithm improves prediction of preeclampsia-associated adverse outcomes. Am. J. Obstet. Gynecol. 2022, 227, 77.e1–77.e30. [Google Scholar] [CrossRef] [PubMed]
- MacEachern, S.J.; Forkert, N.D. Machine learning for precision medicine. Genome 2021, 64, 416–425. [Google Scholar] [CrossRef] [PubMed]
- Sufriyana, H.; Husnayain, A.; Chen, Y.L.; Kuo, C.Y.; Singh, O.; Yeh, T.Y.; Wu, Y.W.; Su, E.C. Comparison of Multivariable Logistic Regression and Other Machine Learning Algorithms for Prognostic Prediction Studies in Pregnancy Care: Systematic Review and Meta-Analysis. JMIR Med. Inform. 2020, 8, e16503. [Google Scholar] [CrossRef] [PubMed]
- Manoochehri, Z.; Manoochehri, S.; Soltani, F.; Tapak, L.; Sadeghifar, M. Predicting preeclampsia and related risk factors using data mining approaches: A cross-sectional study. Int. J. Reprod. Biomed. 2021, 19, 959–968. [Google Scholar] [CrossRef] [PubMed]
- Gallo, D.; Poon, L.C.; Fernandez, M.; Wright, D.; Nicolaides, K.H. Prediction of preeclampsia by mean arterial pressure at 11–13 and 20–24 weeks’ gestation. Fetal Diagn. Ther. 2014, 36, 28–37. [Google Scholar] [CrossRef]
- Khalil, A.; Garcia-Mandujano, R.; Maiz, N.; Elkhouli, M.; Nicolaides, K.H. Longitudinal changes in uterine artery Doppler and blood pressure and risk of pre-eclampsia. Ultrasound Obstet. Gynecol. 2014, 43, 541–547. [Google Scholar] [CrossRef]
- Tranquilli, A.; Dekker, G.; Magee, L.; Roberts, J.; Sibai, B.; Steyn, W.; Zeeman, G.; Brown, M. The classification, diagnosis and management of the hypertensive disorders of pregnancy: A revised statement from the ISSHP. Pregnancy Hypertens. 2014, 4, 97–104. [Google Scholar] [CrossRef]
- Roberts, J.M.; Rich-Edwards, J.W.; McElrath, T.F.; Garmire, L.; Myatt, L. Subtypes of Preeclampsia: Recognition and Determining Clinical Usefulness. Hypertension 2021, 77, 1430–1441. [Google Scholar] [CrossRef]
- Gestational Hypertension and Preeclampsia: ACOG Practice Bulletin, Number 222. Obstet. Gynecol. 2020, 135, e237–e260. [CrossRef]
- Quinlan, J.R. Induction of decision trees. Mach. Learn. 1986, 1, 81–106. [Google Scholar] [CrossRef]
- Uddin, S.; Khan, A.; Hossain, M.E.; Moni, M.A. Comparing different supervised machine learning algorithms for disease prediction. BMC Med. Inform. Decis. Mak. 2019, 19, 281. [Google Scholar] [CrossRef]
- De Felice, F.; Crocetti, D.; Parisi, M.; Maiuri, V.; Moscarelli, E.; Caiazzo, R.; Bulzonetti, N.; Musio, D.; Tombolini, V. Decision tree algorithm in locally advanced rectal cancer: An example of over-interpretation and misuse of a machine learning approach. J. Cancer Res. Clin. Oncol. 2020, 146, 761–765. [Google Scholar] [CrossRef] [PubMed]
- Lindley, D.V. Fiducial distributions and Bayes’ theorem. J. R. Stat. Soc. Ser. B 1958, 20, 102–107. [Google Scholar] [CrossRef]
- Cortes, C.; Vapnik, V. Support-vector networks. Mach. Learn. 1995, 20, 273–297. [Google Scholar] [CrossRef]
- Raikwal, J.; Saxena, K. Performance evaluation of SVM and k-nearest neighbor algorithm over medical data set. Int. J. Comput. Appl. 2012, 50, 35–39. [Google Scholar]
- Breiman, L. Random forests. Mach. Learn. 2001, 45, 5–32. [Google Scholar] [CrossRef]
- Di Lorenzo, G.; Ceccarello, M.; Cecotti, V.; Ronfani, L.; Monasta, L.; Vecchi Brumatti, L.; Montico, M.; D’Ottavio, G. First trimester maternal serum PIGF, free β-hCG, PAPP-A, PP-13, uterine artery Doppler and maternal history for the prediction of preeclampsia. Placenta 2012, 33, 495–501. [Google Scholar] [CrossRef]
- Anderson, U.D.; Gram, M.; Åkerström, B.; Hansson, S.R. First trimester prediction of preeclampsia. Curr. Hypertens. Rep. 2015, 17, 584. [Google Scholar] [CrossRef]
- Keikkala, E.; Koskinen, S.; Vuorela, P.; Laivuori, H.; Romppanen, J.; Heinonen, S.; Stenman, U.H. First trimester serum placental growth factor and hyperglycosylated human chorionic gonadotropin are associated with pre-eclampsia: A case control study. BMC Pregnancy Childbirth 2016, 16, 378. [Google Scholar] [CrossRef]
- Nevalainen, J.; Korpimaki, T.; Kouru, H.; Sairanen, M.; Ryynanen, M. Performance of first trimester biochemical markers and mean arterial pressure in prediction of early-onset pre-eclampsia. Metabolism 2017, 75, 6–15. [Google Scholar] [CrossRef]
- Mendoza, M.; Garcia-Manau, P.; Arévalo, S.; Avilés, M.; Serrano, B.; Sánchez-Durán, M.; Garcia-Ruiz, I.; Bonacina, E.; Carreras, E. Diagnostic accuracy of first-trimester combined screening for early-onset and preterm pre-eclampsia at 8–10 compared with 11–13 weeks’ gestation. Ultrasound Obstet. Gynecol. 2021, 57, 84–90. [Google Scholar] [CrossRef]
- Scazzocchio, E.; Figueras, F. Contemporary prediction of preeclampsia. Curr. Opin. Obstet. Gynecol. 2011, 23, 65–71. [Google Scholar] [CrossRef] [PubMed]
- Rodriguez, A.; Tuuli, M.G.; Odibo, A.O. First-, Second-, and Third-Trimester Screening for Preeclampsia and Intrauterine Growth Restriction. Clin. Lab. Med. 2016, 36, 331–351. [Google Scholar] [CrossRef] [PubMed]
- Capriglione, S.; Gulino, F.A.; Latella, S.; De Felice, G.; Filippini, M.; Farinelli, M.; Martire, F.G.; Viora, E. Results of a Five-Year Experience in First Trimester Preeclampsia Screening. J. Clin. Med. 2022, 11, 4555. [Google Scholar] [CrossRef] [PubMed]
- Capriglione, S.; Plotti, F.; Terranova, C.; Gulino, F.A.; Di Guardo, F.; Lopez, S.; Scaletta, G.; Angioli, R. Preeclampsia and the challenge of early prediction: Reality or utopia? State of art and critical review of literature. J. Matern. Fetal Neonatal Med. 2020, 33, 677–686. [Google Scholar] [CrossRef]
- Zhao, M.; Zhu, Z.; Liu, C.; Zhang, Z. Dual-cutoff of sFlt-1/PlGF ratio in the stratification of preeclampsia: A systematic review and meta-analysis. Arch. Gynecol. Obstet. 2017, 295, 1079–1087. [Google Scholar] [CrossRef]
- Yusuf, A.M.; Kahane, A.; Ray, J.G. First and Second Trimester Serum sFlt-1/PlGF Ratio and Subsequent Preeclampsia: A Systematic Review. J. Obstet. Gynaecol. Can. 2018, 40, 618–626. [Google Scholar] [CrossRef]
- Verlohren, S.; Brennecke, S.P.; Galindo, A.; Karumanchi, S.A.; Mirkovic, L.B.; Schlembach, D.; Stepan, H.; Vatish, M.; Zeisler, H.; Rana, S. Clinical interpretation and implementation of the sFlt-1/PlGF ratio in the prediction, diagnosis and management of preeclampsia. Pregnancy Hypertens. 2022, 27, 42–50. [Google Scholar] [CrossRef]


| Patient’s Characteristics | Group 1 (PE, n = 116) | Group 2 (Without PE, n = 116) | p Value |
|---|---|---|---|
| Age, years (mean ± SD) | 29.22 ± 6.88 | 28.62 ± 6.39 | 0.49 |
| BMI (kg/m2) | 26.4 ± 1.07 ** | 21.87 ± 2.47 | <0.001 |
| Medium (n/%) | Urban = 54 (46.55%) Rural = 62 (53.45%) | Urban = 53 (45.69%) Rural = 63 (54.31%) | 0.10 |
| Parity (n/%) | Nulliparity = 75 (64.66%) Multiparity = 41 (35.34%) | Nulliparity = 65 (56.03%) Multiparity = 51 (43.97%) | 0.18 |
| Personal history of PE (n/%) | Yes = 10 (8.62%) ** | Yes = 0 (0%) | <0.001 |
| Personal history of hypertension (n/%) | Yes = 10 (8.62%) ** | Yes = 1 (0.86%) | 0.005 |
| Personal history of renal disease (n/%) | Yes = 2 (1.72%) | Yes = 0 (0%) | 0.15 |
| Personal history of diabetes (n/%) | Yes = 2 (1.72%) | Yes = 0 (0%) | 0.15 |
| Personal history of SLE/APS (n/%) | Yes = 9 (7.76%) | Yes = 3 (2.59%) | 0.07 |
| Obesity (n/%) | Yes = 31 (26.72%) ** | Yes = 5 (4.31%) | <0.001 |
| Interpregnancy interval, years (mean ± SD) | 1.02 ± 1.93 | 1.13 ± 1.85 | 0.65 |
| MAP, MoM (mean ± SD) | 1.10 ± 0.10 ** | 0.85 ± 0.15 | <0.001 |
| UtA-PI, MoM (mean ± SD) | 1.54 ± 0.29 ** | 0.82 ± 0.21 | <0.001 |
| PAPP-A, MoM (mean ± SD) | 0.82 ± 0.52 ** | 1.00 ± 0.16 | <0.001 |
| PLGF, MoM (mean ± SD) | 2.17 ± 0.96 ** | 1.35 ± 0.34 | <0.001 |
| PP-13, MoM (mean ± SD) | 0.75 ± 0.12 ** | 1.09 ± 0.13 | <0.001 |
| Pregnancy Outcome | Group 1 (PE, n = 116) | Group 2 (Without PE, n = 116) | p Value |
|---|---|---|---|
| Placenta praevia (n/%) | Yes = 5 (4.31%) | Yes = 7 (6.03%) | 0.55 |
| Preterm birth (n/%) | Yes = 51 (43.97%) ** | Yes = 5 (4.31%) | <0.001 |
| Intrauterine growth restriction (n/%) | Yes = 48 (41.38%) ** | Yes = 5 (4.31%) | <0.001 |
| Oligoamnios (n/%) | Yes = 8 (6.90%) ** | Yes= 1 (0.86%) | 0.01 |
| Polyhydramnios (n/%) | Yes = 0 (0%) | Yes= 5 (4.31%) ** | 0.02 |
| PE related complications (n/%) | Eclampsia = 2 (1.72%) bruptio placentae = 3 (2.58%) HELLP syndrome = 3 (2.58%) | - | - |
| Newborn’s gender (n/%) | Male = 60 (51.72%) Female = 56 (48.28%) | Male = 59 (26.72%) Female = 57 (49.14%) | 0.89 |
| Gestational age at birth, weeks (mean ± SD) | 35.87± 3.41 ** | 38.37 ± 1.40 | <0.001 |
| Mode of delivery (n/%) | Cesarean = 112 (96.55%) ** Vaginal = 4 (3.45%) ** | Cesarean = 72 (62.07%) Vaginal = 44 (37.93%) | <0.001 |
| Presentation (n/%) | Cephalic = 105 (90.52%) Breech = 10 (8.62%) Transverse = 1(0.86%) | Cephalic = 108 (93.10%) Breech = 8 (6.90%) Transverse = 0 (0%) | 0.53 |
| Apgar score at 1 min (mean ± SD) | 7.25 ± 1.86 ** | 8.37 ± 0.88 | <0.001 |
| Apgar score at 5 min (mean ± SD) | 7.98 ± 1.36 ** | 8.84 ± 0.71 | <0.001 |
| Birthweight, g (mean ± SD) | 2519.91 ± 946.60 ** | 3240 ± 457.60 | <0.001 |
| Newborn’s length, cm (mean ± SD) | 46.39 ± 6.00 ** | 50.79 ± 2.27 | <0.001 |
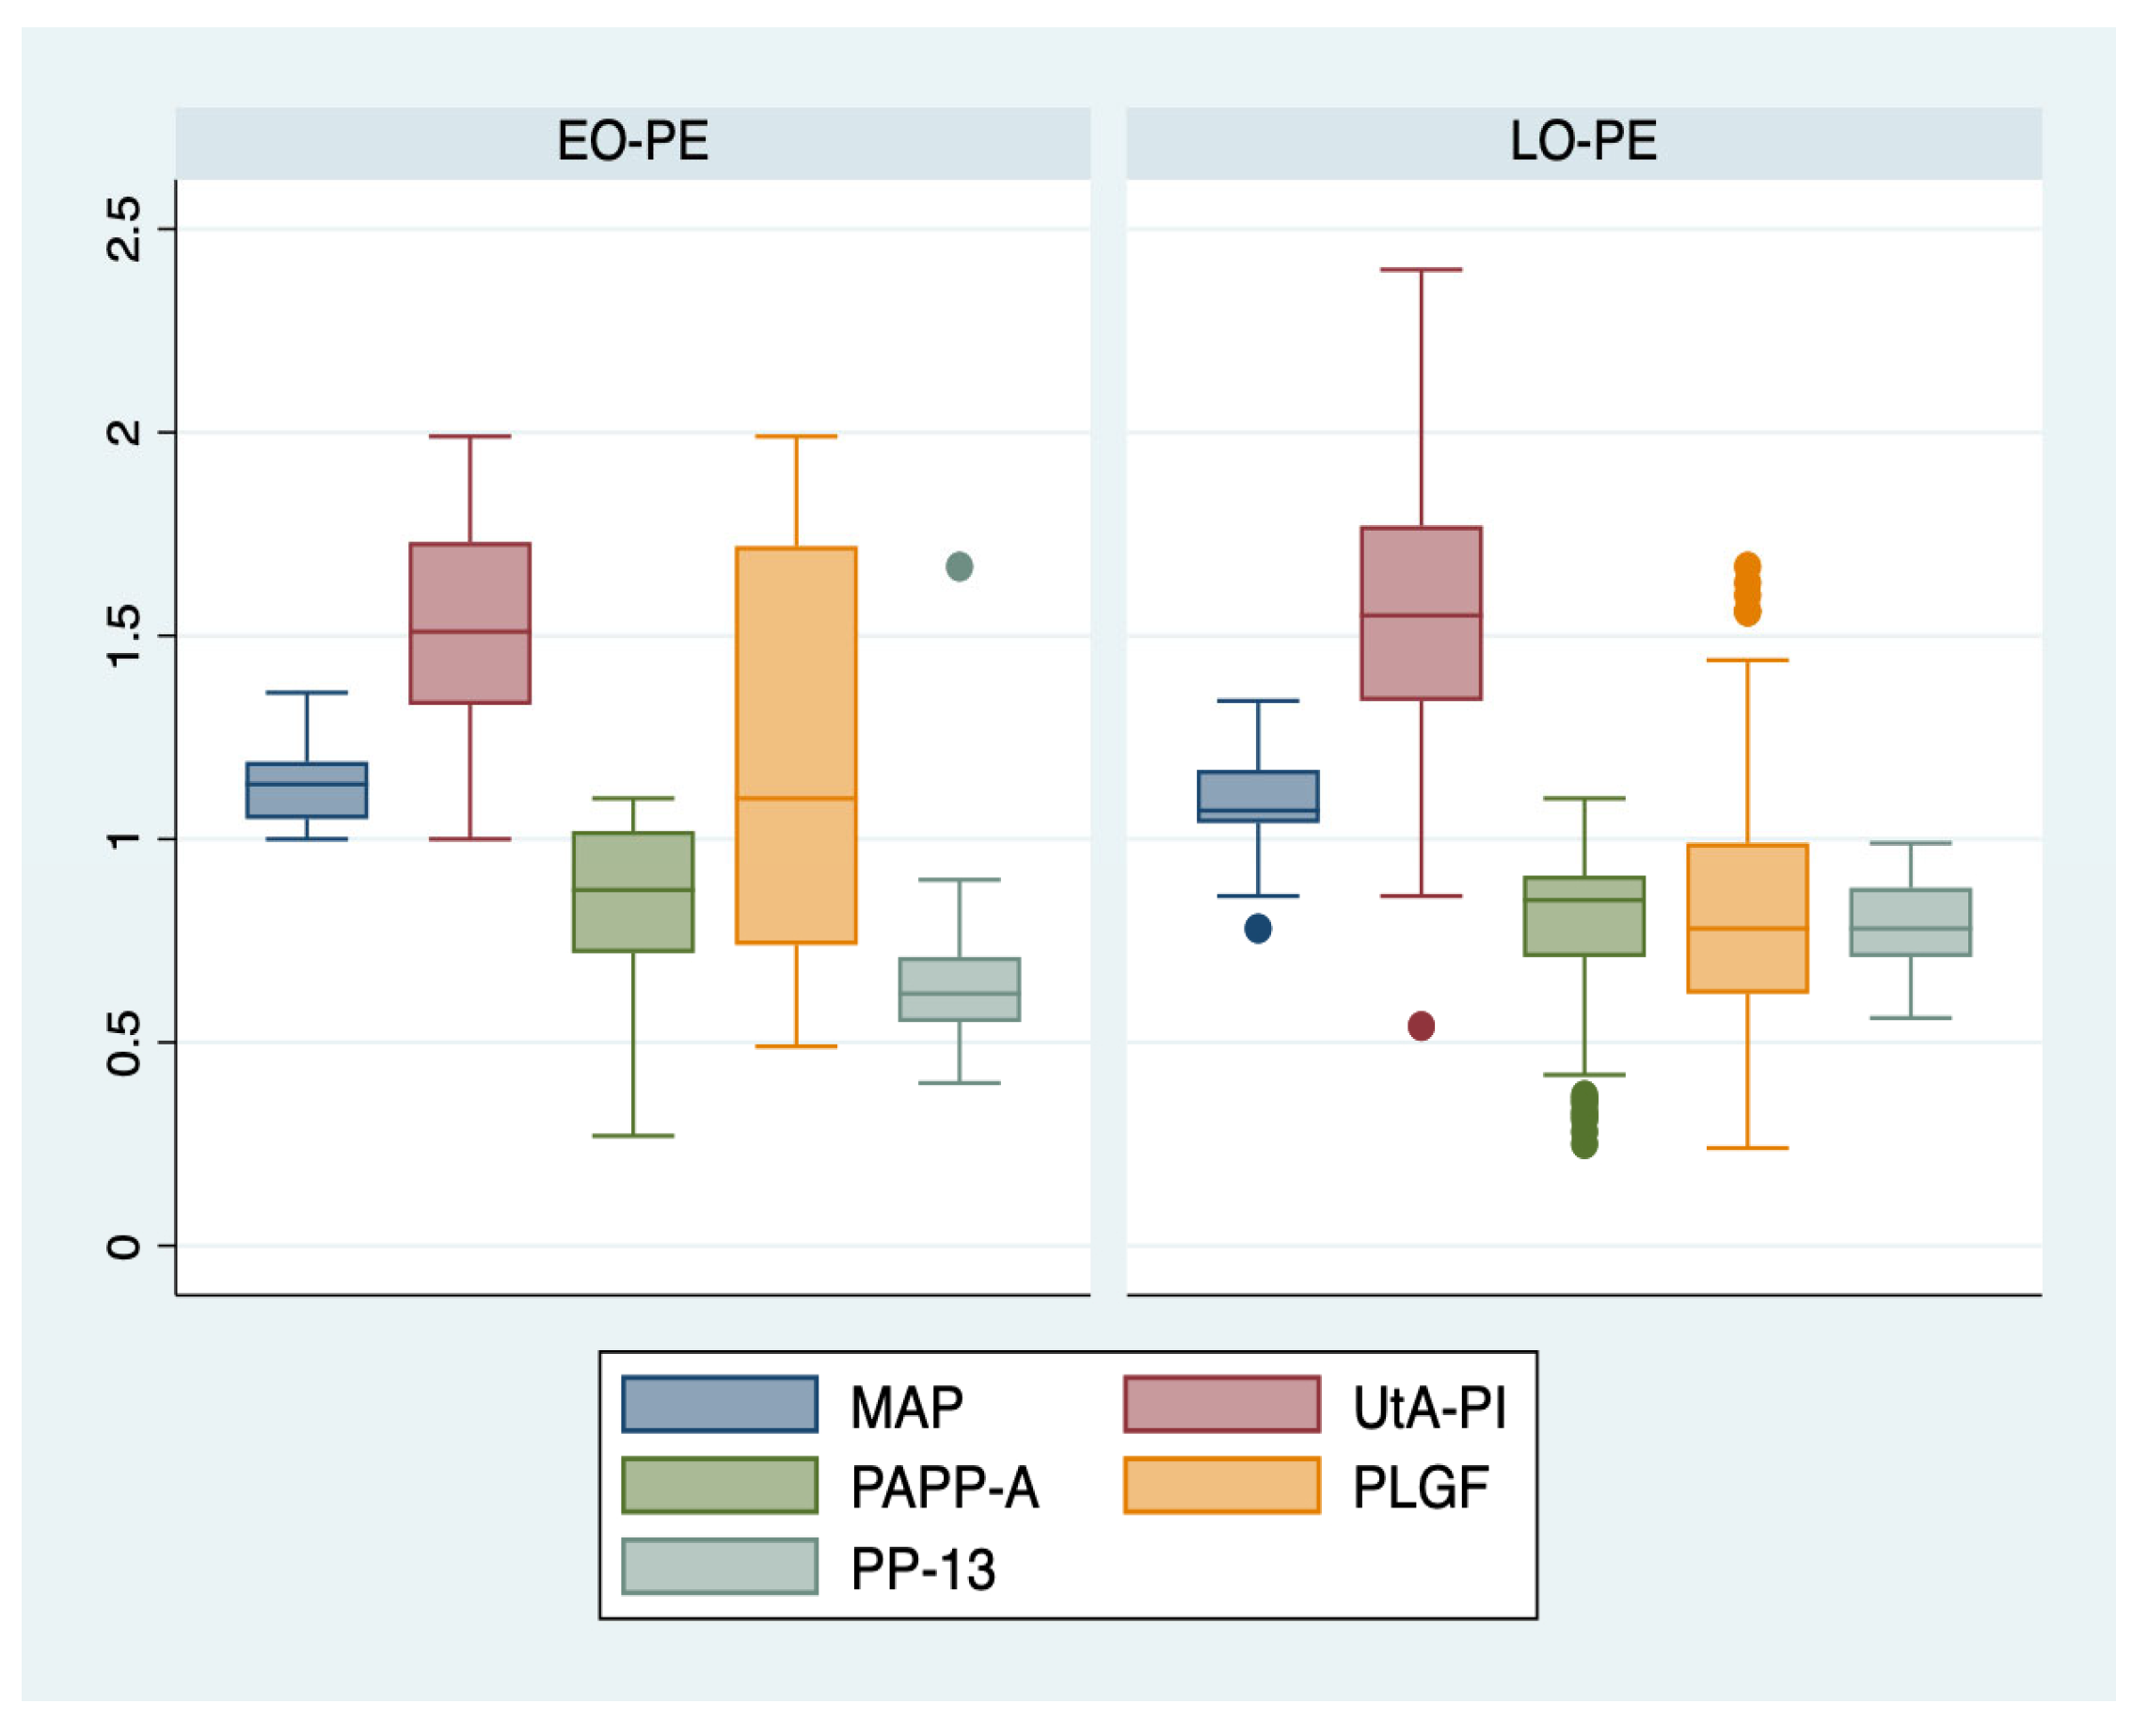
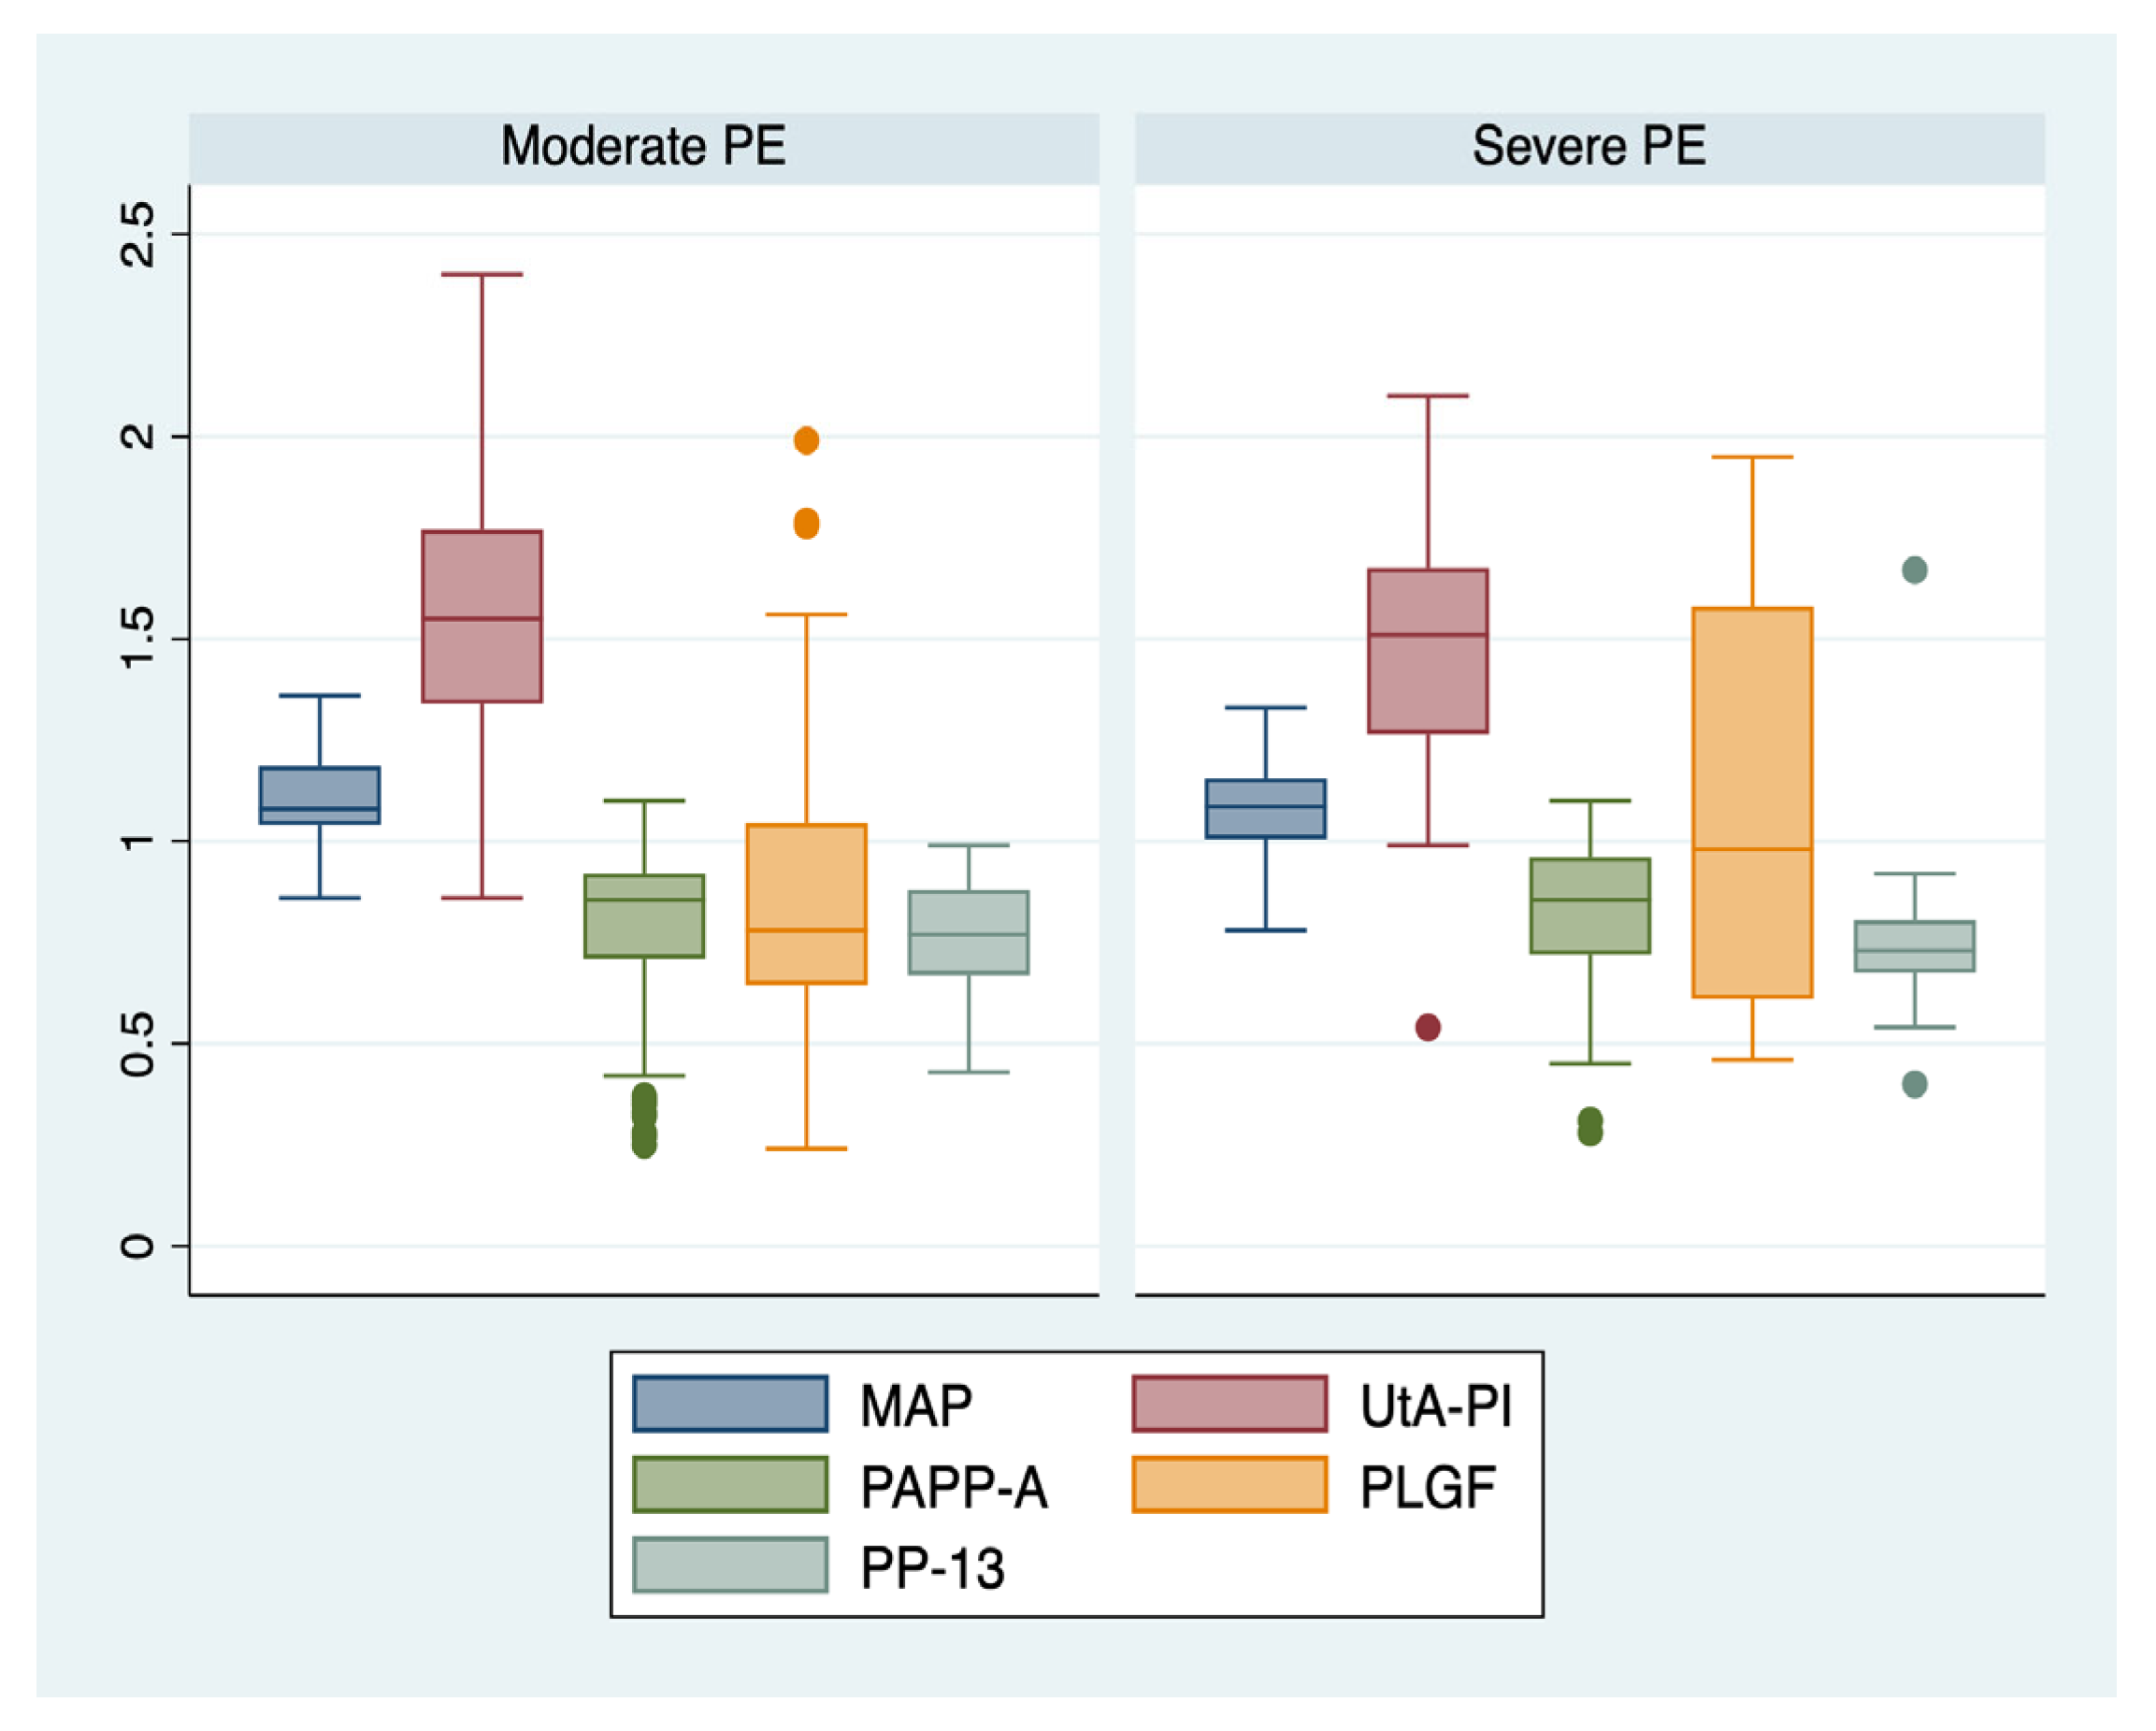
| Paraclinical Parameter | Subgroup 1 (EO-PE, n = 22) | Subgroup 2 (LO-PE, n = 94) | Sum of Squares | p Value | Subgroup 3 (Moderate PE, n = 88) | Subgroup 4 (Severe PE, n = 28) | Sum of Squares (SS) | p Value |
|---|---|---|---|---|---|---|---|---|
| MAP, MoM (mean ± SD) | 1.13 ± 0.08 | 1.09 ± 0.11 | 0.02 | 0.15 | 1.11 ± 0.10 | 1.07 ± 0.11 | 0.02 | 0.13 |
| UtA-PI, MoM (mean ± SD) | 1.52 ± 0.27 | 1.54 ± 0.29 | 0.01 | 0.61 | 1.56 ± 0.27 | 1.47 ± 0.34 | 0.17 | 0.16 |
| PAPP-A, MoM (mean ± SD) | 0.82 ± 0.24 | 0.83 ± 0.58 | 0.001 | 0.94 | 0.77 ± 0.21 | 0.81 ± 0.21 | 0.02 | 0.43 |
| PLGF, MoM (mean ± SD) | 1.18 ± 0.51 ** | 0.85 ± 0.32 | 1.97 | <0.001 | 0.86 ± 0.33 | 1.07 ± 0.47 ** | 1.04 | <0.001 |
| PP-13, MoM (mean ± SD) | 0.94± 0.48 ** | 0.72 ± 0.23 | 0.80 | 0.003 | 0.74 ± 0.30 | 0.83 ± 0.33 | 0.14 | 0.21 |
| ML Model | Type of PE | TPR (%) | FNR (%) | PPV (%) | FDR (%) | Accuracy (%) | AUC Value | Precision | Recall | F1 Score |
|---|---|---|---|---|---|---|---|---|---|---|
| DT | All PE | 94.1 | 5.9 | 91.4 | 8.6 | 92.8 | 0.93 | 0.91 | 0.94 | 0.93 |
| EO-PE | 92.9 | 7.1 | 75 | 25 | 94.1 | 0.95 | 0.93 | 0.75 | 0.86 | |
| LO-PE | 66.7 | 33.3 | 92.9 | 7.1 | 88.2 | 0.80 | 0.93 | 0.93 | 0.93 | |
| Moderate PE | 75 | 25 | 91.7 | 8.3 | 82.4 | 0.80 | 0.85 | 0.92 | 0.88 | |
| Severe PE | 82.1 | 17.9 | 44.4 | 55.6 | 79.4 | 0.70 | 0.67 | 0.44 | 0.53 | |
| NB | All PE | 96.3 | 3.7 | 96.4 | 3.6 | 98.6 | 0.98 | 0.96 | 0.96 | 0.98 |
| EO-PE | 96.4 | 3.6 | 80 | 20 | 91.2 | 0.88 | 0.67 | 0.80 | 0.73 | |
| LO-PE | 33.3 | 66.7 | 87.1 | 12.9 | 85.3 | 0.72 | 0.96 | 0.87 | 0.92 | |
| Moderate PE | 25 | 75 | 79.3 | 20.7 | 73.5 | 0.68 | 0.88 | 0.79 | 0.84 | |
| Severe PE | 89.3 | 10.7 | 50 | 50 | 82.4 | 0.67 | 0.50 | 0.50 | 0.50 | |
| SVM | All PE | 70.6 | 29.4 | 77.8 | 22.2 | 85.5 | 0.98 | 0.71 | 0.78 | 0.88 |
| EO-PE | 96.4 | 3.6 | 80 | 20 | 91.2 | 0.91 | 0.67 | 0.80 | 0.73 | |
| LO-PE | 33.3 | 66.7 | 86.7 | 13.3 | 82.4 | 0.76 | 0.93 | 0.87 | 0.90 | |
| Moderate PE | 37.5 | 62.5 | 80.8 | 19.2 | 70.6 | 0.49 | 0.81 | 0.81 | 0.81 | |
| Severe PE | 85.7 | 14.3 | 20 | 80 | 73.5 | 0.64 | 0.17 | 0.20 | 0.18 | |
| RF | All PE | 94.1 | 5.9 | 91.4 | 8.6 | 92.8 | 0.94 | 0.91 | 0.94 | 0.93 |
| EO-PE | 92.9 | 7.1 | 71.4 | 28.6 | 91.2 | 0.94 | 0.83 | 0.71 | 0.77 | |
| LO-PE | 66.7 | 33.3 | 92.9 | 7.1 | 88.2 | 0.84 | 0.93 | 0.93 | 0.93 | |
| Moderate PE | 87.5 | 12.5 | 94.4 | 5.6 | 70.6 | 0.79 | 0.65 | 0.94 | 0.77 | |
| Severe PE | 85.7 | 14.3 | 33.3 | 66.7 | 76.5 | 0.76 | 0.33 | 0.33 | 0.33 |
| Variance between Groups | Sum of Squares | Mean SQUARE | F | p Value | Eta Squared | 95% CI Lower Bound | 95% CI Upper Bound |
|---|---|---|---|---|---|---|---|
| TPR | 4895.68 | 1631.89 | 12.25 | <0.001 | 0.75 | 0.29 | 0.83 |
| PPV | 7455.69 | 2485.23 | 36.96 | <0.001 | 0.90 | 0.67 | 0.93 |
| Accuracy | 546.05 | 182.01 | 13.68 | <0.001 | 0.77 | 0.34 | 0.84 |
| AUC | 0.18 | 0.06 | 34.77 | <0.001 | 0.89 | 0.65 | 0.93 |
| Precision | 0.64 | 0.21 | 11.41 | <0.001 | 0.74 | 0.27 | 0.82 |
| Recall | 0.76 | 0.25 | 37.17 | <0.001 | 0.90 | 0.67 | 0.93 |
| F1 score | 0.78 | 0.26 | 32.44 | <0.001 | 0.89 | 0.63 | 0.92 |
Disclaimer/Publisher’s Note: The statements, opinions and data contained in all publications are solely those of the individual author(s) and contributor(s) and not of MDPI and/or the editor(s). MDPI and/or the editor(s) disclaim responsibility for any injury to people or property resulting from any ideas, methods, instructions or products referred to in the content. |
© 2023 by the authors. Licensee MDPI, Basel, Switzerland. This article is an open access article distributed under the terms and conditions of the Creative Commons Attribution (CC BY) license (https://creativecommons.org/licenses/by/4.0/).
Share and Cite
Melinte-Popescu, A.-S.; Vasilache, I.-A.; Socolov, D.; Melinte-Popescu, M. Predictive Performance of Machine Learning-Based Methods for the Prediction of Preeclampsia—A Prospective Study. J. Clin. Med. 2023, 12, 418. https://doi.org/10.3390/jcm12020418
Melinte-Popescu A-S, Vasilache I-A, Socolov D, Melinte-Popescu M. Predictive Performance of Machine Learning-Based Methods for the Prediction of Preeclampsia—A Prospective Study. Journal of Clinical Medicine. 2023; 12(2):418. https://doi.org/10.3390/jcm12020418
Chicago/Turabian StyleMelinte-Popescu, Alina-Sinziana, Ingrid-Andrada Vasilache, Demetra Socolov, and Marian Melinte-Popescu. 2023. "Predictive Performance of Machine Learning-Based Methods for the Prediction of Preeclampsia—A Prospective Study" Journal of Clinical Medicine 12, no. 2: 418. https://doi.org/10.3390/jcm12020418
APA StyleMelinte-Popescu, A.-S., Vasilache, I.-A., Socolov, D., & Melinte-Popescu, M. (2023). Predictive Performance of Machine Learning-Based Methods for the Prediction of Preeclampsia—A Prospective Study. Journal of Clinical Medicine, 12(2), 418. https://doi.org/10.3390/jcm12020418