
Modified Poly(vinylidene fluoride) by Diethylenetriamine as a Supported Anion Exchange Membrane for Lithium Salt Concentration by Hybrid Capacitive Deionization


Abstract
:1. Introduction
2. Materials and Methods
2.1. Materials
2.2. Membrane Fabrication
2.3. AEM Characterization
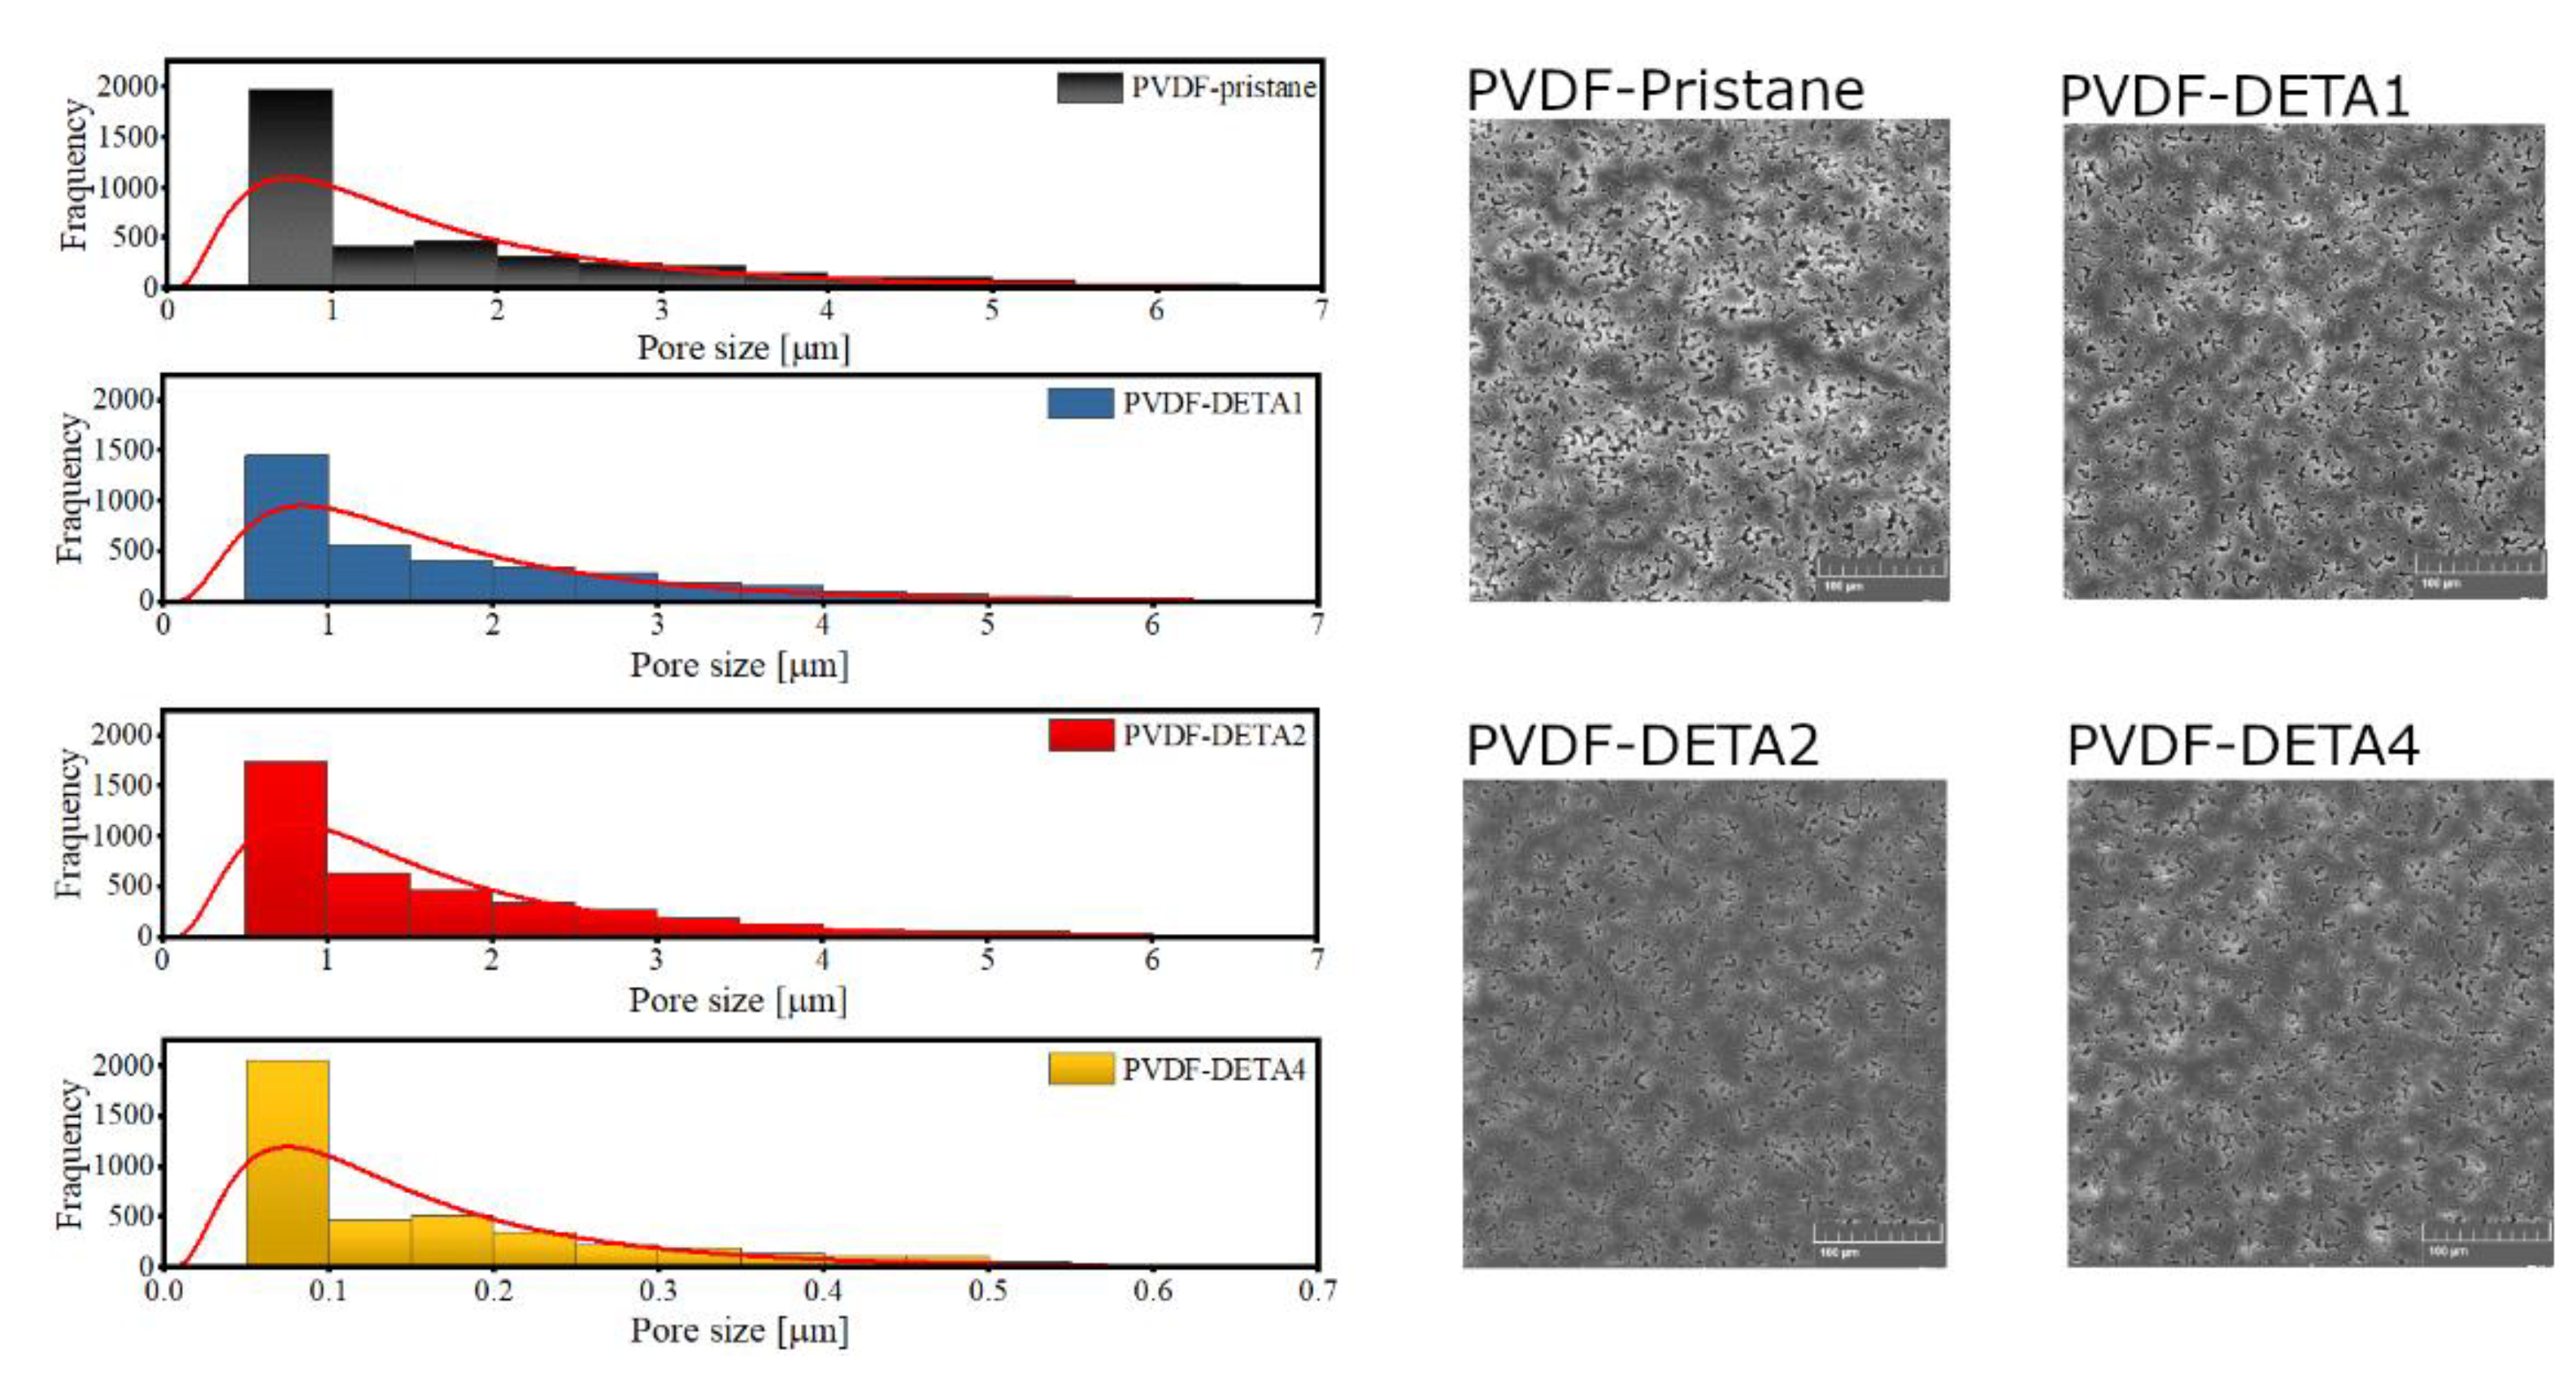
2.3.1. Scanning Electron Microscope (SEM)
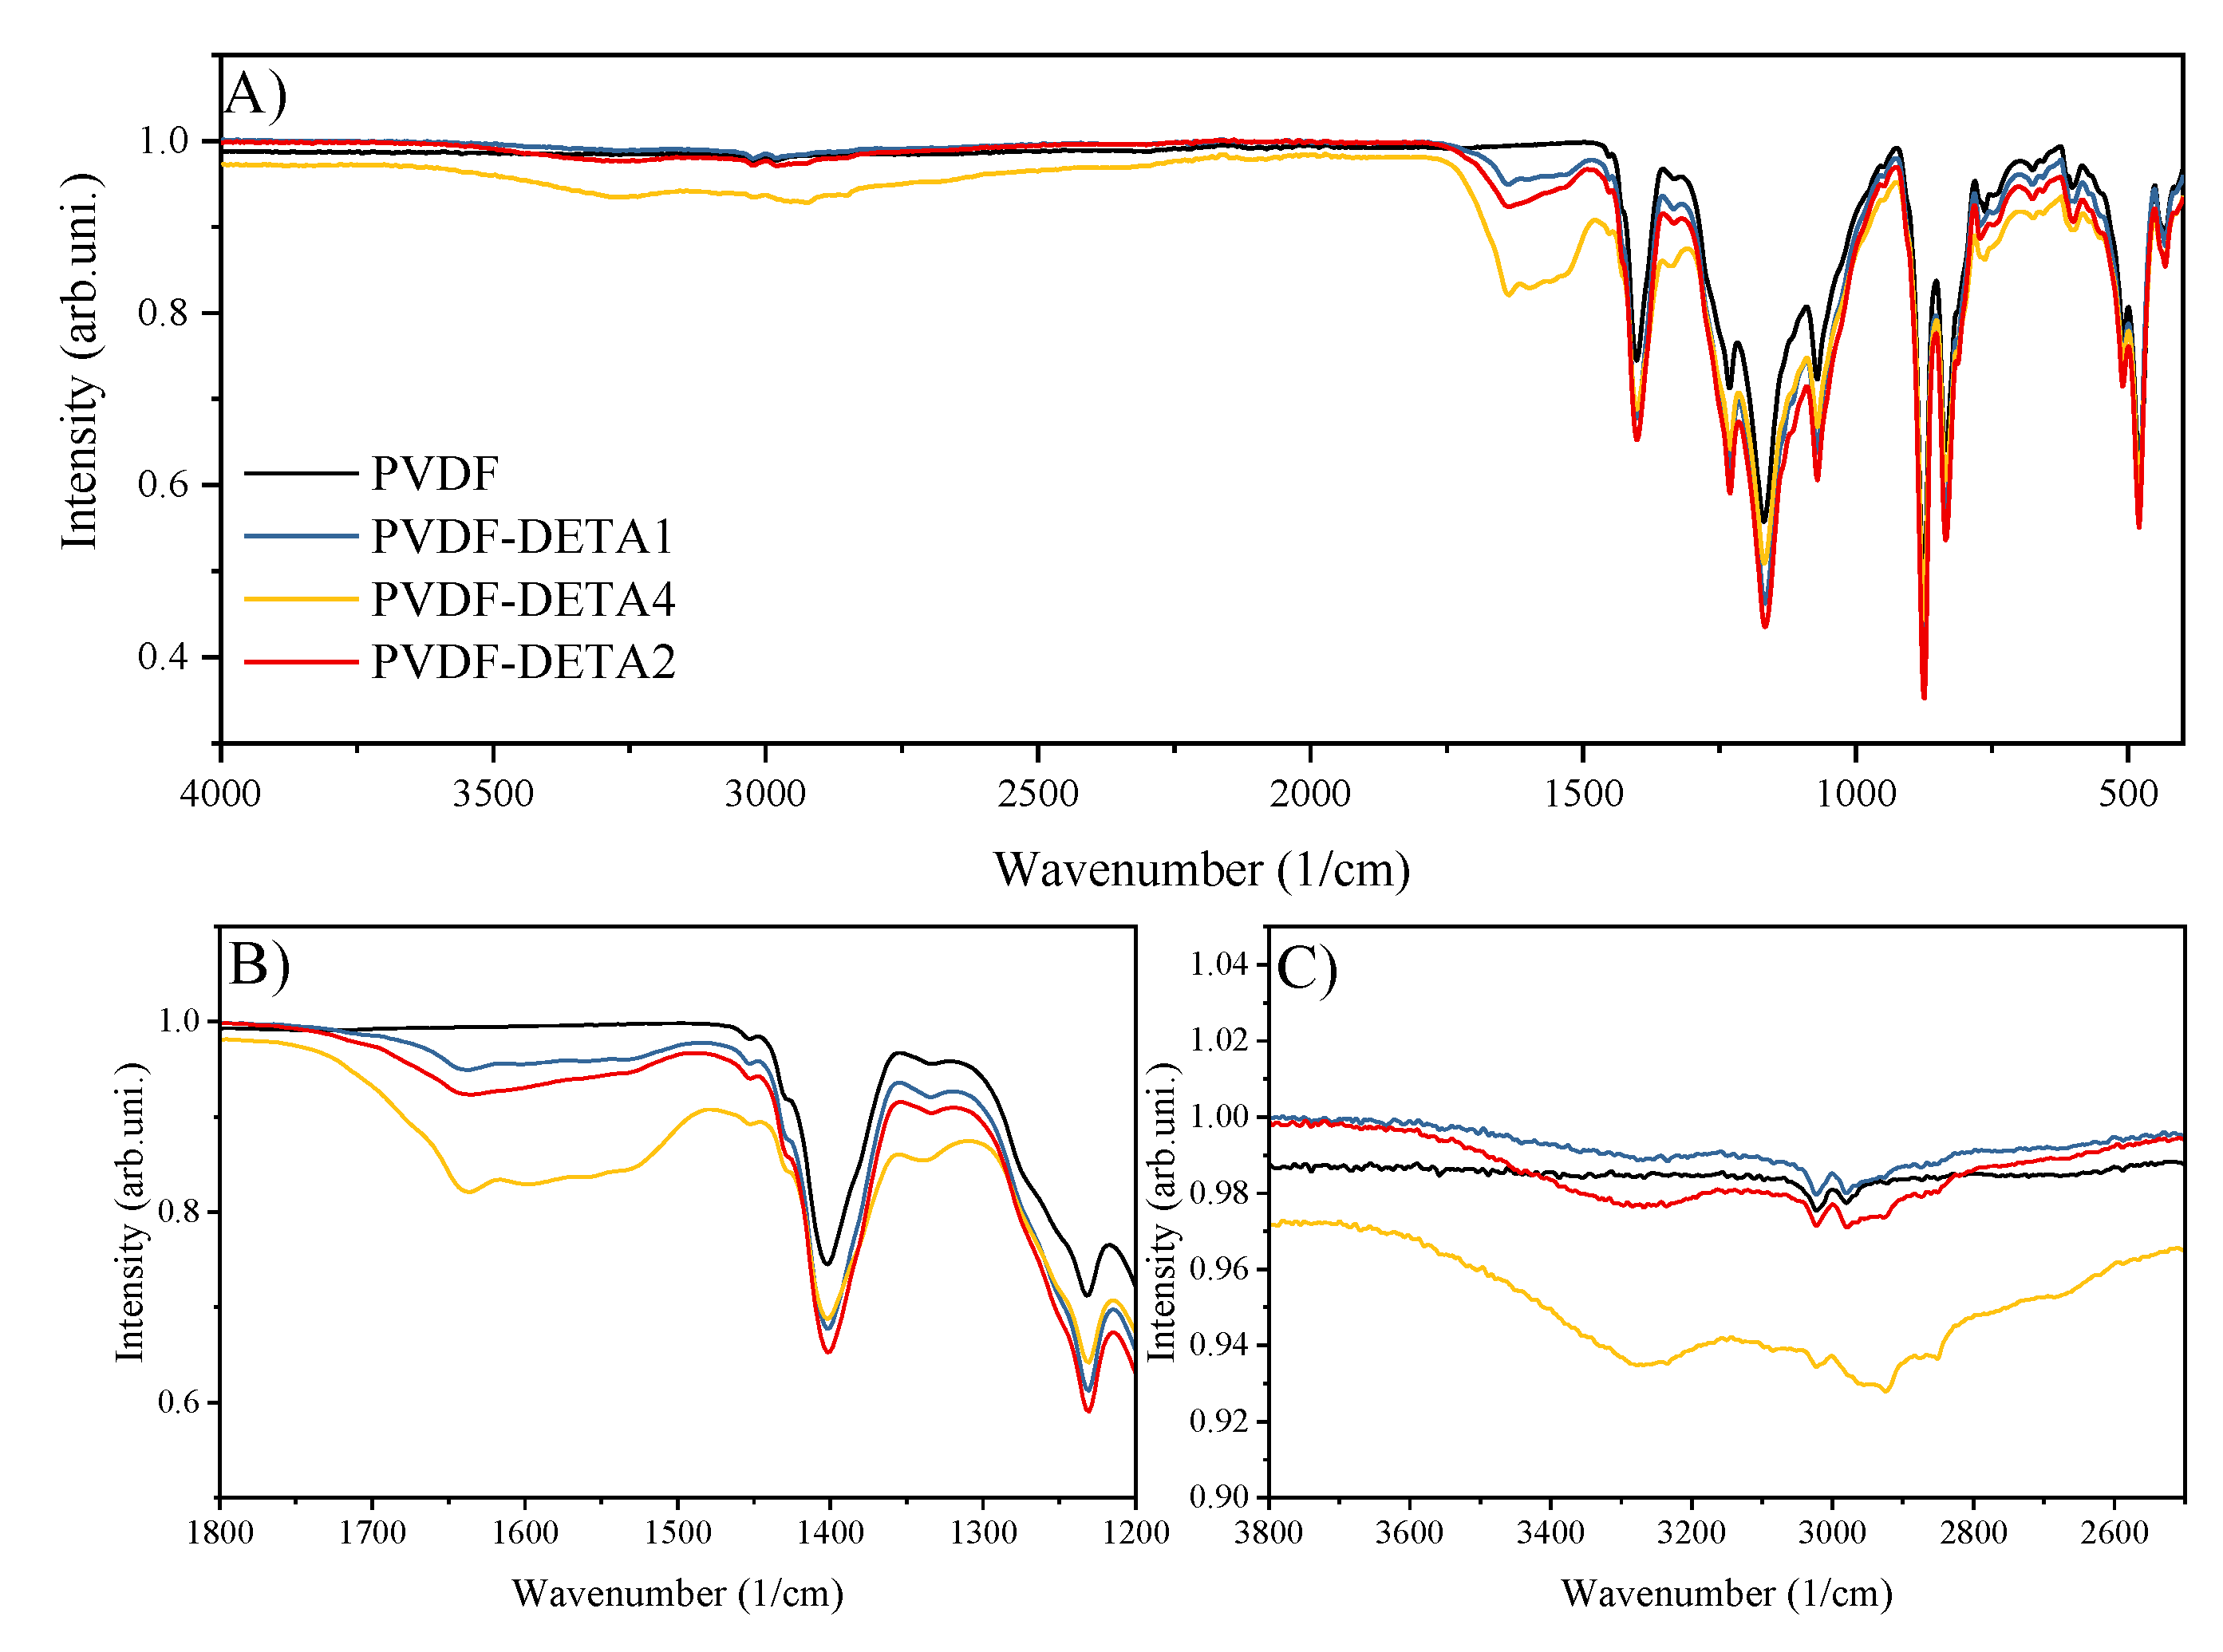
2.3.2. Fourier Transform Infrared Spectroscopy
2.3.3. Surface Energetics
2.3.4. The Analytical Section
Water Uptake
Ion Exchange Capacity
Nitrogen Content
Diffusion Dialysis
2.3.5. HCDI Process
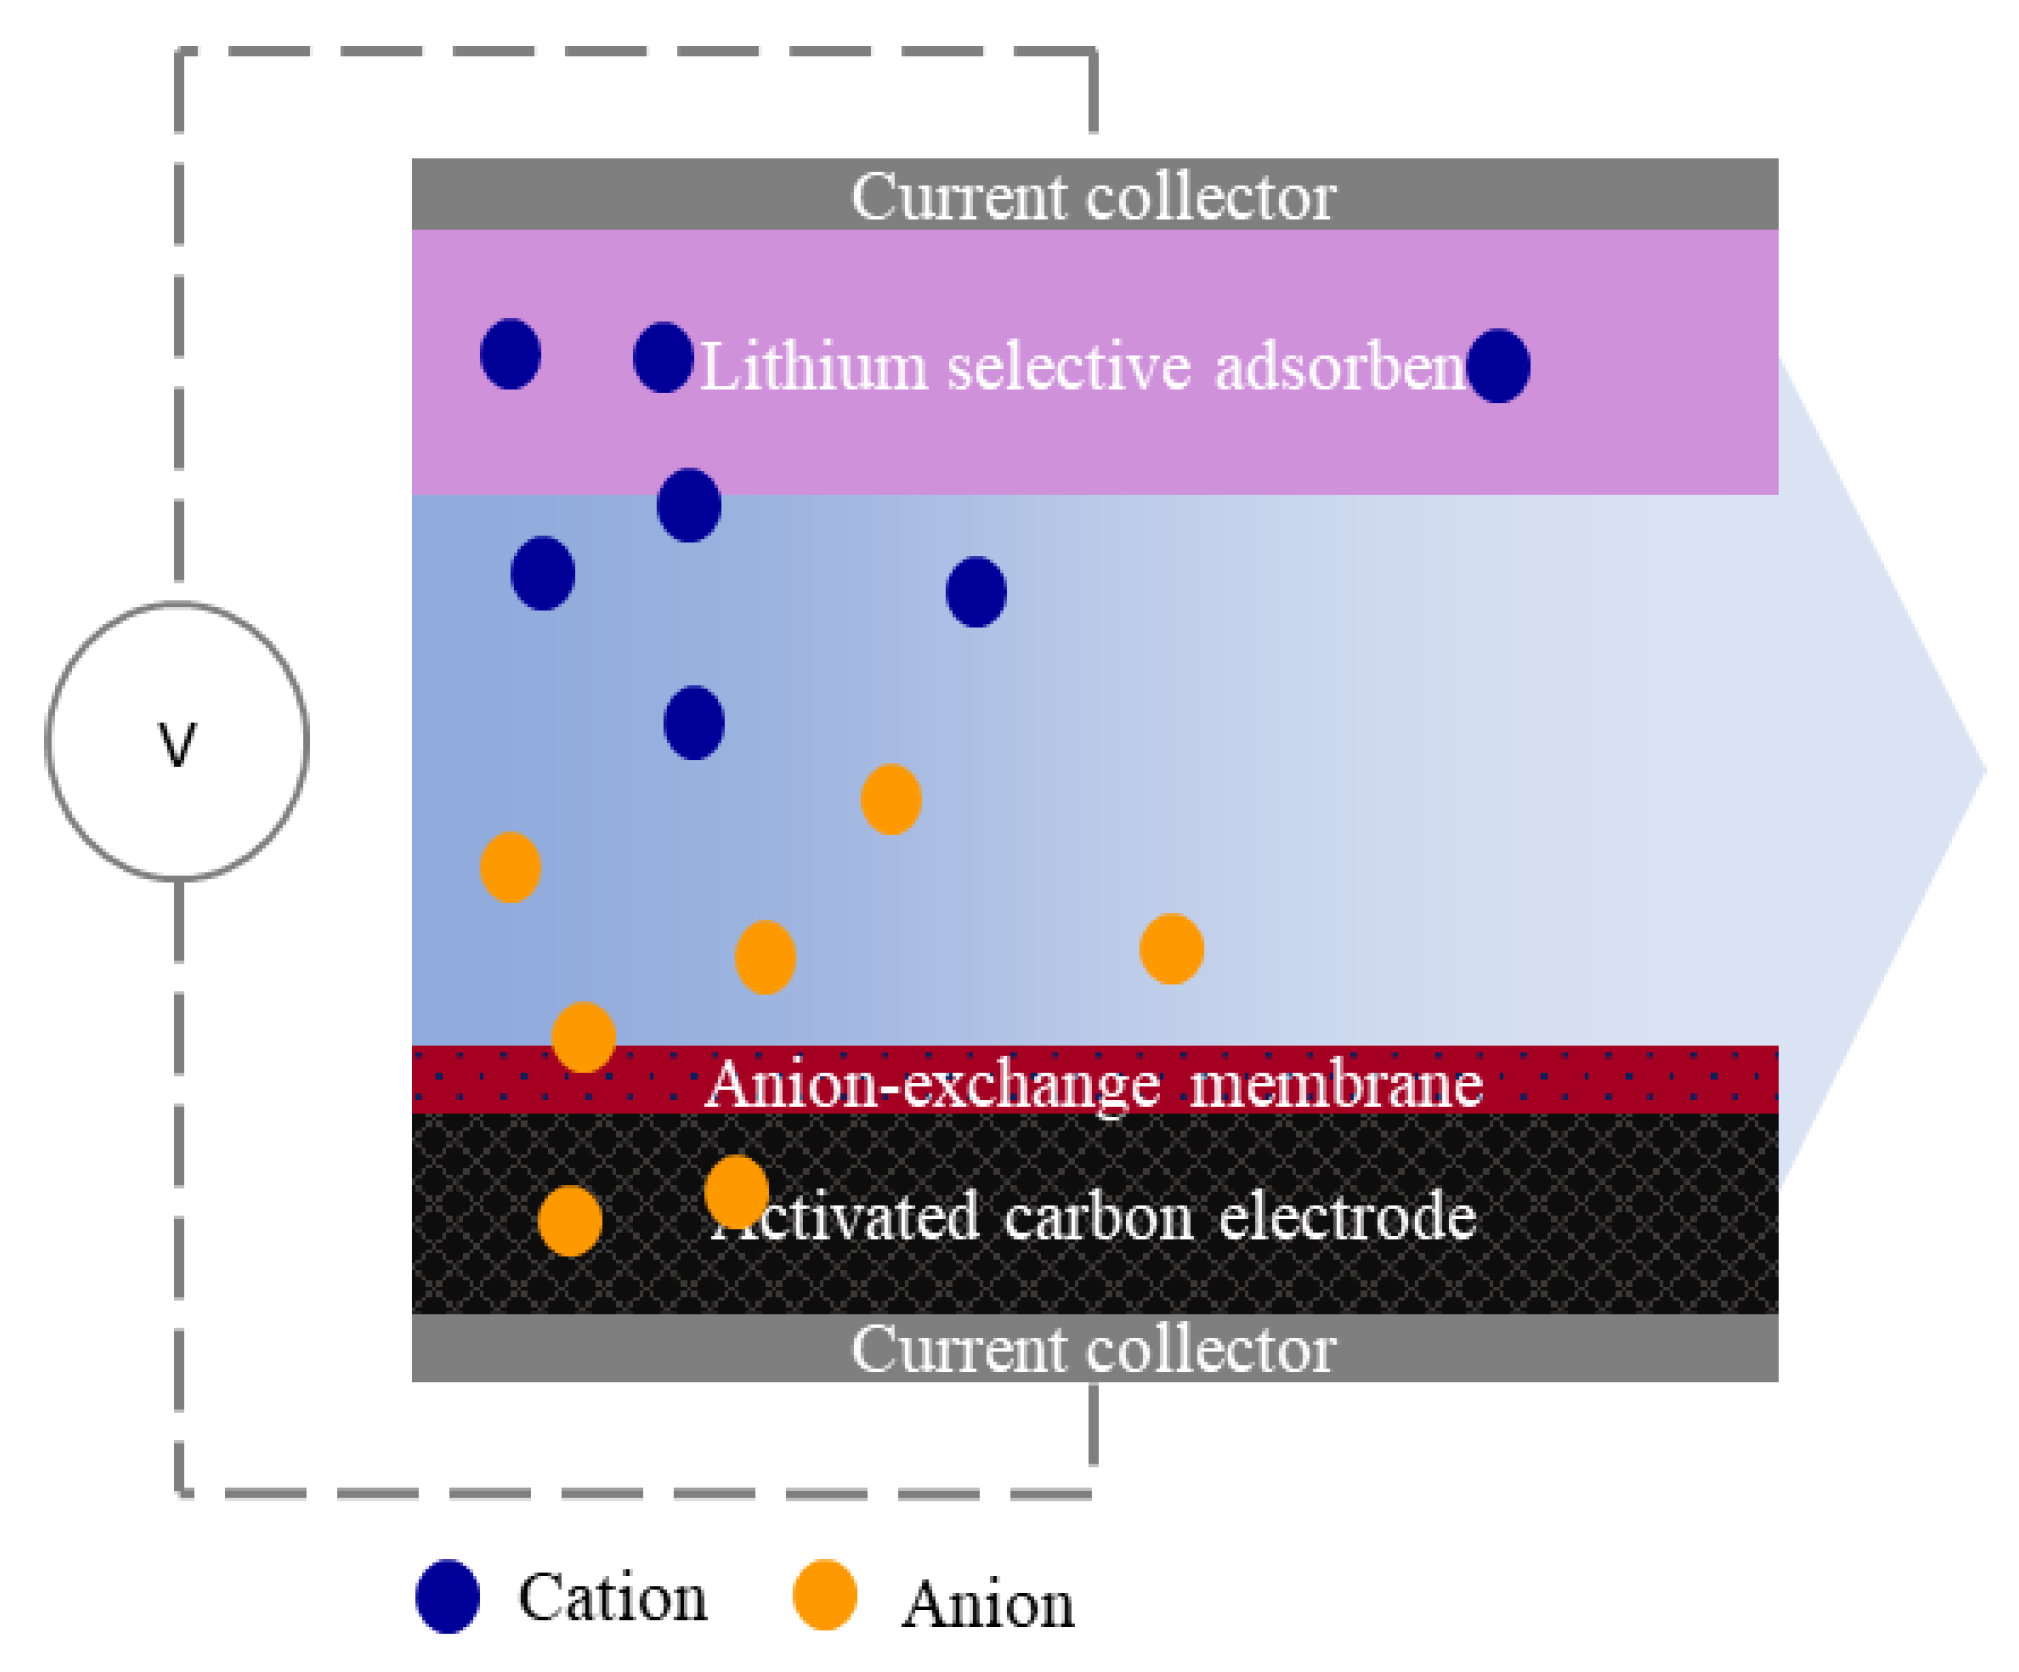
HCDI Configuration
HCDI Calculations
2.3.6. Theoretical Background of Anion Transportation
Pseudo-First-Order Kinetic Model
Pseudo-Second-Order Kinetic Model
Weber–Morris Intraparticle Diffusion Model
Elovich Model
Temkin Model
Harkins–Jura Model
3. Results and Discussion
3.1. Membrane Characterization
3.1.1. Membrane Morphology
3.1.2. Membrane Chemistry
3.1.3. Surface Energetics
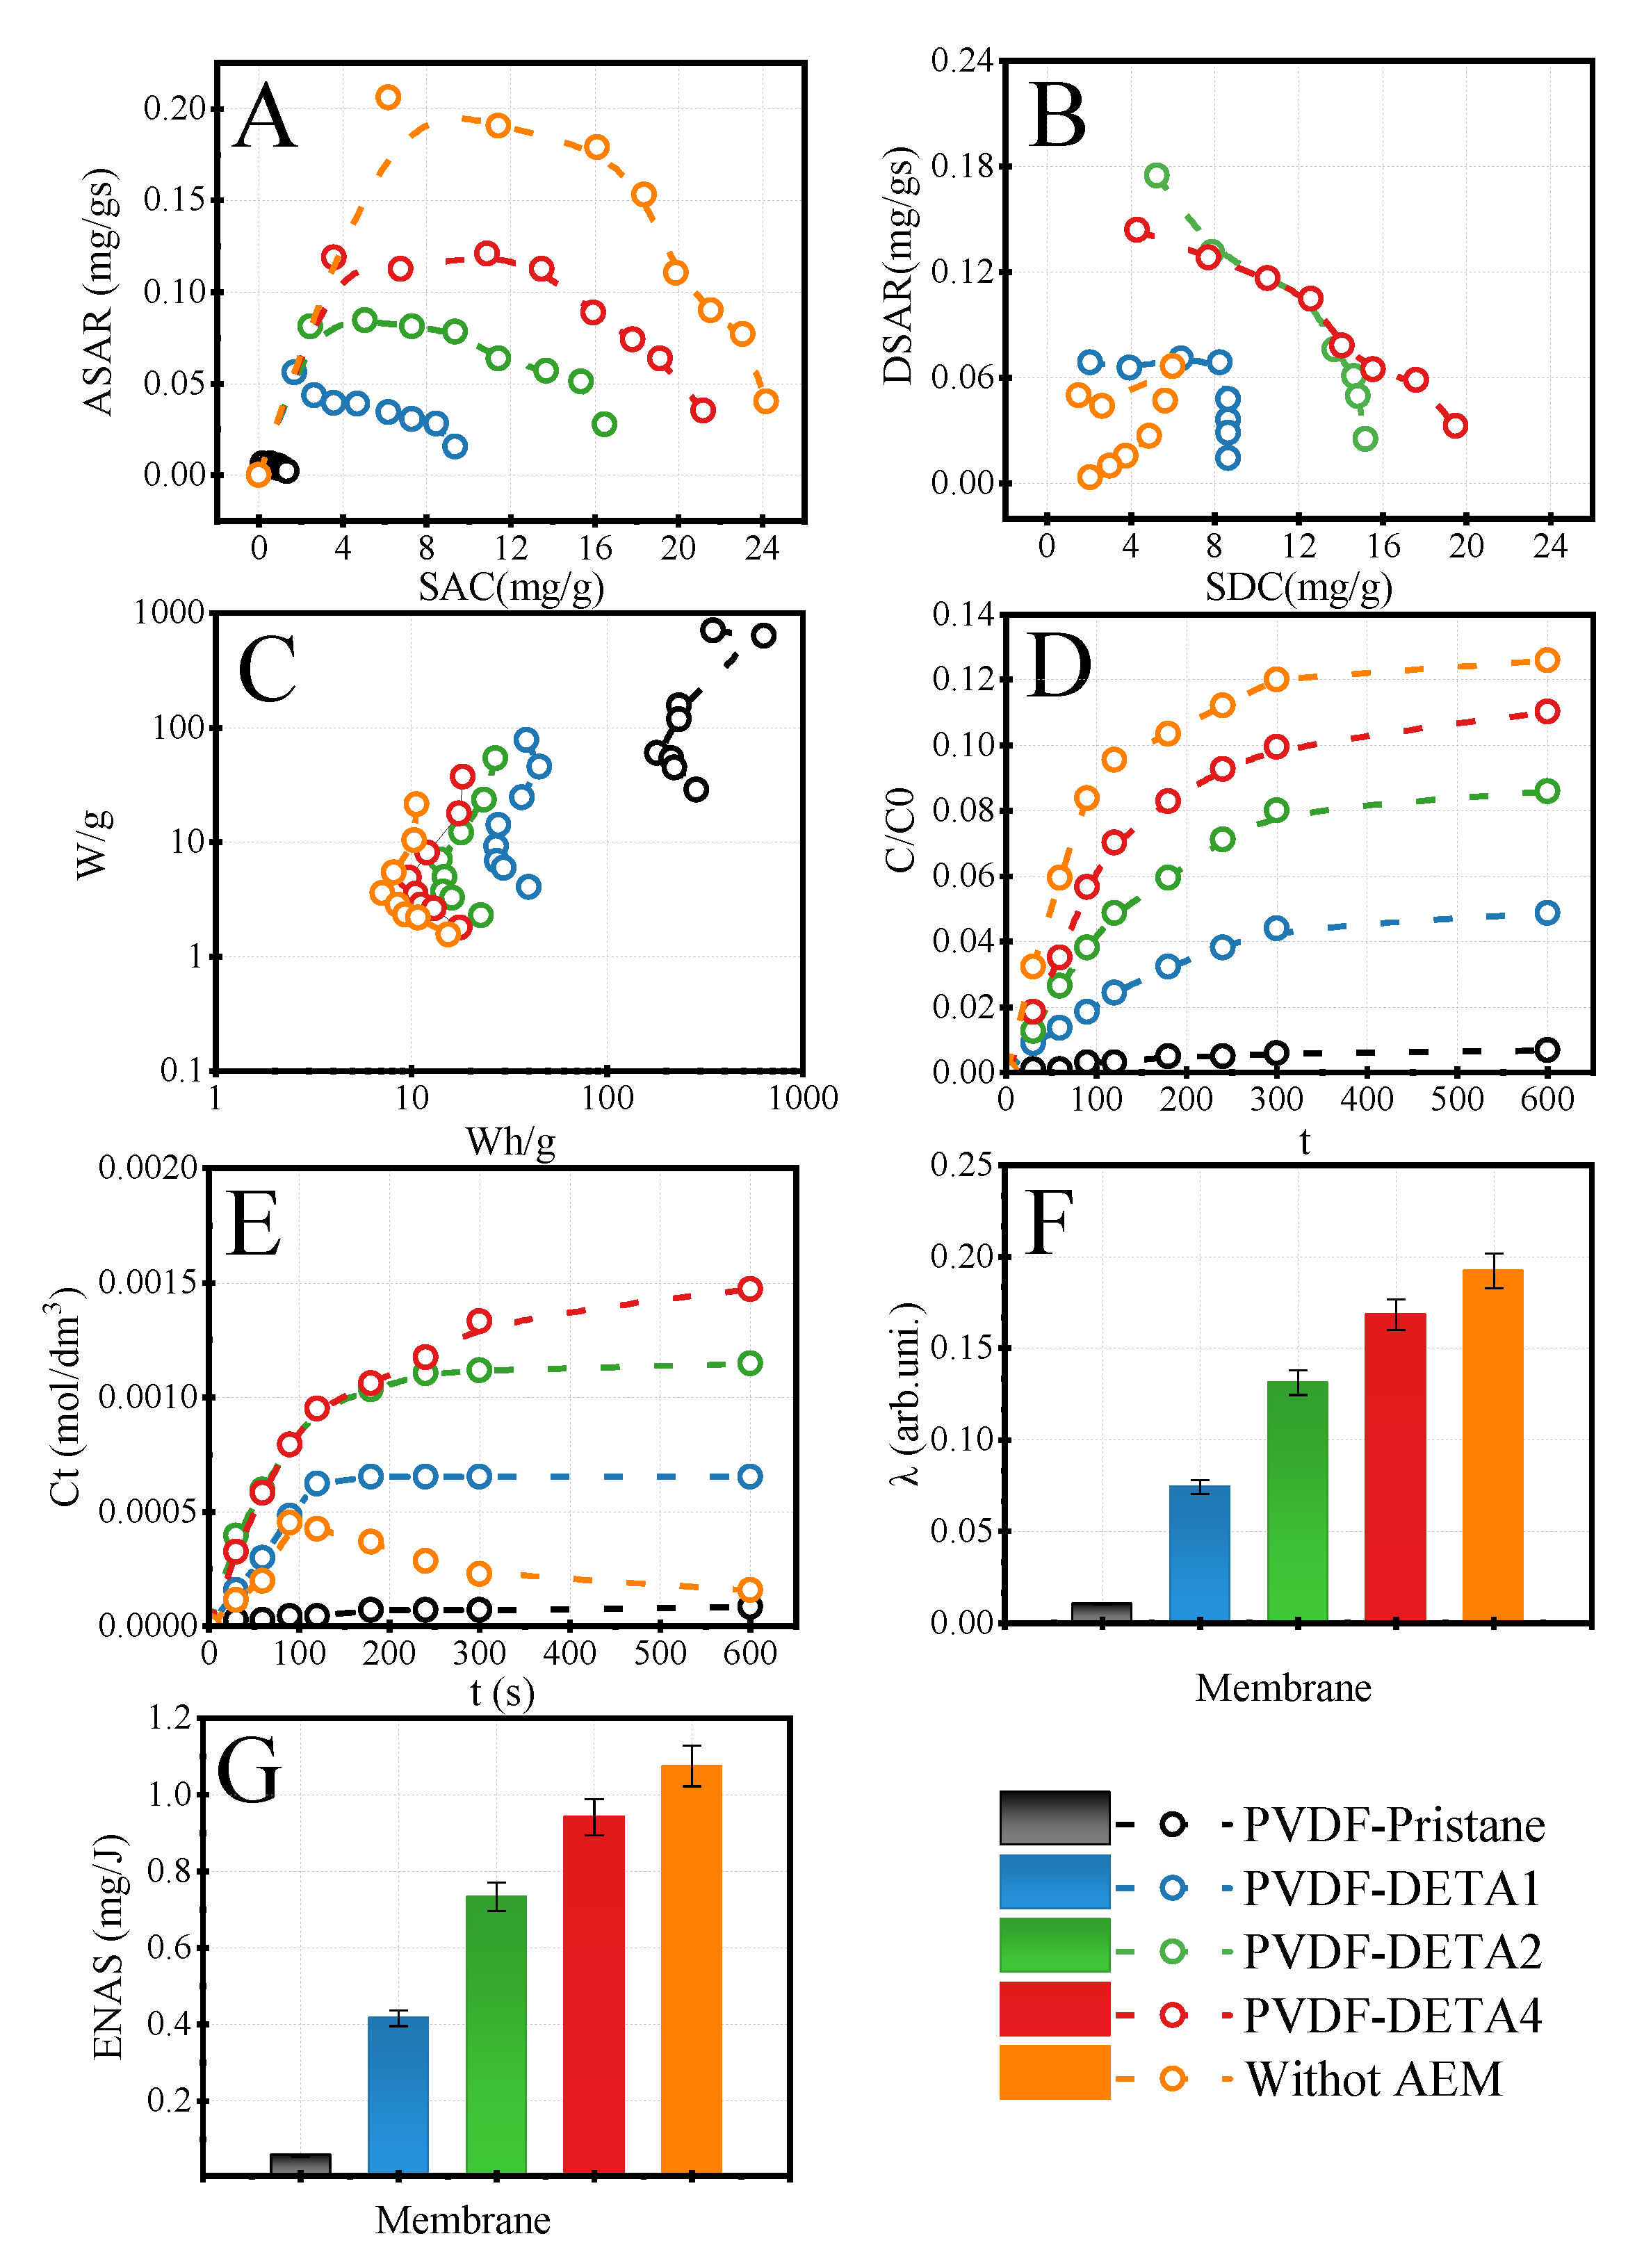
3.2. The Concentration of Lithium Salt by HCDI
3.2.1. Selection of PVDF-DETA Membrane
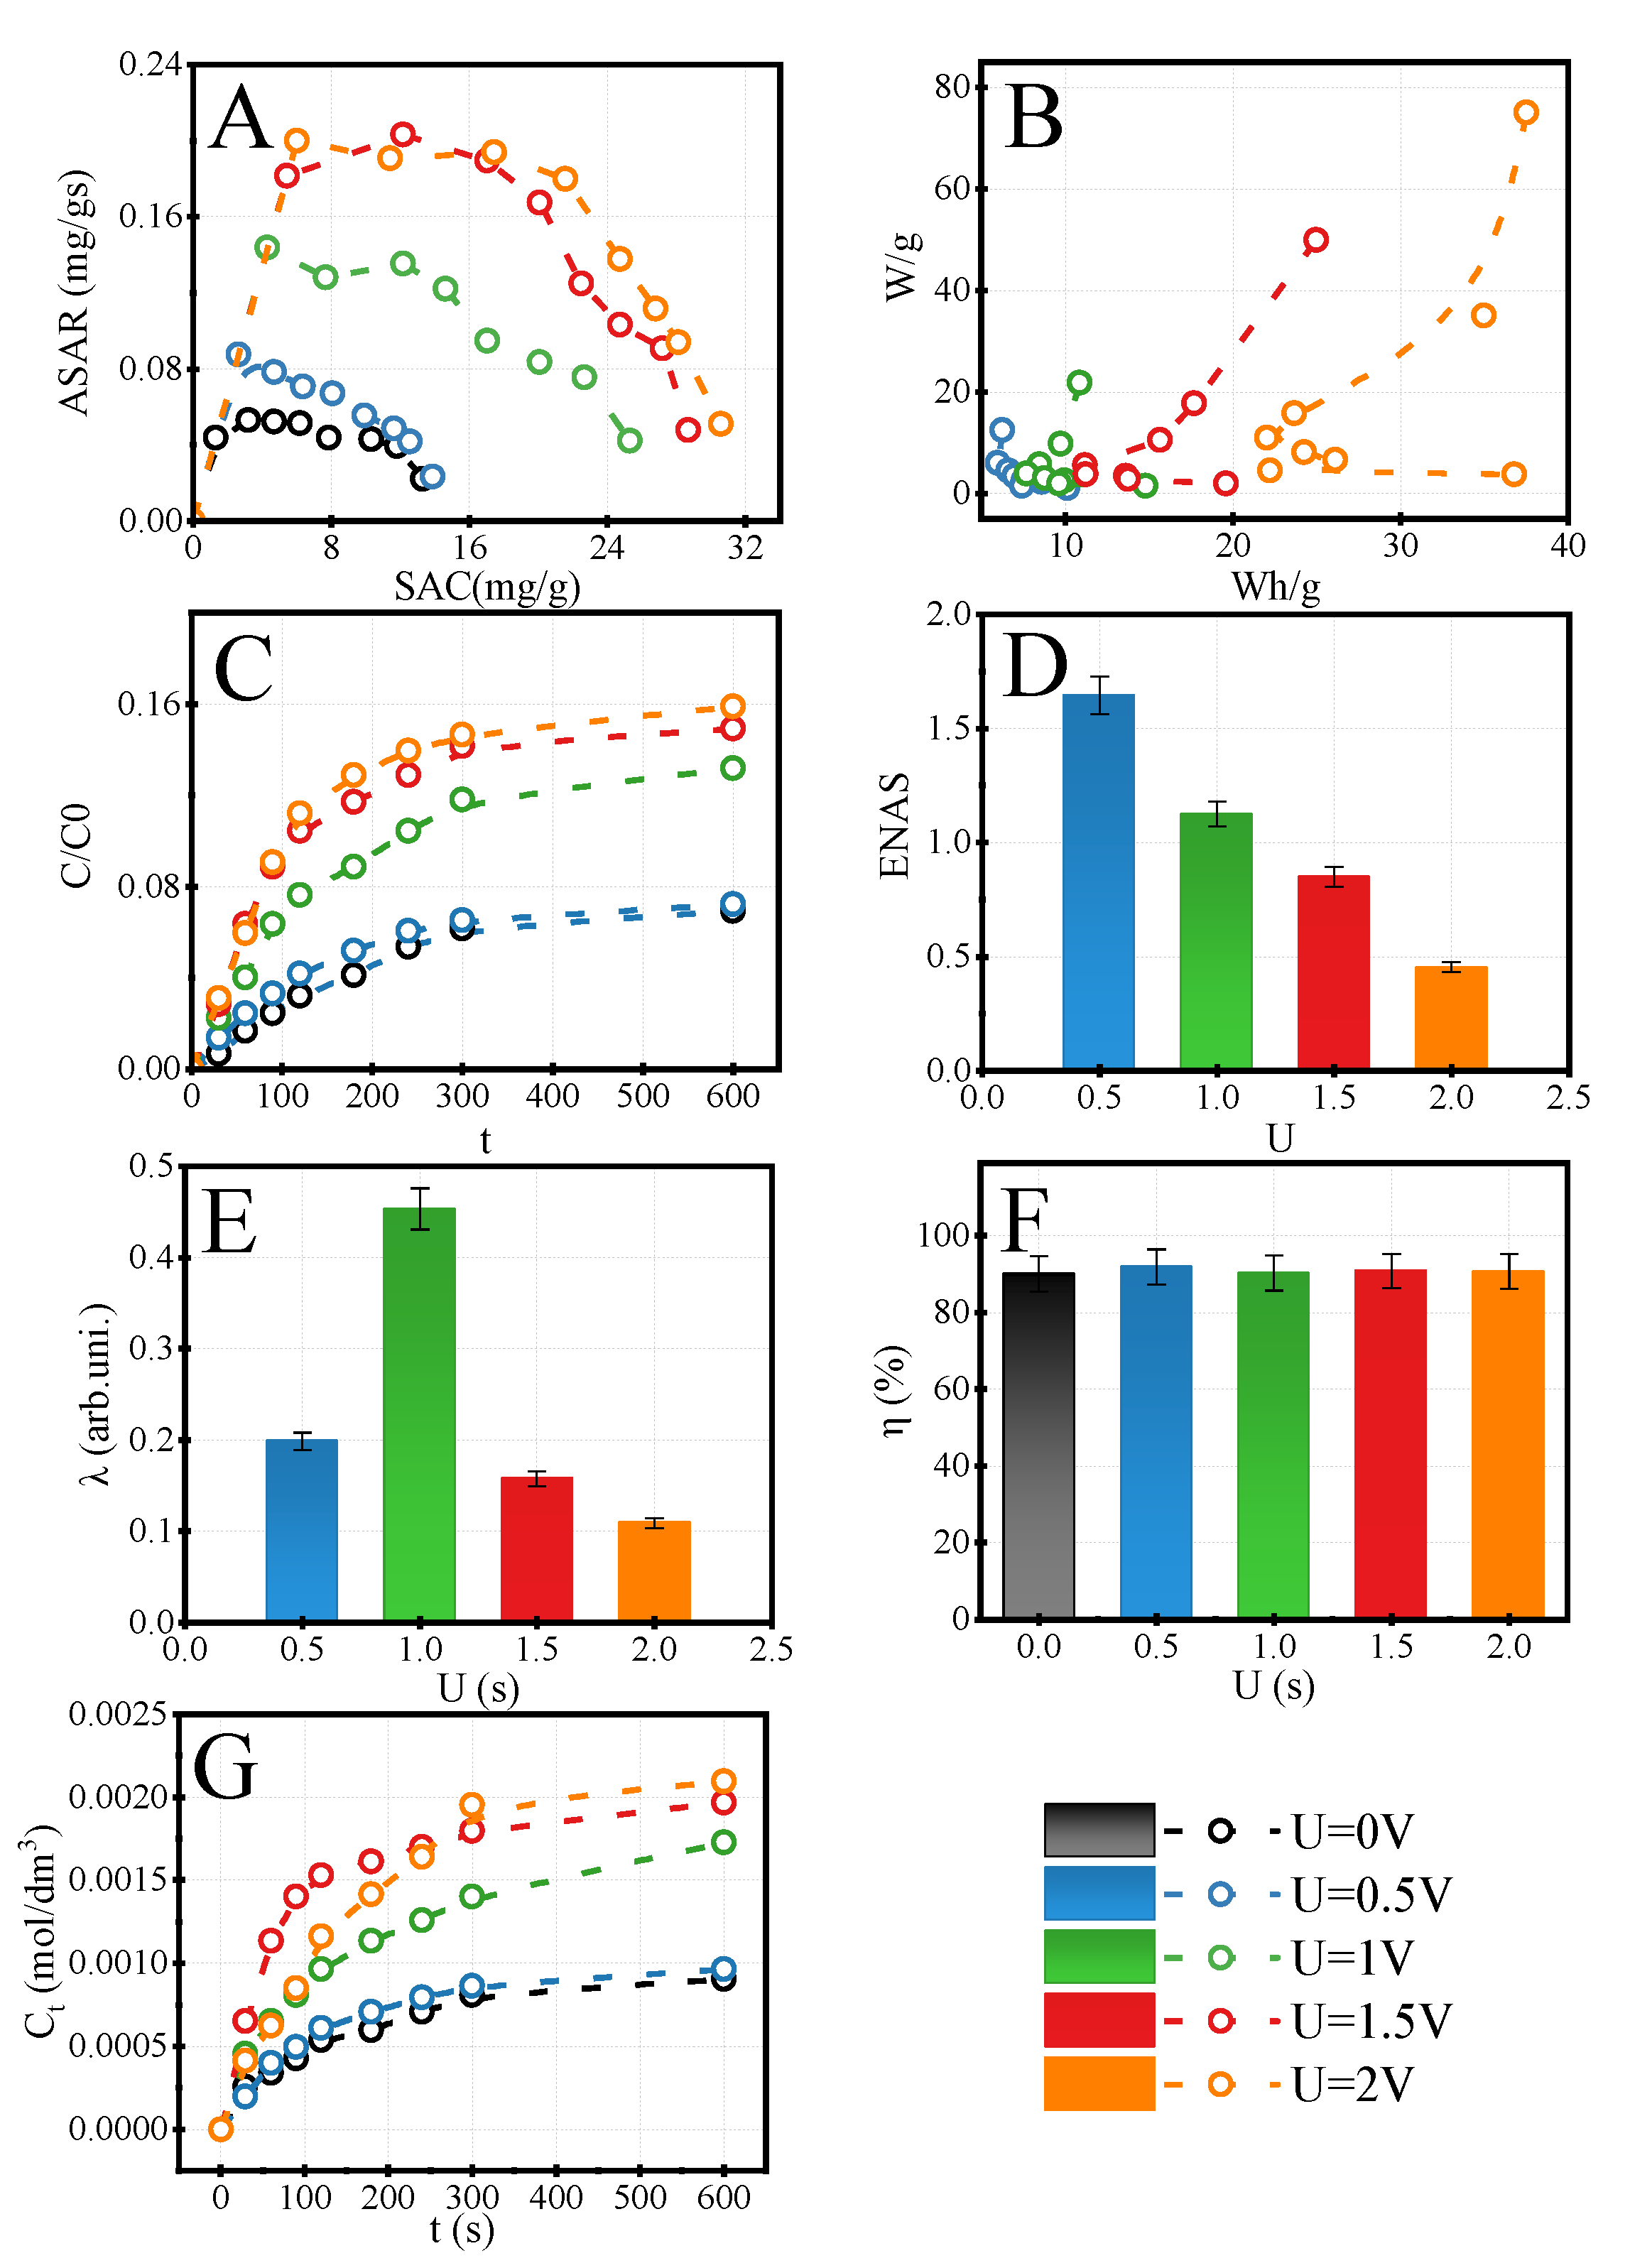
3.2.2. Selection of HCDI Voltage Conditions
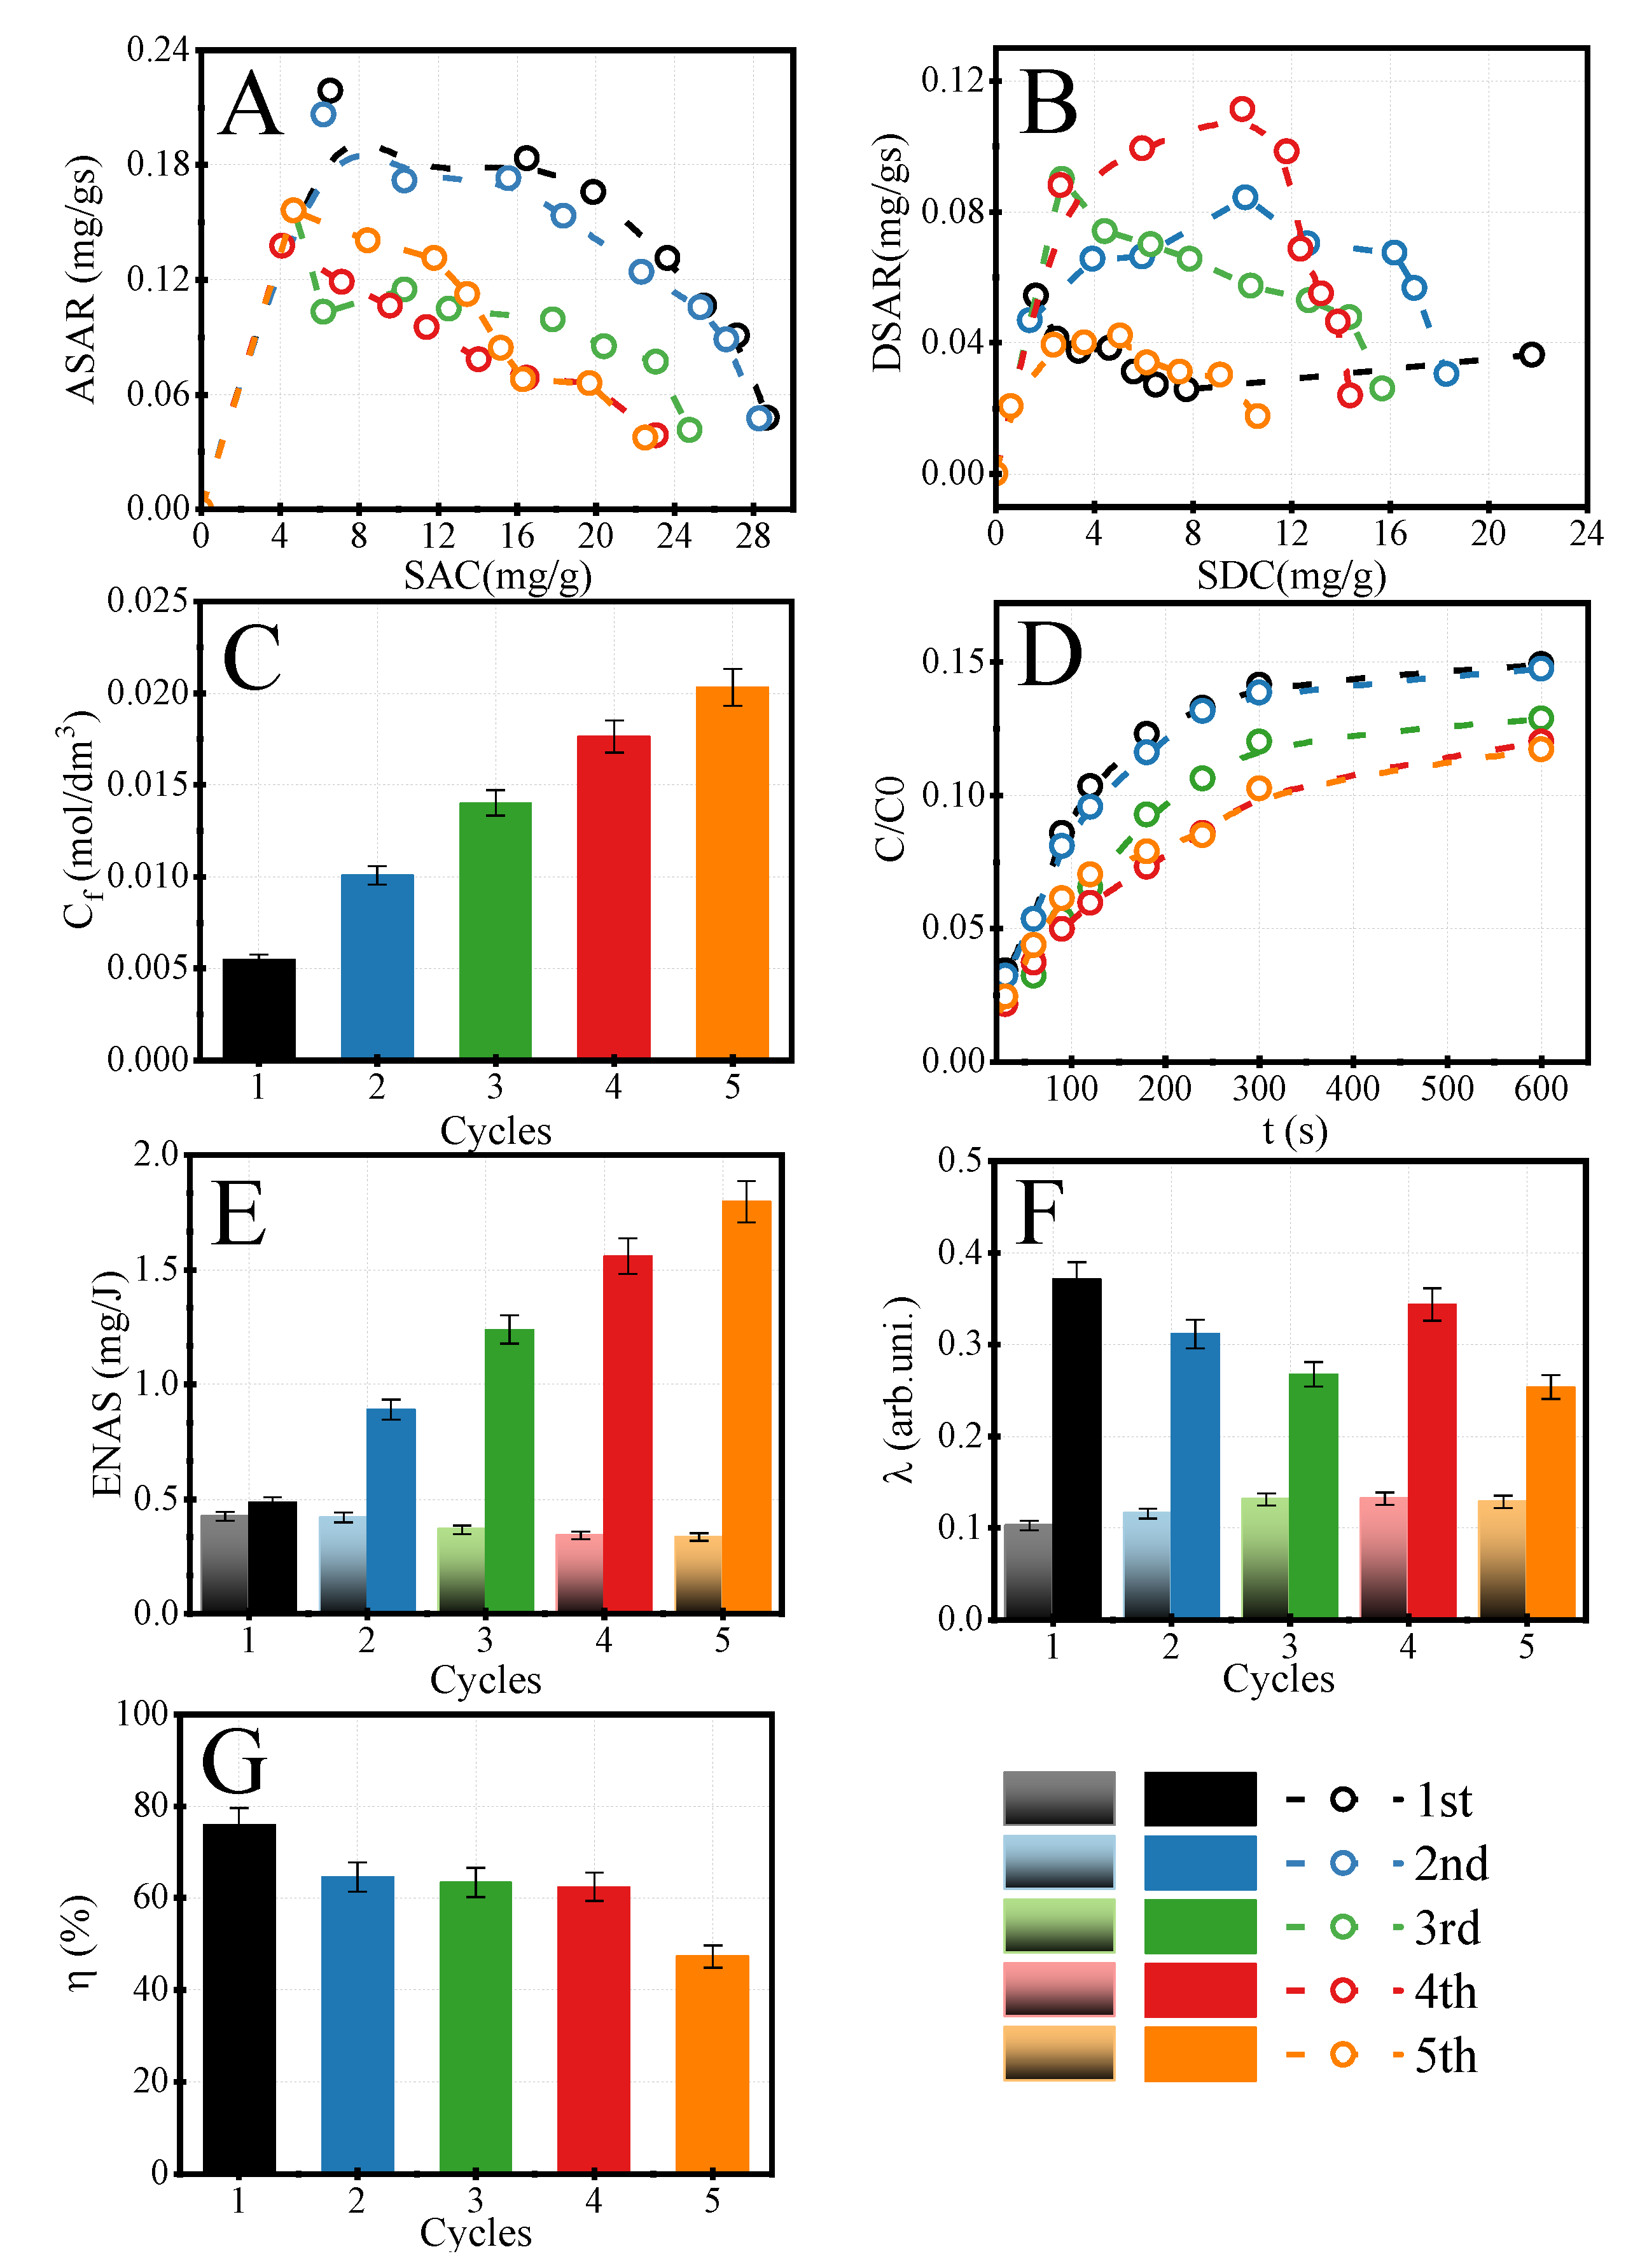
3.2.3. The Concentration of LiCl by HCDI
3.2.4. Comparison with Other Techniques
3.2.5. Transportation Phenomenon
4. Conclusions
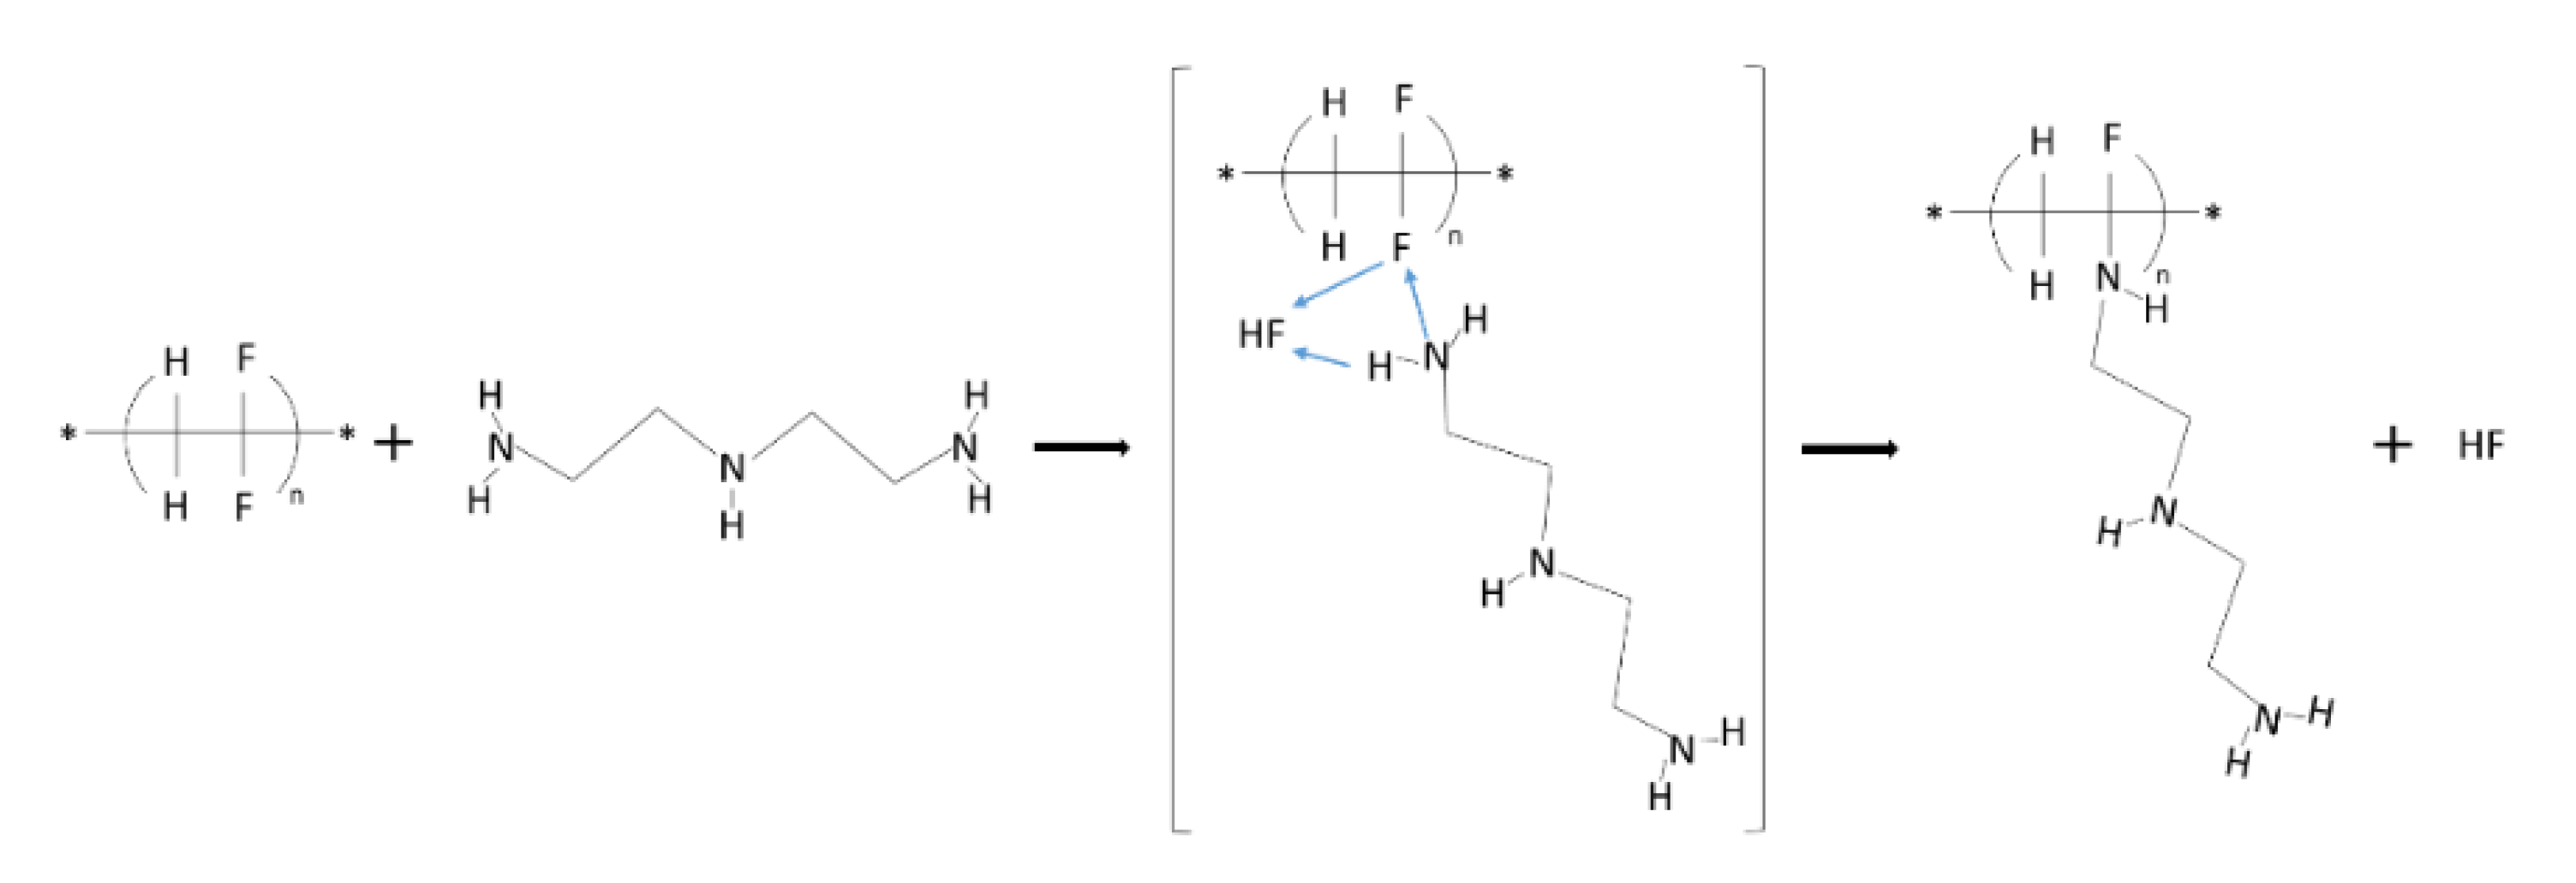
- The modification of PVDF films by DETA runs according to Michael addition reaction and leads to the creation excellent anion exchange membrane with a high amount of chloride anions transportation.
- The best chemical and transportation properties were detected for PVDF modified by DETA by four days.
- The PVDF-DETA4 membrane is suitable to block the co-ions effect during the desorption step and allow to reach the SAC around 30 mg/g.
- The PVDF-DETA4 membrane allows performing the desorption step with 90% of efficiency.
- By applying the PVDF-DETA4 membrane, it is possible to concentrate the LiCl with four times the factor.
- Based on adsorption kinetics and isotherms, the PVDF-DETA4 exhibits the enhanced transportation of chlorides compared to nitrates, sodium, and lithium cations, which directly state the anion exchange ability of the developed membrane.
Author Contributions
Funding
Institutional Review Board Statement
Informed Consent Statement
Data Availability Statement
Acknowledgments
Conflicts of Interest
References
- Hassanvand, A.; Chen, G.Q.; Webley, P.A.; Kentish, S.E. Improvement of MCDI operation and design through experiment and modelling: Regeneration with brine and optimum residence time. Desalination 2017, 417, 36–51. [Google Scholar] [CrossRef] [Green Version]
- Ali, A.; Quist-Jensen, C.A.; Jørgensen, M.K.; Siekierka, A.; Christensen, M.L.; Bryjak, M.; Hélix-Nielsen, C.; Drioli, E. A review of membrane crystallization, forward osmosis and membrane capacitive deionization for liquid mining. Resour. Conserv. Recycl. 2021, 168, 105273. [Google Scholar] [CrossRef]
- Siekierka, A.; Kujawa, J.; Kujawski, W.; Bryjak, M. Lithium dedicated adsorbent for the preparation of electrodes useful in the ion pumping method. Sep. Purif. Technol. 2018, 194, 231–238. [Google Scholar] [CrossRef]
- Siekierka, A. Lithium iron manganese oxide as an adsorbent for capturing lithium ions in hybrid capacitive deionization with different electrical modes. Sep. Purif. Technol. 2019, 236, 116234. [Google Scholar] [CrossRef]
- Porada, S.; Shrivastava, A.; Bukowska, P.; Biesheuvel, P.M.; Smith, K.C. Nickel Hexacyanoferrate Electrodes for Continuous Cation Intercalation Desalination of Brackish Water. Electrochim. Acta 2017, 255, 369–378. [Google Scholar] [CrossRef] [Green Version]
- Kim, S.; Lee, J.; Kim, S.; Kim, S.; Yoon, J. Electrochemical Lithium Recovery with a LiMn2O4–Zinc Battery System using Zinc as a Negative Electrode. Energy Technol. 2018, 6, 340–344. [Google Scholar] [CrossRef]
- Lee, D.H.; Ryu, T.; Shin, J.; Ryu, J.C.; Chung, K.S.; Kim, Y.H. Selective lithium recovery from aqueous solution using a modified membrane capacitive deionization system. Hydrometallurgy 2017, 173, 283–288. [Google Scholar] [CrossRef]
- Lado, J.J.; Pérez-Roa, R.E.; Wouters, J.J.; Tejedor-Tejedor, M.I.; Federspill, C.; Ortiz, J.M.; Anderson, M.A. Removal of nitrate by asymmetric capacitive deionization. Sep. Purif. Technol. 2017, 183, 145–152. [Google Scholar] [CrossRef] [Green Version]
- Lee, J.; Kim, S.; Kim, C.; Yoon, J. Hybrid capacitive deionization to enhance the desalination performance of capacitive techniques. Energy Environ. Sci. 2014, 7, 3683–3689. [Google Scholar] [CrossRef]
- Siekierka, A.; Bryjak, M.; Wolska, J. The use of activated carbon modified with polypyrrole as a supporting electrode for lithium ions adsorption in capacitive deionization. Desalin. Water Treat. 2017, 64, 251–254. [Google Scholar] [CrossRef]
- Porada, S.; Zhao, R.; van der Wal, A.; Presser, V.; Biesheuvel, P.M. Review on the science and technology of water desalination by capacitive deionization. Prog. Mater. Sci. 2013, 58, 1388–1442. [Google Scholar] [CrossRef] [Green Version]
- Xin, Y.; Tian, H.; Guo, C.; Li, X.; Sun, H.; Wang, P.; Lin, J.; Wang, S.; Wang, C. PVDF tactile sensors for detecting contact force and slip: A review. Ferroelectrics 2016, 504, 31–45. [Google Scholar] [CrossRef]
- Kang, G.D.; Cao, Y.M. Application and modification of poly(vinylidene fluoride) (PVDF) membranes—A review. J. Memb. Sci. 2014, 463, 145–165. [Google Scholar] [CrossRef]
- Dias, A.J.; McCarthy, T.J. Dehydrofluorination of poly(vinylidene fluoride) in dimethylformamide solution: Synthesis of an operationally soluble semiconducting polymer. J. Polym. Sci. Polym. Chem. Ed. 1985, 23, 1057–1061. [Google Scholar] [CrossRef]
- Poon, T.; Mundy, B.P.; Shattuck, T.W. The Michael Reaction. J. Chem. Educ. 2002, 79, 264. [Google Scholar] [CrossRef]
- Siekierka, A.; Wolska, J.; Bryjak, M.; Kujawski, W. Anion exchange membranes in lithium extraction by means of capacitive deionization system. Desalin. Water Treat. 2017, 75, 331–341. [Google Scholar] [CrossRef] [Green Version]
- Azizian, S. Kinetic models of sorption: A theoretical analysis. J. Colloid Interface Sci. 2004, 276, 47–52. [Google Scholar] [CrossRef]
- Simonin, J.P. On the comparison of pseudo-first order and pseudo-second order rate laws in the modeling of adsorption kinetics. Chem. Eng. J. 2016, 300, 254–263. [Google Scholar] [CrossRef] [Green Version]
- Siekierka, A. Preparation of electrodes for hybrid capacitive deionization and its influence on the adsorption behaviour. Sep. Sci. Technol. 2019, 55, 2238–2249. [Google Scholar] [CrossRef]
- Wu, F.C.; Tseng, R.L.; Juang, R.S. Characteristics of Elovich equation used for the analysis of adsorption kinetics in dye-chitosan systems. Chem. Eng. J. 2009, 150, 366–373. [Google Scholar] [CrossRef]
- Eriksson, M.; Lundström, I.; Ekedahl, L.-G. A model of the Temkin isotherm behavior for hydrogen adsorption at Pd–SiO2 interfaces. J. Appl. Phys. 1997, 82, 3143. [Google Scholar] [CrossRef]
- Erdogan, F.O. Freundlich, langmuir, temkin, dr and harkins-jura isotherm studies on the adsorption of CO2 on various porous adsorbents. Int. J. Chem. React. Eng. 2019, 17, 20180134. [Google Scholar] [CrossRef]
- Kushwaha, A.K.; Gupta, N.; Chattopadhyaya, M.C. Removal of cationic methylene blue and malachite green dyes from aqueous solution by waste materials of Daucus carota. J. Saudi Chem. Soc. 2014, 18, 200–207. [Google Scholar] [CrossRef]
- Robati, D. Pseudo-second-order kinetic equations for modeling adsorption systems for removal of lead ions using multi-walled carbon nanotube. J. Nanostruct. Chem. 2013, 3, 55. [Google Scholar] [CrossRef] [Green Version]
- Riahi, K.; Chaabane, S.; Thayer, B. Ben A kinetic modeling study of phosphate adsorption onto Phoenix dactylifera L. date palm fibers in batch mode. J. Saudi Chem. Soc. 2017, 21, S143–S152. [Google Scholar] [CrossRef] [Green Version]
- Chaudhry, S.A.; Zaidi, Z.; Siddiqui, S.I. Isotherm, kinetic and thermodynamics of arsenic adsorption onto Iron-Zirconium Binary Oxide-Coated Sand (IZBOCS): Modelling and process optimization. J. Mol. Liq. 2017, 229, 230–240. [Google Scholar] [CrossRef]
- Ayawei, N.; Ebelegi, A.N.; Wankasi, D. Modelling and Interpretation of Adsorption Isotherms. J. Chem. 2017, 2017, 3039817. [Google Scholar] [CrossRef]
- Hernández-Monje, D.; Giraldo, L.; Moreno-Piraján, J.C. Study of Hexane Adsorption on Activated Carbons with Differences in Their Surface Chemistry. Molecules 2018, 23, 476. [Google Scholar] [CrossRef] [PubMed] [Green Version]
- Taguet, A.; Ameduri, B.; Boutevin, B. Crosslinking of Vinylidene Fluoride-Containing Fluoropolymers. Adv. Polym. Sci. 2005, 184, 127–211. [Google Scholar] [CrossRef] [Green Version]
- Pham, M.T.; Nishihama, S.; Yoshizuka, K. Concentration of lithium by forward osmosis. Hydrometallurgy 2020, 197, 105485. [Google Scholar] [CrossRef]
- Wagh, P.; Islam, S.Z.; Deshmane, V.G.; Gangavarapu, P.; Poplawsky, J.; Yang, G.; Sacci, R.; Evans, S.F.; Mahajan, S.; Paranthaman, M.P.; et al. Fabrication and Characterization of Composite Membranes for the Concentration of Lithium Containing Solutions Using Forward Osmosis. Adv. Sustain. Syst. 2020, 4, 2000165. [Google Scholar] [CrossRef]
- Cha-umpong, W.; Li, Q.; Razmjou, A.; Chen, V. Concentrating brine for lithium recovery using GO composite pervaporation membranes. Desalination 2021, 500, 114894. [Google Scholar] [CrossRef]
- Paredes, C.; Rodríguez de San Miguel, E. Selective lithium extraction and concentration from diluted alkaline aqueous media by a polymer inclusion membrane and application to seawater. Desalination 2020, 487, 114500. [Google Scholar] [CrossRef]
- Siekierka, A.; Bryjak, M. Novel anion exchange membrane for concentration of lithium salt in hybrid capacitive deionization. Desalination 2019, 452, 279–289. [Google Scholar] [CrossRef]
- Revellame, E.D.; Fortela, D.L.; Sharp, W.; Hernandez, R.; Zappi, M.E. Adsorption kinetic modeling using pseudo-first order and pseudo-second order rate laws: A review. Clean. Eng. Technol. 2020, 1, 100032. [Google Scholar] [CrossRef]


| General Parameters of HCDI | |||
|---|---|---|---|
| Acell | Electrode geometric surface area | 36 | cm2 |
| Φv | Water flow rate | 6 | dm3/h |
| T | Temperature | 25 | °C |
| Lch | Thickness flow channel (100% open) | 200 | µm |
| M | Number of electrodes calls | 1 | pair |
| Lel | Electrode thickness | 80 | µm |
| Process | Type of Membrane | The Ratio of Li Concentration Increasing [%] | Time of Process [h] | Rate of Concentration [g/h] | Ref. |
|---|---|---|---|---|---|
| Forward osmosis | CTA membrane | 410 | 30 | 0.41 | [30] |
| Forward osmosis | Composite PVDF membrane | 486 | 550 | 0.32 | [31] |
| Pervaporation | PP/GO membrane | 385 | 120 | 0.0035 | [32] |
| Dialysis | CTA/Cyanex 923 and LIX-54-100 | 387 | 30 | 0.21 | [33] |
| HCDI | PVDF-EDA24 | 700 | 1.6 | 0.18 | [34] |
| HCDI | PVDF-DETA4 | 400 | 0.16 | 0.53 | This study |
| Model | Chlorides | Nitrates | Sodium | Lithium | |
|---|---|---|---|---|---|
| Adsorption Kinetics | |||||
| PFO | qm (mg/g) | 121.4 | 40.4 | 2.20 | 3.50 |
| k1 | 0.0062 | 0.0014 | 0.001 | 0.0016 | |
| R2 | 0.963 | 0.943 | 0.658 | 0.888 | |
| PSO | qm (mg/g) | 123.8 | 73.5 | 4.76 | 5.37 |
| k2 | 0.0004 | 0.0012 | 0.2756 | 0.198 | |
| R2 | 0.968 | 0.909 | 0.987 | 0.934 | |
| WM | KID | 5.55 | 3.26 | 0.177 | 0.215 |
| C | −10.47 | −6.06 | 1.19 | 0.65 | |
| R2 | 0.984 | 0.969 | 0.844 | 0.943 | |
| Elovich | α | 7.16 | 4.19 | 1.61 | 1.02 |
| β | 0.058 | 0.098 | 1.53 | 1.40 | |
| R2 | 0.751 | 0.748 | 0.908 | 0.828 | |
| Adsorption isotherms | |||||
| Temkin | AT | 245.6 | 470.4 | 493.3 | 486.2 |
| bT | 128.6 | 223.6 | 1121 | 1090 | |
| R2 | 0.692 | 0.700 | 0.952 | 0.914 | |
| Harkin-Jura | AHJ | −0.128 | −0.016 | −0.004 | −0.004 |
| BHJ | −0.150 | −0.072 | 0.002 | 0.015 | |
| R2 | 0.362 | 0.388 | 0.758 | 0.613 | |
Publisher’s Note: MDPI stays neutral with regard to jurisdictional claims in published maps and institutional affiliations. |
© 2022 by the authors. Licensee MDPI, Basel, Switzerland. This article is an open access article distributed under the terms and conditions of the Creative Commons Attribution (CC BY) license (https://creativecommons.org/licenses/by/4.0/).
Share and Cite
Siekierka, A.; Bryjak, M. Modified Poly(vinylidene fluoride) by Diethylenetriamine as a Supported Anion Exchange Membrane for Lithium Salt Concentration by Hybrid Capacitive Deionization. Membranes 2022, 12, 103. https://doi.org/10.3390/membranes12020103
Siekierka A, Bryjak M. Modified Poly(vinylidene fluoride) by Diethylenetriamine as a Supported Anion Exchange Membrane for Lithium Salt Concentration by Hybrid Capacitive Deionization. Membranes. 2022; 12(2):103. https://doi.org/10.3390/membranes12020103
Chicago/Turabian StyleSiekierka, Anna, and Marek Bryjak. 2022. "Modified Poly(vinylidene fluoride) by Diethylenetriamine as a Supported Anion Exchange Membrane for Lithium Salt Concentration by Hybrid Capacitive Deionization" Membranes 12, no. 2: 103. https://doi.org/10.3390/membranes12020103
APA StyleSiekierka, A., & Bryjak, M. (2022). Modified Poly(vinylidene fluoride) by Diethylenetriamine as a Supported Anion Exchange Membrane for Lithium Salt Concentration by Hybrid Capacitive Deionization. Membranes, 12(2), 103. https://doi.org/10.3390/membranes12020103