
A Summary of Practical Considerations for the Application of the Steric Exclusion Chromatography for the Purification of the Orf Viral Vector

 , ,
, , 
Abstract
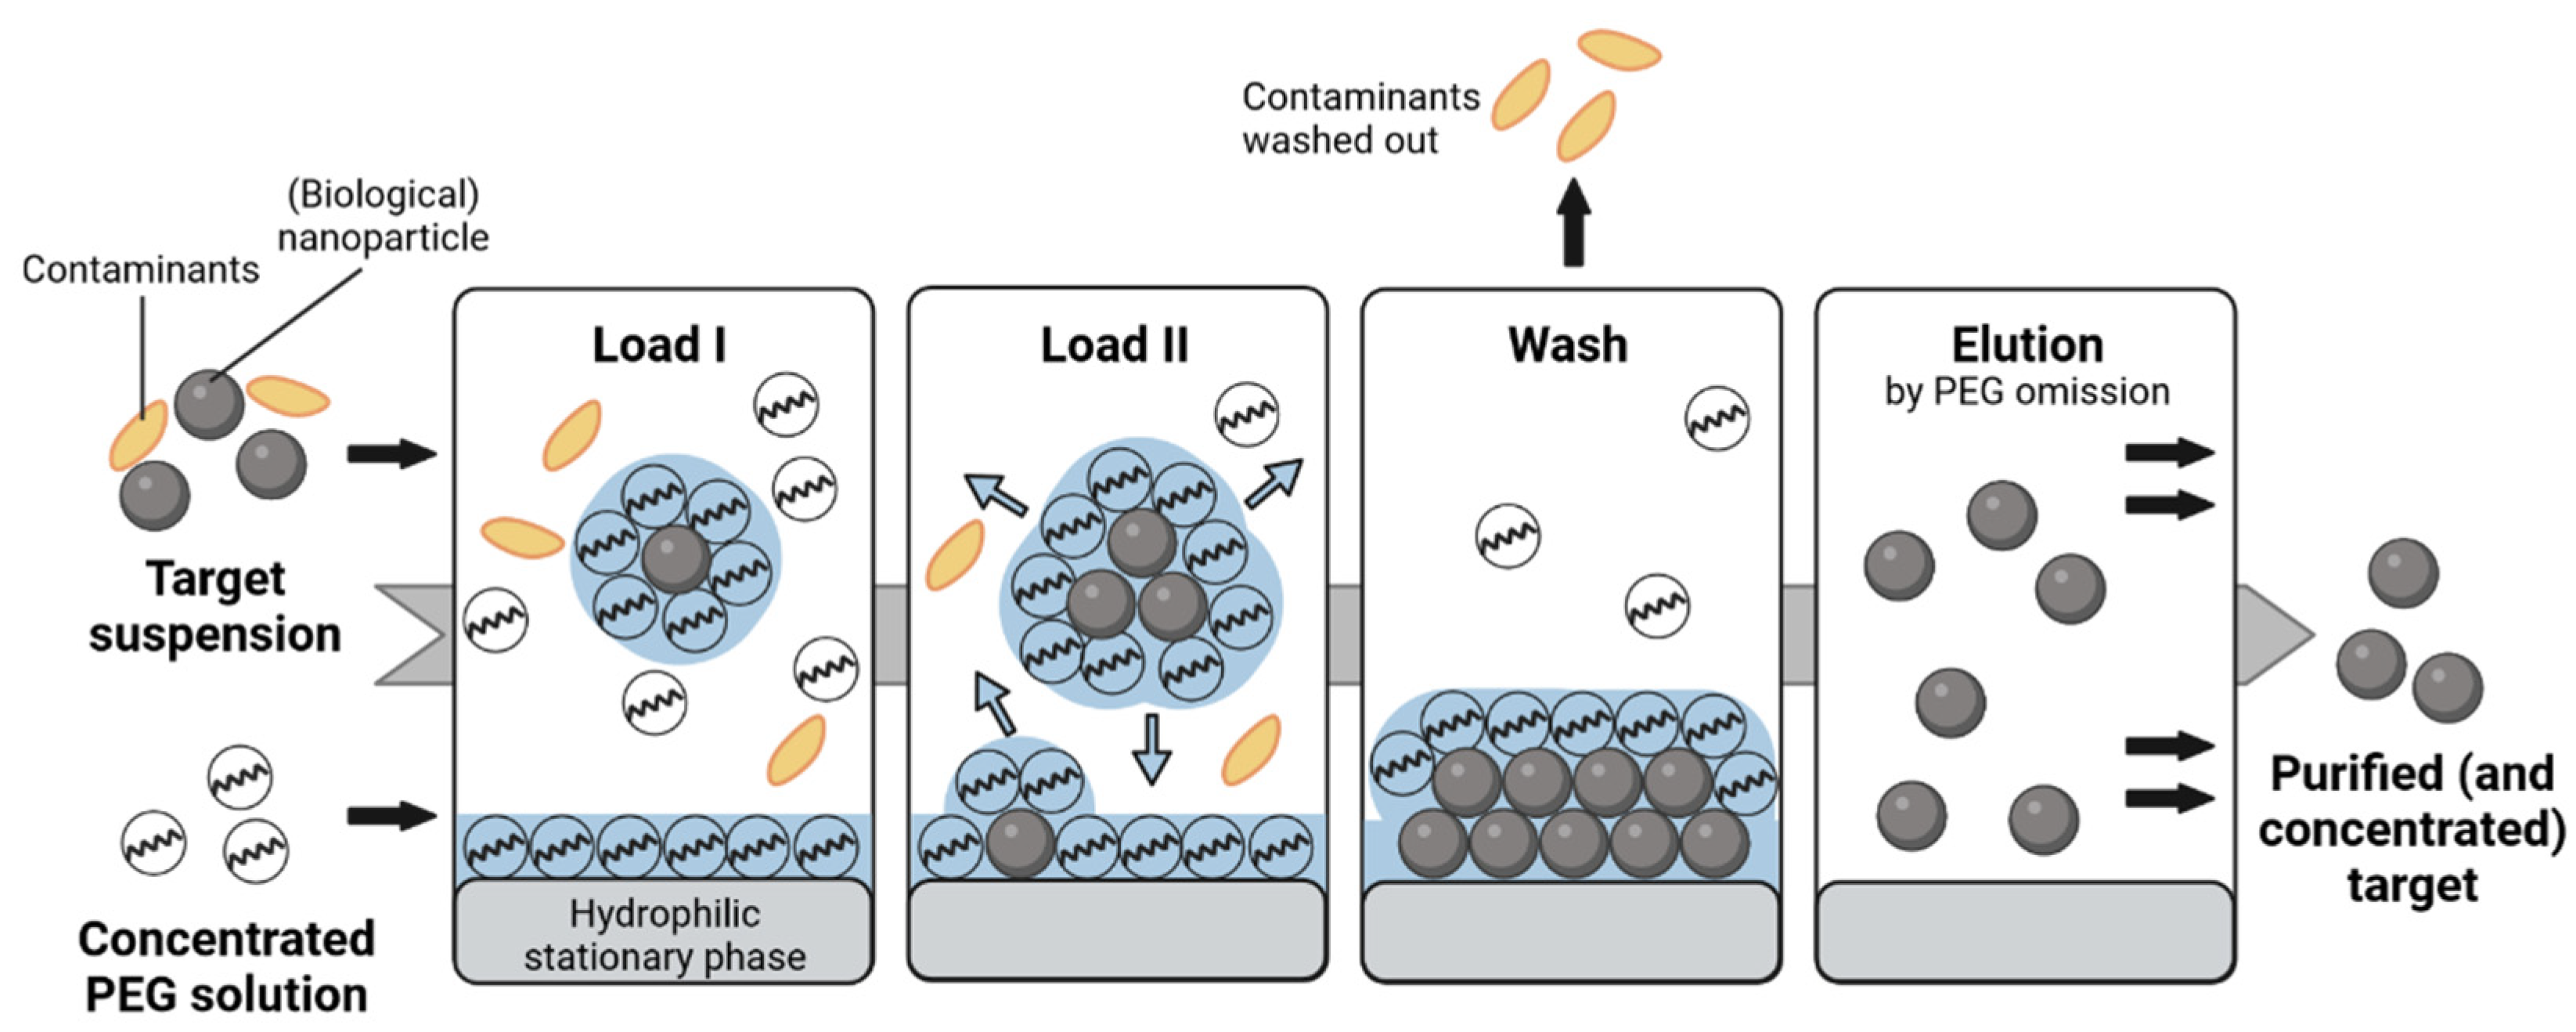
1. Introduction
2. Materials and Methods
2.1. Preparation of Virus Stocks
2.2. SXC Application
2.3. ORFV Infectivity Titration
2.4. Size Measurements
2.5. Statistical Analysis
3. Results and Discussion
3.1. Influence of the SXC Loading Parameters on the ORFV Recoveries
3.1.1. PEG Concentration and Flow Rate
3.1.2. Incubation Time Using PEG6000
3.1.3. Incubation Time Using PEG8000
3.2. Variation of the Pore Size of the Stationary Phase
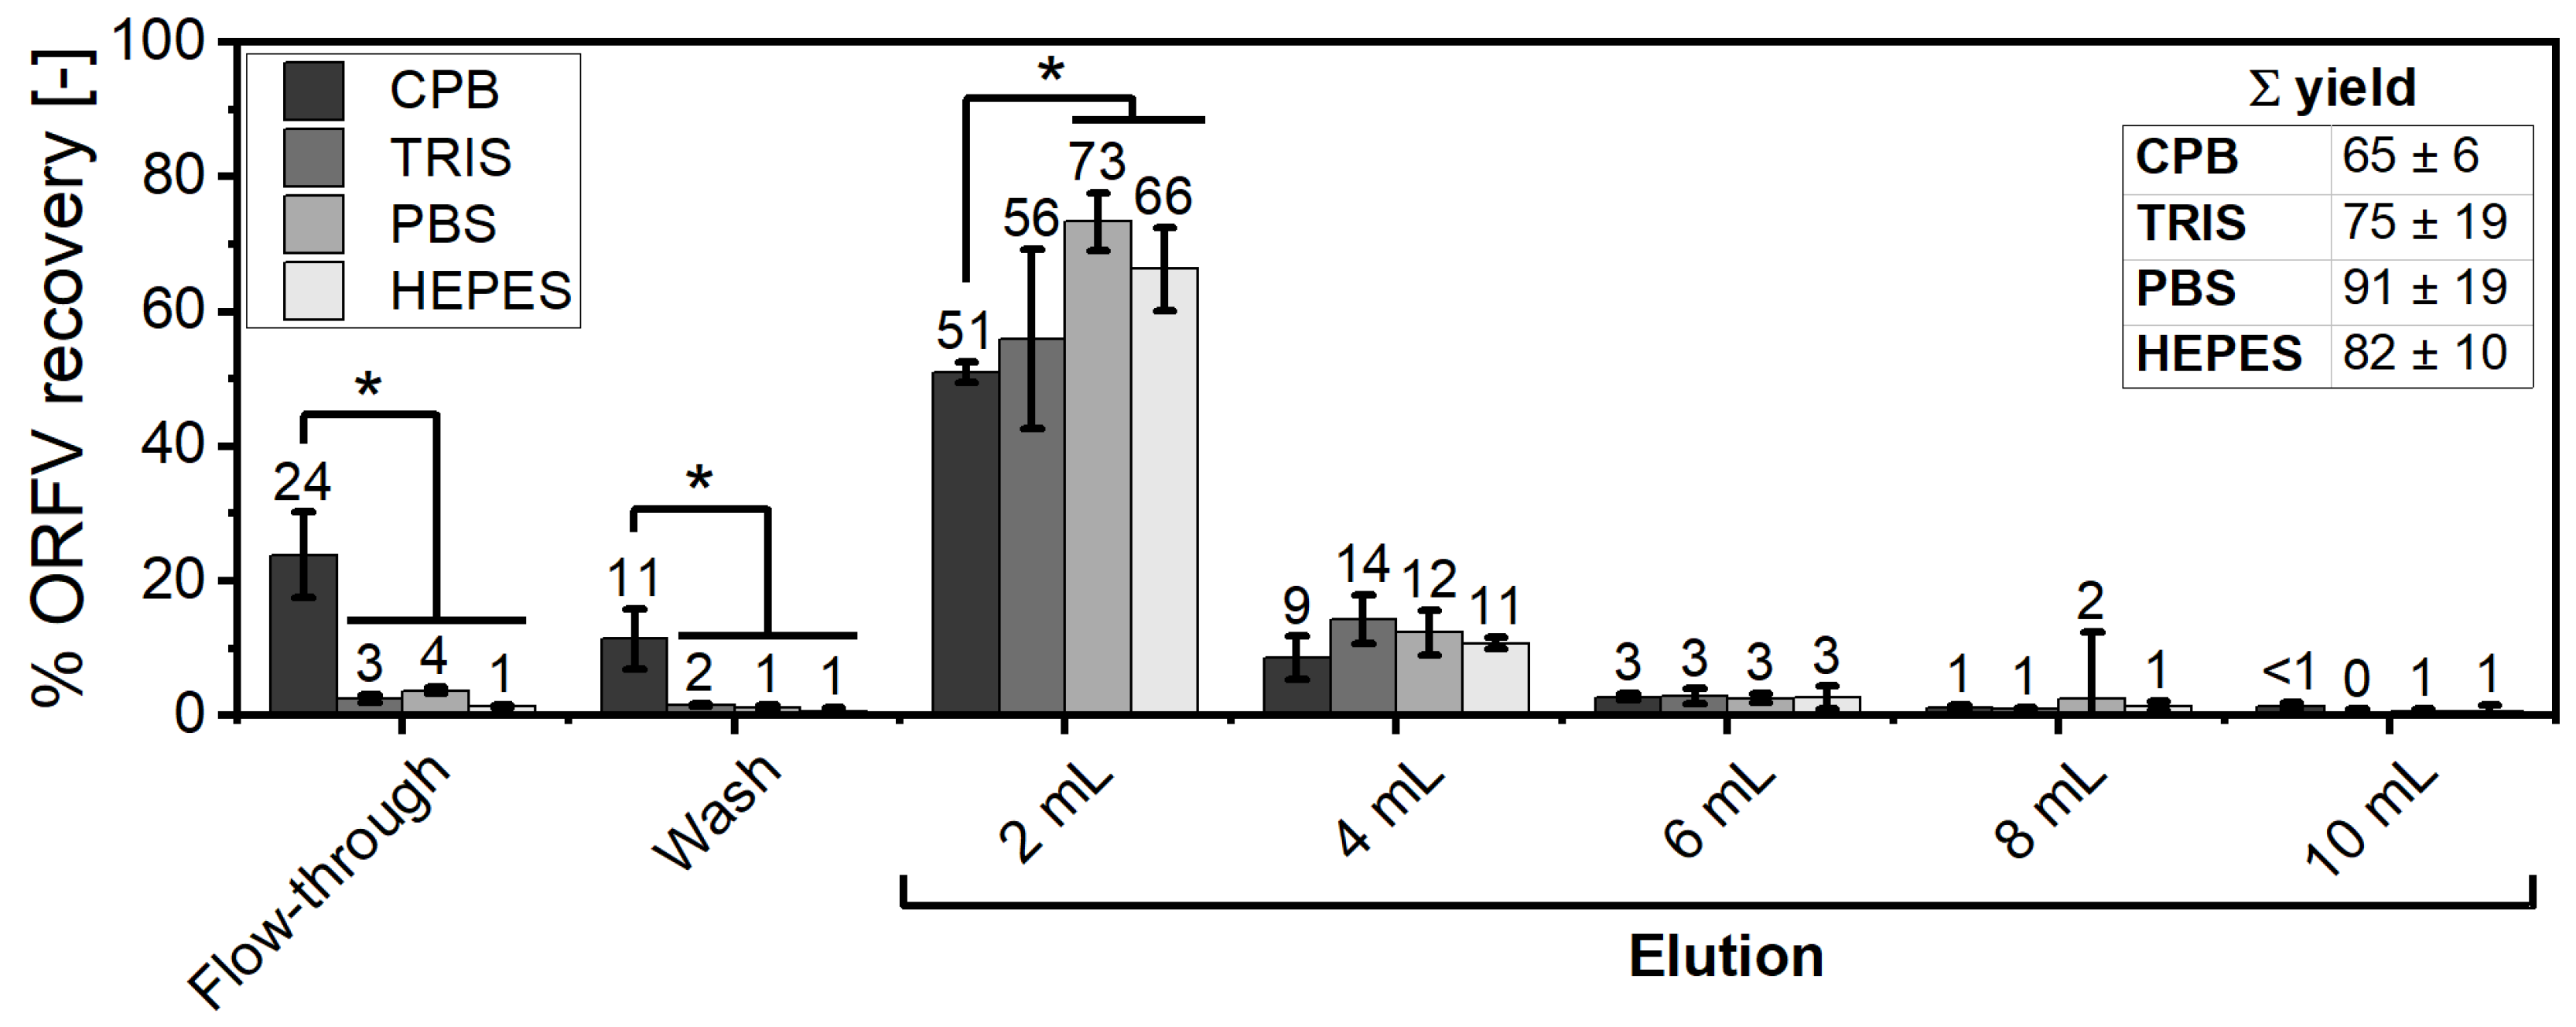
3.3. Comparison of Buffering Systems in the SXC Process
3.4. Changes in the ORFV Yield Depending on Salt Addition in the SXC Load
3.4.1. Influence of Salts on SXC According to the Hofmeister Series
3.4.2. Concentration-Dependent Precipitation
3.4.3. Concentration-Dependent Impact of NaCl and NaNO3
4. Conclusions
Supplementary Materials
Author Contributions
Funding
Data Availability Statement
Acknowledgments
Conflicts of Interest
References
- Wolff, M.W.; Reichl, U. Downstream Processing of Cell Culture-Derived Virus Particles. Expert Rev. Vaccines 2011, 10, 1451–1475. [Google Scholar] [CrossRef] [PubMed]
- Hoffmann, D.; Leber, J.; Loewe, D.; Lothert, K.; Oppermann, T.; Zitzmann, J.; Weidner, T.; Salzig, D.; Wolff, M.W.; Czermak, P. Purification of New Biologicals Using Membrane-Based Processes. In Current Trends and Future Developments on (Bio-) Membranes: Membrane Processes in the Pharmaceutical and Biotechnological Field; Basile, A.B., Charcosset, C., Eds.; Elsevier: Amsterdam, The Netherlands, 2019; pp. 123–150. ISBN 9780128136065. [Google Scholar]
- Morenweiser, R. Downstream Processing of Viral Vectors and Vaccines. Gene Ther. 2005, 12 (Suppl. S1), 103–110. [Google Scholar] [CrossRef] [PubMed]
- Atha, D.H.; Ingham, K.C. Mechanism of Precipitation of Proteins by Polyethylene Glycols. Analysis in Terms of Excluded Volume. J. Biol. Chem. 1981, 256, 12108–12117. [Google Scholar] [CrossRef]
- Miekka, S.I.; Ingham, K.C. Influence of self-association of proteins on their precipitation by poly(ethylene glycol). Arch. Biochem. Biophys. 1978, 191, 525–536. [Google Scholar] [CrossRef]
- Ingham, K.C. Precipitation of proteins with polyethylene glycol. In Guide to Protein Purification; Deutscher, M.P., Ed.; Elsevier: Amsterdam, The Netherlands, 1990; pp. 301–306. [Google Scholar]
- Sim, S.-L.; He, T.; Tscheliessnig, A.; Mueller, M.; Tan, R.B.H.; Jungbauer, A. Branched polyethylene glycol for protein precipitation. Biotechnol. Bioeng. 2012, 109, 736–746. [Google Scholar] [CrossRef] [PubMed]
- Tao, S.-P.; Zheng, J.; Sun, Y. Grafting Zwitterionic Polymer onto Cryogel Surface Enhances Protein Retention in Steric Exclusion Chromatography on Cryogel Monolith. J. Chromatogr. A 2015, 1389, 104–111. [Google Scholar] [CrossRef] [PubMed]
- Lee, J.; Gan, H.T.; Latiff, S.M.A.; Chuah, C.; Lee, W.Y.; Yang, Y.-S.; Loo, B.; Ng, S.K.; Gagnon, P. Principles and Applications of Steric Exclusion Chromatography. J. Chromatogr. A 2012, 1270, 162–170. [Google Scholar] [CrossRef] [PubMed]
- Gagnon, P.; Toh, P.; Lee, J. High Productivity Purification of Immunoglobulin G Monoclonal Antibodies on Starch-Coated Magnetic Nanoparticles by Steric Exclusion of Polyethylene Glycol. J. Chromatogr. A 2014, 1324, 171–180. [Google Scholar] [CrossRef]
- Wang, C.; Bai, S.; Tao, S.-P.; Sun, Y. Evaluation of Steric Exclusion Chromatography on Cryogel Column for the Separation of Serum Proteins. J. Chromatogr. A 2014, 1333, 54–59. [Google Scholar] [CrossRef] [PubMed]
- Lothert, K.; Offersgaard, A.F.; Pihl, A.F.; Mathiesen, C.K.; Jensen, T.B.; Alzua, G.P.; Fahnøe, U.; Bukh, J.; Gottwein, J.M.; Wolff, M.W. Development of a downstream process for the production of an inactivated whole hepatitis C virus vaccine. Sci. Rep. 2020, 10, 3018. [Google Scholar] [CrossRef] [PubMed]
- Lothert, K.; Pagallies, F.; Eilts, F.; Sivanesapillai, A.; Hardt, M.; Moebus, A.; Feger, T.; Amann, R.; Wolff, M.W. A scalable downstream process for the purification of the cell culture-derived Orf virus for human or veterinary applications. J. Biotechnol. 2020, 323, 221–230. [Google Scholar] [CrossRef] [PubMed]
- Lothert, K.; Pagallies, F.; Feger, T.; Amann, R.; Wolff, M.W. Selection of chromatographic methods for the purification of cell culture-derived Orf virus for its application as a vaccine or viral vector. J. Biotechnol. 2020, 323, 62–72. [Google Scholar] [CrossRef] [PubMed]
- Lothert, K.; Sprick, G.; Beyer, F.; Lauria, G.; Czermak, P.; Wolff, M.W. Membrane-Based Steric Exclusion Chromatography for the Purification of a Recombinant Baculovirus and its Application for Cell Therapy. J. Virol. Methods 2020, 275, 113756. [Google Scholar] [CrossRef] [PubMed]
- Marichal-Gallardo, P.; Pieler, M.M.; Wolff, M.W.; Reichl, U. Steric Exclusion Chromatography for Purification of Cell Culture-Derived Influenza A Virus Using Regenerated Cellulose Membranes and Polyethylene Glycol. J. Chromatogr. A 2017, 1483, 110–119. [Google Scholar] [CrossRef]
- Marichal-Gallardo, P.; Börner, K.; Pieler, M.M.; Sonntag-Buck, V.; Obr, M.; Bejarano, D.; Wolff, M.W.; Kräusslich, H.-G.; Reichl, U.; Grimm, D. Single-use capture purification of adeno-associated viral gene transfer vectors by membrane-based steric exclusion chromatography. Hum. Gene Ther. 2021, 32, 959–974. [Google Scholar] [CrossRef] [PubMed]
- Labisch, J.J.; Kassar, M.; Bollmann, F.; Valentic, A.; Hubbuch, J.; Pflanz, K. Steric exclusion chromatography of lentiviral vectors using hydrophilic cellulose membranes. J. Chromatogr. A 2022, 1674, 463148. [Google Scholar] [CrossRef] [PubMed]
- Gränicher, G.; Babakhani, M.; Göbel, S.; Jordan, I.; Marichal-Gallardo, P.; Genzel, Y.; Reichl, U. A high cell density perfusion process for Modified Vaccinia virus Ankara production: Process integration with inline DNA digestion and cost analysis. Biotechnol. Bioeng. 2021, 118, 4720–4734. [Google Scholar] [CrossRef]
- Eilts, F.; Steger, M.; Pagallies, F.; Rziha, H.-J.; Hardt, M.; Amann, R.; Wolff, M.W. Comparison of sample preparation techniques for the physicochemical characterization of Orf virus particles. J. Virol. Methods 2022, 310, 114614. [Google Scholar] [CrossRef] [PubMed]
- Alvim, R.G.F.; Lima, T.M.; Silva, J.L.; de Oliveira, G.A.P.; Castilho, L.R. Process intensification for the production of yellow fever virus-like particles as potential recombinant vaccine antigen. Biotechnol. Bioeng. 2021, 118, 3581–3592. [Google Scholar] [CrossRef]
- Eilts, F.; Steger, M.; Lothert, K.; Wolff, M.W. The Suitability of Latex Particles to Evaluate Critical Process Parameters in Steric Exclusion Chromatography. Membranes 2022, 12, 488. [Google Scholar] [CrossRef]
- Levanova, A.; Poranen, M.M. Application of Steric Exclusion Chromatography on Monoliths for Separation and Purification of RNA Molecules. J. Chromatogr. A 2018, 1574, 50–59. [Google Scholar] [CrossRef]
- Sim, S.-L.; He, T.; Tscheliessnig, A.; Mueller, M.; Tan, R.B.H.; Jungbauer, A. Protein precipitation by polyethylene glycol: A generalized model based on hydrodynamic radius. J. Biotechnol. 2012, 157, 315–319. [Google Scholar] [CrossRef]
- Gagnon, P. Chromatographic Purification of Virus Particles. In Encyclopedia of Industrial Biotechnology; Flickinger, M.C., Ed.; John Wiley & Sons, Inc.: Hoboken, NJ, USA, 2009. [Google Scholar]
- Broide, M.L.; Tominc, T.M.; Saxowsky, M.D. Using phase transitions to investigate the effect of salts on protein interactions. Phys. Rev. E 1996, 53, 6325–6335. [Google Scholar] [CrossRef]
- Nagington, J.; Horne, R.W. Morphological Studies of Orf and Vaccinia Viruses. Virology 1962, 16, 248–260. [Google Scholar] [CrossRef]
- Nitsche, A.; Gelderblom, H.R.; Eisendle, K.; Romani, N.; Pauli, G. Pitfalls in Diagnosing Human Poxvirus Infections. J. Clin. Virol. 2007, 38, 165–168. [Google Scholar] [CrossRef] [PubMed]
- Wang, R.; Luo, S. Orf Virus: A New Class of Immunotherapy Drugs. In Systems Biology; Vlachakis, D., Ed.; IntechOpen: London, UK, 2019. [Google Scholar]
- Amann, R.; Rohde, J.; Wulle, U.; Conlee, D.; Raue, R.; Martinon, O.; Rziha, H.-J. A new rabies vaccine based on a recombinant ORF virus (parapoxvirus) expressing the rabies virus glycoprotein. J. Virol. 2013, 87, 1618–1630. [Google Scholar] [CrossRef]
- Rziha, H.-J.; Büttner, M.; Müller, M.; Salomon, F.; Reguzova, A.; Laible, D.; Amann, R. Genomic Characterization of Orf Virus Strain D1701-V (Parapoxvirus) and Development of Novel Sites for Multiple Transgene Ex-pression. Viruses 2019, 11, 127. [Google Scholar] [CrossRef]
- Rziha, H.-J.; Rohde, J.; Amann, R. Generation and Selection of Orf Virus (ORFV) Recombinants. Methods Mol. Biol. 2016, 1349, 177–200. [Google Scholar] [CrossRef] [PubMed]
- Rziha, H.-J.; Büttner, M. Parapoxviruses. In Reference Module in Life Sciences; Elsevier: Amsterdam, The Netherlands, 2020; p. 1505. [Google Scholar]
- Friebe, A.; Siegling, A.; Weber, O. Inactivated Orf-virus shows disease modifying antiviral activity in a guinea pig model of genital herpesvirus infection. J. Microbiol. Immunol. Infect. 2018, 51, 587–592. [Google Scholar] [CrossRef]
- Rintoul, J.L.; Lemay, C.G.; Tai, L.H.; Stanford, M.M.; Falls, T.J.; de Souza, C.T.; Bridle, B.W.; Daneshmand, M.; Ohashi, P.S.; Wan, Y.; et al. ORFV: A novel oncolytic and immune stimulating parapoxvirus therapeutic. Mol. Ther. 2012, 20, 1148–1157. [Google Scholar] [CrossRef]
- O’Leary, M.P.; Choi, A.H.; Kim, S.-I.; Chaurasiya, S.; Lu, J.; Park, A.K.; Woo, Y.; Warner, S.G.; Fong, Y.; Chen, N.G. Novel oncolytic chimeric orthopoxvirus causes regression of pancreatic cancer xenografts and exhibits abscopal effect at a single low dose. J. Transl. Med. 2018, 16, 110. [Google Scholar] [CrossRef] [PubMed]
- Bergqvist, C.; Kurban, M.; Abbas, O. Orf virus infection. Rev. Med. Virol. 2017, 27, e1932. [Google Scholar] [CrossRef] [PubMed]
- Fleming, S.B.; Wise, L.M.; Mercer, A.A. Molecular genetic analysis of orf virus: A poxvirus that has adapted to skin. Viruses 2015, 7, 1505–1539. [Google Scholar] [CrossRef]
- Friebe, A.; Siegling, A.; Friederichs, S.; Volk, H.-D.; Weber, O. Immunomodulatory effects of inactivated parapoxvirus ovis (ORF virus) on human peripheral immune cells: Induction of cytokine secretion in monocytes and Th1-like cells. J. Virol. 2004, 78, 9400–9411. [Google Scholar] [CrossRef]
- Royo, M.d.C.P.; Beulay, J.-L.; Valery, E.; Jungbauer, A.; Satzer, P. Mode and dosage time in polyethylene glycol precipitation process influences protein precipitate size and filterability. Process Biochem. 2022, 114, 77–85. [Google Scholar] [CrossRef]
- Zumaeta, N.; Byrne, E.P.; Fitzpatrick, J.J. Predicting precipitate particle breakage in a pipeline: Effect of agitation intensity during precipitate formation. Chem. Eng. Sci. 2006, 61, 7991–8003. [Google Scholar] [CrossRef]
- Lukasik, J.; Scott, T.M.; Andryshak, D.; Farrah, S.R. Influence of Salts on Virus Adsorption to Microporous Filters. Appl. Environ. Microb. 2000, 66, 2914–2920. [Google Scholar] [CrossRef] [PubMed]
- Gagnon, P.; Grund, E.; Lindbäck, T. Large Scale Process Development for Hydrophobic Interaction Chromatography, Part 1: Gel Selection and Development of Binding Condition. BioPharm 1995, 8, 21–29. [Google Scholar]
- Hofmeister, F. Zur Lehre von der Wirkung der Salze. Naunyn-Schmiedeberg’s Arch. Exp. Pathol. Pharmakol. 1888, 24, 247–260. [Google Scholar] [CrossRef]
- Michen, B.; Graule, T. Isoelectric Points of Viruses. J. Appl. Microbiol. 2010, 18, 290. [Google Scholar] [CrossRef] [PubMed]
- Arakawa, T.; Gagnon, P. Excluded Cosolvent in Chromatography. J. Pharm. Sci. 2018, 107, 2297–2305. [Google Scholar] [CrossRef] [PubMed]
- Arakawa, T.; Timasheff, S.N. Preferential interactions of proteins with salts in concentrated solutions. Biochemistry 1982, 21, 6545–6552. [Google Scholar] [CrossRef] [PubMed]
- Arakawa, T.; Kita, Y.; Ejima, D.; Gagnon, P. Solvent Modulation of Column Chromatography. Protein Pept. Lett. 2008, 15, 544–555. [Google Scholar] [CrossRef] [PubMed]
- Gagnon, P.; Mayes, T.; Danielsson, Å. An adaptation of hydrophobic interaction chromatography for estimation of protein solubility optima. J. Pharm. Biomed. Anal. 1997, 16, 587–592. [Google Scholar] [CrossRef][Green Version]
- Salgyn, S.; Salgyn, U.; Bahadir, S. Zeta Potentials and Isoelectric Points of Biomolecules: The Effects of Ion Types and Ionic Strengths. Int. J. Electrochem. Sci. 2012, 7, 12404–12414. [Google Scholar]


| Pore Size | Recoveries | Load | |||||
|---|---|---|---|---|---|---|---|
| Flow-Through | Wash | Down-Flow Elution | Up-Flow Elution | Total | Volume | ORFV Particles | |
| [µm] | [%] | [mL] | [IU] | ||||
| 1 | 3 ± 1 | 3 ± 1 | 99 ± 17 | 21 ± 10 | 123 ± 29 | 8 ± 5 | 1.8 × 10⁷ ± 1.1 × 10⁷ |
| 3–5 | 37 ± 1 | 2 ± 1 | 56 ± 1 | 5 ± 1 | 100 ± 2 | 31 ± 1 | 7.0 × 10⁸ ± 2.2 × 10⁶ |
Publisher’s Note: MDPI stays neutral with regard to jurisdictional claims in published maps and institutional affiliations. |
© 2022 by the authors. Licensee MDPI, Basel, Switzerland. This article is an open access article distributed under the terms and conditions of the Creative Commons Attribution (CC BY) license (https://creativecommons.org/licenses/by/4.0/).
Share and Cite
Eilts, F.; Lothert, K.; Orbay, S.; Pagallies, F.; Amann, R.; Wolff, M.W. A Summary of Practical Considerations for the Application of the Steric Exclusion Chromatography for the Purification of the Orf Viral Vector. Membranes 2022, 12, 1070. https://doi.org/10.3390/membranes12111070
Eilts F, Lothert K, Orbay S, Pagallies F, Amann R, Wolff MW. A Summary of Practical Considerations for the Application of the Steric Exclusion Chromatography for the Purification of the Orf Viral Vector. Membranes. 2022; 12(11):1070. https://doi.org/10.3390/membranes12111070
Chicago/Turabian StyleEilts, Friederike, Keven Lothert, Sabri Orbay, Felix Pagallies, Ralf Amann, and Michael W. Wolff. 2022. "A Summary of Practical Considerations for the Application of the Steric Exclusion Chromatography for the Purification of the Orf Viral Vector" Membranes 12, no. 11: 1070. https://doi.org/10.3390/membranes12111070
APA StyleEilts, F., Lothert, K., Orbay, S., Pagallies, F., Amann, R., & Wolff, M. W. (2022). A Summary of Practical Considerations for the Application of the Steric Exclusion Chromatography for the Purification of the Orf Viral Vector. Membranes, 12(11), 1070. https://doi.org/10.3390/membranes12111070