Article

Analysis of CO2 Facilitation Transport Effect through a Hybrid Poly(Allyl Amine) Membrane: Pathways for Further Improvement

by
Bouchra Belaissaoui
1,*,
Elsa Lasseuguette
2,
Saravanan Janakiram
3,
Liyuan Deng
3 and
Maria-Chiara Ferrari
2
1
LRGP-CNRS, University of Lorraine, ENSIC, 1 rue Grandville, 54001 Nancy, France
2
School of Engineering, University of Edinburgh, Robert Stevenson Road, Edinburgh EH9 3FB, UK
3
Department of Chemical Engineering, Norwegian University of Science and Technology (NTNU), NO-7491 Trondheim, Norway
*
Author to whom correspondence should be addressed.
Membranes 2020, 10(12), 367; https://doi.org/10.3390/membranes10120367
Submission received: 21 October 2020 / Revised: 16 November 2020 / Accepted: 22 November 2020 / Published: 25 November 2020
(This article belongs to the Special Issue Polymer Membranes for Gas Separation)

Abstract

:
Numerous studies have been reported on CO2 facilitated transport membrane synthesis, but few works have dealt with the interaction between material synthesis and transport modelling aspects for optimization purposes. In this work, a hybrid fixed-site carrier membrane was prepared using polyallylamine with 10 wt% polyvinyl alcohol and 0.2 wt% graphene oxide. The membrane was tested using the feed gases with different relative humidity and at different CO2 partial pressures. Selected facilitated transport models reported in the literature were used to fit the experimental data with good agreement. The key dimensionless facilitated transport parameters were obtained from the modelling and data fitting. Based on the values of these parameters, it was shown that the diffusion of the amine-CO2 reaction product was the rate-controlling step of the overall CO2 transport through the membrane. It was shown theoretically that by decreasing the membrane selective layer thickness below the actual value of 1 µm to a value of 0.1 µm, a CO2 permeance as high as 2500 GPU can be attained while maintaining the selectivity at a value of about 19. Furthermore, improving the carrier concentration by a factor of two might shift the performances above the Robeson upper bound. These potential paths for membrane performance improvement have to be confirmed by targeted experimental work.

1. Introduction

Post-combustion capture (PCC) is an efficient strategy to achieve greenhouse gas emission reductions, as it can be retrofitted to existing power stations or industrial plants and can be integrated into new ones. In the post-combustion framework, flue gases are treated at atmospheric pressure and carbon dioxide is diluted in nitrogen with a typical CO2 volume fraction of 5% (natural gas turbine exhaust), 15% (coal combustion power plant), and 30% (steel plant or oxygen enriched air flue gas). As a result, CO2 partial pressure in the flue gas is very low, creating a major engineering challenge, especially in terms of energy and membrane surface area requirements for the separation process [1,2]. Many studies have been dedicated to improving existing and already mature technologies (i.e., gas-liquid absorption in amine solvents, cryogenic separation, adsorption). Their success hinges on their ability to lower the cost of CO2 capture while still attaining the targets for CO2 purity and recovery ratio. Membrane separation processes represent an interesting alternative as a more energy-efficient process with no need for chemicals and no extra source of direct pollution. Commercial gas separation membranes are mainly based on dense polymers, such as polyimide, polysulfone, polycarbonate, polyphenyl oxide, cellulose derivatives, or poly(ethylene oxide) [3,4], and follow the solution-diffusion mechanism. The key shortcoming of solution-diffusion membranes is the trade-off between permeability and selectivity, governed by the Robeson’s upper bound, as shown in Figure 1 [5,6]. The development of membrane materials with high permeability and selectivity is a key challenge for efficient CO2 separation. High selectivity is essential to achieve the purity target at low energy cost, and high permeability is required to minimize the membrane surface area and related cost [7,8]. The challenge is then to push the material performances to the right upper side of the Robeson plot.
Among these membranes, facilitated transport membranes (FTMs) have gained much interest in recent years and have shown a promising performance beyond the Robeson upper bound region [3,4,9]. These membranes are based on a selective reversible reaction between the incorporated carrier agents and the target gas component. Facilitated transport membranes for CO2 separation most commonly contain amino groups [10,11,12]. Polyvinylamine (PVAm) is one of the most intensively studied fixed-site carrier polymeric membrane materials [13,14].
In such membrane, the carrier is covalently bonded to the polymer backbone and a CO2 molecule reacts with one carrier site in the presence of water, which induces the formation of bicarbonate (HCO3) on the feed side interface of the membrane (Figure 2); the complex diffuses along its concentration gradient to the permeate side of the membrane, “hopping” through fixed carrier sites until it reaches the permeate side [15,16]. CO2 is released on the permeate side, regenerating the carrier, which can react with another CO2 molecule on the feed side. Therefore, a major part of CO2 is transported by the carriers inside the membrane, in addition to the physical solution-diffusion mechanism, which other non-reactive gases also follow (Figure 2). A measure of the facilitation effect is the facilitation factor, defined as the ratio of total solute flux with the carrier present to the solute diffusional flux. It represents the contribution of the CO2-carrier reaction to the overall transport. Thus, a high facilitation factor corresponds to high selectivity as the flux of the facilitated solute is enhanced in comparison to the diffusion flux of other components in the mixture to be separated.
From the theoretical point of view, many studies have been carried out to calculate and predict the permeation rates and facilitation factors. The general formulation of the facilitated transport of a gas in a membrane can be described mathematically by means of non-linear differential equations expressing a diffusion reaction mass balance of the species involved. The treatment of the nonlinear diffusion reaction (NLDR) problem has been developed considering approximate analytical and/or numerical solutions. Despite the advance in the numerical techniques and computational power, the approximate analytical solutions are still useful because they are more flexible and reliable for extreme cases, such as the chemical equilibrium regime or/and excess carrier. As an example, assuming a large excess of carrier compared to solute is equivalent to assuming that the carrier concentration is constant across the membrane thickness. With this assumption, the NLDR problem describing this process becomes linear and can be solved easily. Several analytical solutions have been proposed to predict the facilitation factor of fixed-site carrier membranes [16,17,18,19,20,21]. In the conditions where these analytical models are applicable, they are accurate despite the simplicity of their mathematical description.
Generally, several studies were reported on membrane synthesis, but few works have dealt with the interaction between material synthesis and transport modelling aspects. In facilitated transport systems, the interaction between both chemistry and chemical engineering is key to understanding the relationship of facilitated transport system properties to separation performances. The performance of a facilitated transport membrane process is dependent upon a number of physical and chemical properties. These properties can be independently measured or retrieved thanks to appropriate analytical transport solutions at suitable operating conditions [22]. Indeed, the interaction of modelling and experimentation is very useful in improving the knowledge base and permits optimization of the facilitation transport mechanism at both the material and process scale [16,23].
For the same combination of carrier and key permeant (here CO2), improvement of the membrane performance can possibly be achieved by the modification of the total carrier concentration and the selective layer thickness. Their effect on CO2 permeability and selectivity is not trivial [23,24].
On the one hand, decreasing the membrane thickness will not systematically increase the permeance of CO2. Indeed, even if the solution-diffusion permeance mechanism of both CO2 and N2 increases, the transport of CO2 by the facilitation mechanism can be reduced significantly, due to reaction limitation (reduced inverse Damkoler number). The effects of the two mechanisms balance, and the facilitated effect (and thus selectivity) can be depleted. On the other hand, the possible positive effect of increasing the carrier concentration has to be weighted by the possible depletion of the reaction complex effective diffusivity. Indeed, the mobility of the complex is a function of the product of both an increasing carrier concentration and reaction complex effective diffusivity, as has been pointed out in the literature [25]. This has to be confirmed by targeted experimental work.
For these reasons, a combined modelling and experimental strategy was used in the present study, in order to show if improvement of the actual membrane performance through chemical and structural modifications is possible and how this could be achieved and evaluated. The results could be used to guide future experimental work. Such a combined analysis is infrequent in the literature.
In this work, first, a hybrid fixed-site carrier membrane using polyallylamine (PAA) with 10 wt% polyvinyl alcohol (PVA) and 0.2wt% graphene oxide was prepared. In order to increase membrane resistance to plasticization and compaction under relevant industrial conditions of CO2 capture, hybrid membranes combining the aforementioned polymers and inorganic additives were recently investigated, with the inorganic fillers used as a reinforcing agent in the membrane structure [26,27]. Experimental measurements of CO2 and N2 fluxes through a hybrid fixed-site carrier membrane, based on poly(allyl amine) matrix, under different operation conditions of the feed relative humidity and CO2 upstream partial pressure, are presented and discussed. Second, analytical solutions of the facilitation factor are presented and used to analyze the experimental results and estimate some key facilitation properties. A dedicated parametric analysis was performed to show how the facilitation effect of CO2 transport through the studied membrane is affected by the key properties of the membrane, mainly total carrier concentration and membrane selective layer thickness. Indeed, their effect on CO2 permeability and selectivity is not obvious. Moreover, the modelling results are compared to actual membrane performances to determine if significant improvements are possible in system performance and how this could be achieved and evaluated. Finally, pathways for membrane chemical and structural modifications are proposed in order to increase the CO2 facilitated transport and improve the membrane separation performance.

2. Modelling Background

The most common and generalized reaction scheme for the facilitated transport mechanism of CO2 across fixed-site amine carrier membranes is expressed as A + C = AC, in which three species co-exist: the key solute (A), here CO2, being transported across the membrane; the active chemical carrier (C); and their reaction products or active carrier–solute complex (AC) [26,27].
The solute is transferred from one boundary to the other by two different mechanisms, pure diffusion in an unreacted state and diffusion as a complexed species. Considering a flat-plane geometry with one-dimensional transport (z-direction), Fick’s law diffusion mechanism, and constant diffusion coefficient of the species, the total solute flux can be expressed as:
J A = D A d C A d z D A c d C A c d z .
The facilitation factor F is an evaluation of the impact of the facilitation reaction compared to the pure diffusion mechanism. It is a measure of the increased selectivity resulting from the selective facilitation transport of the key component in a mixture. It is defined as the ratio of the total solute flux of A inside the membrane to the pure solution-diffusion (SD) flux, representing the contribution of the reaction to the overall transport:
F = J A J A S D = t o t a l   s o l u t e   f l u x   s o l u t e   s o l u t i o n   d i f f u s i o n   f l u x
The general formulation of the facilitated transport of a gas in a membrane can be described mathematically by means of differential equations expressing a steady-state nonlinear diffusion reaction (NLDR) problem. The species transport consists of simple diffusion coupled with a single chemical reversible reaction. The forward rate reaction is assumed to depend on both the carrier and solute concentration, while the backward reaction has a linear dependence on the reaction product concentration. Both kinetic constants, kf and kr, are considered concentration independent (with Keq = kf/kr). The mathematical derivation of the mass balance for fixed-site carrier membranes is an analogue to the mobile carrier formulation while an excess of carrier is considered [27]. Indeed, assuming excess carrier, the concentration of the carrier can be considered constant and defined by the reaction equilibrium calculated at the membrane upstream side [18]. Accordingly, the differential equations that describe the steady-state solute transport for fixed-site carrier membranes are:
D A 2 C A z 2 = k f ( C A C C 1 K e q C A C )
D A C 2 C A C z 2 = k f ( C A C C 1 K e q C A C )
With
C C = C T 1 + K e q C A O ,
Typical boundary conditions consist of the fact that the carrier and the product of the reaction are non-volatile and are constrained to stay confined inside the membrane. A constant source of solute A is considered at one boundary and A is removed continuously from the opposite boundary so that the concentration at that boundary is a constant. Only the solutes can cross the membrane boundaries:
a t   z = 0 ,   C A = C A 0    C C z = C A C z = 0
a t   z = L ,   C A = C A L    C C z = C A C z = 0
In a dimensionless form, the differential equation system becomes:
2 C A * z 2 = α m K ε ( C A * C C * 1 K C A C * ) ,
2 C A C * z 2 = K ε ( C A * C C * 1 K C A C * ) ,
And:
C C * = 1 1 + K * .
With the following boundary conditions:
a t   z * = 0 ,   C A * = 1    C A C * z * = 0
a t   z * = 1 ,   C A * = C A L C A 0    C A C * z * = 0
The treatment of the nonlinear diffusion reaction (NLDR) problem was developed considering approximate analytical and/or numerical solutions [17,18,22,28]. Many analytical solutions have been proposed to predict the facilitation factor of fixed-site carrier membranes. The solution developed by Smith and Quinn [18] assumes an excess of carrier and zero downstream key permeant partial pressure (here CO2). According to this model, the facilitation factor, F, is expressed in terms of the key dimensionless facilitated transport parameters, K, ε, α, and λ, as the following:
F = 1 + α m K 1 + K 1 + α m K 1 + K ( t a n h λ λ )
In this model, the facilitated factor is expressed as a function of key physicochemical properties, such as the reaction rate constant, chemical equilibrium constant, diffusivities of the chemical species, and membrane thickness. They are combined in a number of dimensionless groupings, having physical significance, which are presented in Table 1.
The key dimensionless number appearing in the equations above are defined in Table 1. These properties of the facilitated transport may be combined in a number of dimensionless groupings, having physical significance. The mobility ratio, αm, can be defined as the reactive versus the diffusive pathway. It is related to the ratio (DAC/DA) of the diffusion coefficient of the A-carrier reaction product and that of free solute A inside the membrane. The mobility ratio is also proportional to the initial carrier concentration. kD,A is the sorption coefficient of solute A in the membranes. CAO is the feed molar concentration of solute A. K is a dimensionless equilibrium constant. ε is the inverse of a Damkohler number and is a measure of the characteristic reverse reaction time to the characteristic diffusion time; it serves the same function as a Thiele modulus in catalysis.
It can be seen from the definition of ε that the latter is thickness dependent. These dimensionless parameters allow for a simplified evaluation of the performance of particular carrier/solute combinations.
According to Equation (13), F is mainly determined by the value of tanhλ/λ. The value of λ decreases with the K and αm values, thus high K and αm values are desired. The maximum F is obtained when λ tends to infinity (reaction equilibrium) and thus tanhλ/λ to zero while F decreases to one when λ tends to zero and thus tanhλ/λ to one (reaction kinetics limitations).
The value of tanh λ/λ is then a measure of the facilitation effect. Indeed, a simple and quick calculation of this one term can give the range of the facilitation effect factor [17]. Accordingly, one may determine the necessary property modifications to move toward reaction equilibrium by moving the above quantity toward zero and thus to rich high facilitation factors [17].
In the limit of the equilibrium reaction, Equation (13) becomes:
F = 1 + α m K 1 + K .
Generally, the key permeant (here CO2) flux through the membrane is expressed as a sum of two contributions: solution diffusion flux of free CO2 and flux of the CO2-amine complex. Assuming the reaction equilibrium approximation throughout the membrane, the total CO2 flux through the membrane film can be calculated as follows [29]:
J A = D A k D , A   e ( p A p A ) + D A C K e q C T k D , A   e [ p A 1 + K e q k D , A   p A p A 1 + K e q k D , A   p A ] ,
where p A and p A are the upstream and downstream partial pressure of A, respectively.
Accordingly, the facilitated factor can be expressed as the following:
F = 1 + D A C K e q C T D A ( p A p A ) [ p A 1 + K e q k D , A   p A p A 1 + K e q k D , A   p A ]
In case of a downstream CO2 pressure equal to 0, Equation (16) reduces to Equation (14).
Table 2 summarizes the hypothesis and the facilitation expression of each model, namely: (i) the simplified equilibrium model (Equation (14)); (ii) the equilibrium model expression, which considers a non-zero downstream concentration (Equation (16)); and (iii) the general model expression (Equation (13)).

3. Membrane Fabrication

PAA-PVA-GO membrane was prepared at the Norwegian University of Science and Technology (Group of Prof. L. Deng) in the framework of NanoMEMC2 project. It is a composite membrane based on a selective layer composed of a mixture of 0.2 wt% graphene oxide (GO), 89.8 wt% poly(allyl amine) (PAA), and 10 wt% poly(vinyl alcohol) (PVA), coated onto a porous support made of polyvinylidene fluoride (PVDF). The choice of the polymer and nanofiller composition is attributed to the superior performance recorded from previous studies [29]. The use of PVA is to exploit its excellent film-forming capabilities while the use of GO as nanofiller enhances selective gas transport by reorienting polymer chain packing and increasing water distribution in the polymer matrix. Several tests have been conducted in these membranes recently, with studies explaining the role of the individual components present in such hybrid membranes [30]. These membranes have also been validated in industrial testing conditions [31].
Poly(allyl amine) was obtained by purification of poly(allyl amine hydrochloride) (Mw = 120,000 g/mol) (bought from Thermo Fisher Scientific, Stockholm, Sweden) using equivalent potassium hydroxide (KOH) in methanol at room temperature for 24 h. The purified poly(allyl amine) was recovered by centrifuging the supernatant comprising of PAA in methanol. The solution was then dried in a ventilated oven at 60 °C to result in dry polymer, ready to be re-dissolved in deionized water. About 6 wt% solution of PAA in water was obtained by stirring (at 500 rpm) for 24 h. In the case of PVA, a 4 wt% polymer solution in water was prepared by dissolving PVA pellets in deionized water at 80 °C for 4 h under reflux conditions. GO dispersion was obtained as 2 mg mL−1 from Graphene-XT, Bologna, Italy.
In order to prepare the casting solution for membrane fabrication, the calculated amount of GO solution was first diluted using water. Drops of both 6 wt% PAA and 4 wt% PVA solutions were then carefully added to the diluted dispersion under stirring conditions to result in a casting solution, which contained 89.8 wt% PAA, 10 wt% PVA, and 0.2 wt% GO. The total solid contents (polymer + GO) in the casting solution were maintained at 2wt%.
The composite membrane was fabricated using the bar coating method mentioned elsewhere [32]. The porous support was washed with tap water at 45 °C for 1 h and DI water for 30 min to remove the pore protection agents. The support was then mounted on to a flat glass plate using aluminum tape. The polymer cast solution was then casted over the support and the membrane was dried at 60 °C in vacuum for 4–5 h. With the bar coating method, defect-free selective layer coating was obtained with the use of FC-72 electronic liquid (3M™ Fluorinert™) as the pore-filling agent. Scanning electron microscopy (Figure 3) revealed that the selective skin thickness was approximately 1 μm. Based on the physical properties of PAA (Mw = 12,000 g/mol, density = 1.02 g/cm3), it was possible to determine a total carrier concentration in the membrane of 1.61 × 10⁻² mol·cm−3.

4. Experiments: Results and Discussion

Gas permeability measurements were performed with a mixed gas–continuous flow permeation cell designed at the University of Edinburgh; details on the permeation cell and the experimental procedure can be found in a previous article [33]. A flat circular membrane with an area of 2.835 cm2 was used for the experiments.
The operating conditions used for our project are summarized in Table 3. The downstream pressure, feed and sweep flow rates, and sweep gas relative humidity were set constant, whereas the humidity content and the CO2 partial pressure in the feed side were varied from 20% to 90% and from 0.15 to 3 bar, respectively.
The permeability i and the permeance P M i were calculated from the experimental data of the measured fluxes, Ji, as follows:
P M i ,   i = C O 2 , N 2 = J i   S   ( p i p i ) = i ,   i = C O 2 , N 2 e ,
where e is the thickness of the membrane (cm), S is the membrane surface area, Ji is the gas permeate flowrate of component j (cm3 (STP)/s), A is the effective membrane area (cm2), and p i and p i are the partial pressure of the gas in the feed and permeate stream, respectively (cmHg).
The CO2/N2 ideal selectivity α C O 2 / N 2 between two gas species was calculated as the ratio of the two permeabilities:
α C O 2 / N 2 = C O 2   N 2 .
The common unit of permeability is Barrer, which corresponds to 10−10 cm3 (STP) cm cm−2 s−1 cmHg−1. The permeance is defined as the ratio of permeability to the selective layer thickness. Its common unit is GPU (gas permeation unit), which corresponds to 10−6 cm3 (STP) cm−2 s−1 cmHg−1.

4.1. Effect of Feed Relative Humidity

A large relative humidity is required for the facilitated transport reaction mechanism to operate in the polymer [34]. Moreover, the impact of humidity on the solution diffusion mechanism can also be important. Indeed, a high water content is likely to swell rubbery membranes, increasing the polymeric chain mobility and as a result inducing increased gas permeabilities and possible loss in CO2/N2 selectivity. Moreover, a loss of CO2 permeability can be observed in glassy polymer due to the competitive sorption between water and CO2 and the free volume reduction effect [34,35,36,37].
Figure 4 shows the effect of variation of the feed relative humidity (RHf) on the CO2 and N2 permeances and CO2/N2 membrane selectivity. The RHf varied from 20% to 90% with a constant sweep gas relative humidity of 50% and a temperature of 50 °C. It can be seen that both CO2 and N2 permeances increase with RHf, with CO2 permeance increasing exponentially. Indeed, an increase in RH leads to a higher water content in the membrane matrix, which enhances the reaction between CO2 and amine carriers and the mobilities of the reaction products but also unreacted CO2 and N2 [27,34]. Regarding the CO2/N2 selectivity, it shows a non-monotonic trend as it shows a slight maximum at a relative humidity of 70%. A selectivity drop at a high RH might be associated with enhanced penetration of non-reacting gas molecules relative to the contribution of facilitated transport due to the swelling of the membrane at high water content. The same trend was also observed by Sandru et al. [14] using PVAm/PPO for CO2/N2 separation at a feed pressure of 2.2 bar, 10% CO2–90% N2 feed at 25 °C. They showed that with increasing humidity content, the CO2/N2 selectivity increased to the maximum at 65% feed RH and then decreased. The same trend was also observed by Ansaloni et al. [27] using amino-functionalized multi-walled carbon nanotubes under high pressures (15–28 bar) and high temperatures (103–121 °C). They showed that the CO2/CH4 and CO2/H2 selectivity increased with feed RH until a maximum at 72% RH and then decreased. This trend has already been reported in the literature and can be explained by the occurrence of important water-induced swelling of the membrane at a high relative humidity content in the gas, which impaired the barrier property of the membrane toward N2 [27].

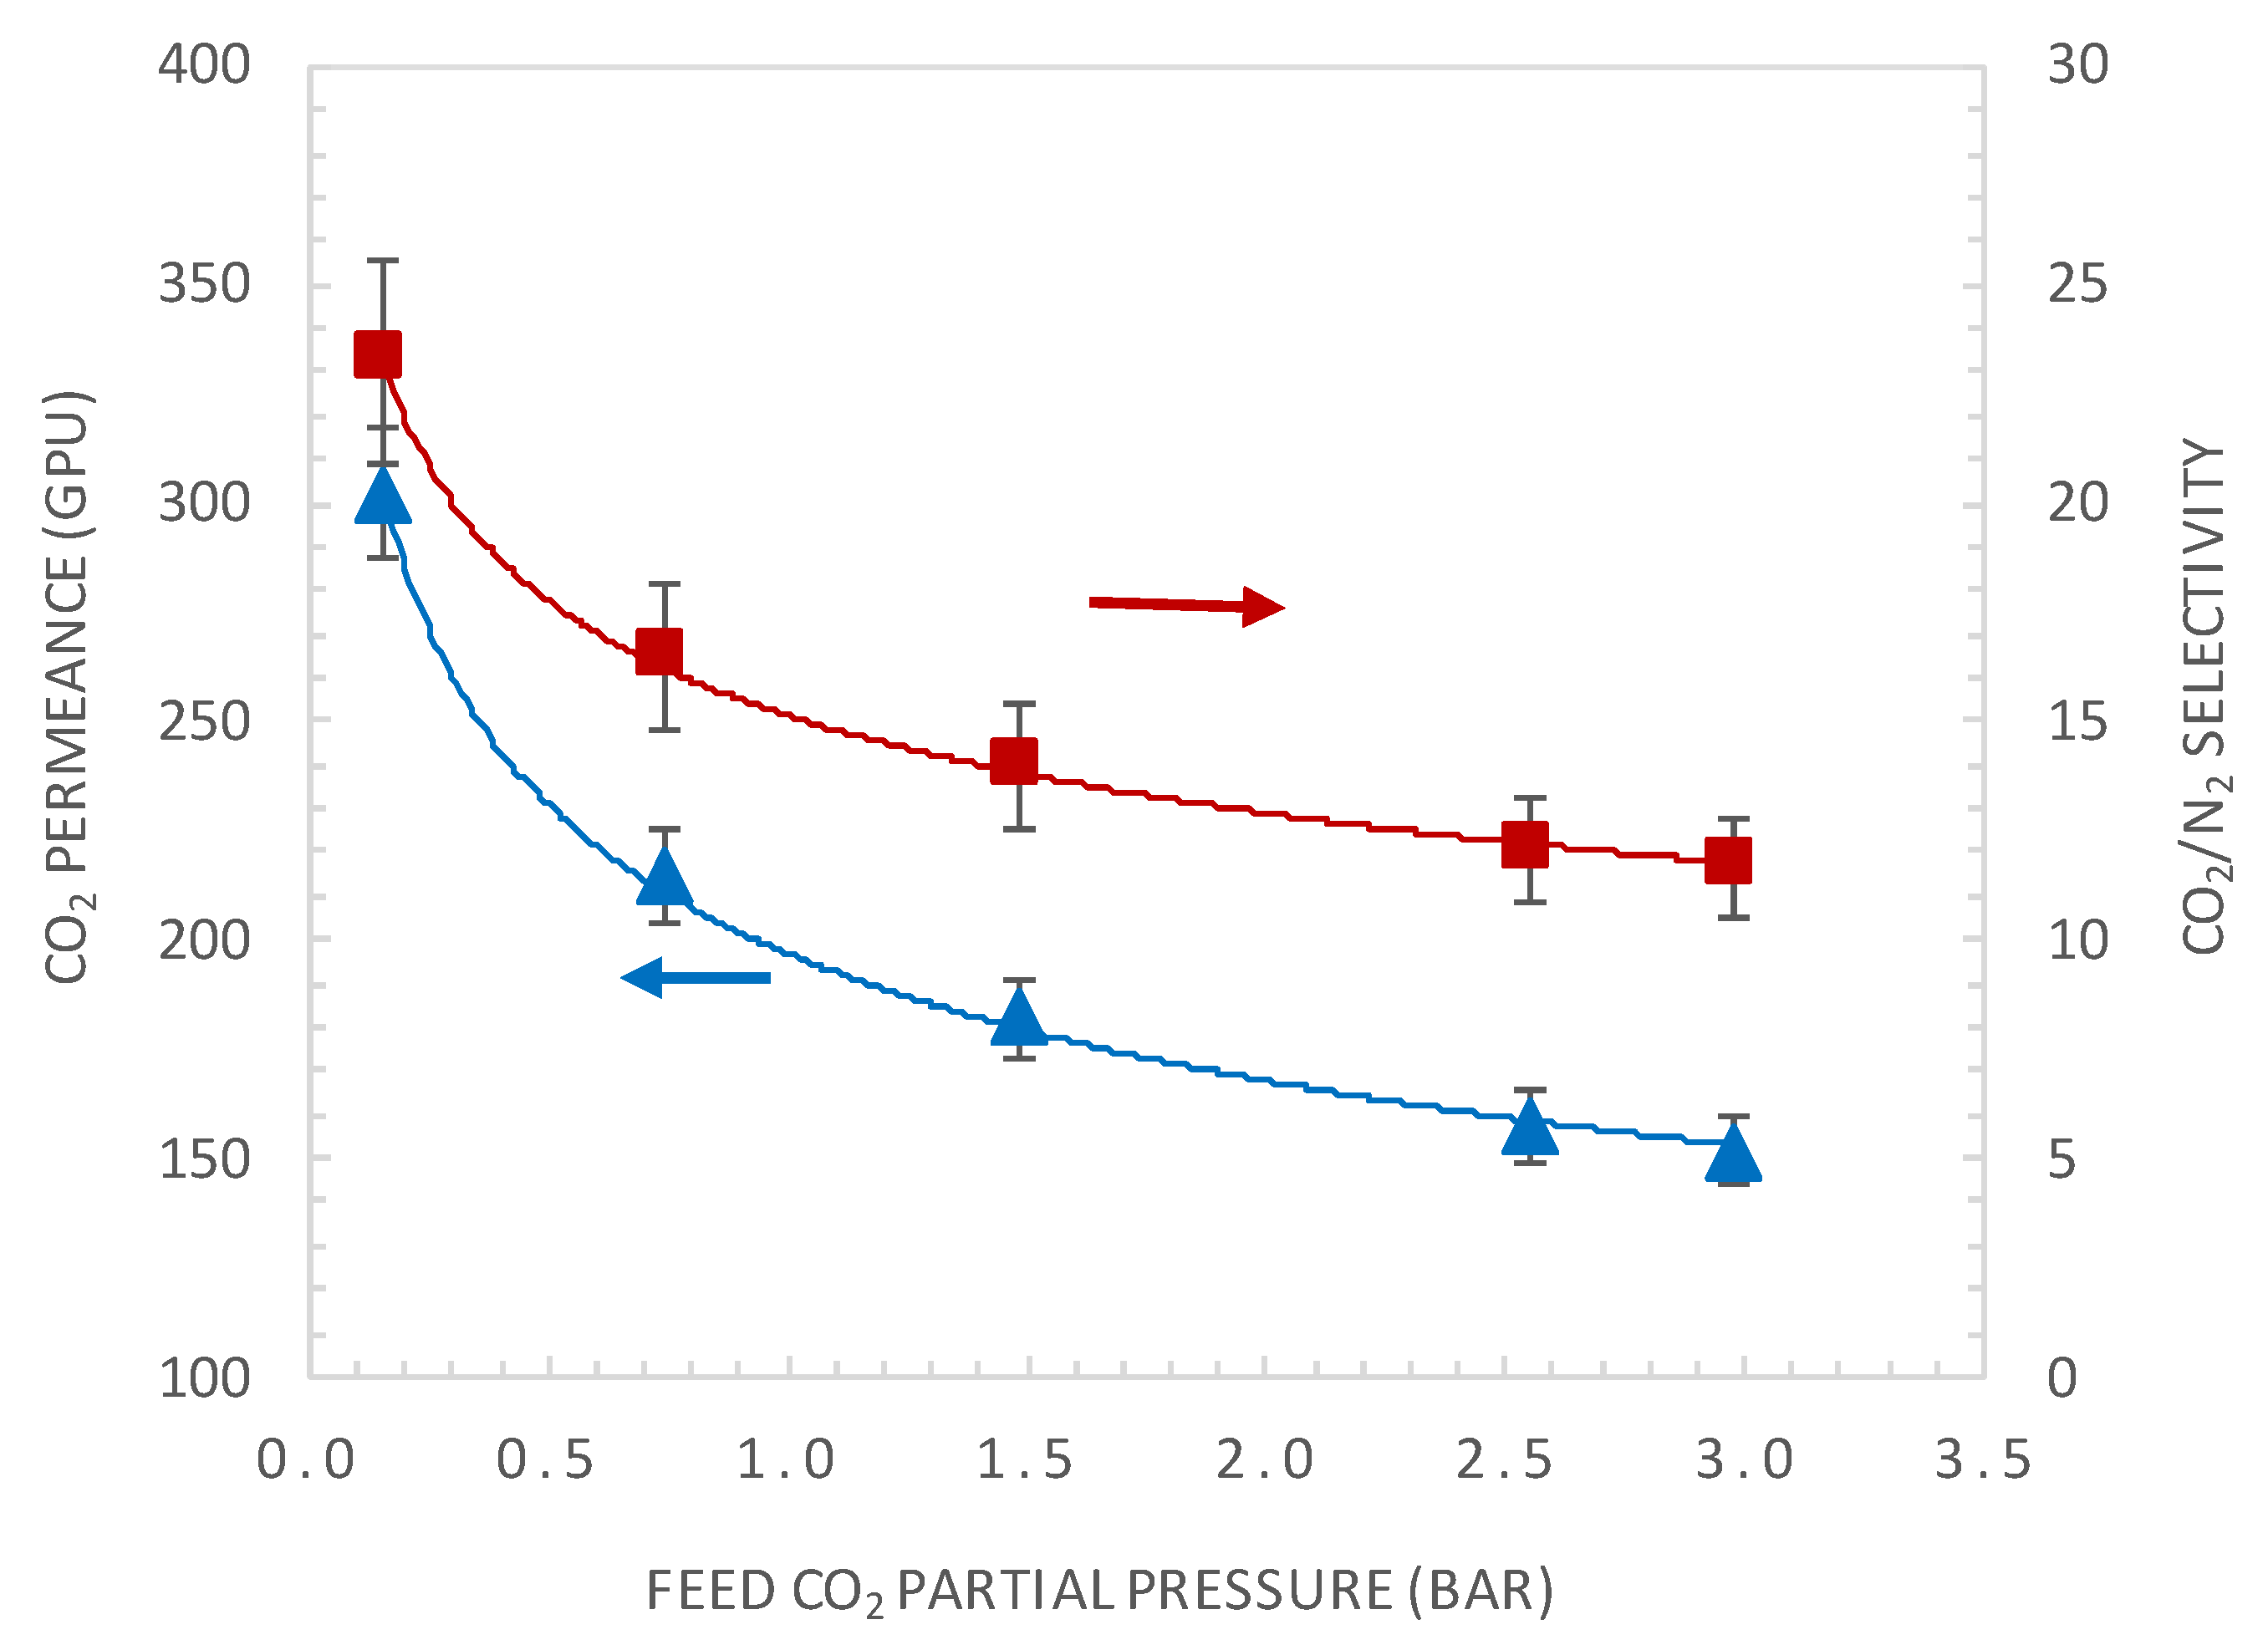
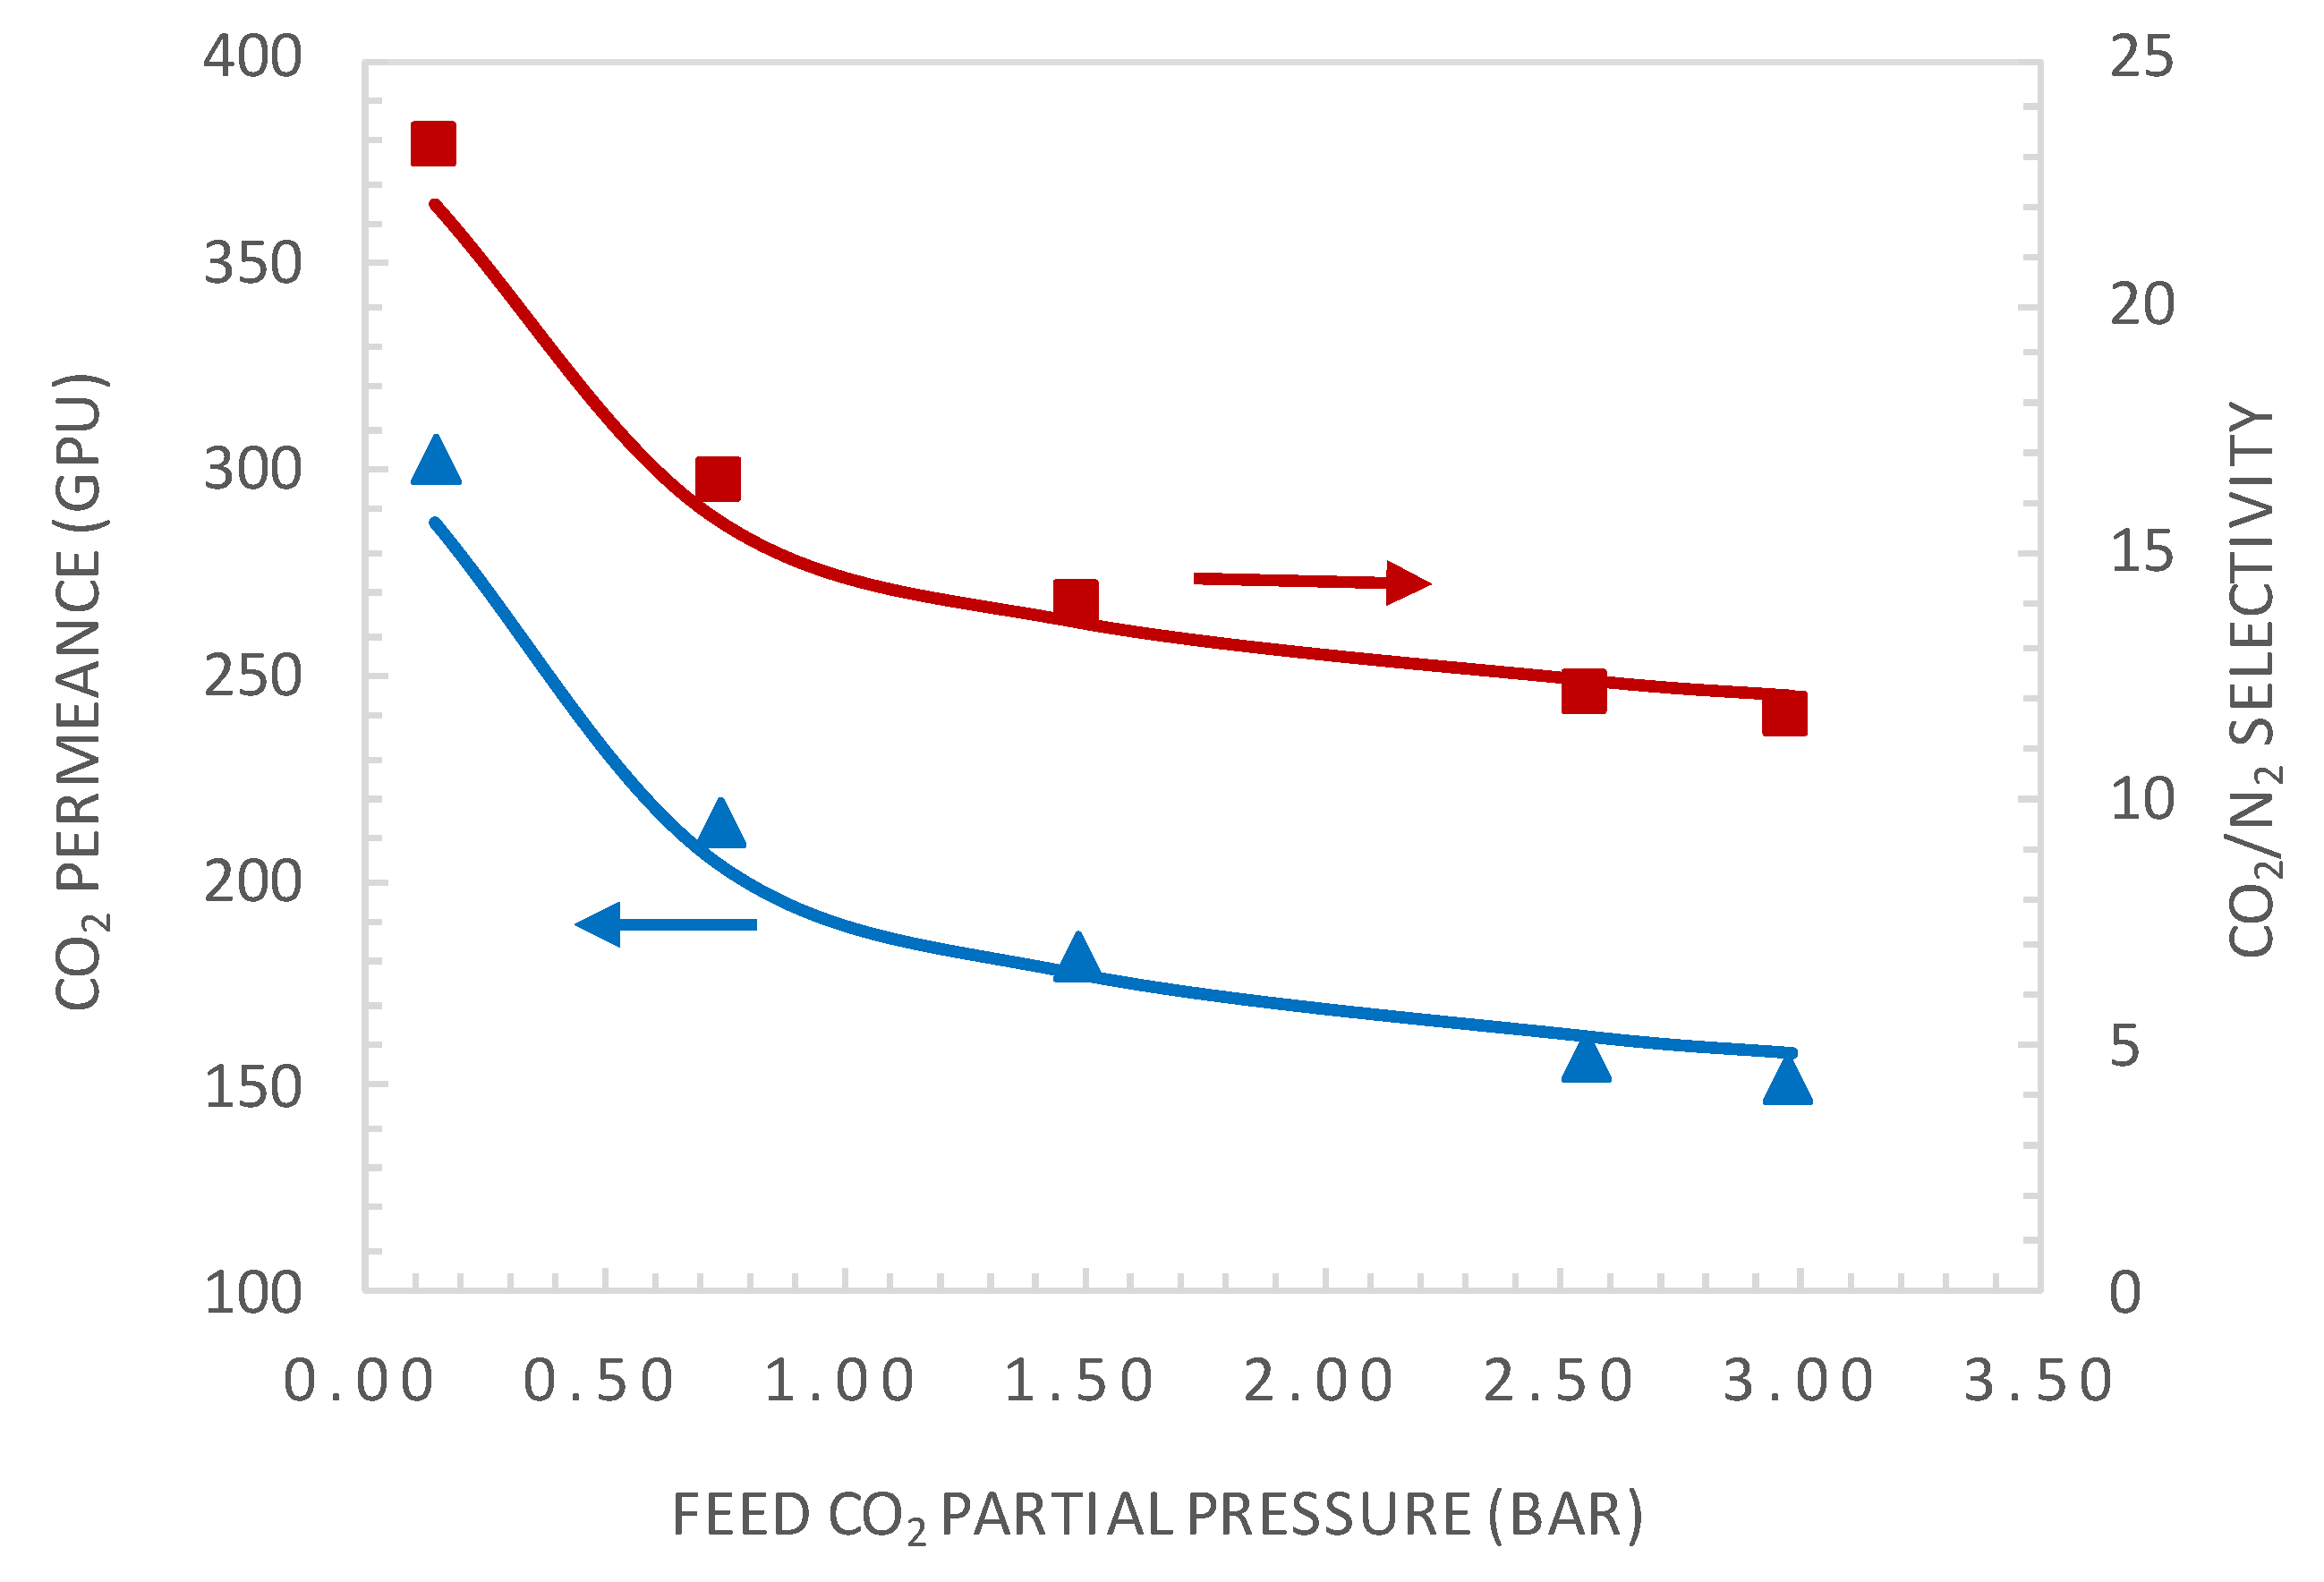
4.2. Effect of CO2 Partial Pressure

A general characteristic of facilitated transport membrane is that the CO2 permeance is pressure dependent, as the carrier is saturated under high CO2 partial pressure, resulting in decreasing CO2 selectivity over other gases. Figure 5 shows the effect of varying the CO2 upstream partial pressure on the CO2 permeance and CO2/N2 membrane selectivity. The CO2 upstream partial pressure varied from 0.15 to 3 bar with a feed relative humidity of about 85% and a temperature of 40 °C. The permeance of N2 was found to be independent from the feed pressure and has a value of 13 GPU under the investigated operating conditions. As illustrated in this figure, CO2 permeance and selectivity decrease with the feed pressure and then reach a constant value. This can be explained by the carrier saturation phenomenon [11,38]. For CO2 partial pressure of 0.15 bar, the actual membrane CO2 permeance is of 302 GPU and a CO2/N2 selectivity of 23.2.
From the above results, it can be seen that the best performances of the membrane correspond to a permeance of 300 GPU and CO2/N2 selectivity of 24. These performances are located below the upper-bound Robeson plot shown in Figure 2. The objective of the present work was to show through a dedicated combined modelling and experimental strategy if further improvement of the actual membrane performance is possible and how this could be achieved and evaluated. The results could be used to guide future experimental work.

5. Simulations: Results and Discussion

5.1. Retrieval of Key Facilitation Parameters

The physical and chemical properties of the facilitation factor can be independently measured or estimated. The analytical expression, being simple, offers the possibility to estimate some key system properties based on transport measurements and simple fitting techniques. Indeed, the analytical solution presented above can provide the basis for estimating the carrier gas complex diffusion coefficient and the reaction equilibrium constant. Assuming reaction equilibrium and a negligible CO2 downstream concentration, the analytical solution of Smith and Quinn [18], Equation (14), can be rearranged as:
( F 1 ) 1 = E = α m 1 + ( α m K ) 1 = ( D A k D , A   D A C C T ) p A + ( D A D A C C T ) K e q
Thus, by varying the solute feed concentration and measuring the permeant flux, one can calculate the facilitation factor, F, and make a plot of E = (F − l)−1 versus the solute upstream partial pressure. A straight-line relationship (as in Equation (19)) implies reaction equilibrium, i.e., diffusion-limited system (tanh λ/λ ~ 0). Deviation from a straight line indicates reaction limitations (tanh λ/λ ≠ 0). Considering the straight-line part of the curve, at a low CO2 upstream concentration, the slope and intercept can be used to determine the complex diffusion coefficient DAC and the reaction equilibrium constant Keq, respectively [19,37,38].
The total carrier concentration, CT, for the tested membrane was calculated to be 1.61 × 10⁻² mol·cm−3. This value is in accordance with the literature and among the highest values [39,40]. The CO2 permeance corresponding to the solution-diffusion mechanism, P M C O 2 S D , through the membrane was set at 145 GPU (+/−4), determined from experimental data under high permeant partial pressure corresponding to carrier saturation, conditions where CO2 flux increase is only due to the pure solution –diffusion mechanism. Indeed, we suppose that saturation occurs at 3 bars, but this is an approximation, as saturation could occur at higher pressure; indeed, a starting pseudo-plateau can be observed for pressures above 2.5 bar. The CO2 diffusion coefficient was set at a value of 1 × 10⁻⁶ cm2·s−1, which is in the range reported in the literature with respect to the order of magnitude of amine-functionalized carrier membranes [28,41,42,43,44].
Starting from the value of CO2 permeance in the SD mechanism and the value of the CO2 diffusion coefficient, the CO2 sorption coefficient, kd, can be calculated according to the following equation:
C O 2 S D = k D , C O 2 D C O 2 = P M C O 2 S D e .
For our system, we found a value of kd = 4.84 × 10⁻⁵ moL·cm−3·bar−1, which is comparable to values from the literature for amorphous polymers [45].
Thanks to the measurement of the CO2 permeabilities, it is possible to calculate an experimental facilitation factor according to the following equation:
F e x p = P M C O 2   P M C O 2 S D .
The plot of E = (F − l)−1 versus upstream CO2 partial pressure is shown in Figure 6.
Applying the analysis exposed above (Equation (7)), which is valid at very low CO2 partial pressures, a straight-line fitting curve in this range (<1.5 bar) is plotted and added in Figure 6. Thus, the slope and the intercept of this line are used to estimate the complex diffusion coefficient and the reaction equilibrium constant, respectively.
The retrieved value of DAC is found to be equal to 1.7 × 10⁻⁹ cm2·s−1, which is about one order of magnitude lower than that reported in the literature for CO2-amine complex. In an ion exchange membrane with ethylene diamine as a carrier [41], a value of about 9.7 × 10⁻⁹ cm2·s−1 was estimated. Cussler [15] showed that for fixed-site carrier membrane or “chained carrier” membrane, the order of magnitude of the apparent diffusion coefficient of the reaction complex is 10−8 cm2·s−1. This can explain the low permeance value even if the value of CT is relatively high compared to typical values from the literature. The retrieved reaction equilibrium constant Keq is 5.2 × 104 cm3·moL−1. It is found to be in accordance with typical values for the amine−CO2 reaction from the literature [41,46]. The value of the reverse reaction constant, kr, was set at 110 s−1, similar to typical values from the literature for the CO2–amine reaction [28,47,48].

5.2. Comparison of Experimental and Simulation Results

Table 4 summarizes the properties of the membrane used for the modelling analysis.
From the predicted facilitation factor, the permeance of CO2 and CO2/N2 selectivity is calculated, respectively, as follows:
P M C O 2 = F   × P M C O 2 S D
α = P M C O 2   P M N 2 .
The experimental and modelling results are compared in terms of the facilitation factor, CO2 permeance, and CO2/N2 selectivity as a function of the CO2 upstream partial pressure in Figure 7 and Figure 8, respectively.
The simplified equilibrium model, which assumes reaction equilibrium and negligible CO2 permeate pressure (Equation (2)), shows good agreement with the experimental results at low feed CO2 partial pressure, as expected. However, it diverges for higher values of the feed CO2 partial pressure. Both the equilibrium model and general model show good agreement with the experimental results in the whole investigated CO2 feed pressure range, with a maximum deviation between the experimental and predicted values below 5%. Figure 8 shows the comparison of CO2 permeance and CO2/N2 selectivity between the general model prediction (Equation (13)) and experimental values. These results again demonstrate the good fitting ability of the general model.
For the sake of analysis, the dimensionless facilitated transport parameters for the actual membrane were calculated for two limits of the investigated range of upstream CO2 partial pressure: PCO2 = 0.15 bar and 3 bar. The results are given in Table 5.
The value of tanh λ/λ, in Equation (13), is a measure of solute facilitated transport. In the operating conditions of the experiments, the values of tanh λ/λ were all lower than 3 × 10⁻³, indicating that the system is operating near the reaction equilibrium regime or diffusional limitation regime. This indicates that, under the actual operating conditions, the facilitation factor is already at its maximum for the actual membrane composition and selective layer thickness. For the actual membrane system, the values of K calculated for the two limits of the upstream CO2 partial pressure lie globally within the optimal values range [1.5–10], predicted by the substantial numerical parametric analysis of Kemena et al [24,28,38].
The calculated ε was below 0.01, indicating again that compared to the reaction rate, the diffusion rate of the reaction complex was the rate-controlling step of the overall CO2 transport across the membrane. This also means that there might be room for membrane separation performance improvement by modifying the value of ε and the mobility ratio αm. These modifications can be examined by analyzing the effect of the membrane selective layer thickness and the initial carrier concentration in the membrane, CT, on membrane performances.

5.3. Parametric Analysis

For the same combination of carrier and key permeant (here CO2), improvement of the membrane performance can possibly be achieved by the modification of the total carrier concentration, CT, the selective layer thickness, δ, and/or the operating parameters, such as temperature (T), CO2 partial pressure (pCO2), and relative humidity (RH). The membrane selective layer thickness and carrier concentration are two key characteristics that can be modified in order to improve performances, but their effects on CO2 permeability and selectivity are not trivial [22,24]. In this section, a parametric analysis is achieved in order to show if improvement of the actual membrane performance is theoretically possible. The effect of the membrane selective layer thickness and total carrier concentration was evaluated through a parametric analysis, using the general model solution (Equation (13)), presented in the previous section. The membrane selective layer thickness and total carrier concentration were varied around their actual values of 1 µm and 1.61 × 10⁻²moL·cm−3, respectively.
The permeability of N2 as well as the SD CO2 permeability were kept constant at the experimentally measured values of 13 and 145 Barrer, respectively, regardless of the total carrier concentration inside the membrane and CO2 upstream partial pressure. The SD permeance for a given membrane thickness was then calculated according to Equation (20). From the predicted values of the facilitated factor, the permeance of CO2 for a given membrane thickness was calculated according to Equation (22).

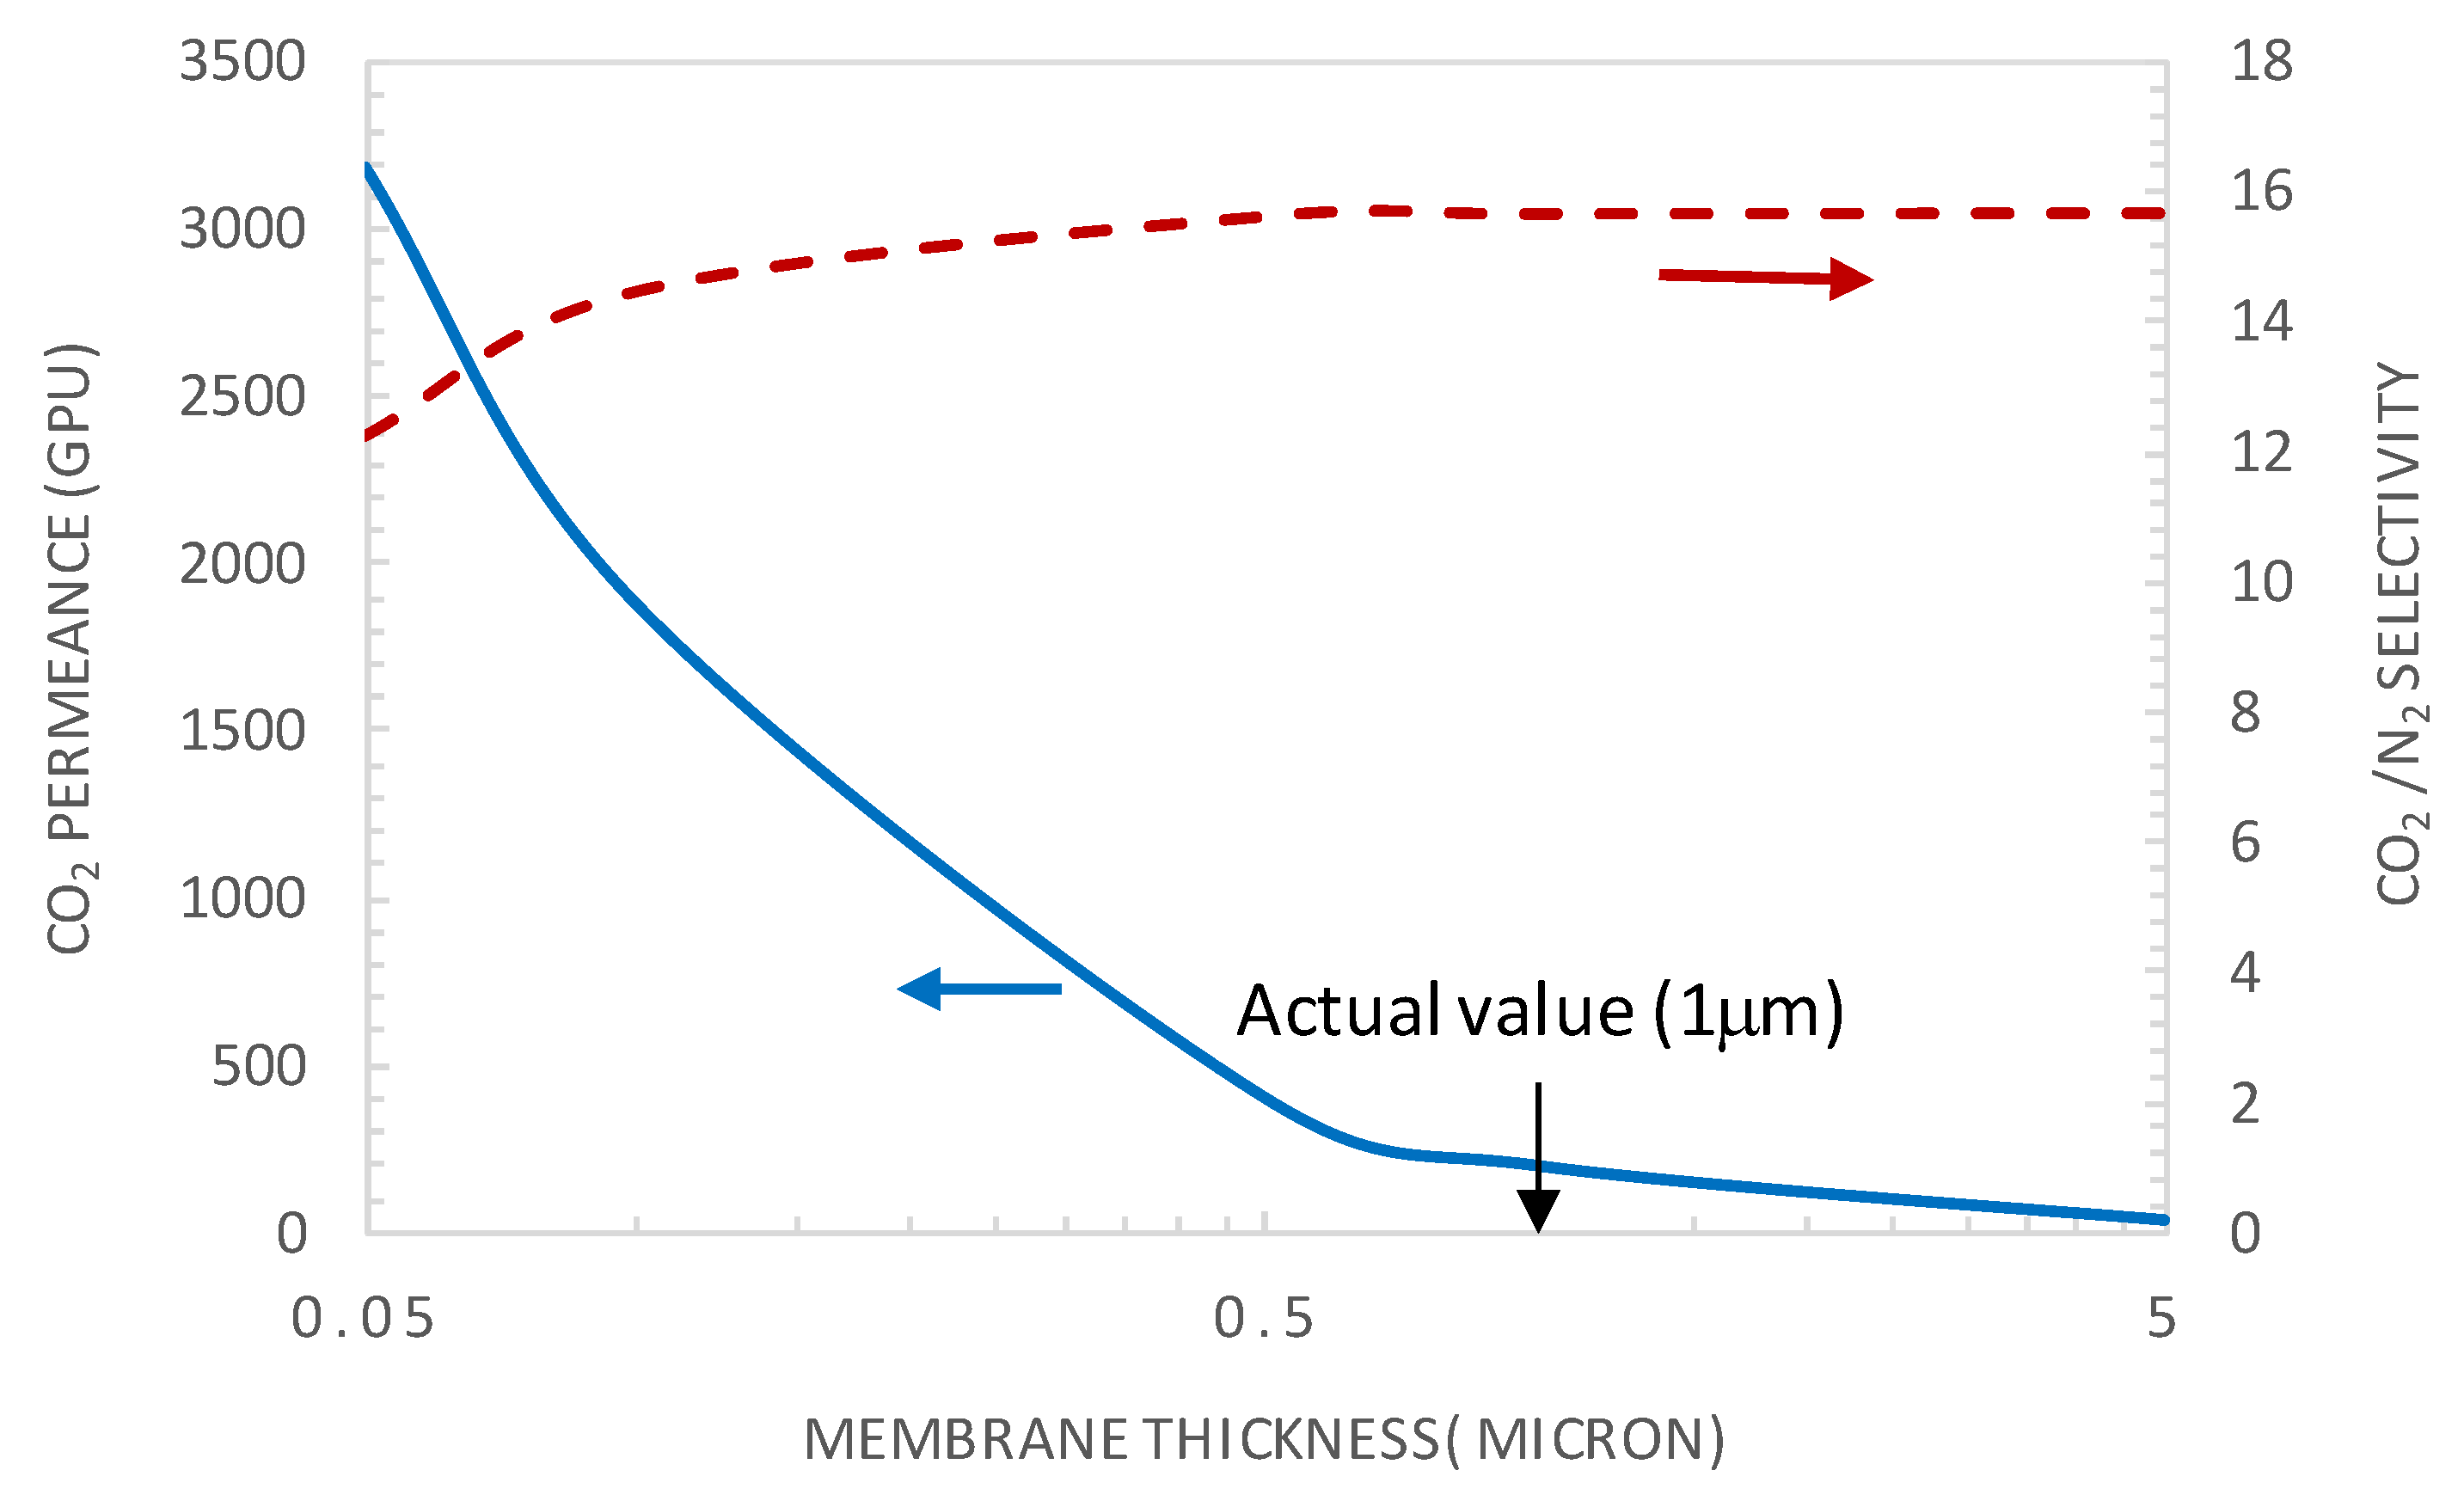
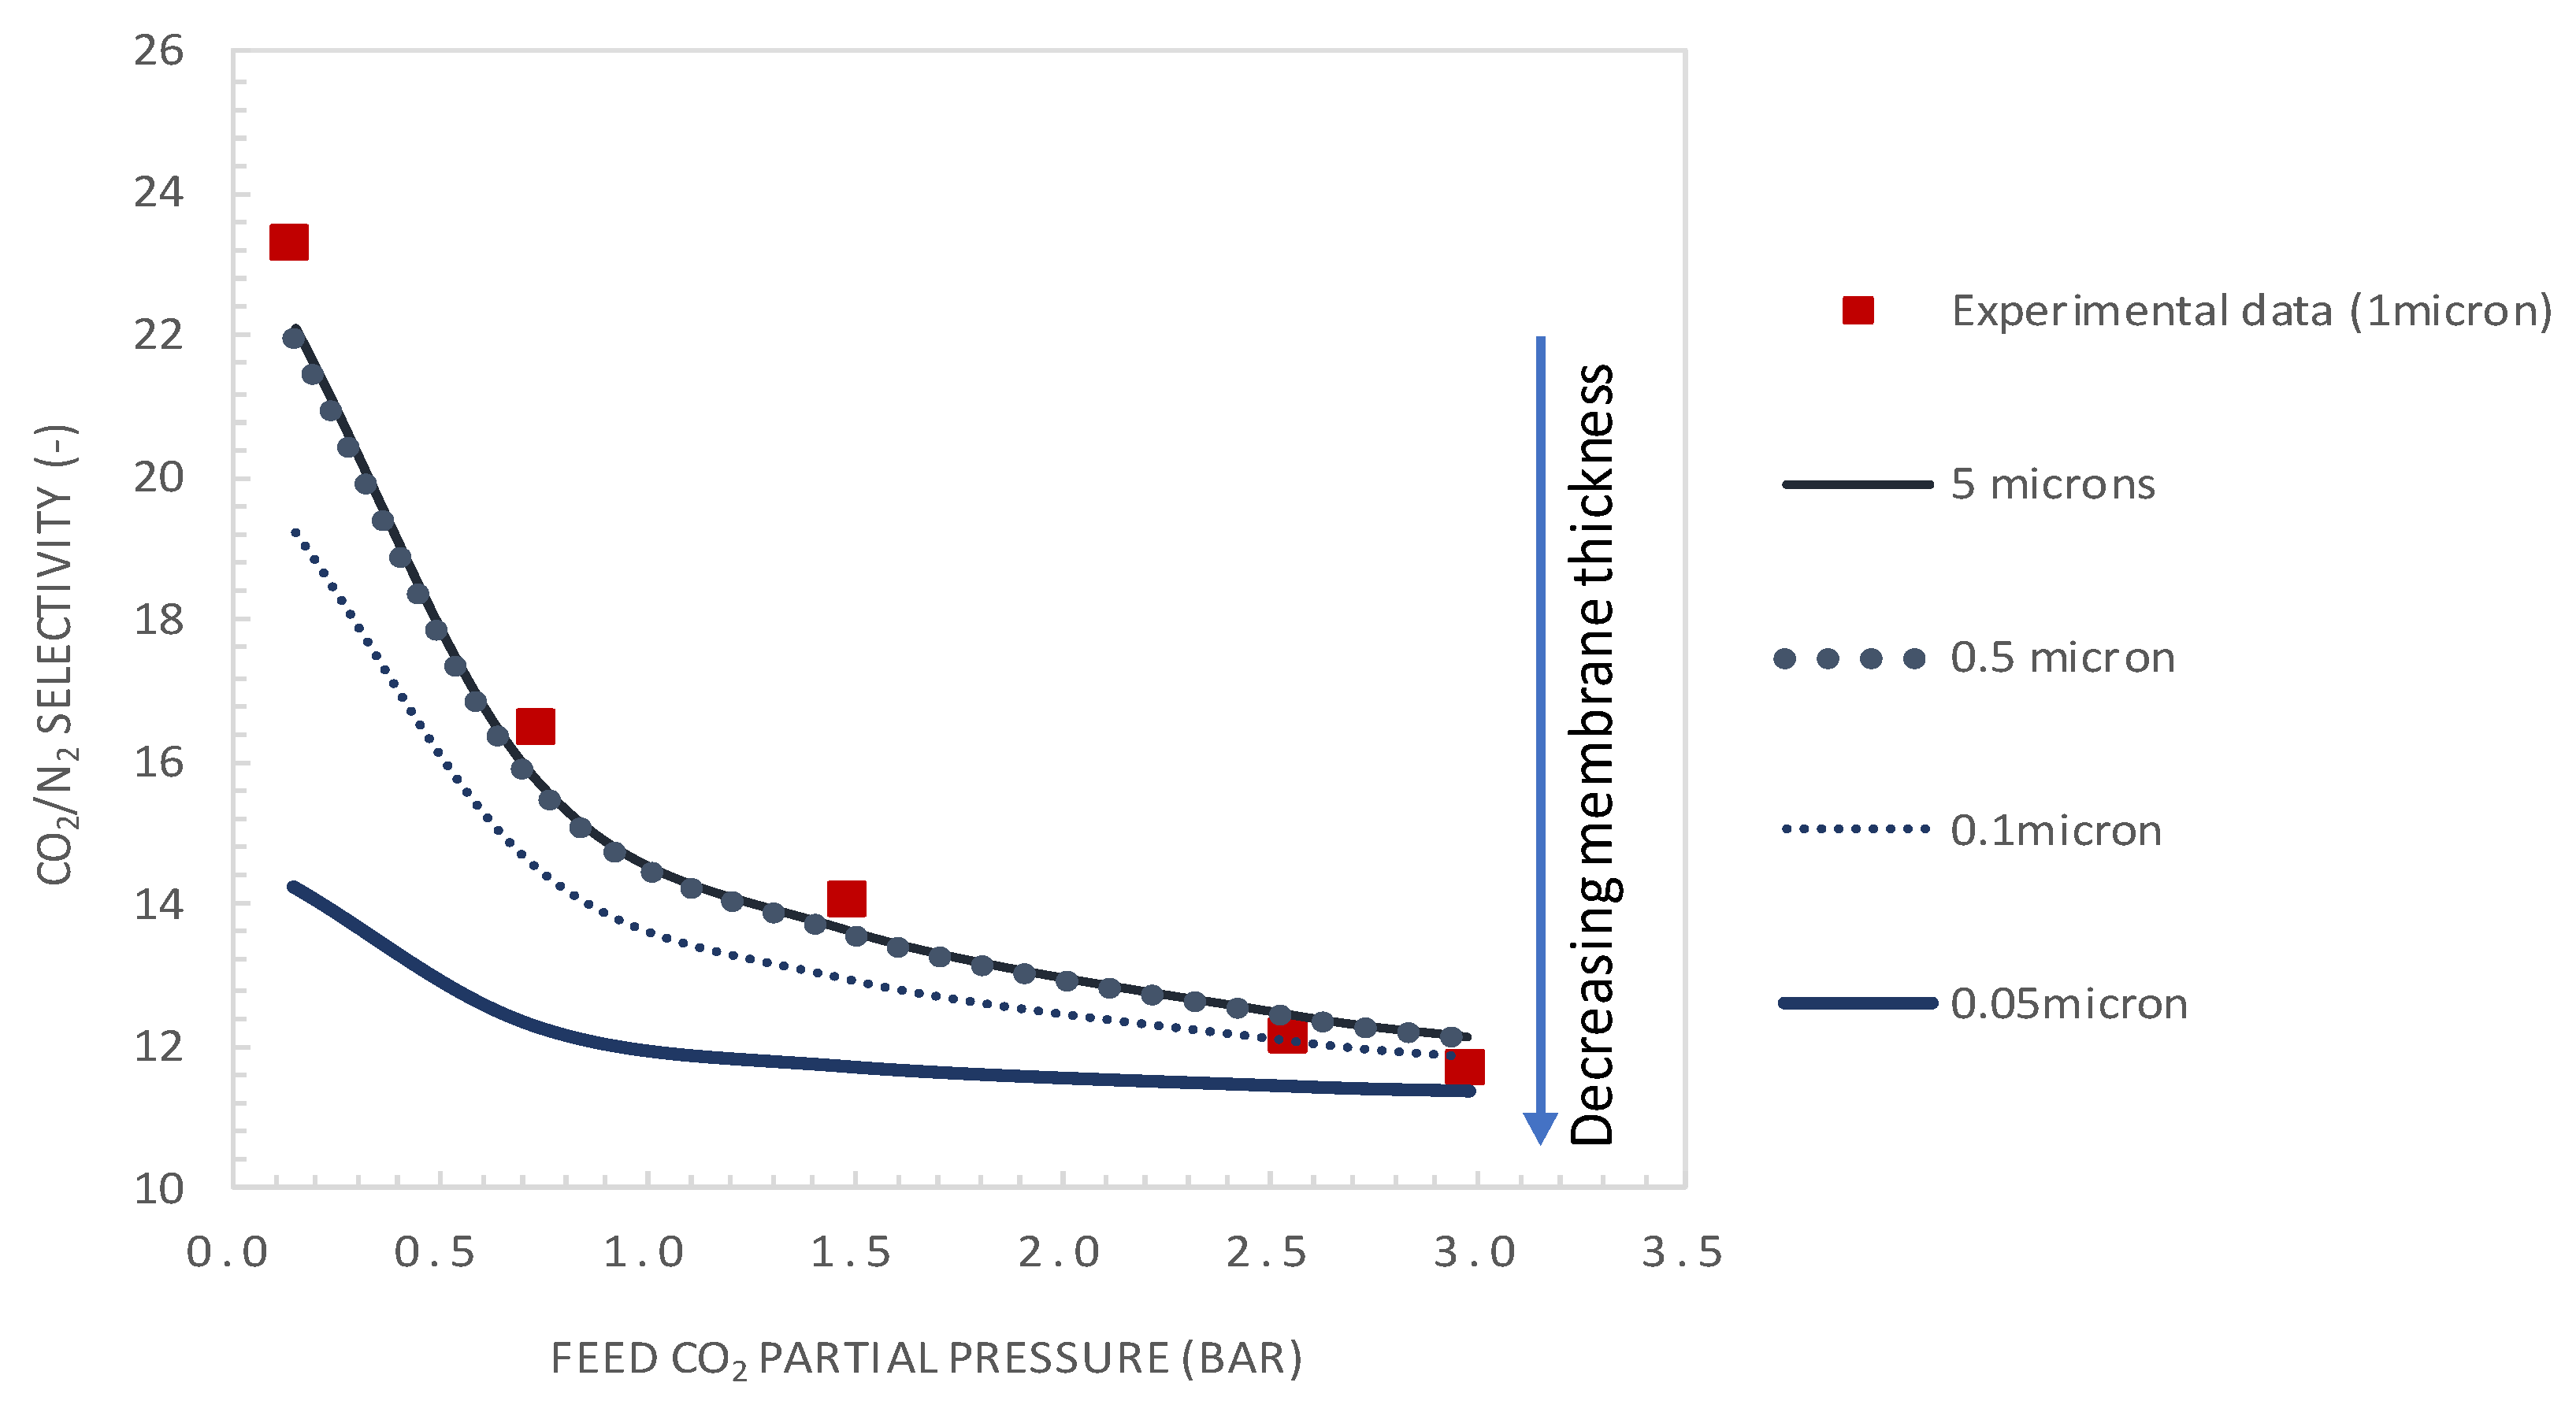
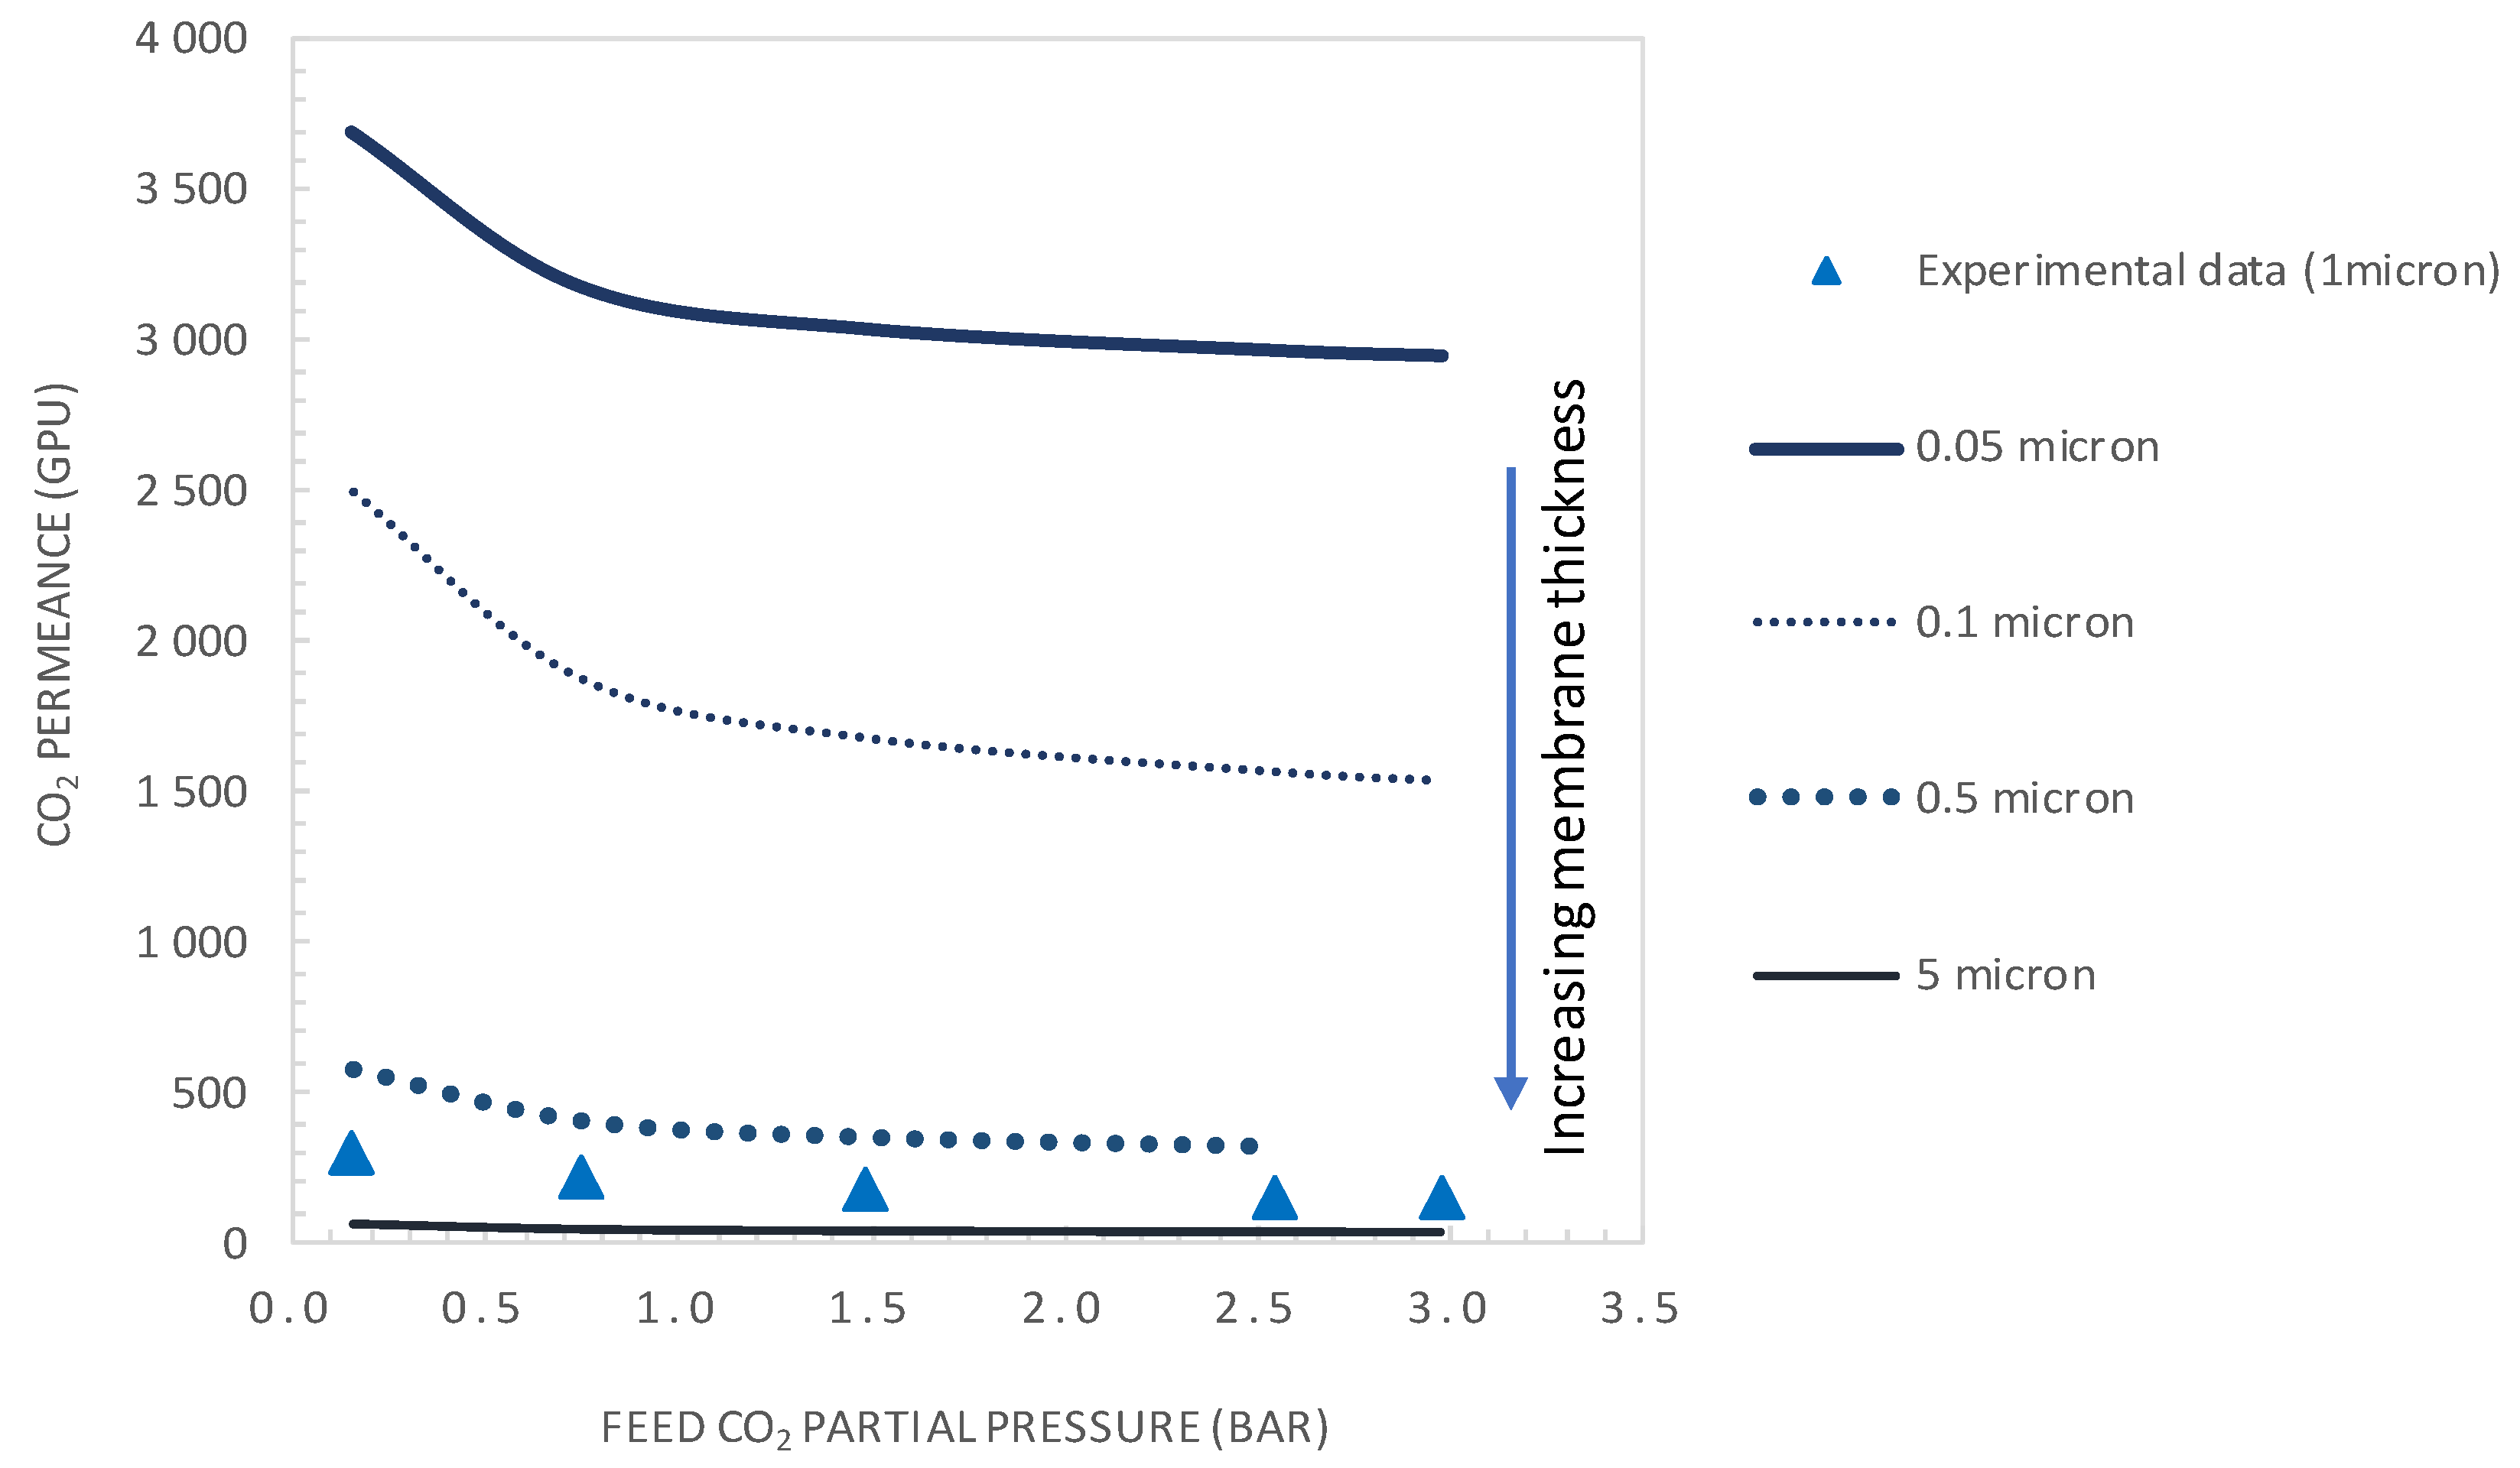
5.3.1. Effect of Membrane Thickness

The analytical expression of the facilitation factor clearly indicates, from the definition of ε, the thickness dependence of the facilitation factor. Figure 9 shows the variation of the CO2 permeance and CO2/N2 selectivity with the membrane thickness for a CO2 partial pressure of 0.75 bar. Indeed, considering that the CO2 concentration in the feed gas car varies depending on the emission sources, from 5% (natural gas turbine exhaust) to 30% (steel plant or oxygen enriched air flue gas), and that the flue gas can be pressurized to about 4 bar, a CO2 partial pressure of 0.75 bar was taken as an average value.
The selective layer thickness varied in the range 0.05–5 μm. The results in Figure 9 show that the permeance decreases monotonically with increasing membrane thickness. This trend can be explained by the fact that the mass flux through a membrane is inversely proportional to the selective layer thickness. On the contrary, the selectivity shows an increasing trend with an increasing selective layer thickness. Actually, the species diffusion becomes more limiting relative to the reaction, translating into decreased ε values, as the latter is proportional to the inverse of the square of the membrane thickness. Consequently, the facilitation effect and CO2/N2 selectivity increase with an increased selective layer thickness.
Moreover, from Figure 9, it is clear that there is no benefit from increasing the membrane thickness above the actual value of 1 µm, as CO2 permeance will deplete without any substantial positive effect on membrane selectivity. Decreasing the membrane selective layer thickness from the actual value to a value around 0.1 µm permits a significant increase of the CO2 permeance without a significant effect on membrane selectivity. As an example, for a membrane thickness of 0.1 µm and CO2 upstream partial pressure of 0.75 bar, a CO2 permeance of 1880 GPU can be reached while maintaining the selectivity at a value of about 14.47. These performances are already located on the upper bound of the Robeson plot. It is found that the actual value of ε is of about 10−3, indicating that the system is under a diffusional limitation regime and experiences the maximum facilitation factor and membrane selectivity [22]. This explains why an increase in membrane thickness above the actual value has no benefit on membrane selectivity as shown in Figure 9.
Figure 10 and Figure 11 show the variation of CO2/N2 selectivity and CO2 permeance as a function of the CO2 partial pressure, respectively, for different values of membrane thickness. First, it can be seen that the increase of the membrane thickness above the actual value of 1 µm results in an insignificant improvement of the membrane selectivity (see Figure 10). Furthermore, decreasing the membrane thickness below the actual value to 0.1 µm has a negligible effect on the membrane selectivity and a positive effect on the CO2 permeance (see Figure 11). Moreover, the calculated values of tanh λ/λ are below 0.1, indicating that the system is near reaction equilibrium and thus near the maximum facilitation factor, explaining the negligible effect of increasing the selective layer thickness on membrane selectivity. As an example, for a membrane thickness of 0.1 µm and CO2 upstream partial pressure of 0.15 bar, a CO2 permeance as high as 2500 GPU can be attained while maintaining the selectivity at a value of about 19. These performances are interestingly above the Robeson upper bound for CO2/N2 separation. These results highlight the thickness dependence characteristic of the facilitation factor, which has rarely been reported in the literature [10,27]. Generally, the facilitation factor does not directly correspond to absolute permeate flux or capacity. Increasing the membrane thickness (i.e., decreasing ε) will continuously increase F toward its maximum value. However, the permeate solution diffusion flux (the denominator in F) decreases as the membrane thickness increases. Moreover, the maximal facilitation factor will give the reader a measure of the best selectivity obtainable for a given set of operating conditions, and this has to be weighed along with the permeate flux obtained when designing such a system [24]. Consequently, in order to increase the selectivity of the investigated membrane system, the modifications could be achieved by increasing the mobility ratio through increased carrier solubility or/and amine-carrier complex diffusivity. The effect of the total carrier concentration modification on the membrane performances is analyzed and discussed in the next section.

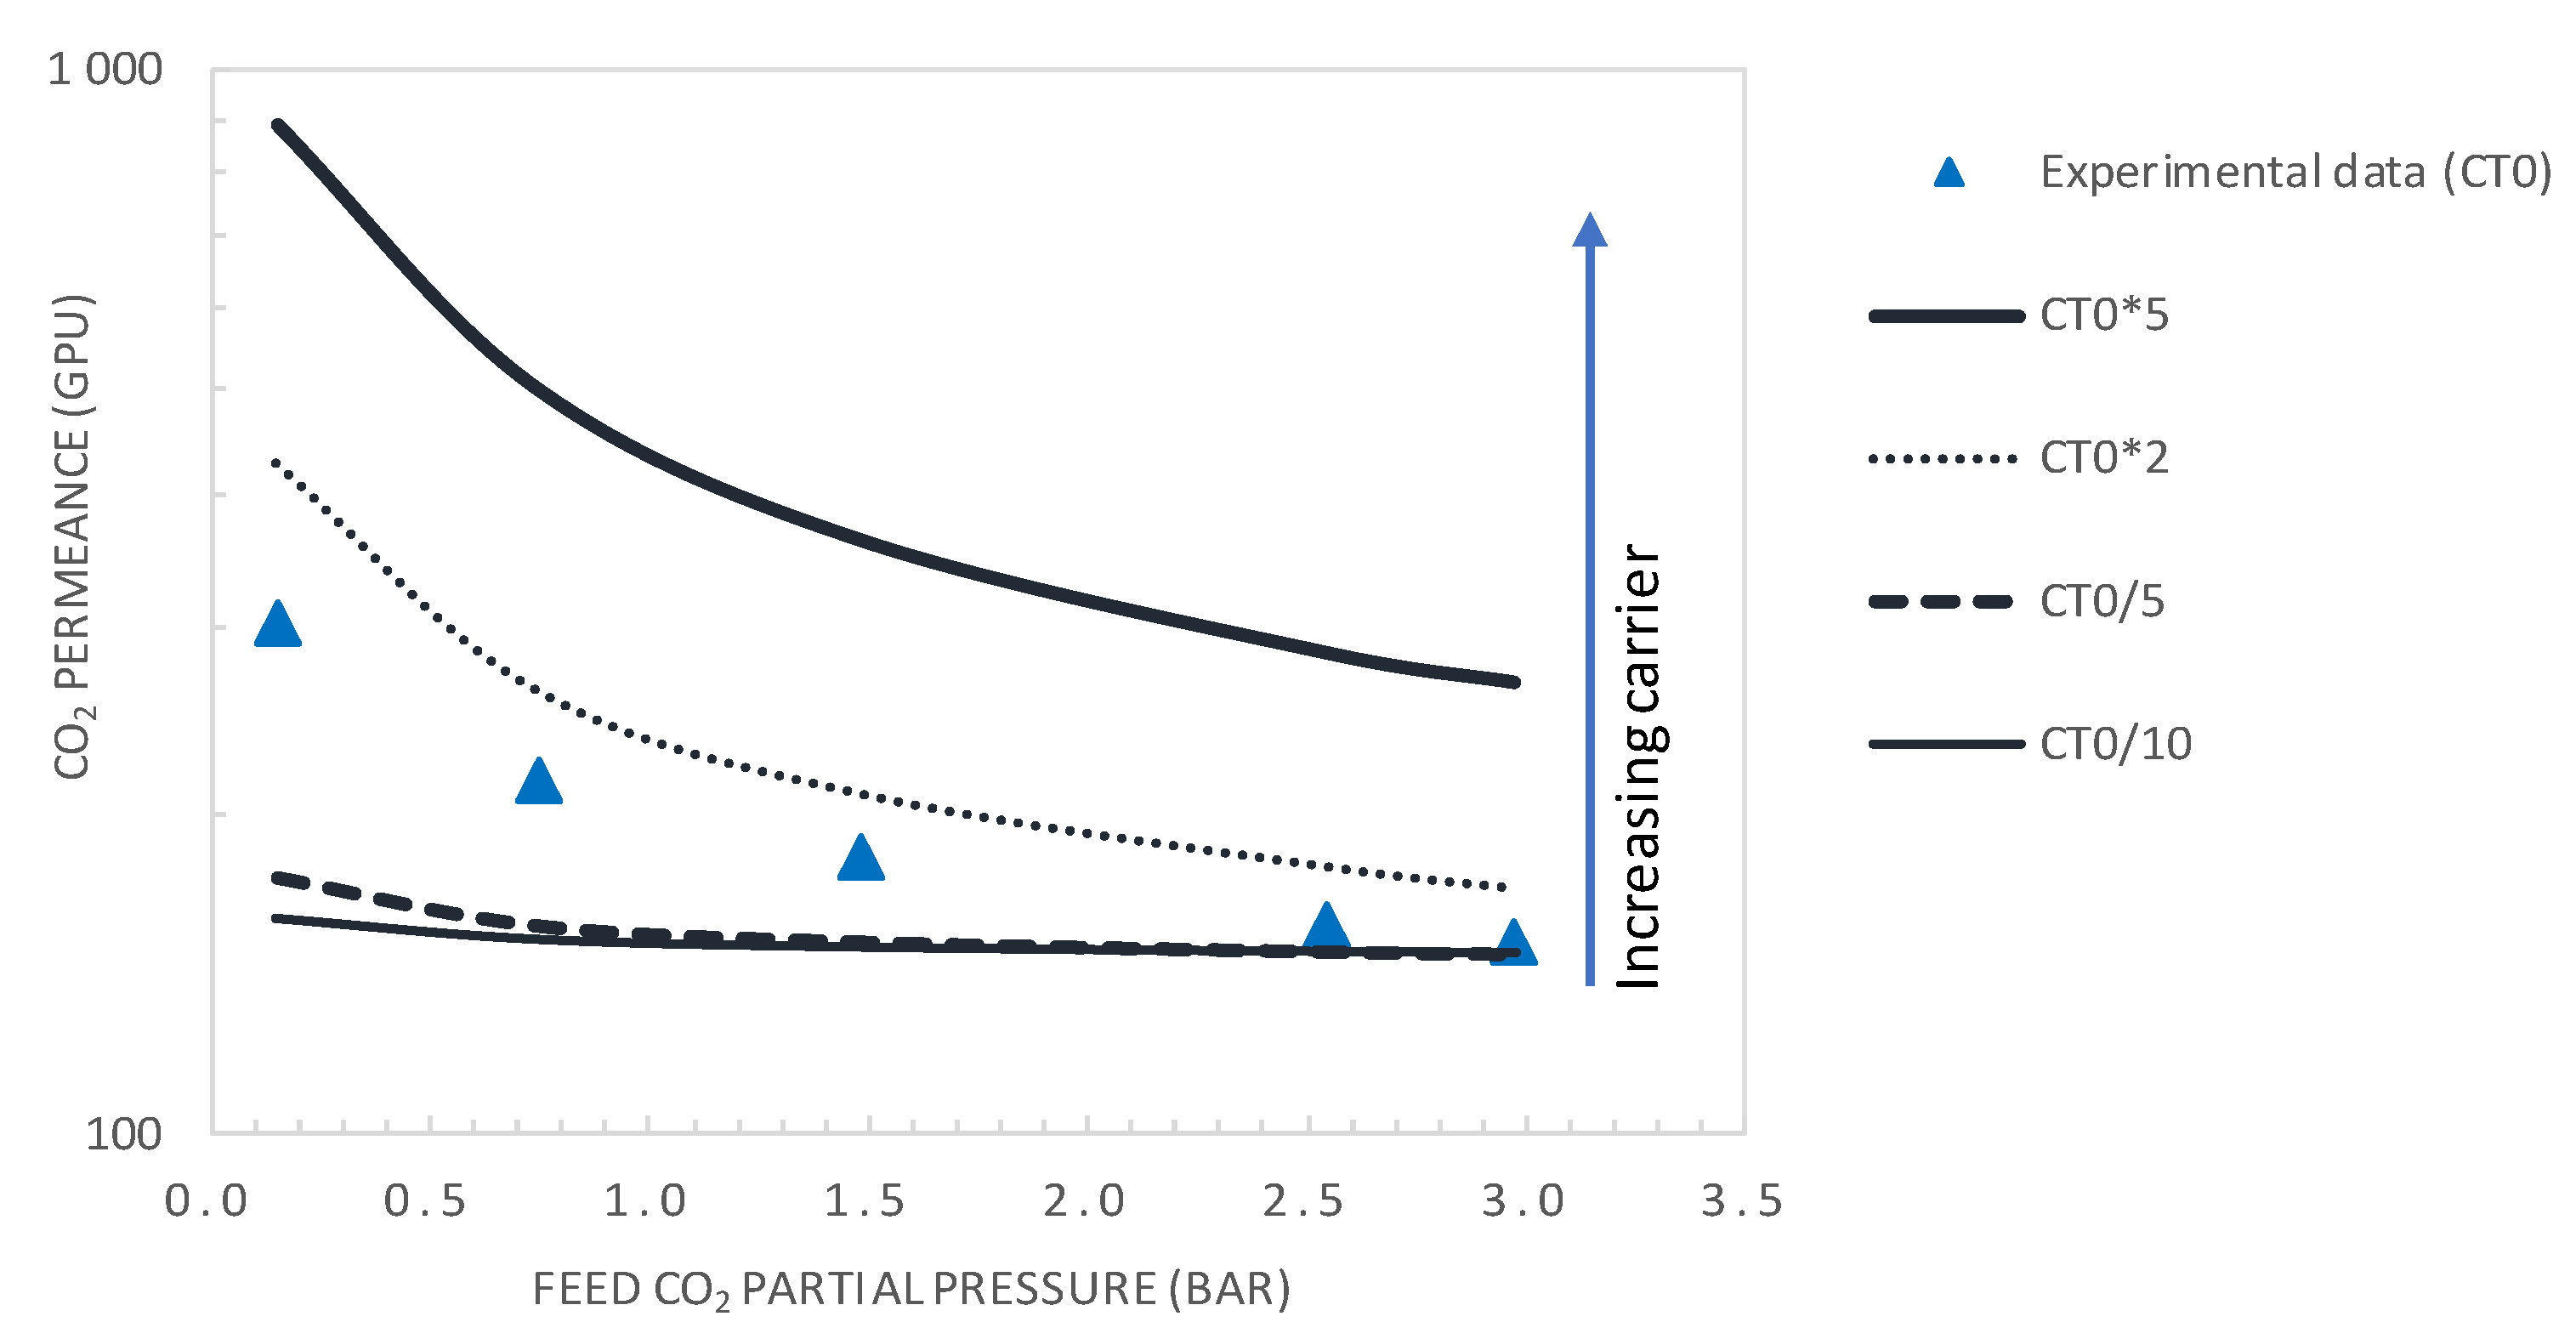
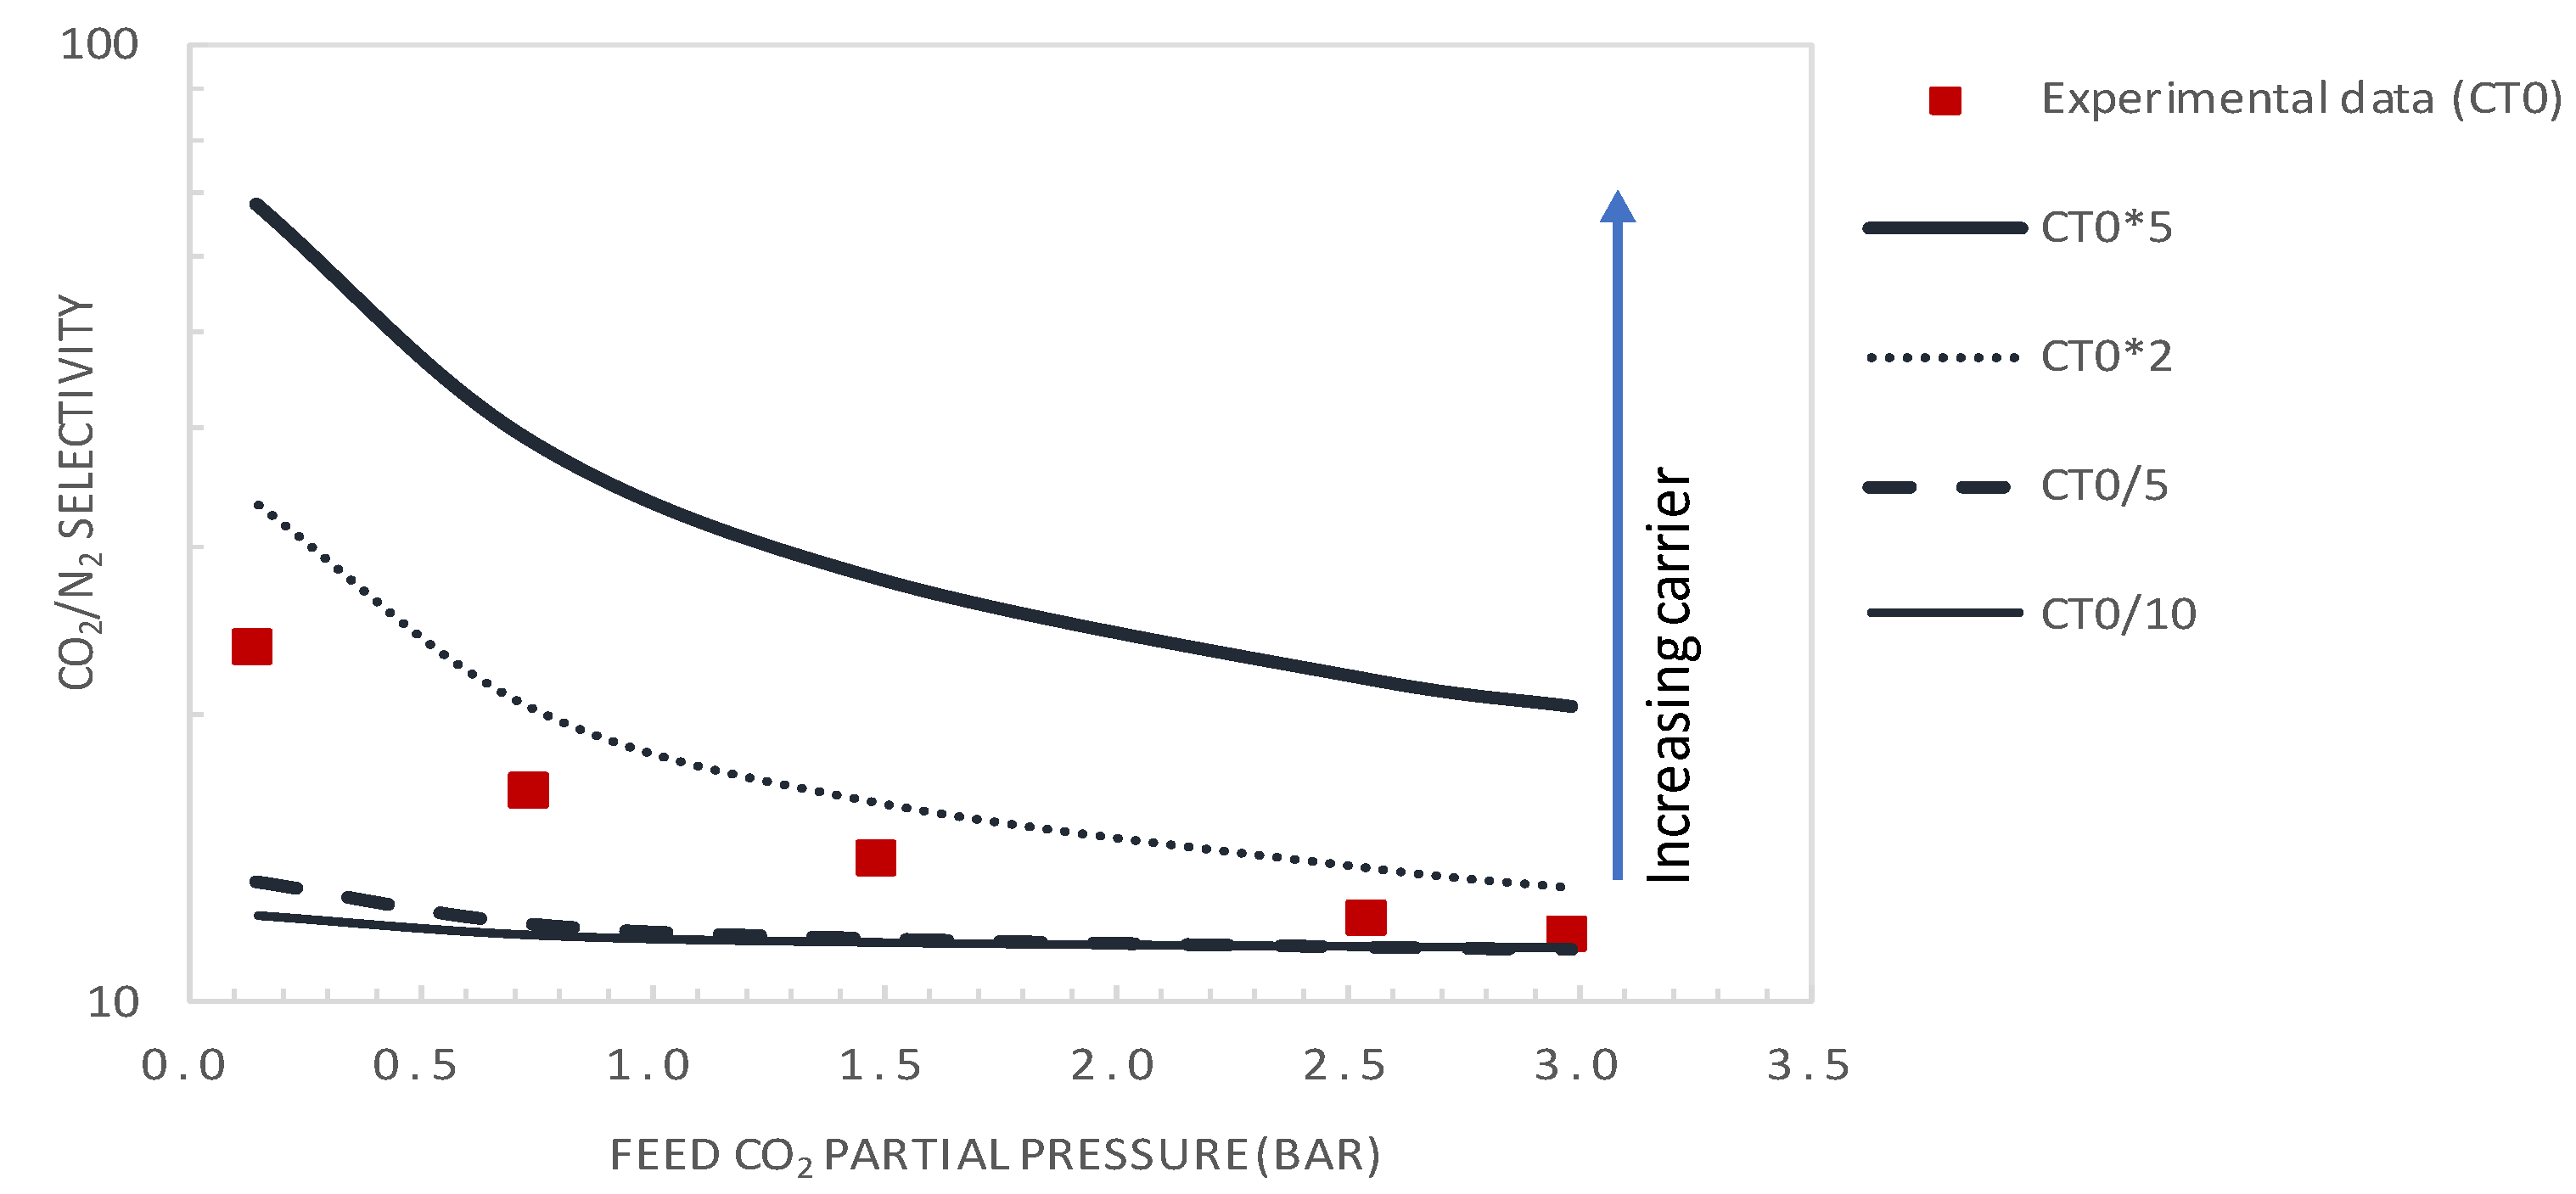
5.3.2. Effect of Carrier Concentration

The facilitation factor is a function of the mobility ratio αm, which depends on the ratio (DAC/DA) of the diffusion coefficient of the CO2-amine reaction product to that of CO2 inside the membrane and on the initial carrier concentration, CT, for a given CO2 upstream partial pressure. Figure 12 shows the variation of CO2 permeance and CO2/N2 selectivity with the total carrier concentration for a CO2 partial pressure of pCO2 = 0.75 bar. The carrier concentration was varied around the actual value of 1.61 × 10⁻² mol·cm−3, noted as CT0 in Figure 12. The permeance and selectivity were found to increase linearly with an increasing total carrier concentration. This trend can be explained by the fact that an increase in the mobility ratio, αm, with the total carrier concentration induces an increase in CO2 facilitation transport. Many authors have shown experimentally that the facilitated flux increases linearly as a function of the carrier concentration through different FTMs [41,49,50]. The concentration of carriers in the membrane matrix can be increased by the addition of mobile carriers [30].
Figure 13 and Figure 14 show the evolution of the CO2/N2 selectivity and CO2 permeance as a function of the upstream CO2 partial pressure, respectively, for different values of the initial carrier concentration. As expected, the results indicate that increasing the CT significantly increases the CO2 permeance and membrane selectivity. As an example, for a CO2 partial pressure of 0.15 bar, increasing the carrier concentration by a factor of 2 or 5 will significantly increase the membrane performance from its actual performance (PMCO2 = 302 GPU and αCO2/N2 = 23.2), to PMCO2 = 429GPU and αCO2/N2 = 33 or PMCO2 = 891 GPU and αCO2/N2 = 69, respectively. These performances are above the Robeson upper bound of the CO2/N2 pair.
It is expected that decreasing the selective layer thickness to 0.1 μm together with doubling of the total carrier concentration will shift the membrane performance far above the Robeson upper bound for the CO2/N2 pair. However, it is worth noticing that the product CT*DAC affects the mobility ratio, αm, and thus the value of the facilitation effect. An increase in CT could be offset by a decrease in DAC, subsequent to the change in membrane morphology, as pointed out in the theoretical analysis of Noble [25]. Such a decrease in DAC with carrier loading has been reported in the literature for O2 transport by Tsuchida and co-workers [25]. Moreover, on the one hand, an increase of the carrier concentration increases CO2-amine complex formation. On the other hand, the salting-out effect might occur at a high carrier concentration. Under these conditions, the formed ionic species (e.g., carbamate, bicarbonate or zwitterion) tend to surround the carrier and the polymeric chain, making it difficult for CO2 molecules to access the carrier, depleting CO2 solubility and reaction complex diffusion through the membrane [10]. The result of the two opposite effects indicates that an optimal carrier concentration exists. The occurrence of an optimal amine concentration has also been observed experimentally for CO2 facilitated transport [51,52,53].

6. Conclusions

Based on combined transport measurement and modelling methods, the key membrane system properties were retrieved, and pathways for membrane performance enhancement through chemical and structural modifications (i.e., membrane selective layer thickness and total carrier concentration) were proposed. Experimental measurement of CO2 and N2 fluxes through a PAA-PVA-GO hybrid fixed-site carrier membrane under different operation conditions was performed. The effects of the humidity content and the CO2 partial pressure were investigated. The values of the CO2-amine reaction product diffusivity and the reaction equilibrium constant were found to be equal to 1.7 × 10⁻⁹ cm2·s−1 and 5.2 × 104 cm3·mol−1, respectively. For a CO2 partial pressure of 0.15 bar, the actual membrane CO2 permeance was 302 GPU and CO2/N2 selectivity was 23.2, performances that were below the well-known Robeson upper bound. The comparison of experimental results and the analytical model predictions showed very good agreement. The major conclusions can be summarized as follows:
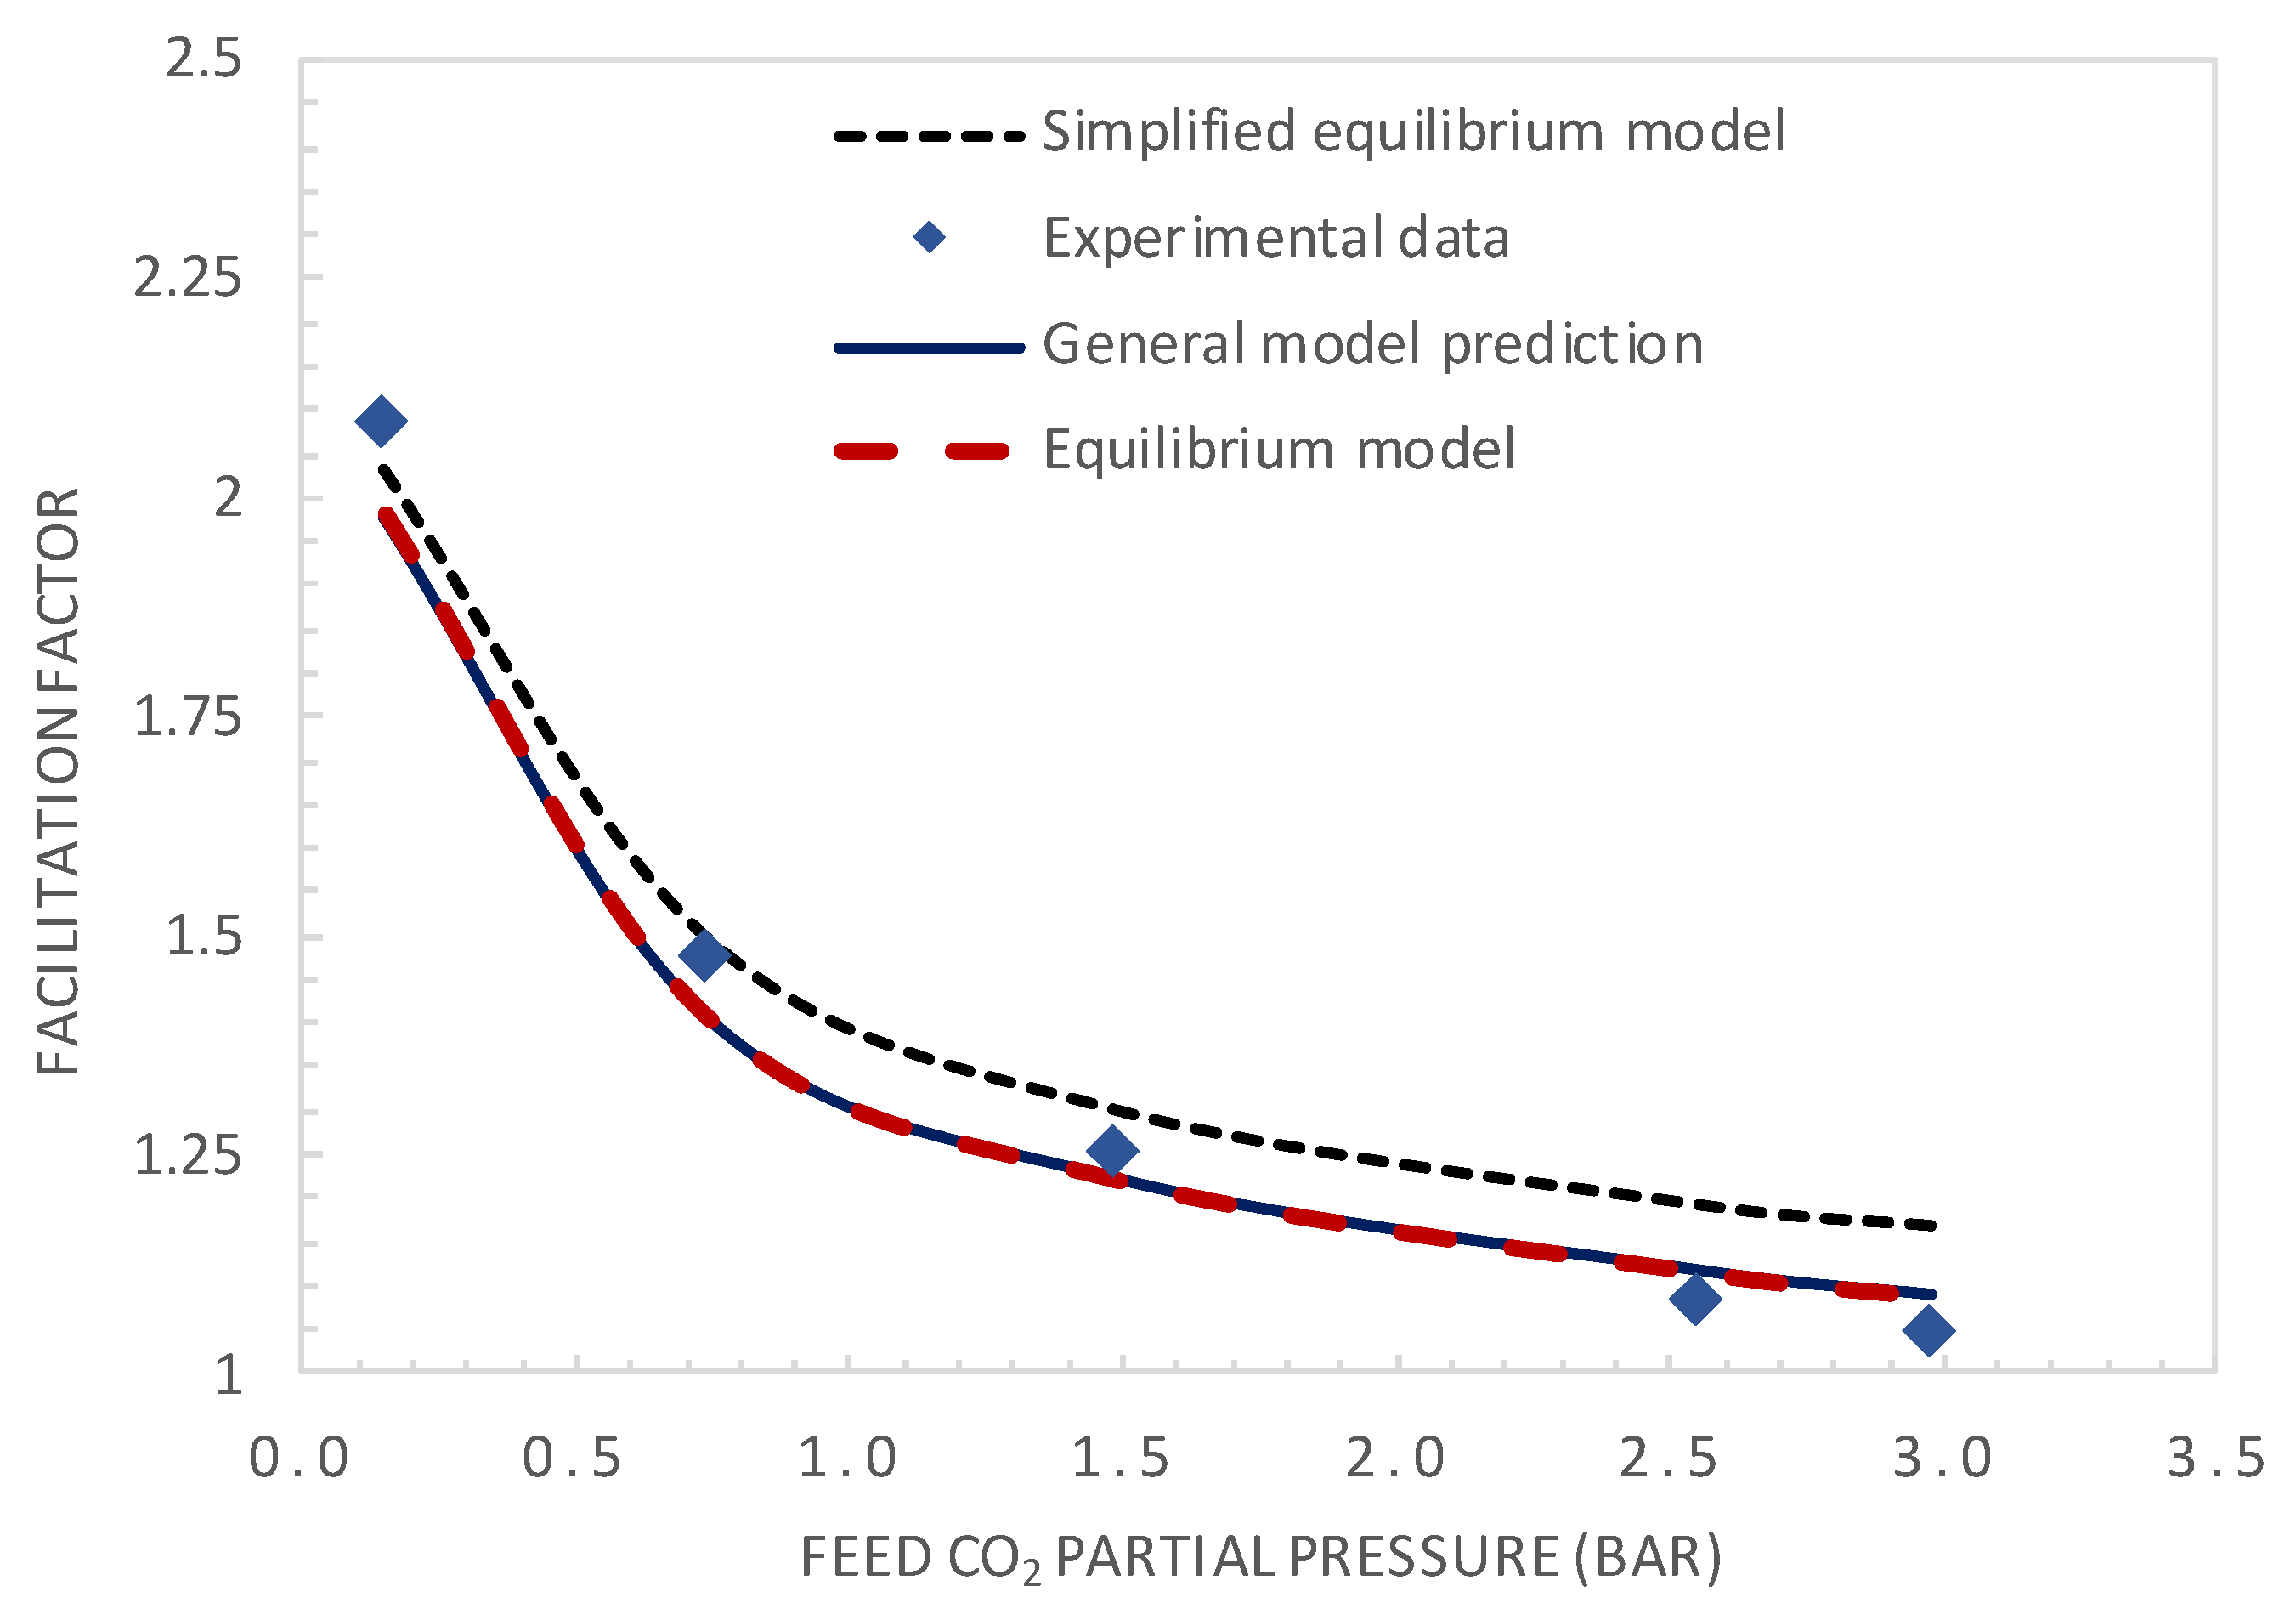
  • It was demonstrated that the current system operated near the reaction equilibrium regime (i.e., diffusion limitation), maximizing the facilitated transport of CO2. This indicated that, under the investigated operating conditions, the membrane thickness was already at its optimal value maximizing the facilitation factor.
  • Increasing the membrane selectivity of the actual membrane by increasing the mobility ratio through increasing the carrier concentration and amine-CO2 complex diffusivity is key to improving the membrane performances.
Furthermore, a parametric analysis regarding the membrane thickness and total carrier concentration was also performed. The main results were:
  • It was shown that after decreasing the membrane selective layer thickness below the actual value of 1 µm to a value of 0.1 µm and CO2 upstream partial pressure of 0.15 bar, a CO2 permeance as high as 2500 GPU can be attained while maintaining the selectivity at a value of about 19.
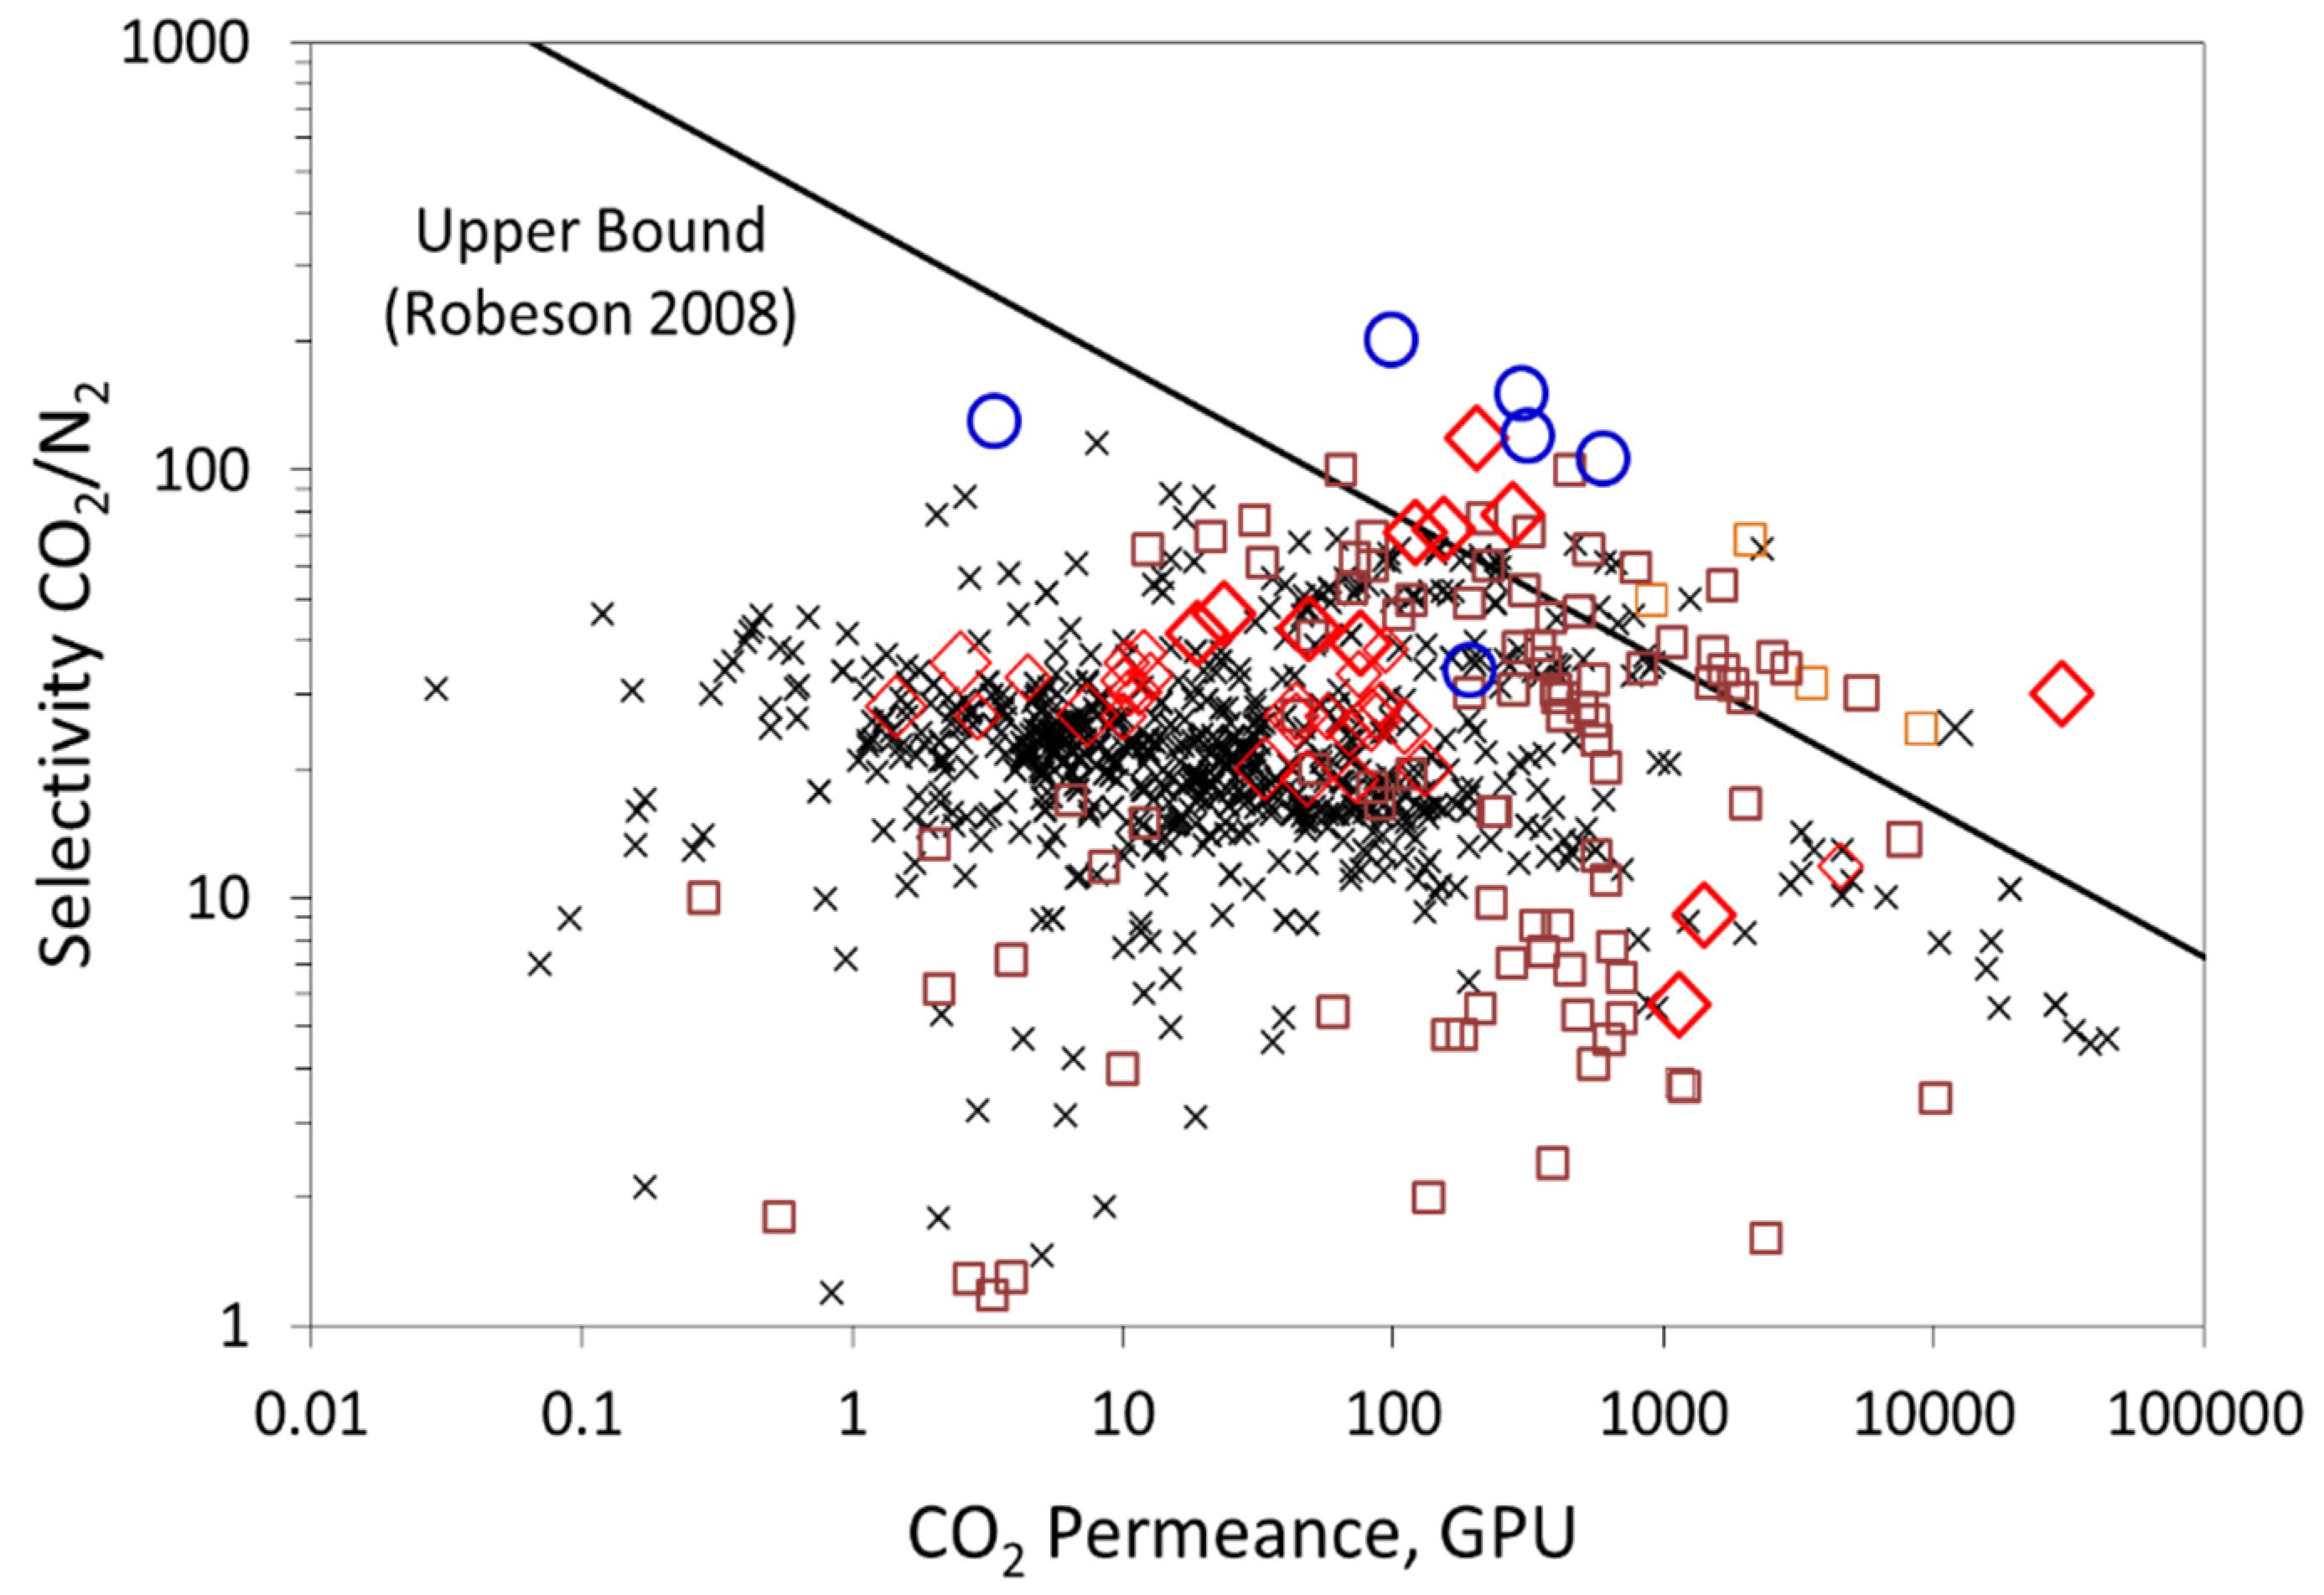
  • Moreover, increasing the carrier solubility by a factor of two permitted the attainment of a CO2 permeance of 429 GPU and CO2/N2 selectivity of 33, performances that are above the Robeson upper bound of the CO2/N2 pair.
Moreover, it is expected that decreasing the selective layer thickness to 0.1 µm together with doubling of the total carrier concentration will theoretically shift the membrane performance far above the Robeson upper bound for the CO2/N2 pair. However, this potential path for membrane performance improvement has to be weighted by the possible depletion in the reaction complex effective diffusivity, as pointed out in the literature. Finally, it is important to emphasize that the analysis set forth in this paper provides some guidance for membrane performance enhancement through chemical and structural modifications. These potential improvement pathways have to be confirmed by targeted experimental work.

Author Contributions

Conceptualization, B.B., E.L. and M.-C.F.; Investigation, B.B. and E.L.; data curation, E.L. and S.J.; Writing—original draft preparation, B.B., E.L. and M.-C.F.; writing—review and editing, B.B., E.L., S.J., M.-C.F. and L.D. All authors have read and agreed to the published version of the manuscript.

Funding

This research was funded by European Union’s Horizon 2020 Research and Innovation program under Grant Agreement No. 72773, and by Widen Horizon mobility program of the University of Lorraine under grant agreement: No. 200335.

Acknowledgments

The corresponding author gratefully acknowledges the financial support from the Widen Horizon mobility program of the University of Lorraine under grant agreement: No. 200335. She also thanks the University of Edinburgh and the School of Engineering for their invitation. This work acknowledges the financial support from the European Union’s Horizon 2020 Research and Innovation program under Grant Agreement No. 727734.

Conflicts of Interest

The authors declare no conflict of interest.

Nomenclature

DDiffusion coefficient (cm−2∙s−1)
eMembrane selective layer thickness (cm)
FFacilitation factor (dimensionless)
RHRelative humidity (dimensionless)
KeqReaction equilibrium constant (cm3·moL−1)
iPermeability of gas i (Barrer)
pPartial pressure (bar)
PMPermeance (GPU)
KDimensionless equilibrium constant
kReaction rate constant (s−1)
JiPermeate flowrate of gas i (cm3 (STP)·s−1)
DACDiffusion coefficient of the carrier-permeant complex (cm−2∙s−1)
p′upstream or feed partial pressure (bar)
p″downstream partial pressure (bar)
SEffective membrane surface area (cm2)
CTTotal carrier concentration (mol·cm−3)
kd,,CO2Sorption coefficient of CO2 in the membranes (mol·cm−3∙bar−1)
CMolar concentration (moL·cm−3)
zdistance from the upstream side of the membrane (m)
Greek symbols
αmMobility ratio (dimensionless)
αMembrane selectivity (dimensionless)
εInverse Damkhöler number (dimensionless)
KReaction equilibrium number (dimensionless)
αi/jCO2/N2 ideal selectivity between tow gas species i and j (dimensionless)
λA measure of the facilitation factor (dimensionless)
iPermeability of gas i (Barrer)
Subscripts
fFeed
ASolute
ACCarrier-solute complex
rReverse
fForward
iCompound
0Upstream side (z = 0)
Superscripts
SDRelative to solution-diffusion
*Relative to dimensionless

References

  1. Davidson, O.; Metz, B. Special Report on Carbon Dioxide Capture and Storage; International Panel on Climate Change: Geneva, Switzerland, 2005. [Google Scholar]
  2. Belaissaoui, B.; Favre, E. Membrane Separation Processes for Post-Combustion Carbon Dioxide Capture: State of the Art and Critical Overview. Oil Gas Sci. Technol. Rev. 2013, 69, 1005–1020. [Google Scholar] [CrossRef]
  3. Ebner, A.D.; Ritter, J.A. State-of-the-art Adsorption and Membrane Separation Processes for Carbon Dioxide Production from Carbon Dioxide Emitting Industries. Sep. Sci. Technol. 2009, 44, 1273–1421. [Google Scholar] [CrossRef]
  4. Luis, P.; Van Gerven, T.; Van Der Bruggen, B. Recent developments in membrane-based technologies for CO2 capture. Prog. Energy Combust. Sci. 2012, 38, 419–448. [Google Scholar] [CrossRef]
  5. Robeson, L.M. The upper bound revisited. J. Membr. Sci. 2008, 320, 390–400. [Google Scholar] [CrossRef]
  6. Freeman, B.D. Basis of Permeability/Selectivity Tradeoff Relations in Polymeric Gas Separation Membranes. Macromolecules 1999, 32, 375–380. [Google Scholar] [CrossRef]
  7. Steeneveldt, R.; Berger, B.; Torp, T. CO2 Capture and Storage. Chem. Eng. Res. Des. 2006, 84, 739–763. [Google Scholar] [CrossRef]
  8. Belaissaoui, B.; Willson, D.; Favre, E. Membrane gas separations and post-combustion carbon dioxide capture: Parametric sensitivity and process integration strategies. Chem. Eng. J. 2012, 122–132. [Google Scholar] [CrossRef]
  9. Ramasubramanian, K.; Ho, W.S.W. Recent developments on membranes for post-combustion carbon capture. Curr. Opin. Chem. Eng. 2011, 1, 47–54. [Google Scholar] [CrossRef]
  10. Matsuyama, H.; Terada, A.; Nakagawara, T.; Kitamura, Y.; Teramoto, M. Facilitated transport of CO2 through polyethylenimine/poly(vinyl alcohol) blend membrane. J. Membr. Sci. 1999, 163, 221–227. [Google Scholar] [CrossRef]
  11. Zou, J.; Ho, W.W. CO2-selective polymeric membranes containing amines in crosslinked poly(vinyl alcohol). J. Membr. Sci. 2006, 286, 310–321. [Google Scholar] [CrossRef]
  12. Huang, J.; Zou, J.; Ho, W.S.W. Carbon Dioxide Capture Using a CO2-Selective Facilitated Transport Membrane. Ind. Eng. Chem. Res. 2008, 47, 1261–1267. [Google Scholar] [CrossRef]
  13. Kim, T.-J.; Li, B.; Hagg, M.-B. Novel fixed-site-carrier polyvinylamine membrane for carbon dioxide capture. J. Polym. Sci. Part B Polym. Phys. 2004, 42, 4326–4336. [Google Scholar] [CrossRef]
  14. Sandru, M.; Haukebø, S.H.; Hagg, M.-B. Composite hollow fiber membranes for CO2 capture. J. Membr. Sci. 2010, 346, 172–186. [Google Scholar] [CrossRef]
  15. Cussler, E.; Aris, R.; Bhown, A. On the limits of facilitated diffusion. J. Membr. Sci. 1989, 43, 149–164. [Google Scholar] [CrossRef]
  16. Noble, R.D. Generalized microscopic mechanism of facilitated transport in fixed site carrier membranes. J. Membr. Sci. 1992, 75, 121–129. [Google Scholar] [CrossRef]
  17. Rea, R.; De Angelis, M.G.; Baschetti, M.G. Models for Facilitated Transport Membranes: A Review. Membranes 2019, 9, 26. [Google Scholar] [CrossRef] [PubMed] [Green Version]
  18. Smith, U.R.; Quinn, J.A. The prediction of facilitation factors for reaction augmented membrane transport. AIChE J. 1979, 25, 197–200. [Google Scholar] [CrossRef]
  19. Noble, R.D.; Way, J.D.; Powers, L.A. Effect of external mass-transfer resistance on facilitated transport. Ind. Eng. Chem. Fundam. 1986, 25, 450–452. [Google Scholar] [CrossRef]
  20. Jemaa, N.; Noble, R.; Koval, C. Combined mass and energy balance analysis of an electrochemically modulated equilibrium stage process. Chem. Eng. Sci. 1992, 47, 1469–1479. [Google Scholar] [CrossRef]
  21. Paul, D.R.; Koros, W.J. Effect of partially immobilizing sorption on permeability and the diffusion time lag. J. Polym. Sci. Polym. Phys. Ed. 1976, 14, 675–685. [Google Scholar] [CrossRef]
  22. Noble, R.D. Relationship of system properties to performance in facilitated transport systems. Gas Sep. Purif. 1988, 2, 16–19. [Google Scholar] [CrossRef]
  23. Koval, C.A.; Reyes, Z.E. Chemical aspects of facilitated transport through liquid membranes. In Liquid Membranes: Theory and Applications; ACS Symposium Series No. 347; American Chemical Society: Washington, DC, USA, 1987; pp. 27–38. [Google Scholar]
  24. Kemena, L.; Noble, R.; Kemp, N. Optimal regimes of facilitated transport. J. Membr. Sci. 1983, 15, 259–274. [Google Scholar] [CrossRef]
  25. Noble, R.D. Analysis of facilitated transport with fixed site carrier membranes. J. Membr. Sci. 1990, 50, 207–214. [Google Scholar] [CrossRef]
  26. Rafiq, S.; Deng, L.; Hägg, M.-B. Role of Facilitated Transport Membranes and Composite Membranes for Efficient CO2 Capture—A Review. ChemBioEng Rev. 2016, 3, 68–85. [Google Scholar] [CrossRef]
  27. Ansaloni, L.; Zhao, Y.; Jung, B.T.; Ramasubramanian, K.; Baschetti, M.G.; Ho, W.W. Facilitated transport membranes containing amino-functionalized multi-walled carbon nanotubes for high-pressure CO2 separations. J. Membr. Sci. 2015, 490, 18–28. [Google Scholar] [CrossRef] [Green Version]
  28. Gottschlich, D.; Roberts, D.; Way, J. A theoretical comparison of facilitated transport and solution-diffusion membrane modules for gas separation. Gas Sep. Purif. 1988, 2, 65–71. [Google Scholar] [CrossRef]
  29. Janakiram, S.; Espejo, J.L.M.; Yu, X.; Ansaloni, L.; Deng, L. Facilitated transport membranes containing graphene oxide-based nanoplatelets for CO2 separation: Effect of 2D filler properties. J. Membr. Sci. 2020, 616, 118626. [Google Scholar] [CrossRef]
  30. Janakiram, S.; Espejo, J.L.M.; Høisæter, K.K.; Lindbråthen, A.; Ansaloni, L.; Deng, L. Three-phase hybrid facilitated transport hollow fiber membranes for enhanced CO2 separation. Appl. Mater. Today 2020, 21, 100801. [Google Scholar] [CrossRef]
  31. Janakiram, S.; Santinelli, F.; Costi, R.; Lindbråthen, A.; Nardelli, G.M.; Milkowski, K.; Ansaloni, L.; Deng, L. Field trial of hollow fiber modules of hybrid facilitated transport membranes for flue gas CO2 capture in cement industry. Chem. Eng. J. 2020, 2020, 127405. [Google Scholar] [CrossRef]
  32. Janakiram, S.; Yu, X.; Ansaloni, L.; Dai, Z.; Deng, L. Manipulation of Fibril Surfaces in Nanocellulose-Based Facilitated Transport Membranes for Enhanced CO2 Capture. ACS Appl. Mater. Interfaces 2019, 11, 33302–33313. [Google Scholar] [CrossRef]
  33. Dhuiège, B.; Lasseuguette, E.; Brochier-Salon, M.-C.; Ferrari, M.-C.; Missoum, K. Crosslinked Facilitated Transport Membranes Based on Carboxymethylated NFC and Amine-Based Fixed Carriers for Carbon Capture, Utilization, and Storage Applications. Appl. Sci. 2020, 10, 414. [Google Scholar] [CrossRef] [Green Version]
  34. Deng, L.; Hagg, M.-B. Swelling Behavior and Gas Permeation Performance of PVAm/PVA Blend FSC Membrane. J. Membr. Sci. 2010, 363, 295–301. [Google Scholar] [CrossRef]
  35. Chen, G.Q.; Scholes, C.A.; Doherty, C.M.; Hill, A.J.; Qiao, G.G.; Kentish, S.E. The thickness dependence of Matrimid films in water vapor permeation. Chem. Eng. J. 2012, 209, 301–312. [Google Scholar] [CrossRef]
  36. Pfister, M.; Belaissaoui, B.; Favre, E. Membrane Gas Separation Processes from Wet Postcombustion Flue Gases for Carbon Capture and Use: A Critical Reassessment. Ind. Eng. Chem. Res. 2017, 56, 591–602. [Google Scholar] [CrossRef]
  37. Lasseuguette, E.; Carta, M.; Brandani, S.; Ferrari, M.-C. Effect of humidity and flue gas impurities on CO2 permeation of a polymer of intrinsic microporosity for post-combustion capture. Int. J. Greenh. Gas Control. 2016, 50, 93–99. [Google Scholar] [CrossRef] [Green Version]
  38. Schultz, J.S.; Goddard, J.D.; Suchdeo, S.R. Facilitated Transport via Carrier-Mediated Diffusion in Membranes Part 1. Mechanistic Aspects, Regimes. AlChE J. 1974, 20, 417–445. [Google Scholar] [CrossRef]
  39. Han, Y.; Wu, D.; Ho, W.S.W. Simultaneous effects of temperature and vacuum and feed pressures on facilitated transport membrane for CO2/N2 separation. J. Membr. Sci. 2019, 573, 476–484. [Google Scholar] [CrossRef]
  40. Zhao, Y.; Ho, W.W. Steric hindrance effect on amine demonstrated in solid polymer membranes for CO2 transport. J. Membr. Sci. 2012, 132–138. [Google Scholar] [CrossRef]
  41. Way, J.D.; Noble, R.D.; Reed, D.L.; Ginley, G.M.; Jarr, L.A. Facilitated transport of CO2 in ion exchange membranes. AIChE J. 1987, 33, 480–487. [Google Scholar] [CrossRef]
  42. Way, J.; Noble, R.D. Competitive facilitated transport of acid gases in perfluorosulfonic acid membranes. J. Membr. Sci. 1989, 46, 309–324. [Google Scholar] [CrossRef]
  43. Yamaguchi, T.; Boetje, L.M.; Koval, C.A.; Noble, R.D.; Bowman, C.N. Transport Properties of Carbon Dioxide through Amine Functionalized Carrier Membranes. Ind. Eng. Chem. Res. 1995, 34, 4071–4077. [Google Scholar] [CrossRef]
  44. Sharifzadeh, M.M.M.; Amooghin, A.E.; Pedram, M.Z.; Omidkhah, M. Time-dependent mathematical modeling of binary gas mixture in facilitated transport membranes (FTMs): A real condition for single-reaction mechanism. J. Ind. Eng. Chem. 2016, 39, 48–65. [Google Scholar] [CrossRef]
  45. Lin, H.; Freeman, B.D. Gas solubility, diffusivity and permeability in poly(ethylene oxide). J. Membr. Sci. 2004, 239, 105–117. [Google Scholar] [CrossRef]
  46. Jensen, A.; Christensen, R.; Bonnichsen, R.; Virtanen, A.I. Studies on Carbamates. XI. The Carbamate of Ethylenediamine. Acta Chem. Scand. 1955, 9, 486–492. [Google Scholar] [CrossRef]
  47. Wang, X.; Conway, W.; Fernandes, D.; Lawrance, G.; Burns, R.; Puxty, G.; Maeder, M. Kinetics of the Reversible Reaction of CO2(aq) with Ammonia in Aqueous Solution. J. Phys. Chem. A 2011, 115, 6405–6412. [Google Scholar] [CrossRef]
  48. Versteeg, G.; Swaaij, W. On the kinetics between CO2 and alkanolamines both in aqueous and non-aqueous solutions—I. Primary and secondary amines. Chem. Eng. Sci. 1988, 43, 573–585. [Google Scholar] [CrossRef] [Green Version]
  49. Yoshikawa, M.; Shudo, S.; Sanui, K.; Ogata, N. Active transport of organic acids through poly(4-vinylpyridine-co-acrylonitrile) membranes. J. Membr. Sci. 1986, 26, 51–61. [Google Scholar] [CrossRef]
  50. Ogata, N.; Sanui, K.; Fujimura, H. Active transport membrane for chlorine ion. J. Appl. Polym. Sci. 1980, 25, 1419–1425. [Google Scholar] [CrossRef]
  51. Tsuchida, E.; Nishide, H.; Ohyanagi, M.; Kawakami, H. Facilitated transport of molecular oxygen in the membranes of polymer-coordinated cobalt Schiff base complexes. Macromolecules 1987, 20, 1907–1912. [Google Scholar] [CrossRef]
  52. Francisco, G.J.; Chakma, A.; Feng, X. Membranes comprising of alkanolamines incorporated into poly(vinyl alcohol) matrix for CO2/N2 separation. J. Membr. Sci. 2007, 303, 54–63. [Google Scholar] [CrossRef]
  53. Cai, Y.; Wang, Z.; Yi, C.; Bai, Y.; Wang, J.; Wang, S. Gas transport property of polyallylamine–poly(vinyl alcohol)/polysulfone composite membranes. J. Membr. Sci. 2008, 310, 184–196. [Google Scholar] [CrossRef]
Figure 1. State of the art: trade-off curve showing the CO2/N2 selectivity (α) data for different membrane materials versus CO2 permeance for a 1-μm-thick membrane. ✕: polymeric membranes, ☐: inorganic membranes, ◯: facilitated transport membranes,◇: hybrid organic-inorganic membranes. The theoretical trade-off limit, calculated for a strict physical separation mechanism through a dense polymer (i.e., solution-diffusion), is also shown. A membrane thickness of one micron is considered for the upper bound to convert permeability in Barrer to permeance in GPU.
Membranes 10 00367 g001
Figure 2. Illustration of the facilitated transport mechanism of fixed-site amine carrier membrane.
Membranes 10 00367 g002
Figure 3. SEM images of a cross-section of polyallylamine (PAA)-poly(vinyl alcohol) (PVA)-graphene oxide (GO) membrane.
Membranes 10 00367 g003
Figure 4. The effect of feed relative humidity on the CO2 and N2 permeances and CO2/N2 membrane selectivity, at a feed CO2 partial pressure of 1.5 bar and temperature of 50 °C. Lines are to guide the eye.
Membranes 10 00367 g004
Figure 5. The effect of CO2 upstream partial pressure on the CO2 permeance and CO2/N2 selectivity, at a feed relative humidity of 85% and temperature of 40 °C.
Membranes 10 00367 g005
Figure 6. Plot of E as a function of the upstream CO2 partial pressure. The dashed line corresponds to a straight-line fitting curve at very low CO2 partial pressures (<1.5 bar), according to Equation (19).
Membranes 10 00367 g006
Figure 7. Comparison of the model predictions and experimental values of the facilitation factor.
Membranes 10 00367 g007
Figure 8. Comparison of CO2 permeance and CO2/N2 selectivity between the general model simulation and experimental values. Simulations are shown in a continuous line.
Membranes 10 00367 g008
Figure 9. CO2 permeance and CO2/N2 selectivity as a function of the selective layer membrane thickness (general model simulation results). p’CO2 = 0.75 bar, CT = CT0 = 1.61 × 10⁻² moL·cm−3.
Membranes 10 00367 g009
Figure 10. CO2/N2 selectivity as a function of the feed CO2 partial pressure. Results are given for different values of selective layer membrane thickness (general model simulation results). CT = CT0 = 1.61 × 10⁻² mol·cm−3.
Membranes 10 00367 g010
Figure 11. CO2 permeance as a function of the feed CO2 partial pressure. Results are given for different values of selective layer membrane thickness (general model simulation results). CT = CT0 = 1.61 × 10⁻² mol·cm−3.
Membranes 10 00367 g011
Figure 12. CO2 permeance and CO2/N2 selectivity as the total carrier concentration (general model simulation results). p’CO2 = 0.74 bar, e = 1 μm.
Membranes 10 00367 g012
Figure 13. CO2 permeance as a function of the feed CO2 partial pressure (general model simulation results). Results are given for different values of the total carrier concentration around the actual value of CT0 = 1.61 × 10⁻² mol·cm−3.
Membranes 10 00367 g013
Figure 14. CO2/N2 selectivity as a function of the feed CO2 partial pressure (general model simulation results). Results are given for different values of the total carrier concentration around the actual value of CT0 = 1.61 × 10⁻² mol·cm−3.
Membranes 10 00367 g014
Table 1. Definition of the key dimensionless number in facilitation transport.
Dimensionless NumbersDefinitionExpression
εInverse Damkohler number, ratio of the characteristic reverse reaction to diffusion time ε = D A C k r   e 2
αmMobility ratio of mobility of carrier to mobility of solute α m = D A C C T D A   C A 0 , with C A 0 = k D , A p A
KDimensionless reaction equilibrium constant K = k f C A 0 k r   = k e q C A 0
λMeasure of the facilitation factor λ = 1 2 1 + ( α + 1 ) K ε ( 1 + K )  
Table 2. Summary of the hypothesis and the facilitation expression of each model.
Model HypothesisModel NameModel Equation (F Expression)
Chemical equilibrium
(tanhλ/λ ~ 0)
Zero downstream CO2 concentration ( p C O 2 = 0)
(very dilute CO2 gas)
Simplified equilibrium modelEquation (14)
Non-zero downstream CO2 concentrationEquilibrium modelEquation (16)
Non-chemical equilibrium
(reaction limitation)
Zero downstream CO2 concentrationGeneral modelEquation (13)
Table 3. Operating conditions.
Operating ConditionsValue
Temperature °C40 and 50
Feed composition10−100% CO2/N2
Sweep gas compositionPure He
Feed pressure (bar) 1–3
CO2 partial pressure, PCO2 (bar)0.15–3
Sweep pressure (bar)1
Feed Relative humidity, RHf (%)20–90
Sweep Relative humidity, RHs (%)50
Feed flow rate, QF
(Ncm3/min)
150
Sweep flow rate, Qs
(Ncm3/min)
10
Table 4. Permeation properties used for the modelling analysis.
DCO2 (cm2·s−1)kd,CO2
(mol·cm−3·bar−1)
DAC (cm2·s−1)Keq
(cm3·mol−1)
Kr (s−1)SDCO2 Permeability (Barrer)SDCO2 Permeance (GPU), * e = 1 µmN2 Permeability (Barrer)N2 Permeance (GPU) * e = 1 µm
1 × 10−64.84 × 10−51.7 × 10−95.20 × 1041101451451313
* Relative to dimensionless.
Table 5. Calculated dimensionless facilitated transport parameters, PCO2 = 0.15 and 3 bar.
PCO2 (bar)αmεKtanhλ/λ
0.153.781.54 × 10−30.3771.52 × 10−3
30.911.54 × 10−37.492.64 × 10−3
Publisher’s Note: MDPI stays neutral with regard to jurisdictional claims in published maps and institutional affiliations.

