
The Role of Political Belief in COVID-19 Vaccine Resistance, Virus Transmission, and Closure Policy Response
Abstract
1. Introduction
2. Materials and Methods
2.1. Data
2.2. The Model
3. Results
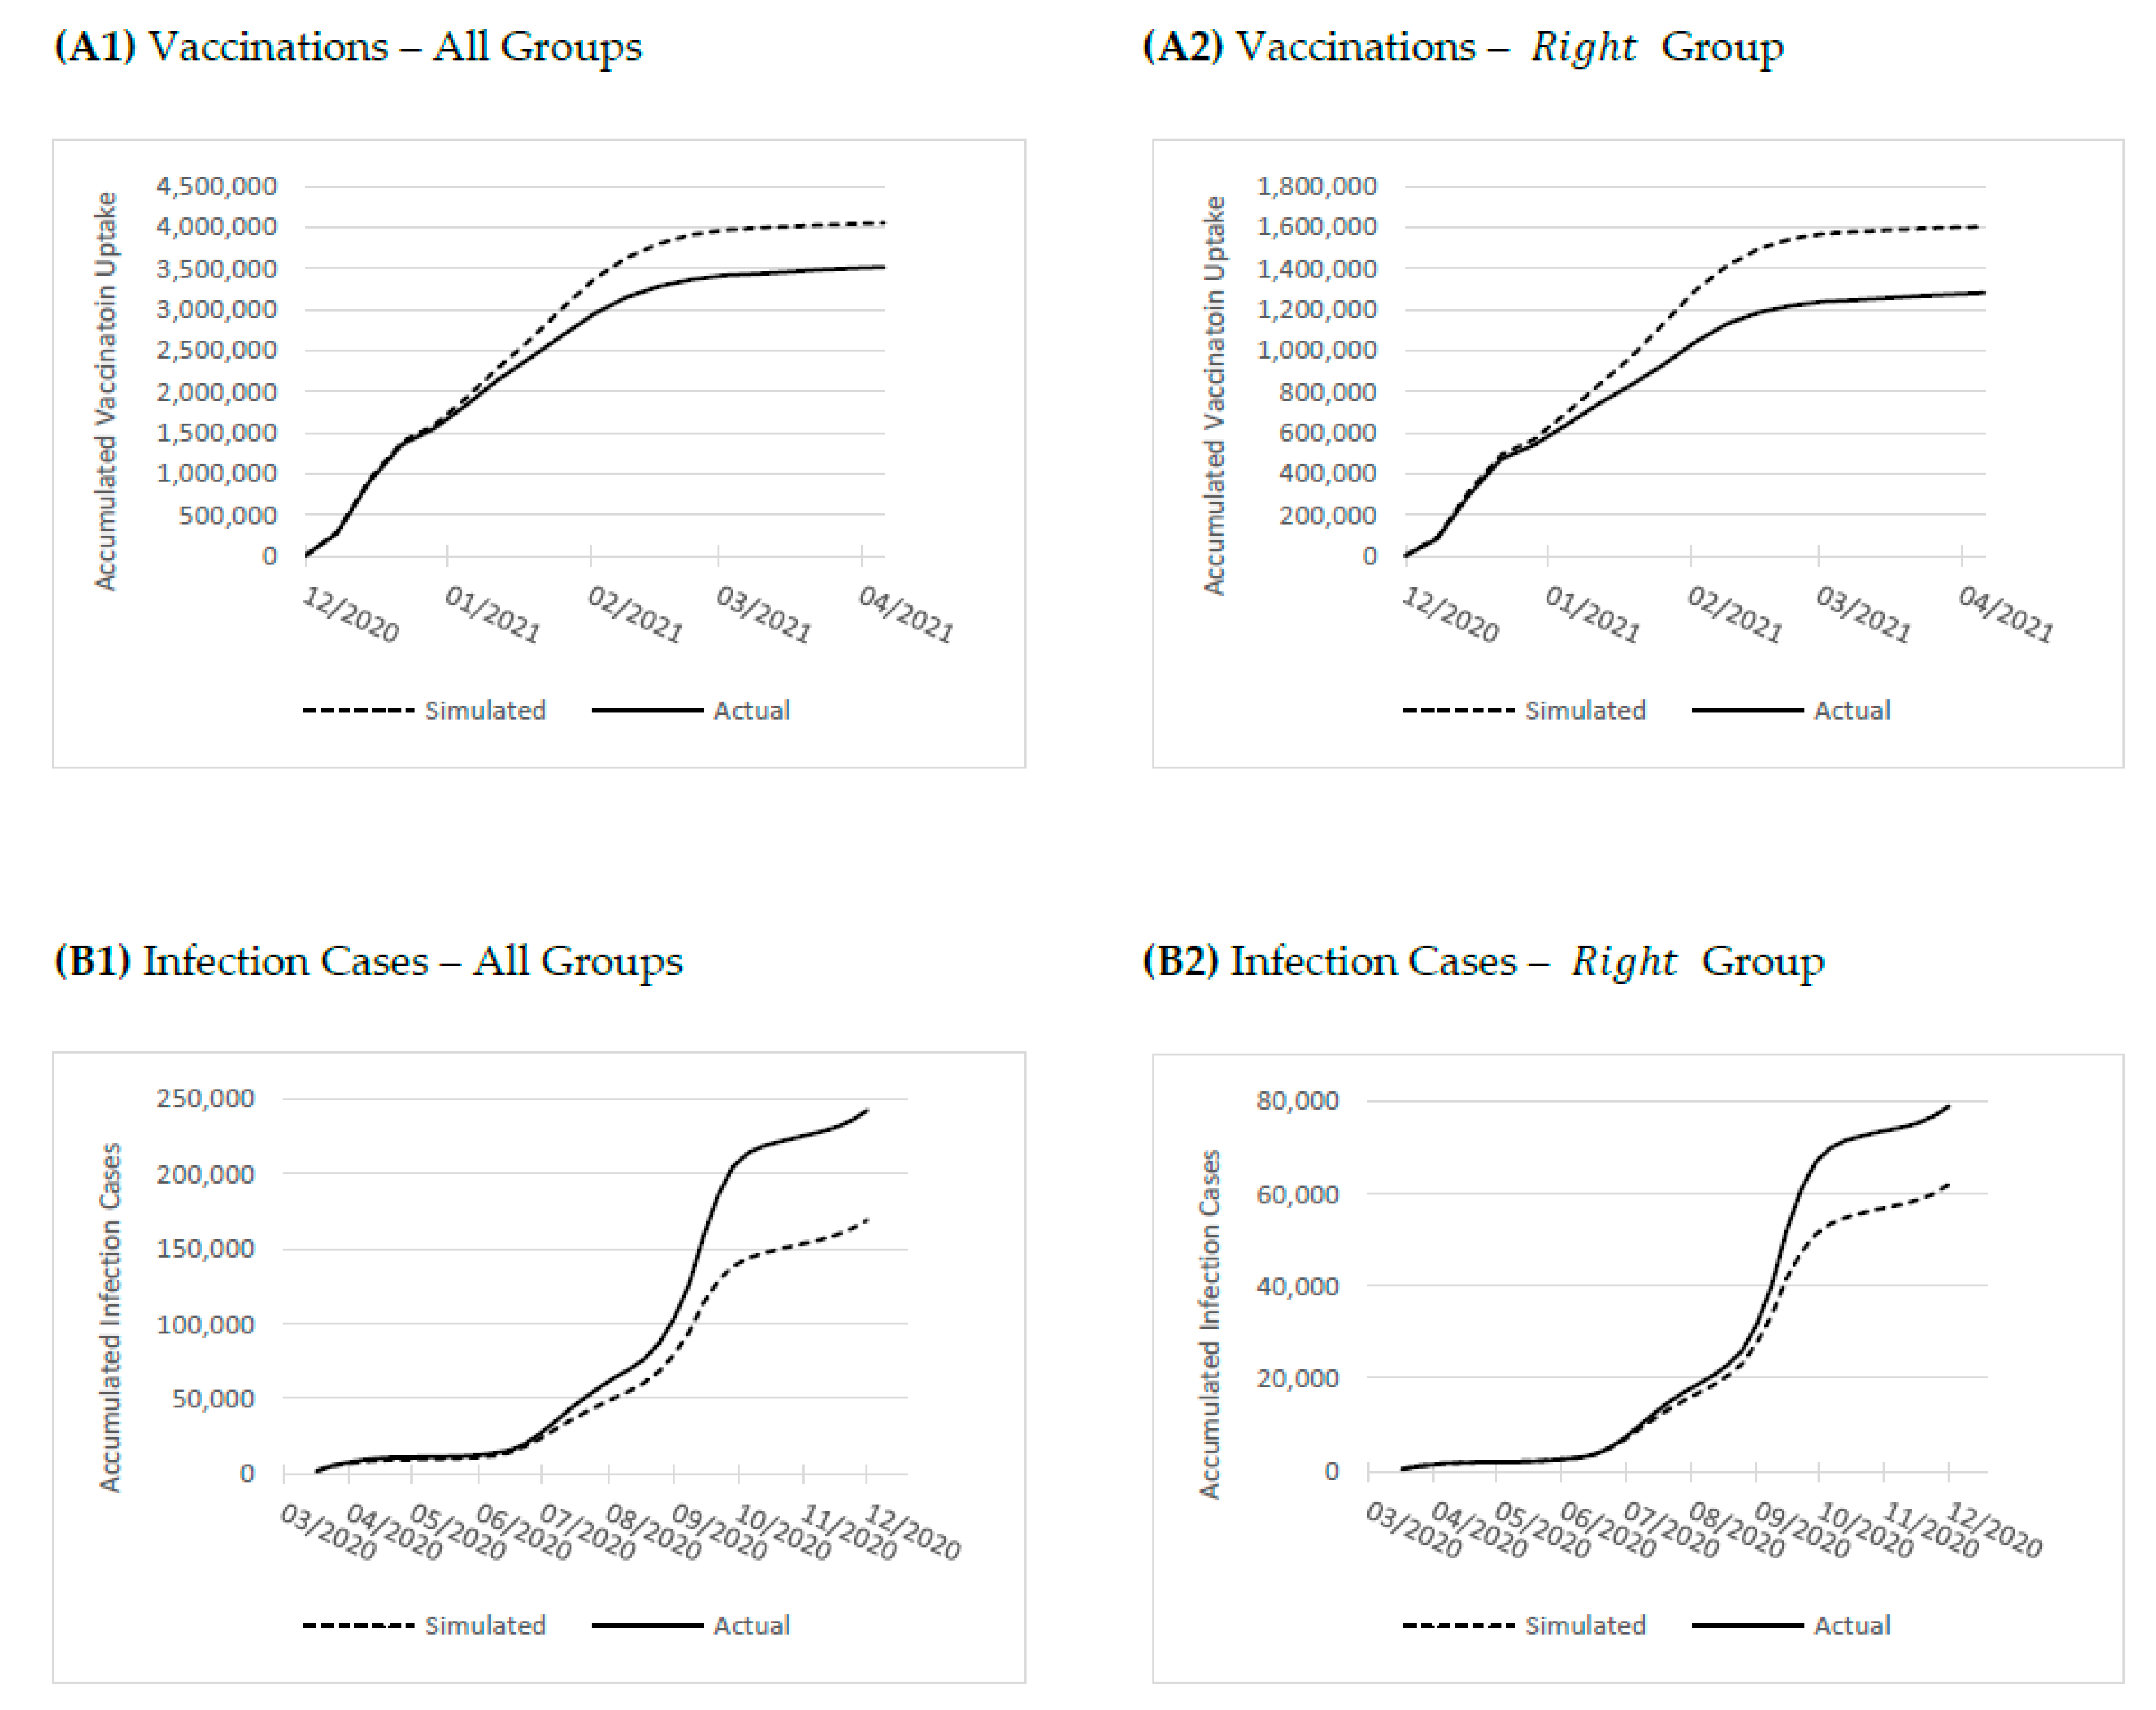
3.1. Vaccinations
3.2. Infections
3.3. Costs of Risky Behavior
3.4. Event Study: Political Belief Response to COVID-19 Closure
4. Discussion
5. Conclusions
Author Contributions
Funding
Institutional Review Board Statement
Informed Consent Statement
Data Availability Statement
Acknowledgments
Conflicts of Interest
Appendix A

| Column | (1) | (2) | (3) | (4) | (5) | (6) | (7) | (8) |
|---|---|---|---|---|---|---|---|---|
| Outcome Term | Vac | Vac | Vac | Infections | Infections | Infections | Infections | Infections |
| Pop | -- | −4 × 10⁻⁶ (8 × 10⁻⁶) | −2.6 × 10⁻⁵ (8 × 10⁻⁶) | -- | −5 × 10⁻⁶ (2 × 10⁻⁶) | −1.6 × 10⁻⁵ (3 × 10⁻⁶) | −1.6 × 10⁻⁵ (2 × 10⁻⁶) | −3 × 10⁻⁵ (6 × 10⁻⁶) |
| Density | -- | −9 × 10⁻⁶ (3 × 10⁻⁶) | 8 × 10⁻⁶ (3 × 10⁻⁶) | -- | 2 × 10⁻⁶ (1 × 10⁻⁶) | 0.0 (0.0) | 0.0 (0.0) | 1 × 10⁻⁶ (1 × 10⁻⁶) |
| SES | -- | 0.349 (0.049) | 0.407 (0.047) | -- | −0.090 (0.011) | −0.055 (0.008) | −0.066 (0.009) | −0.172 (0.021) |
| ProximityTA | -- | −0.015 (0.021) | −0.022 (0.020) | -- | 0.013 (0.004) | 0.010 (0.003) | 0.009 (0.004) | 0.052 (0.009) |
| Age60 | -- | 0.702 (0.460) | 0.813 (0.456) | -- | −0.124 (0.071) | −0.183 (0.073) | −0.238 (0.066) | 0.048 (0.157) |
| Age15 | -- | 0.928 (0.526) | 0.981 (0.497) | -- | −0.296 (0.121) | −0.196 (0.104) | −0.299 (0.116) | −0.064 (0.253) |
| PersonHH | -- | 0.049 (0.037) | 0.047 (0.035) | -- | 0.025 (0.010) | 0.016 (0.007) | 0.013 (0.008) | 0.035 (0.018) |
| RoomsHH | -- | 0.129 (0.150) | 0.159 (0.146) | -- | −0.007 (0.035) | 0.014 (0.029) | 0.021 (0.028) | 0.062 (0.051) |
| NonVoter | -- | −1.542 (0.305) | −1.212 (0.301) | -- | −0.705 (0.133) | −0.371 (0.101) | −0.602 (0.113) | −0.867 (0.189) |
| Controls | No | Yes | Yes | No | Yes | Yes | Yes | Yes |
| N | 25,650 | 25,650 | 25,650 | 51,300 | 51,300 | 51,300 | 27,000 | 6750 |
| Number of weeks | 19 | 19 | 19 | 39 | 38 | 38 | 20 | 5 |
| Prob (F) | 0 | 0 | 0 | 0 | 0 | 0 | 0 | 0 |
| R2-overall | 0.039 | 0.058 | 0.178 | 0.113 | 0.126 | 0.468 | 0.481 | 0.747 |
| Column | (1) | (2) | (3) | (4) | (5) | (6) | (7) | (8) |
|---|---|---|---|---|---|---|---|---|
| Outcome Term | Vac | Vac | Vac | Infect | Infect | Infect | Infect | Infect |
| Constant | −1.944 (0.073) | −2.320 (0.375) | −3.236 (0.370) | −6.876 (0.007) | −6.496 (0.113) | −6.517 (0.082) | −6.409 (0.100) | −6.216 (0.202) |
| RightCont | −0.608 (0.142) | −0.148 (0.188) | 0.249 (0.218) | 0.154 (0.016) | 0.133 (0.038) | −0.023 (0.029) | 0.011 (0.031) | 0.769 (0.163) |
| OrthodoxCont | −1.145 0.103 | −0.293 (0.305) | 0.393 (0.299) | 0.755 (0.021) | 0.687 (0.063) | −0.232 (0.053) | −0.142 (0.053) | 0.749 (0.205) |
| ArabCont | −0.826 (0.135) | −0.090 (0.236) | 0.068 (0.316) | 0.227 (0.023) | 0.205 (0.049) | −0.056 (0.038) | −0.056 (0.037) | −0.161 (0.153) |
| Infectionst−1 | 0.515 (0.041) | −0.051 (0.018) | −0.021 (0.018) | 0.077 (0.028) | ||||
| RightCont Infectionst−1 | −0.422 (0.068) | 0.250 (0.029) | 0.177 (0.033) | 0.204 (0.051) | ||||
| OrthodoxCont Infectionst−1 | −0.403 (0.042) | 0.480 (0.020) | 0.434 (0.021) | 0.431 (0.045) | ||||
| ArabCont Infectionst−1 | −0.201 (0.081) | 0.236 (0.023) | 0.212 (0.028) | 0.155 (0.045) | ||||
| t | −0.082 (0.013) | |||||||
| RightCont t | −0.308 (0.027) | |||||||
| OrthodoxCont t | −0.377 (0.018) | |||||||
| Arab t | 0.013 (0.030) | |||||||
| Controls | No | Yes | Yes | No | Yes | Yes | Yes | Yes |
| N | 25,650 | 25,650 | 25,650 | 51,300 | 51,300 | 51,300 | 27,000 | 6750 |
| Number of weeks | 19 | 19 | 19 | 39 | 38 | 38 | 20 | 5 |
| Prob (F) | 0 | 0 | 0 | 0 | 0 | 0 | 0 | 0 |
| R2-overall | 0.043 | 0.058 | 0.181 | 0.125 | 0.132 | 0.465 | 0.482 | 0.756 |
| Column | (1) | (2) | (3) | (4) | (5) | (6) | (7) | (8) |
|---|---|---|---|---|---|---|---|---|
| Outcome Term | Vac | Infect | Infect | Infect | Vac | Infect | Infect | Infect |
| Constant | −2.506 (0.329) | −6.403 (0.090) | −6.347 (0.106) | −4.782 (0.263) | −3.047 (0.328) | −6.539 (0.081) | −6.415 (0.099) | −5.568 (0.205) |
| Left | −0.156 (0.089) | −0.047 (0.016) | −0.044 (0.015) | −0.697 (0.051) | −0.309 (0.097) | 0.064 (0.014) | 0.014 (0.015) | −0.277 (0.069) |
| Center | −0.014 (0.047) | −0.020 (0.008) | −0.025 (0.009) | −0.241 (0.042) | −0.060 (0.053) | 0.037 (0.008) | 0.019 (0.009) | −0.034 (0.072) |
| Orthodox | 0.019 (0.121) | 0.145 (0.027) | 0.154 (0.031) | 0.677 (0.085) | 0.382 (0.130) | −0.177 (0.023) | −0.164 (0.027) | −0.113 (0.151) |
| Arab | 0.001 (0.131) | −0.070 (0.020) | −0.110 (0.022) | −1.096 (0.097) | −0.172 (0.217) | −0.013 (0.018) | −0.060 (0.017) | −1.042 (0.135) |
| Z | 0.037 (0.021) | 0.129 (0.014) | 0.082 (0.023) | 0.124 (0.022) | 0.195 (0.018) | 0.117 (0.007) | 0.095 (0.008) | 0.184 (0.017) |
| Left × Z | 0.599 (0.139) | −0.213 (0.031) | −0.167 (0.050) | −0.041 (0.045) | 0.215 (0.047) | −0.151 (0.013) | −0.118 (0.014) | −0.161 (0.028) |
| Center × Z | 0.098 (0.040) | −0.076 (0.029) | −0.075 (0.033) | 0.002 (0.051) | 0.055 (0.019) | −0.063 (0.009) | −0.066 (0.010) | −0.070 (0.029) |
| Orthodox × Z | 0.011 (0.048) | 0.308 (0.028) | 0.293 (0.042) | 0.029 (0.042) | −0.110 (0.017) | 0.185 (0.028) | 0.212 (0.015) | 0.211 (0.036) |
| Arab × Z | 0.255 (0.106) | 0.010 (0.036) | 0.126 (0.062) | 0.006 (0.073) | 0.147 (0.065) | −0.023 (0.016) | 0.009 (0.021) | 0.009 (0.044) |
| t | −0.375 (0.006) | −0.377 (0.007) | ||||||
| Left × t | 0.191 (0.010) | 0.192 (0.010) | ||||||
| Center × t | 0.054 (0.010) | 0.054 (0.011) | ||||||
| Orthodox × t | −0.113 (0.016) | −0.167 (0.015) | ||||||
| Arab × t | 0.237 (0.026) | 0.268 (0.025) | ||||||
| Controls | Yes | Yes | Yes | Yes | Yes | Yes | Yes | Yes |
| N | 25,650 | 51,300 | 27,000 | 6,750 | 25,650 | 49,950 | 27,000 | 6750 |
| Number of weeks | 19 | 38 | 20 | 5 | 19 | 37 | 20 | 5 |
| Prob (F) | 0 | 0 | 0 | 0 | 0 | 0 | 0 | 0 |
| R2-overall | 0.070 | 0.173 | 0.199 | 0.702 | 0.147 | 0.324 | 0.352 | 0.720 |
References
- Bruine de Bruin, W.; Saw, H.W.; Goldman, D.P. Political polarization in US residents’ COVID-19 risk perceptions, policy preferences, and protective behaviors. J. Risk Uncertain. 2020, 61, 177–194. [Google Scholar] [CrossRef] [PubMed]
- Calvillo, D.P.; Ross, B.J.; Garcia, R.J.; Smelter, T.J.; Rutchick, A.M. Political ideology predicts perceptions of the threat of COVID-19 (and susceptibility to fake news about it). Soc. Psychol. Personal. Sci. 2020, 11, 1119–1128. [Google Scholar] [CrossRef]
- Block, R., Jr.; Burnham, M.; Kahn, K.; Peng, R.; Seeman, J.; Seto, C. Perceived risk, political polarization, and the willingness to follow COVID-19 mitigation guidelines. Soc. Sci. Med. 2022, 305, 115091. [Google Scholar] [CrossRef] [PubMed]
- Callaghan, T.; Moghtaderi, A.; Lueck, J.A.; Hotez, P.J.; Strych, U.; Dor, A.; Franklin Fowler, E.; Motta, M. Correlates and Disparities of COVID-19 Vaccine Hesitancy. Available online: https://ssrn.com/abstract=3667971 (accessed on 5 August 2020). [CrossRef]
- Featherstone, J.D.; Bell, R.A.; Ruiz, J.B. Relationship of people’s sources of health information and political ideology with acceptance of conspiratorial beliefs about vaccines. Vaccine 2019, 37, 2993–2997. [Google Scholar] [CrossRef]
- Hornsey, M.J.; Finlayson, M.; Chatwood, G.; Begeny, C.T. Donald Trump and vaccination: The effect of political identity, conspiracist ideation and presidential tweets on vaccine hesitancy. J. Exp. Soc. Psychol. 2020, 88, 103947. [Google Scholar] [CrossRef]
- Mesch, G.S.; Schwirian, K.P. Confidence in government and vaccination willingness in the USA. Health Promot. Int. 2015, 30, 213–221. [Google Scholar] [CrossRef]
- Reiter, P.L.; Pennell, M.L.; Katz, M.L. Acceptability of a COVID-19 vaccine among adults in the United States: How many people would get vaccinated? Vaccine 2020, 38, 6500–6507. [Google Scholar] [CrossRef]
- Killgore, W.D.S.; Cloonan, S.A.; Taylor, E.C.; Dailey, N.S. The COVID-19 vaccine is here—now who is willing to get it? Vaccines 2021, 9, 339. [Google Scholar] [CrossRef]
- Pedersen, M.J.; Favero, N. Social distancing during the COVID-19 pandemic: Who are the present and future noncompliers? Public Adm. Rev. 2020, 80, 805–814. [Google Scholar] [CrossRef]
- Rothberger, H.; Wilson, T.; Whaley, D.; Rosenfeld, D.L.; Humphrey, M.; Moore, A.; Bihl, A. Politicizing the COVID-19 pandemic: Ideological differences in adherence to social distancing. PsyArXiv. 2020. [CrossRef]
- Young, D.G.; Rasheed, H.; Bleakley, A.; Langbaum, J.B. The politics of mask-wearing: Political preferences, reactance, and conflict aversion during COVID. Soc. Sci. Med. 2022, 298, 114836. [Google Scholar] [CrossRef]
- Ash, E.; Galletta, S.; Hangartner, D.; Margalit, Y.; Matteo, P. The effect of Fox news on health behavior during COVID-19. Working Paper. 2020. Available online: https://papers.ssrn.com/sol3/papers.cfm?abstract_id=3636762 (accessed on 1 March 2022).
- Barrios, J.M.; Hochberg, Y. Risk perceptions and politics: Evidence from COVID-19 pandemic. J. Financ. Econ. 2021, 142, 862–879. [Google Scholar] [CrossRef] [PubMed]
- Gollwitzer, A.; Martel, C.; Brady, W.J.; Pärnamets, P.; Freedman, I.G.; Knowles, E.D.; Van Bavel, J.J. Partisan differences in physical distancing are linked to health outcomes during COVID-19 pandemic. Nat. Hum. Behav. 2020, 4, 1186–1197. [Google Scholar] [CrossRef] [PubMed]
- Israel Central Bureau of Statistics. Characterization and Classification of Geographical Units by the Socio-Economic Level of the Population 2008; Israel Central Bureau of Statistics: Jerusalem, Israel, 2008. [Google Scholar]
- Meeuwis, M.; Parker, J.A.; Schoar, A.; Simester, D. Belief disagreement and portfolio choice. J. Finance 2022, 77, 3191–3247. [Google Scholar] [CrossRef]
- Agmon, T. The Socio-economic Index of the Central Bureau of Statistics; Hebrew: Jerusalem, Israel, 2016. [Google Scholar]
- Ben-Shahar, D.; Gabriel, S.; Golan, R. Can’t get there from here: Affordability distance to a superstar city. Reg. Sci. Urban Econ. 2020, 80, 103357. [Google Scholar] [CrossRef]
- Atkinson, M.D.; Fowler, A. Social capital and voter turnout: Evidence from Saint’s day fiestas in Mexico. Br. J. Political Sci. 2014, 44, 41–59. [Google Scholar] [CrossRef]
- Barrios, J.M.; Benmelech, E.; Hochberg, Y.; Sapienza, P.; Zingales, L. Civic capital and social distancing during the COVID-19 pandemic. J. Public Econ. 2021, 193, 104310. [Google Scholar] [CrossRef]
- Putnam, R.D. Tuning In, Tuning Out: The Strange Disappearance of Social Capital in America. PS Political Sci. Politics 1995, 28, 664–683. [Google Scholar] [CrossRef]
- Uslaner, E.M.; Brown, M. Inequality, trust, and civic engagement. Am. Politics Res. 2005, 33, 868–894. [Google Scholar] [CrossRef]
- Forgy, E.W. Cluster analysis of multivariate data: Efficiency versus interpretability of classifications. Biometrics 1965, 21, 768–769. [Google Scholar]
- Lloyd, S.P. Least squares quantization in PCM. IEEE Trans. Inf. Theory 1982, 28, 129–137. [Google Scholar] [CrossRef]
- Thorndike, R.L. Who belongs in the family? Psychometrika 1953, 18, 267–276. [Google Scholar] [CrossRef]
- Kojima, N.; Klausner, J. Protective immunity after recovery from SARS-CoV-2 infection. Lancet 2021, 22, 12–14. [Google Scholar] [CrossRef]
- Kumar, A.; Page, J.K.; Spalt, G. Religious beliefs, gambling attitudes, and financial market outcomes. J. Financ. Econ. 2011, 102, 671–708. [Google Scholar] [CrossRef]
- Shu, T.; Sulaeman, J.; Yeung, E. Local religious beliefs and mutual fund risk-taking behaviors. Manag. Sci. 2012, 58, 1779–1796. [Google Scholar] [CrossRef]
- Stulz, R.M.; Williamson, R. Culture, openness, and finance. J. Financ. Econ. 2003, 70, 313–349. [Google Scholar] [CrossRef]
- Bartels, L.M. Beyond the running tally: Partisan bias in political perceptions. Political Behav. 2002, 24, 117–150. [Google Scholar] [CrossRef]
- Gaines, B.J.; Kuklinski, J.H.; Quirk, P.J.; Peyton, B.; Verkuilen, J. Same facts, different interpretations: Partisan motivation and opinion on Iraq. J. Politics 2007, 69, 957–974. [Google Scholar] [CrossRef]


| Variable | Description | Mean | Std | Min | Max | Right | Center | Left | Arab | Orthodox |
|---|---|---|---|---|---|---|---|---|---|---|
| Infections | Total number of weekly infections | 4.6 | 12.2 | 0 | 544 | 3.9 | 3.0 | 2.0 | 5.1 | 16.2 |
| Vaccinations | Total number of weekly vaccinations | 195.4 | 169.9 | 0 | 2334 | 185.9 | 215.7 | 226.0 | 200.6 | 114.6 |
| Ln (OddsInfect) | Log odds of weekly infections | −6.17 | 1.89 | −6.90 | 6.90 | −6.12 | −6.25 | −6.42 | −6.15 | −5.73 |
| Ln (OddsVac) | Log odds of weekly vaccinations | −4.79 | 3.72 | −6.90 | 6.90 | −4.94 | −4.76 | −4.55 | −5.02 | −4.74 |
| Right | Dummy variable equals 1 for right-leaning cluster | 0.38 | 0.48 | 0 | 1 | |||||
| Center | Dummy variable equals 1 for center cluster | 0.28 | 0.45 | 0 | 1 | |||||
| Left | Dummy variable equals 1 for left-leaning cluster | 0.18 | 0.38 | 0 | 1 | |||||
| Orthodox | Dummy variable equals 1 for Orthodox Jewish cluster | 0.10 | 0.30 | 0 | 1 | |||||
| Arab | Dummy variable equals 1 for Arab cluster | 0.049 | 0.217 | 0 | 1 | |||||
| RightCont | Share of votes for right-leaning parties | 0.37 | 0.18 | 0 | 0.89 | 0.53 | 0.41 | 0.24 | 0.04 | 0.11 |
| OrthodoxCont | Share of votes for Orthodox Jewish parties | 0.17 | 0.24 | 0 | 0.98 | 0.16 | 0.07 | 0.02 | 0.01 | 0.85 |
| ArabCont | Share of votes for United Arab List | |||||||||
| NonVoter | Share of non-voters among those eligible to vote | 0.34 | 0.09 | 0.10 | 0.86 | 0.37 | 0.35 | 0.3 | 0.38 | 0.27 |
| Pop | Population size | 4589 | 2465 | 1974 | 27,768 | 4279 | 4454 | 4393 | 5796 | 5917 |
| Density | Population density (Pop divided by geographic area in square kilometers) | 13,177 | 10,223 | 39.3 | 66,159 | 10,827 | 13,555 | 12,107 | 6888 | 26,198 |
| SES | Socio-economic index score | 0.22 | 1.01 | −3.13 | 2.53 | −0.11 | 0.63 | 1.52 | −0.75 | −1.59 |
| ProximityTA | Distance to Tel Aviv (index) | 0.68 | 0.93 | −4.97 | 1.48 | 0.44 | 0.79 | 1.16 | −0.06 | 0.77 |
| Age60 | Share of population over the age of 60 | 0.20 | 0.07 | 0 | 0.49 | 0.21 | 0.23 | 0.21 | 0.12 | 0.08 |
| Age15 | Share of population under the age of 15 | 0.24 | 0.08 | 0.05 | 0.65 | 0.24 | 0.22 | 0.21 | 0.27 | 0.43 |
| PersonHH | Average number of persons in the household | 3.18 | 0.83 | 1.50 | 7.10 | 3.13 | 2.94 | 2.74 | 3.82 | 4.66 |
| RoomsHH | Average number of rooms per person | 1.52 | 0.26 | 0.58 | 2.44 | 1.51 | 1.61 | 1.75 | 1.25 | 1.1 |
| Column | (1) | (2) | (3) | (4) | (5) | (6) | (7) | (8) |
|---|---|---|---|---|---|---|---|---|
| Outcome Term | Vac | Vac | Vac | Infect | Infect | Infect | Infect | Infect |
| Constant | −2.523 (0.024) | −2.482 (0.333) | −2.946 (0.325) | −6.671 (0.005) | −6.394 (0.097) | −6.638 (0.071) | −6.511 (0.089) | −5.950 (0.179) |
| Left | 0.520 (0.065) | −0.073 (0.091) | −0.517 (0.097) | −0.154 (0.007) | −0.065 (0.017) | 0.089 (0.014) | 0.50 (0.015) | −0.161 (0.071) |
| Center | 0.250 (0.046) | 0.014 (0.046) | −0.159 (0.054) | −0.077 (0.007) | −0.031 (0.010) | 0.050 (0.008) | 0.040 (0.008) | −0.016 (0.085) |
| Orthodox | −0.456 (0.075) | 0.011 (0.122) | 0.253 (0.128) | 0.462 (0.020) | 0.229 (0.028) | −0.259 (0.023) | −0.211 (0.025) | −0.318 (0.137) |
| Arab | −0.152 (0.100) | 0.119 (0.108) | −0.152 (0.201) | 0.001 (0.020) | −0.056 (0.022) | −0.021 (0.016) | −0.050 (0.015) | −0.775 (0.116) |
| Infectionst−1 | 0.177 (0.018) | 0.179 (0.008) | 0.165 (0.009) | 0.272 (0.016) | ||||
| Left Infectionst−1 | 0.343 (0.044) | −0.168 (0.014) | −0.129 (0.014) | −0.167 (0.027) | ||||
| Center Infectionst−1 | 0.106 (0.018) | −0.071 (0.010) | −0.072 (0.010) | −0.065 (0.030) | ||||
| Orthodox Infectionst−1 | −0.050 (0.017) | 0.217 (0.011) | 0.216 (0.014) | 0.235 (0.030) | ||||
| Arab Infectionst−1 | 0.150 (0.060) | −0.010 (0.015) | 0.011 (0.021) | −0.028 (0.039) | ||||
| t | −0.301 (0.007) | |||||||
| Left t | 0.149 (0.011) | |||||||
| Center t | 0.043 (0.011) | |||||||
| Orthodox t | −0.121 (0.015) | |||||||
| Arab t | 0.227 (0.024) | |||||||
| Controls | No | Yes | Yes | No | Yes | Yes | Yes | Yes |
| N | 25,650 | 25,650 | 25,650 | 51,300 | 51,300 | 51,300 | 27,000 | 6750 |
| Number of weeks | 19 | 19 | 19 | 39 | 38 | 38 | 20 | 5 |
| Prob(F) | 0 | 0 | 0 | 0 | 0 | 0 | 0 | 0 |
| R2-overall | 0.039 | 0.058 | 0.178 | 0.113 | 0.126 | 0.468 | 0.481 | 0.747 |
Disclaimer/Publisher’s Note: The statements, opinions and data contained in all publications are solely those of the individual author(s) and contributor(s) and not of MDPI and/or the editor(s). MDPI and/or the editor(s) disclaim responsibility for any injury to people or property resulting from any ideas, methods, instructions or products referred to in the content. |
© 2023 by the authors. Licensee MDPI, Basel, Switzerland. This article is an open access article distributed under the terms and conditions of the Creative Commons Attribution (CC BY) license (https://creativecommons.org/licenses/by/4.0/).
Share and Cite
Ben-Shahar, D.; Gabriel, S.; Golan, R. The Role of Political Belief in COVID-19 Vaccine Resistance, Virus Transmission, and Closure Policy Response. Vaccines 2023, 11, 1046. https://doi.org/10.3390/vaccines11061046
Ben-Shahar D, Gabriel S, Golan R. The Role of Political Belief in COVID-19 Vaccine Resistance, Virus Transmission, and Closure Policy Response. Vaccines. 2023; 11(6):1046. https://doi.org/10.3390/vaccines11061046
Chicago/Turabian StyleBen-Shahar, Danny, Stuart Gabriel, and Roni Golan. 2023. "The Role of Political Belief in COVID-19 Vaccine Resistance, Virus Transmission, and Closure Policy Response" Vaccines 11, no. 6: 1046. https://doi.org/10.3390/vaccines11061046
APA StyleBen-Shahar, D., Gabriel, S., & Golan, R. (2023). The Role of Political Belief in COVID-19 Vaccine Resistance, Virus Transmission, and Closure Policy Response. Vaccines, 11(6), 1046. https://doi.org/10.3390/vaccines11061046