Article

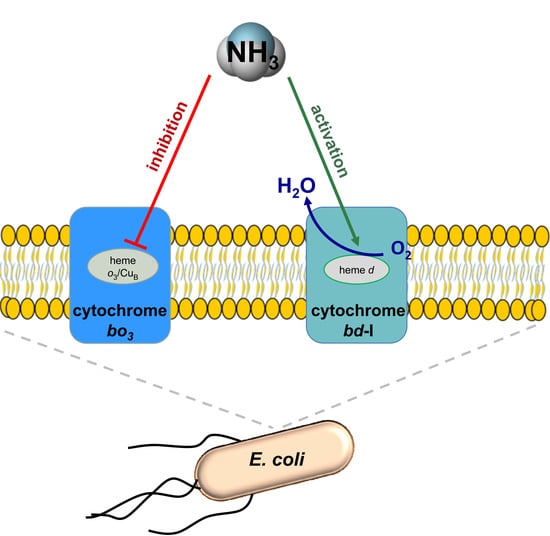
In Escherichia coli Ammonia Inhibits Cytochrome bo3 But Activates Cytochrome bd-I

by
Elena Forte
1,*,
Sergey A. Siletsky
2 and
Vitaliy B. Borisov
2,*
1
Department of Biochemical Sciences, Sapienza University of Rome, P.le A. Moro 5, 00185 Rome, Italy
2
Belozersky Institute of Physico-Chemical Biology, Lomonosov Moscow State University, Leninskie Gory, 119991 Moscow, Russia
*
Authors to whom correspondence should be addressed.
Antioxidants 2021, 10(1), 13; https://doi.org/10.3390/antiox10010013
Submission received: 20 November 2020 / Revised: 18 December 2020 / Accepted: 21 December 2020 / Published: 25 December 2020
(This article belongs to the Special Issue Redox Biology in Microorganisms)

Abstract

:
Interaction of two redox enzymes of Escherichia coli, cytochrome bo3 and cytochrome bd-I, with ammonium sulfate/ammonia at pH 7.0 and 8.3 was studied using high-resolution respirometry and absorption spectroscopy. At pH 7.0, the oxygen reductase activity of none of the enzymes is affected by the ligand. At pH 8.3, cytochrome bo3 is inhibited by the ligand, with 40% maximum inhibition at 100 mM (NH4)2SO4. In contrast, the activity of cytochrome bd-I at pH 8.3 increases with increasing the ligand concentration, the largest increase (140%) is observed at 100 mM (NH4)2SO4. In both cases, the effector molecule is apparently not NH4+ but NH3. The ligand induces changes in absorption spectra of both oxidized cytochromes at pH 8.3. The magnitude of these changes increases as ammonia concentration is increased, yielding apparent dissociation constants Kdapp of 24.3 ± 2.7 mM (NH4)2SO4 (4.9 ± 0.5 mM NH3) for the Soret region in cytochrome bo3, and 35.9 ± 7.1 and 24.6 ± 12.4 mM (NH4)2SO4 (7.2 ± 1.4 and 4.9 ± 2.5 mM NH3) for the Soret and visible regions, respectively, in cytochrome bd-I. Consistently, addition of (NH4)2SO4 to cells of the E. coli mutant containing cytochrome bd-I as the only terminal oxidase at pH 8.3 accelerates the O2 consumption rate, the highest one (140%) being at 27 mM (NH4)2SO4. We discuss possible molecular mechanisms and physiological significance of modulation of the enzymatic activities by ammonia present at high concentration in the intestines, a niche occupied by E. coli.

Graphical Abstract

1. Introduction

Cytochrome bo3 and cytochrome bd-I are terminal oxidases in the aerobic respiratory chain of Escherichia coli [1]. Both enzymes catalyze the same redox reaction, the electron transfer from ubiquinol-8 to molecular oxygen giving rise to ubiquinone-8 and water [2,3]. In both cases this reaction is coupled to the formation of an electrochemical proton gradient across the bacterial cytoplasmic membrane [4,5,6]. Nevertheless, the bo3 oxidase shows a higher energy transduction efficiency than the bd-I oxidase because the former utilizes the proton pumping mechanism [4,7].
The 3D structures of the proteins were determined [8,9,10]. Each one is composed of four different subunits, however the cytochromes are structurally and evolutionarily unrelated. Cytochrome bo3 is a member of type A-1 of the heme-copper oxidase superfamily [11,12,13,14,15,16]. It carries the ubiquinol binding site, two hemes, b and o3, and a copper ion [17]. The latter, denoted CuB, forms together with heme o3 a binuclear site in which the oxygen chemistry takes place. The bd-type oxidases form their own family, distinct from the heme-copper superfamily, and the E. coli cytochrome bd-I belongs to the L subfamily of that family [3,18]. The bd-I enzyme has no copper but contains a binding site for ubiquinol and three hemes, b558, b595, and d. Heme d serves as the site for the O2 reduction reaction.
Cytochrome bo3 and cytochrome bd-I are expressed in E. coli under normal and low aeration conditions, respectively [19]. This is consistent with the fact that bo3 is a low-oxygen-affinity oxidase [20], whereas bd-I is a high-oxygen-affinity oxidase [21]. The oxidases bo3 and bd-I differ in their sensitivity to small ligands. Cytochrome bo3 was shown to be much more sensitive to NO, H2S and cyanide than cytochrome bd-I [22,23,24,25,26,27]. The situation seems to be the opposite only in relation to the inhibition of the oxidases by CO [28]. The bd-I enzyme also contributes to the protection of E. coli against oxidative and nitrosative stress, playing an active antioxidant role in scavenging peroxynitrite and H2O2 [29,30,31,32]. The fact that the bd-type oxidase endows microbes with resistance to the toxic small molecules may explain why this respiratory enzyme is so abundant among bacterial pathogens. Since the bd protein is found only in prokaryotes, it may become a suitable target for next-generation antimicrobials [33].
E. coli is a consistent inhabitant of the intestinal tract of humans and warm-blooded animals. It is known that the intestines, particularly the large intestine lumen, reveal very high concentrations of ammonia, being in the millimolar range [34]. This raises the question of whether this ligand affects the functioning of the bacterial terminal oxidases. In this work, we have examined the effect of ammonia on oxygen consumption of cytochromes bo3 and bd-I of E. coli (at the level of both isolated enzymes and intact cells) and absorption spectra of the enzymes. To our knowledge, the effect of this ligand on a terminal quinol oxidase has never been studied.

2. Materials and Methods

2.1. Reagents and Purification of Cytochromes bd-I and bo3 from E. coli

Tris Base was purchased from Fisher BioReagents. Other chemicals were purchased from Sigma-Aldrich. Cytochromes bd-I and bo3 were isolated from the E. coli strains GO105/pTK1 and GO105/pJRhisA, respectively, as described by [35,36,37]. In the case of cytochrome bd-I, the fractions with an absorbance ratio of A412/A280 ≥ 0.7 eluted from a DEAE Sepharose Fast Flow anion exchange column were pooled and concentrated [36]. Cytochrome bo3 preparations were a kind gift of Marina Verkhovskaya (University of Helsinki). Being a His-tagged fusion protein, cytochrome bo3 was purified by immobilized metal chelate affinity chromatography on Ni-NTA Agarose. The fractions eluted from the column containing pure four-subunit cytochrome bo3 were pooled and concentrated [37]. The sample quality was evaluated by measuring enzyme activity and absorption spectra. All prepared samples showed high oxygen reductase activity (Vmax of about 150 mol O2/mol cytochrome bd-I/s and 60 mol O2/mol cytochrome bo3/s in the presence of the electron donor/mediator couple 10 mM dithiothreitol (DTT) and 0.25 mM 2,3-dimethoxy-5-methyl-6-(3-methyl-2-butenyl)-1,4-benzoquinone (Q1) at pH 7.0) and characteristic absorption spectra both “as prepared” and dithionite-reduced. The concentration of cytochrome bd-I was determined from the dithionite reduced-minus-“as prepared” difference absorption spectra using Δε628-607 of 10.8 mM−1 cm−1 [38]. Cytochrome bo3 concentration was estimated from the Soret absorption band of the oxidized enzyme using ε407 of 182 mM−1 cm−1 [39].

2.2. Measurement Techniques and Assay Conditions.

O2 consumption of cytochromes bd-I and bo3 was measured using an Oxygraph-2k high-resolution respirometer (Oroboros Instrument, Innsbruck, Austria) equipped with two 1.5-mL chambers. UV-visible absorption spectra were recorded in an Agilent Cary 60 UV-Vis spectrophotometer. Assays were performed at 25 °C in 100 mM Tris-phosphate (pH 8.3) or 100 mM potassium phosphate (pH 7.0) buffer containing 0.1 mM EDTA, 2.5 μg/mL catalase, 10 mM DTT, 0.25 mM Q1, and either 0.05% N-lauroyl-sarcosine (cytochrome bd-I) or 0.02% dodecyl-β-d-maltoside (cytochrome bo3). The concentrations of cytochrome bo3 and cytochrome bd-I used in the oxygraphic measurements were 20 nM and 7.8 nM at pH 8.3, and 12 nM and 3.9 nM at pH 7.0 respectively. In the spectroscopic measurements, the concentrations of cytochrome bo3 and cytochrome bd-I were 4.8 μM and 3.2 μM respectively. The pH of the stock solutions of (NH4)2SO4 and K2SO4 was adjusted to the desired values (8.3 or 7.0). To generate the reduced state of cytochrome bo3 or cytochrome bd-I, a few grains of solid sodium dithionite were added. The oxidized state of cytochrome bd-I was produced by incubating the “as isolated” enzyme with 33 μM tetrachloro-1,4-benzoquinone for 10 min [40]. To remove excess oxidant, the sample was centrifuged at 4 °C and the yellow pellet discarded.

2.3. Data Analysis

Data analysis was carried out using Origin (OriginLab Corporation). To compare the (NH4)2SO4 titration data obtained in oxygraphic and spectroscopic experiments, they were fitted to the standard hyperbolic equation y = Amax·x/(Kdapp + x) using a built-in approximation function (“hyperbola function”) in “advanced fitting tool” in the Origin program. Amax and Kdapp parameters were allowed to vary. Kdapp is an apparent dissociation constant. In oxygraphic experiments, Amax is either a theoretical maximum percent inhibition (cytochrome bo3) or a theoretical maximum percent activity (cytochrome bd-I). In spectroscopic experiments, Amax is a theoretical maximum absorption change. R-square (R2) and standard deviation reported by the Origin program are shown in the figure legends. Since the high ionic strength may affect the activity of an enzyme [41], in order to take into account this possible effect, K2SO4 at the same concentration was added to the enzyme for each condition as a control.

3. Results

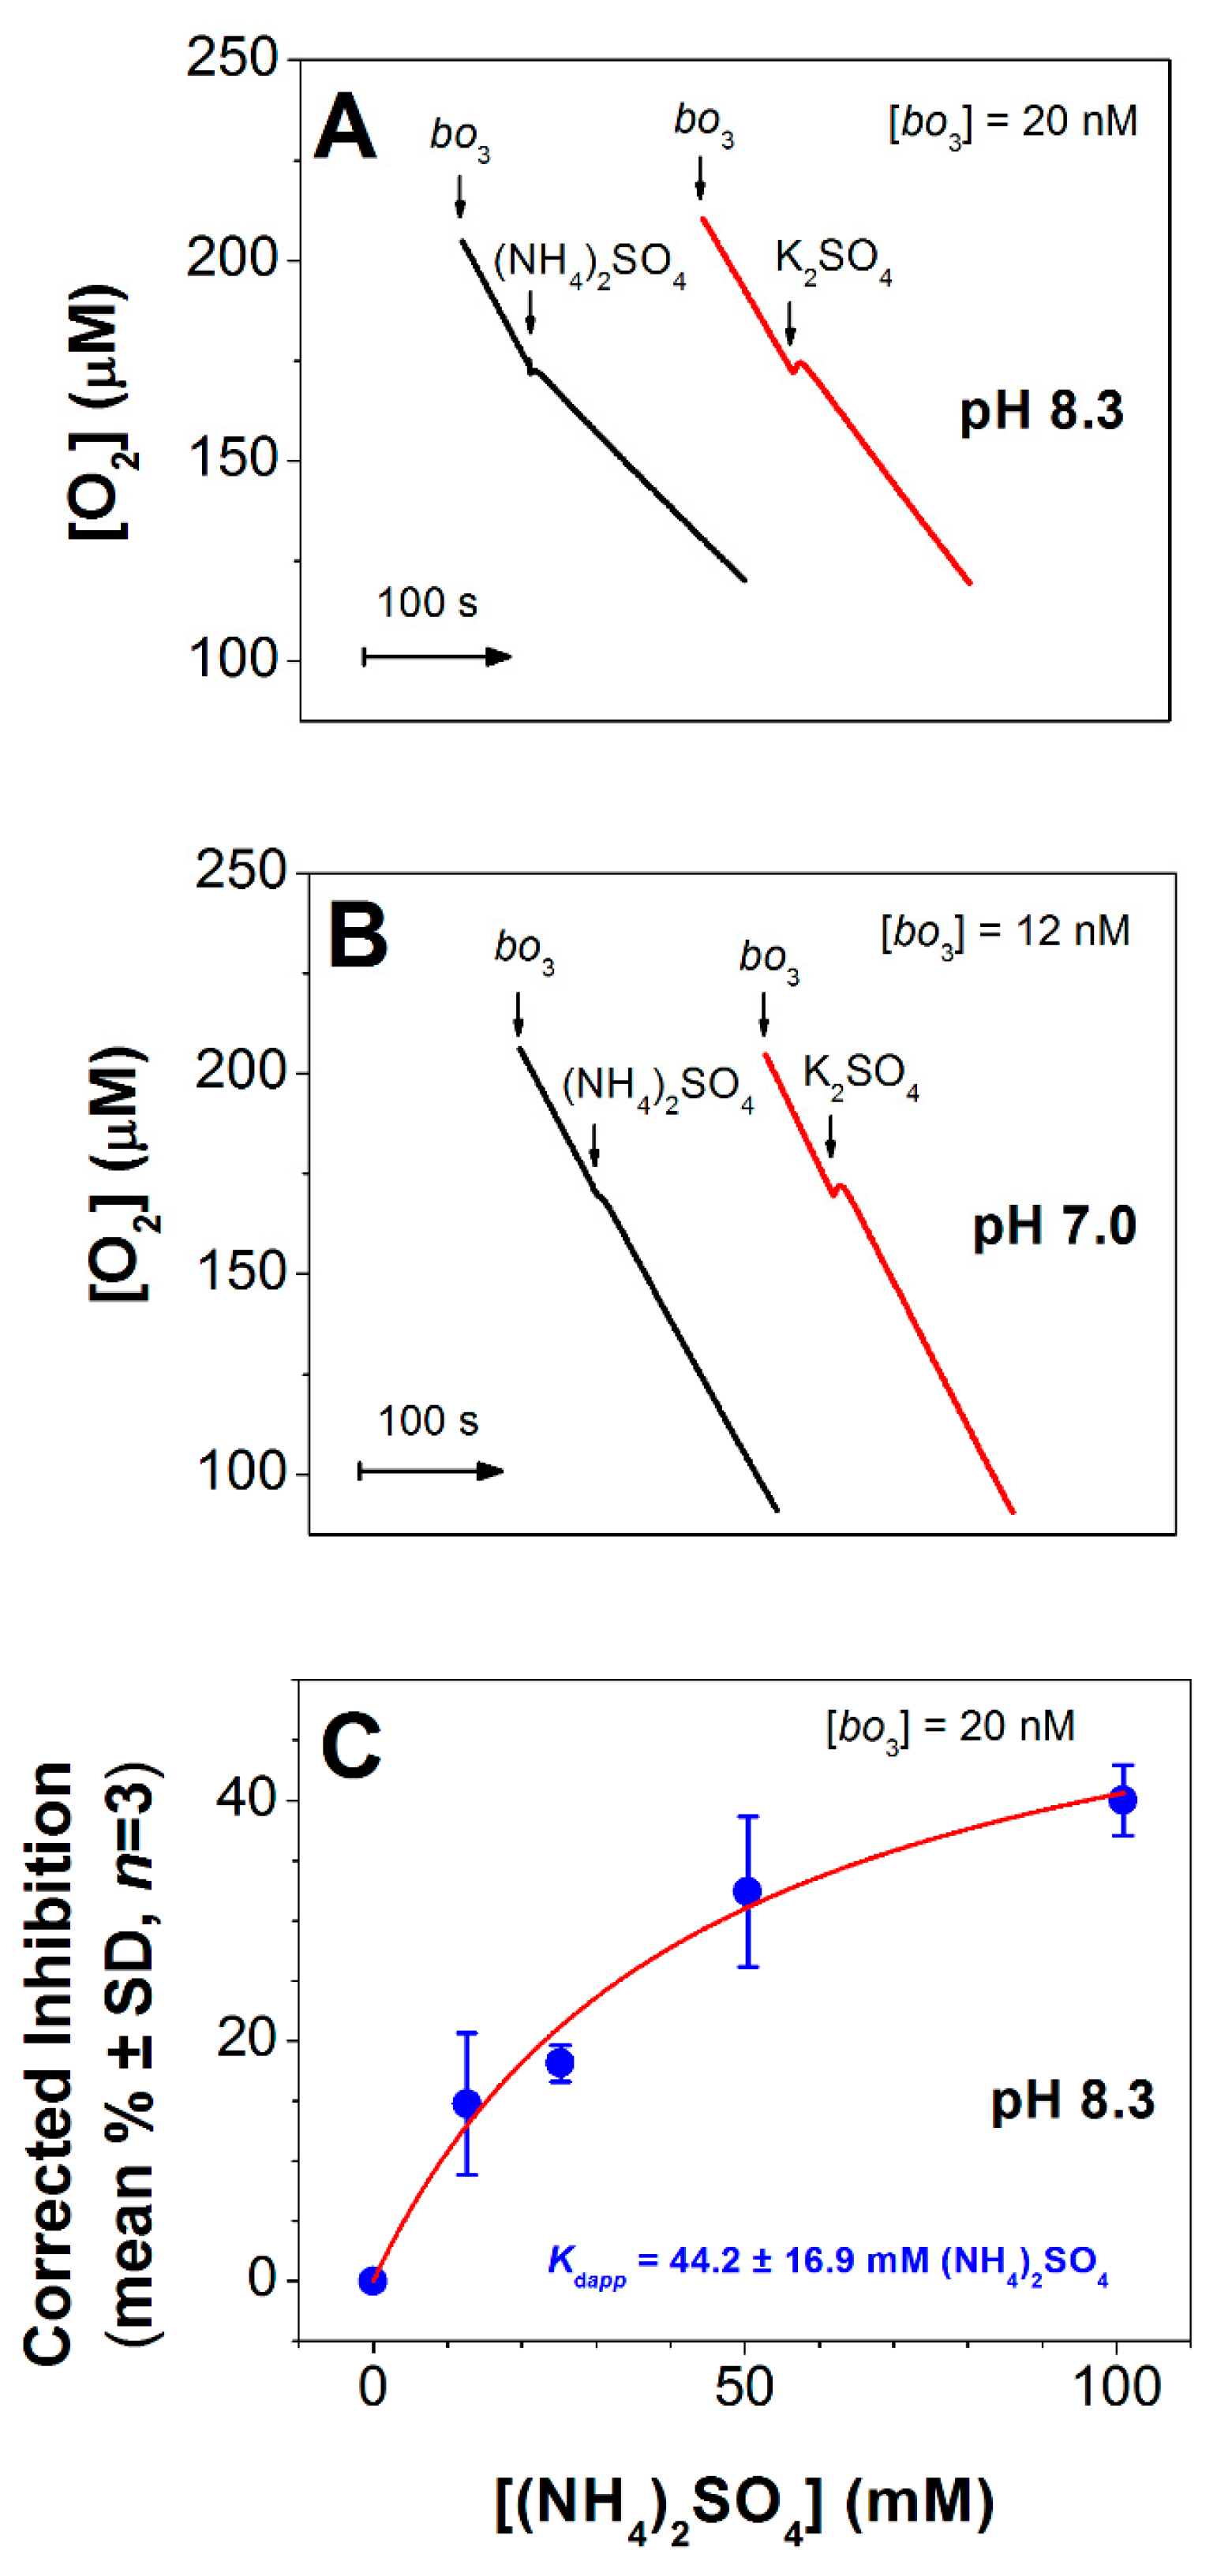
3.1. Effect of (NH4)2SO4 on O2 Reductase Activity of E. coli Cytochrome bo3

The effect of (NH4)2SO4 on the O2-reductase activity of the isolated cytochrome bo3 from E. coli was examined by measuring the O2 consumption rates before and after addition of the effector at pH 8.3 or 7.0. Figure 1A shows that at pH 8.3 the addition of 50 mM (NH4)2SO4 rapidly inhibits the O2 reductase activity of cytochrome bo3 by 51%. To take into account the effect of increasing ionic strength on enzyme activity, K2SO4 was added to the oxidase under the same conditions as a control. As shown in Figure 1A, 50 mM K2SO4 at pH 8.3 inhibits cytochrome bo3 to a much lesser extent (by 18%). At pH 7.0 (NH4)2SO4 does not inhibit the O2 reductase activity of the bo3 enzyme (Figure 1B). Figure 1C shows that with the increase in (NH4)2SO4 concentration, the inhibitory effect at pH 8.3 is progressively increased. The maximum inhibition observed (after subtraction of the corresponding control value with K2SO4) was 40% at 100 mM (NH4)2SO4.
We also studied the effect of (NH4)2SO4 on O2 consumption by E. coli mutant cells expressing cytochrome bo3 as a single terminal oxidase. Supplementary Figures S1B and S2 show that within the limits of the experimental error the addition of (NH4)2SO4 up to 27 mM at pH 8.3 caused no significant change in the respiration of the intact cells.

3.2. Effect of (NH4)2SO4 on Absorption Spectra of E. coli Cytochrome bo3

The finding that (NH4)2SO4 can inhibit cytochrome bo3 pushed us to explore the effect of ammonia on absorption spectra of the isolated cytochrome bo3. Figure 2A shows the spectral changes induced by the addition of (NH4)2SO4 at millimolar concentrations to the oxidized cytochrome bo3 at pH 8.3. The ammonia-induced spectrum showed a red shift of the enzyme Soret band with a maximum at 416 nm and a minimum at 400 nm. In the visible spectrum, some weak intensity broad bands were displayed, the most pronounced of which was a band with a minimum around 630 nm. The spectral changes caused by the ligand are possibly due to its binding to the heme o3-CuB binuclear site. The observed changes could be also due to a small reduction of the enzyme. However, the reduced-minus-oxidized spectrum in the Soret region of cytochrome bo3 showed a maximum at 428–430 nm [39,42] rather than 416 nm. The magnitude of the Soret spectral changes increased as (NH4)2SO4 concentration was increased (Figure 2B). Analysis of the titration curve yields Kdapp of 24.3 ± 2.7 mM (NH4)2SO4 and the value for maximum absorption change at 416–400 nm Amax of 22.1 ± 0.6 mM−1cm−1. It has to be noted that the titration profile (Figure 2B) is similar to that for the plot of percent inhibition versus (NH4)2SO4 (Figure 1C). The addition of (NH4)2SO4 to the dithionite-reduced cytochrome bo3 under identical conditions brought about no spectral change.

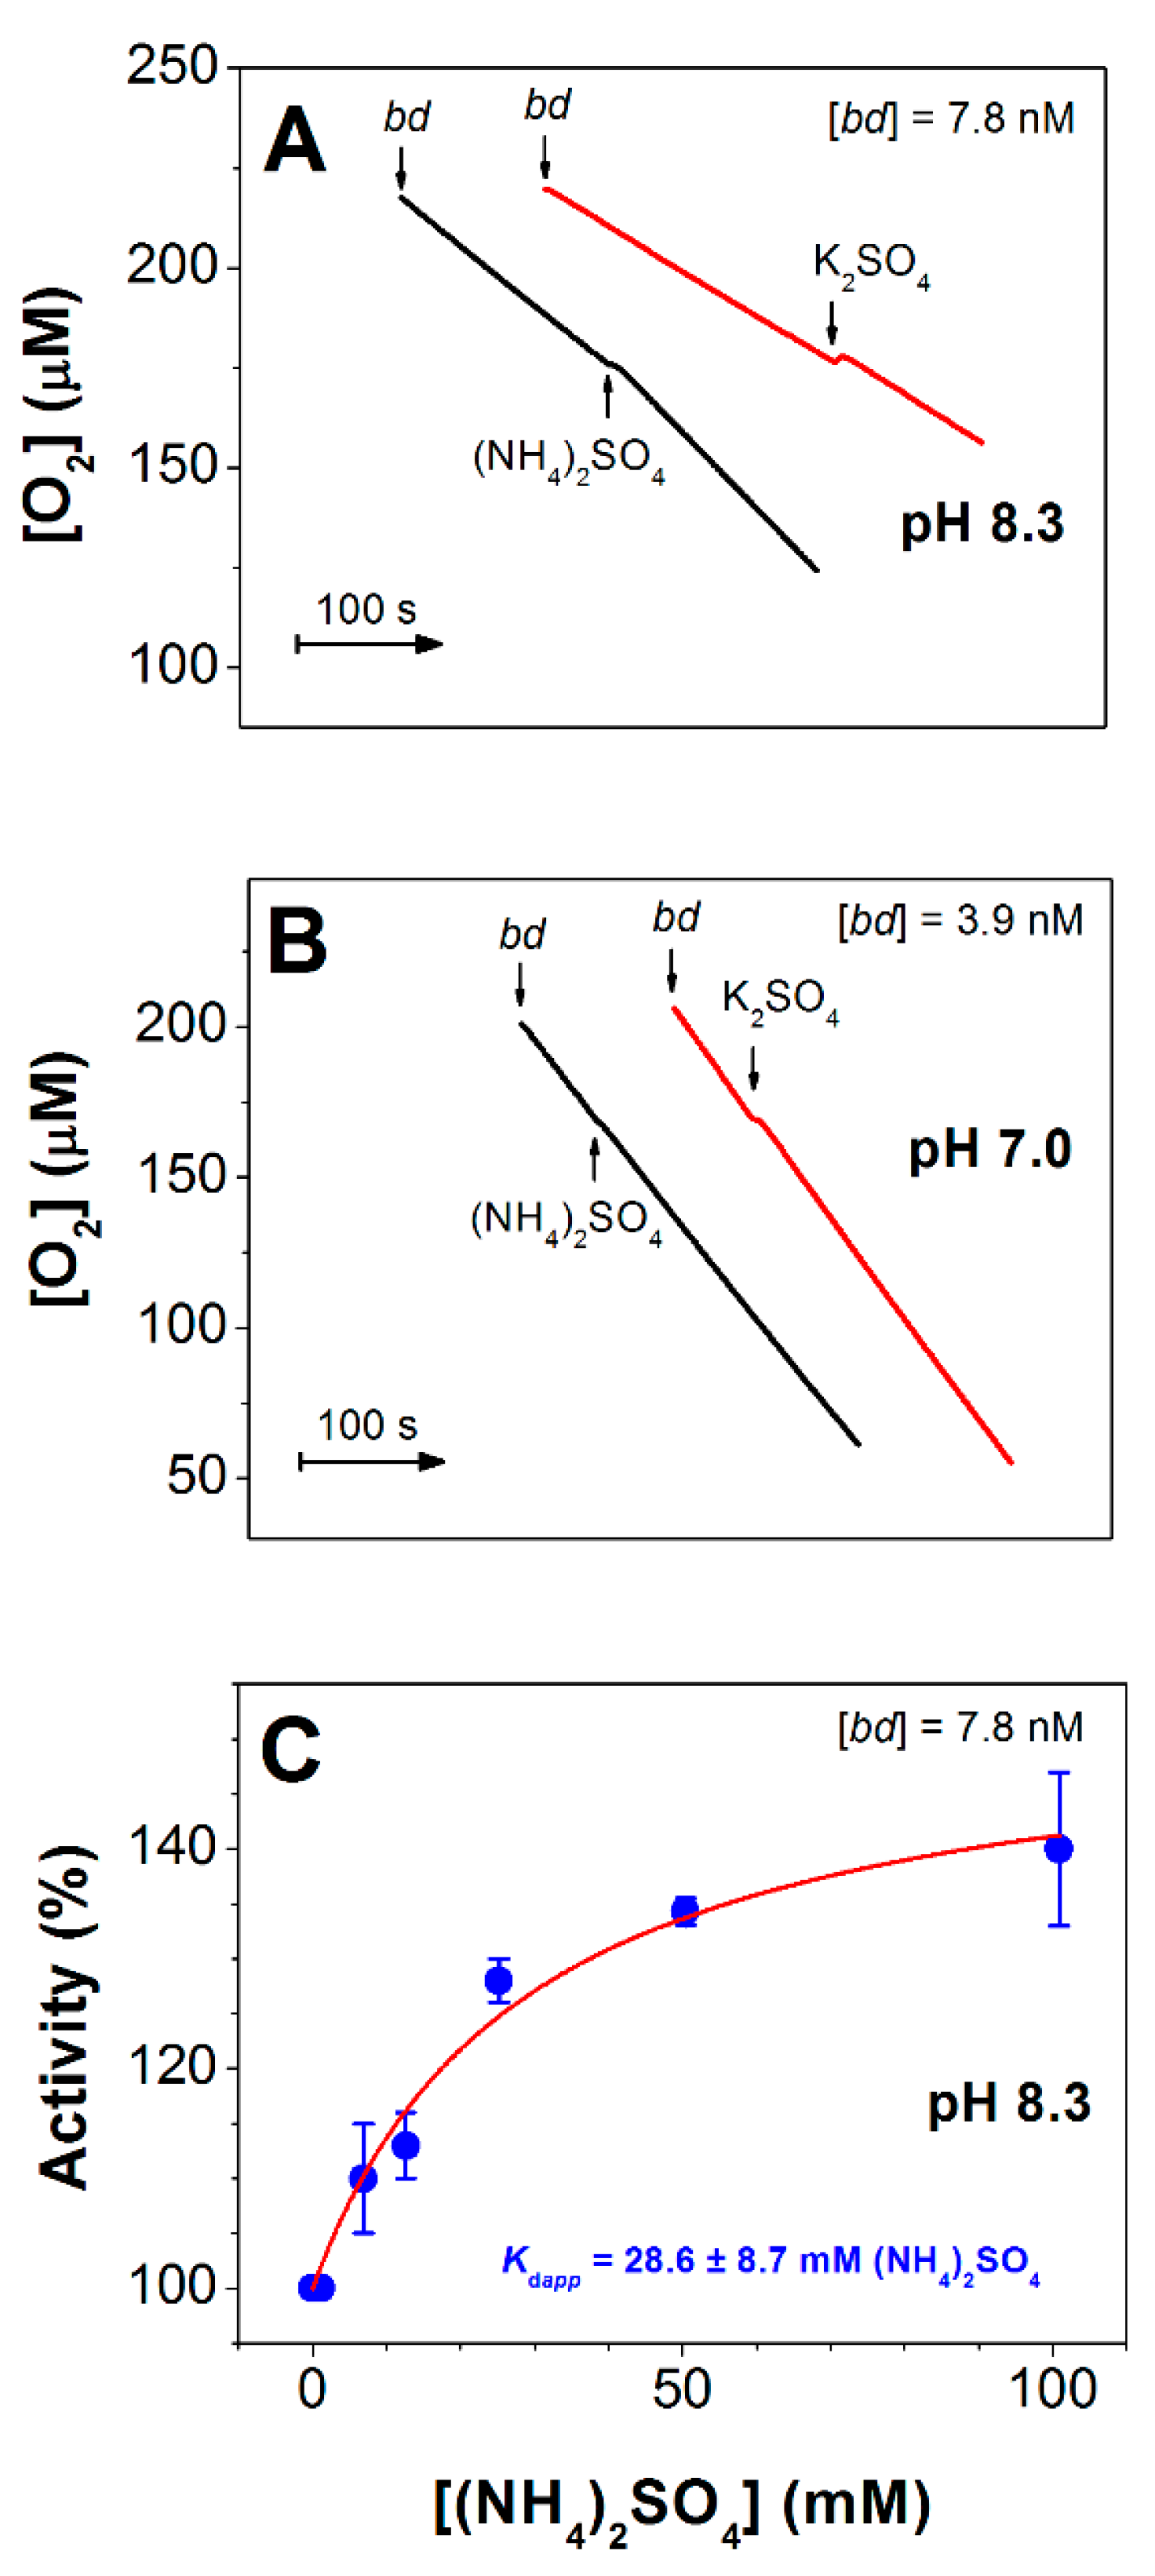
3.3. Effect of (NH4)2SO4 on O2 Reductase Activity of E. coli Cytochrome bd-I

Next, we studied the influence (NH4)2SO4 on the O2-reductase activity of the isolated cytochrome bd-I from E. coli under the same conditions as used for the bo3 oxidase. We found that in contrast to cytochrome bo3, cytochrome bd-I is not inhibited by millimolar concentrations of (NH4)2SO4 at pH 8.3. Furthermore, under these conditions, activation of the catalytic activity of the enzyme was observed.
As shown in Figure 3A, at pH 8.3 the addition of 25 mM (NH4)2SO4 increased the rate of O2 consumption of cytochrome bd-I by 39%. In the control with 25 mM K2SO4, the increase in the rate was significantly lower (by 11%). At pH 7.0, there was no effect of (NH4)2SO4 on the O2 reductase activity of cytochrome bd-I (Figure 3B). At pH 8.3, the O2 reductase activity of cytochrome bd-I increased with an increase in ammonia concentration (Figure 3C). Maximum activation in enzyme activity, 140%, was observed following the addition of 100 mM (NH4)2SO4 (after subtraction of the control with K2SO4).
We also studied the effect of (NH4)2SO4 on O2 consumption by E. coli mutant cells containing cytochrome bd-I as the only terminal oxidase. Supplementary Figures S1A and S2 show that at pH 8.3 the addition of (NH4)2SO4 up to 27 mM increased respiration of the intact cells. Maximum acceleration of the O2 consumption rate (140%) was observed at 27 mM (NH4)2SO4. In the control with K2SO4 added at the same concentrations, there was no significant change in O2 consumption by the cells.

3.4. Effect of (NH4)2SO4 on Absorption Spectra of E. coli Cytochrome bd-I

Finally, we found that ammonia affects the absorption spectrum of the isolated cytochrome bd-I in the fully oxidized state. Figure 4A displays the spectral changes caused by the addition of (NH4)2SO4 at millimolar concentrations to the oxidized bd-I enzyme at pH 8.3.
In the Soret region, the ammonia-induced spectrum showed a red shift with a maximum at about 423–428 nm and a minimum around 395–408 nm. In the near-IR region, there were two maxima at ~623 and ~673 nm, and a broad minimum at ~740 nm. The changes may report the interaction of ammonia with the ferric heme d. The magnitude of the changes increased with increasing concentrations of (NH4)2SO4. Analysis of the absorption titration curves measured at 426–408 and 623–595 nm (Figure 4B,C) yields Kdapp of 35.9 ± 7.1 and 24.6 ± 12.4 mM (NH4)2SO4, respectively. The titration profile (Figure 4B,C) is similar to that for the plot of percent enzyme activity versus (NH4)2SO4 (Figure 3C).
No spectral change was observed, when under the same conditions, (NH4)2SO4 was added to cytochrome bd-I in the dithionite-reduced state.

4. Discussion

4.1. Proposed Mechanism for Inhibition of Cytochrome bo3 by Ammonia

The interaction of ammonia with a quinol oxidase has not been investigated before. Recently, von der Hocht et al. observed that in the presence of 20 mM (NH4)2SO4 at pH 9 the activity of the isolated aa3-type cytochrome c oxidase from Paracoccus denitrificans sustained by ascorbate, N,N,N’,N’-tetramethyl-p-phenylenediamine and cytochrome c decreased by 22% [43]. They also reported that at pH 9 the addition of ammonia to the H2O2-generated F state led to its conversion into a novel P state called PN [43]. P and F are two transient ferryl intermediates formed sequentially during the catalytic cycle of both heme-copper and bd-type terminal oxidases [44,45,46,47,48,49,50]. In the case of cytochrome c oxidase, spectrally similar artificial P and F intermediates can also be produced by the addition of H2O2 at different concentrations to the enzyme in the oxidized (O) state at alkaline pH [51,52]. In the new PN state [43], ammonia binds to CuB, as shown by resonance Raman spectroscopy [53].
Here, we showed that the O2 consumption of the isolated E. coli cytochrome bo3, sustained by DTT and Q1, was inhibited by (NH4)2SO4 at pH 8.3 (Figure 1A). At the maximum concentration of (NH4)2SO4 used (100 mM), the enzyme activity decreased by 40% (Figure 1C). The inhibition was not observed at pH 7.0. The pKa of ammonium in aqueous solution is known to be 9.25 at 25 °C. Using the Henderson-Hasselbalch equation one can calculate that when 100 mM of (NH4)2SO4 is added to the sample at pH 8.3 [NH4+] = 179.85 mM and [NH3] = 20.15 mM, whereas at pH 7.0 [NH4+] = 198.88 mM and [NH3] = 1.12 mM. In other words, by shifting the pH from 7.0 to 8.3, [NH3] increases 18 times, while [NH4+] does not change significantly (decreases only 1.1 times). Thus, we can conclude that it is ammonia rather than the ammonium ion that inhibits cytochrome bo3.
At pH 8.3, ammonia caused a red shift in the Soret band of the oxidized cytochrome bo3 (Figure 2A). The magnitude of the absorption changes increased with increasing the ligand concentration giving Kdapp of 24.3 ± 2.7 mM (NH4)2SO4 that corresponds to 4.9 ± 0.5 mM NH3 (Figure 2B). The titration profile was similar to that for the inhibition of the enzyme activity by ammonia (Figure 1C). Ingledew et al. earlier reported that the addition of cyanide induces a red shift in the Soret band of the oxidized cytochrome bo3 [54]. The binding of a ligand to the high-spin heme brings about a red shift of the Soret band in enzyme absorption spectra [1,54,55]. On the contrary, no absorption change or a small blue shift in the Soret band was observed when a ligand binds to CuB [1,56]. Thus, we suggest that ammonia binds to heme o3. This conclusion is supported by the fact that the ligand-induced red shift in the Soret band was accompanied by the loss of the broad charge transfer band around 630 nm (Figure 2A). The 630-nm band is characteristic of the fully oxidized binuclear site in which heme o3 is in a high-spin state [54]. The decay of this band suggests the conversion of the high-spin heme o3 into the low-spin ammonia complex. As a ferric heme usually binds an anion, we propose that NH3 binds to heme o3 in the form of NH2 with the release of H+. Both cyanide and azide can bridge between the ferric heme o3 and cupric CuB forming the following structures: Feo33+–C=N–CuB2+ and Feo33+–N=N=N–CuB2+, where Feo3 is the heme o3 iron [55,57,58]. Compared to these two ligands, ammonia is a much smaller molecule. Rather, NH3 can be compared to a water/hydroxide molecule that is a natural ligand of CuB in several states of the catalytic cycle of heme–copper oxidases [59]. For this reason, NH3 cannot be a bridging ligand at the binuclear site since a distance is around 4–5 Å. However, the binding of two NH3 molecules at the oxidized binuclear site at a time, one to heme o3 and the other to CuB, may occur. Indeed, NH3 is approximately the size of a water/hydroxide molecule. In some catalytic intermediates of a heme–copper oxidase, two molecules of H2O (or OH) can bind simultaneously at the binuclear site [59,60,61]. It could also be true for ammonia. We propose to designate the ammonia adduct of the oxidized cytochrome bo3 as N.
Importantly, the binding of hydroxide (as opposed to water) with the oxidized heme at the binuclear site leads to the transition of the heme from the high-spin to the low-spin state [62]. This process is enhanced at alkaline pH. For instance, at pH 9, about 50% of the ferric heme a3 is hydroxide-ligated whereas at pH 6.5, no hydroxide is bound to the heme [63]. The spectral shift caused by ammonia (Figure 2A) is similar to the effect of the formation of low-spin complexes of the initial high-spin heme with anionic ligands at the binuclear site. We suggest that when ammonia binds to the oxidized heme at alkaline pH, the complex with deprotonated ammonia (NH2) is formed, just as it happens with hydroxide. It has to be noted that a similar complex can be produced in cytochrome c nitrite reductase, before the release of the neutral ammonia, the final product of nitrite reduction, from the catalytic site [64]. Notably, the presence of a tyrosine residue near the heme is critically important. In cytochrome c nitrite reductase, the residue facilitates the transition of the heme from the high-spin to the low-spin state (via the stabilization of the radical form of the bound NH2) and serves as a proton donor/acceptor [64]. Surprisingly, all heme–copper oxidases also contain a conserved tyrosine residue that is part of the binuclear site. The tyrosine is bound to CuB through a histidine ligand and is critical for the proton pumping function. At the same time, the structure of cytochrome bd that lacks the proton pump shows no tyrosine residue nearby heme d (or heme b595) [9,10,65]. This could explain the higher sensitivity of the bo3 oxidase to the inhibitory effect of ammonia as compared to the bd oxidase.
Figure 5 shows a proposed molecular mechanism of inhibition of the catalytic activity of cytochrome bo3 by ammonia. The ligand binds to the catalytic intermediates O and F thereby blocking the oxygen reduction reaction cycle of the enzyme.

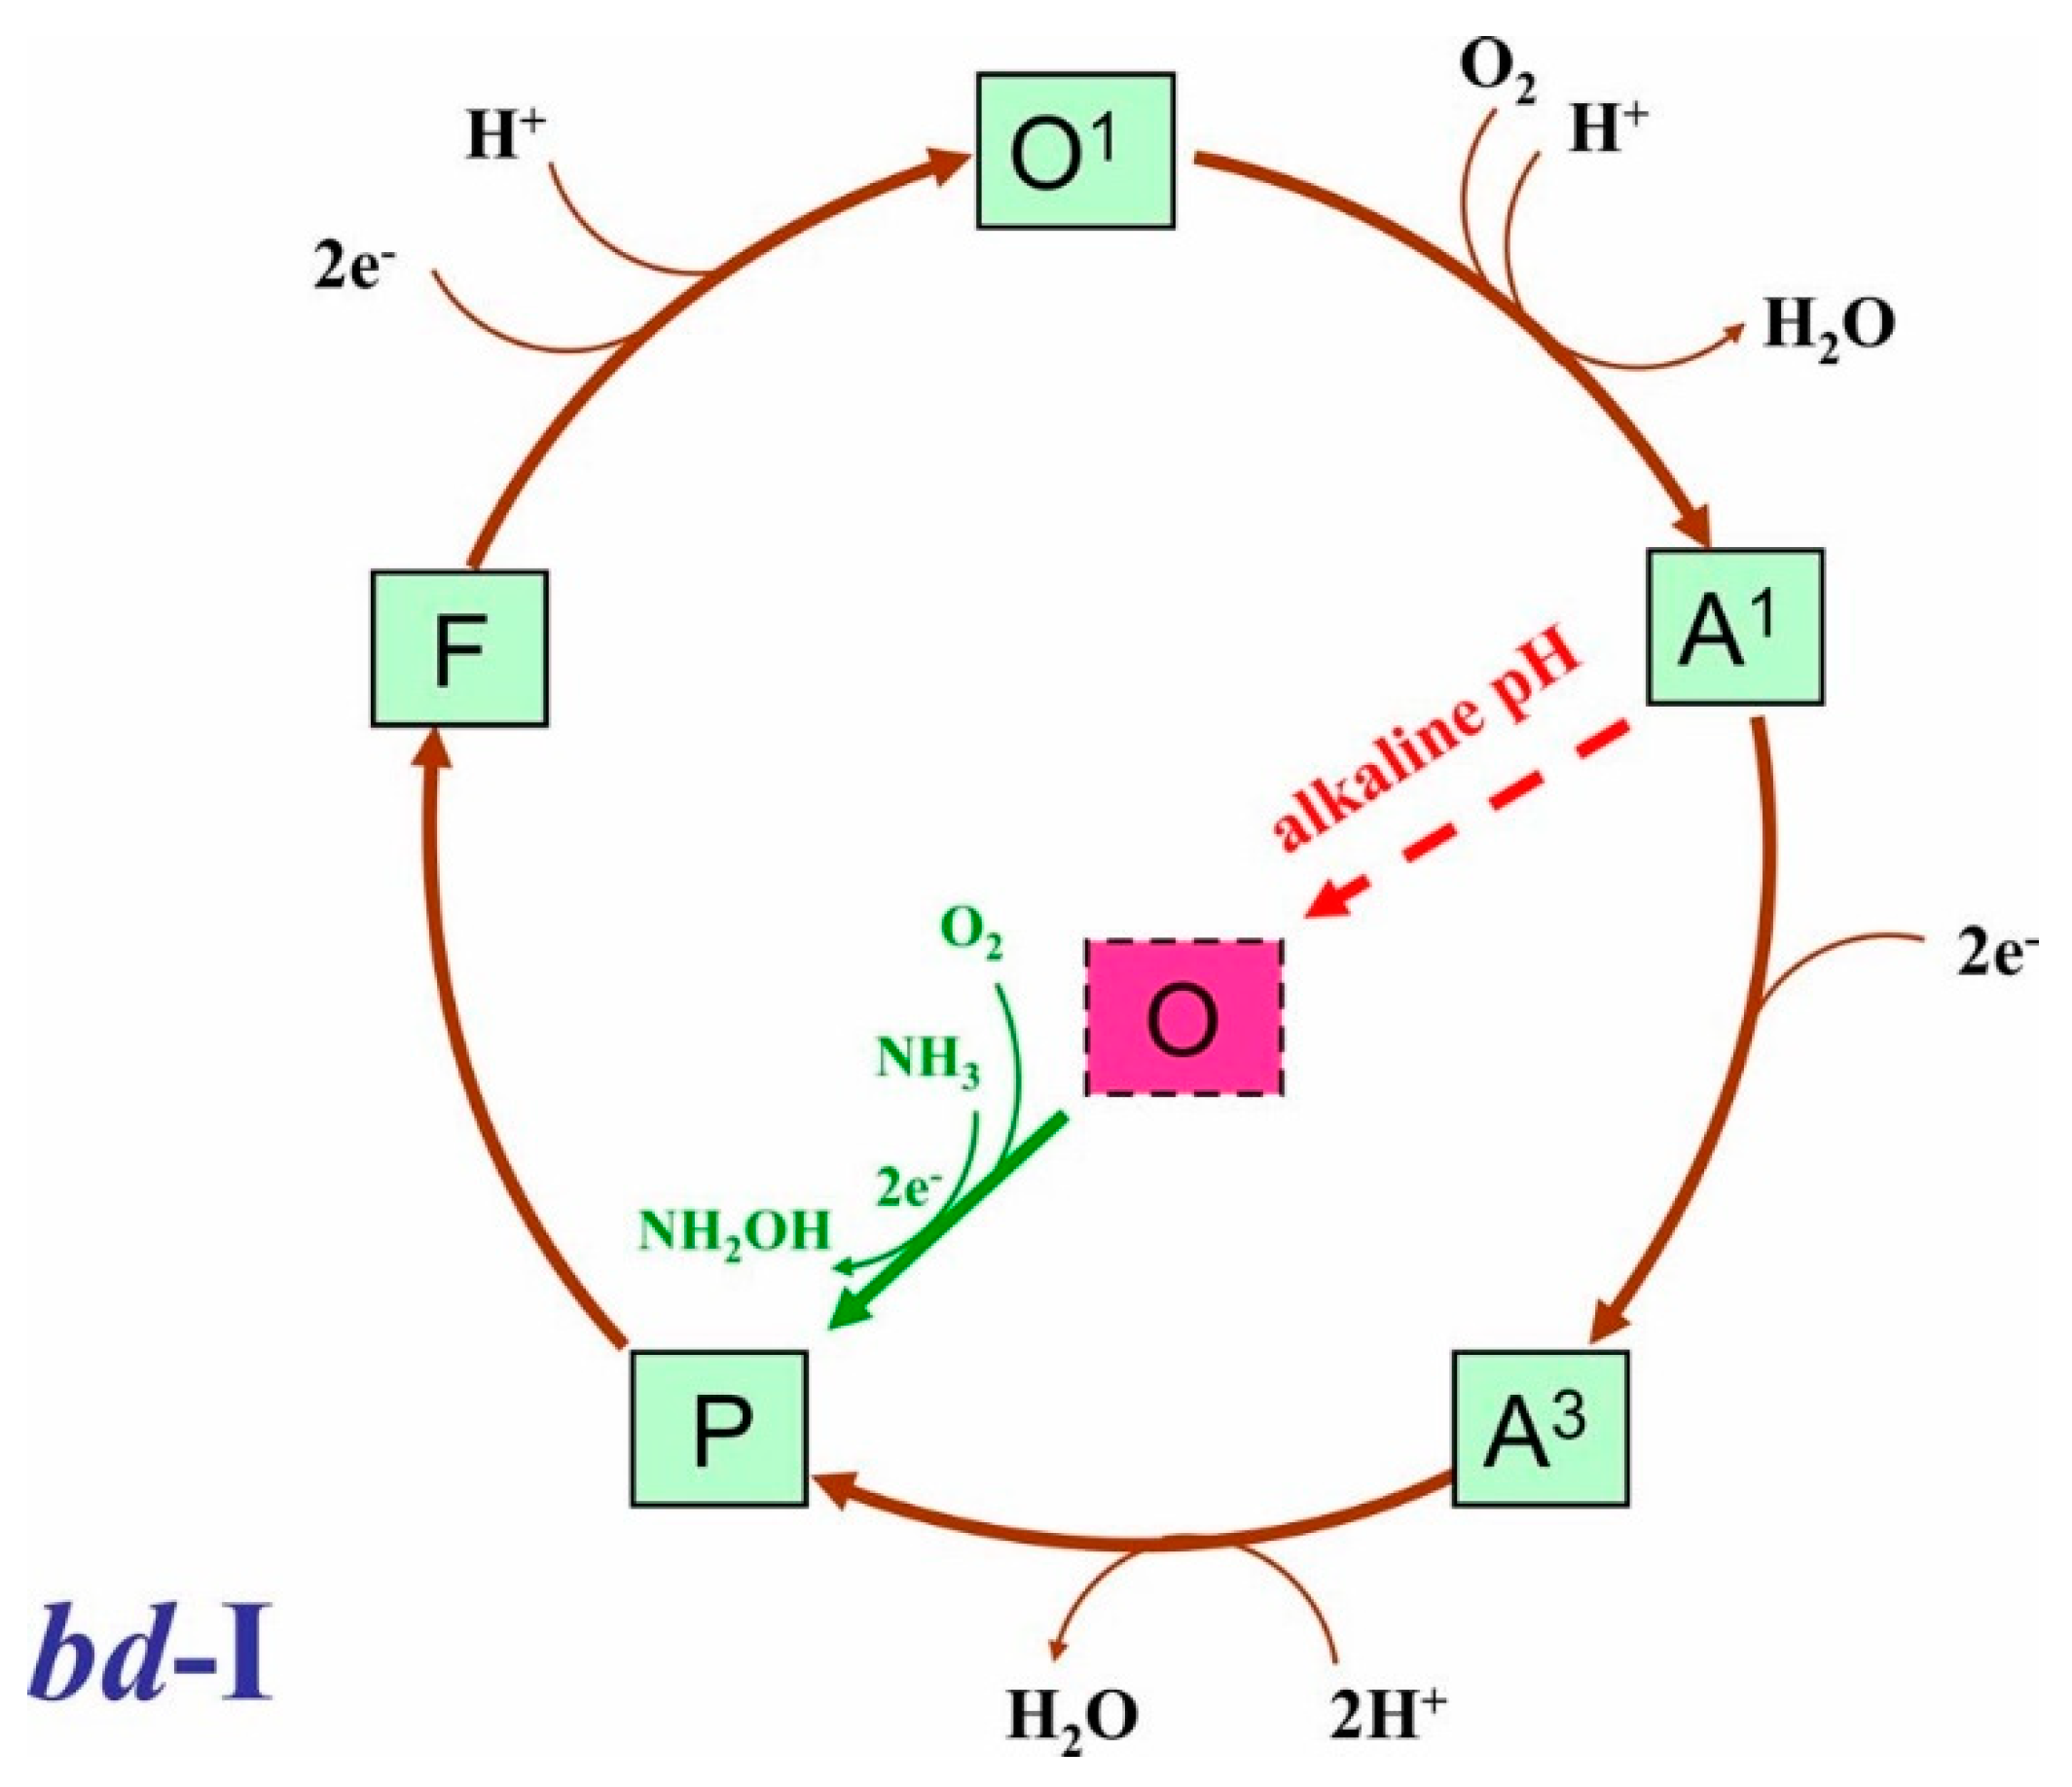
4.2. Proposed Mechanism for Ammonia-Induced Acceleration of the Cytochrome bd-I Activity

In contrast to cytochrome bo3, cytochrome bd-I at pH 8.3 was not inhibited by (NH4)2SO4 (Figure 3A). Furthermore, the addition of the ligand led to an increase in enzyme activity. The highest enhancement of the rate of cytochrome bd-I-catalyzed reaction (140%) was achieved upon the addition of 100 mM (NH4)2SO4 (Figure 3C). The fact that at pH 7.0 (NH4)2SO4 did not affect the enzyme activity (Figure 3B) suggests that the activator was ammonia rather than the ammonium ion. Consistently, the addition of (NH4)2SO4 to intact cells of the E. coli mutant possessing cytochrome bd-I as the sole terminal oxidase at pH 8.3 increased cell respiration (Supplementary Figures S1A and S2). Maximum acceleration of the O2 consumption rate (140%) was observed at 27 mM (NH4)2SO4.
At pH 8.3, the addition of ammonia brought about spectral changes in the fully oxidized cytochrome bd-I, the amplitude of which increased with increasing the ligand concentration (Figure 4). The titration curves (Figure 4B,C) were similar to that of the ammonia-induced activity change (Figure 3C). Surprisingly, the ammonia-induced difference absorption spectra (Figure 4A) were similar to the difference absorption spectra recorded following addition of H2O2 to the fully oxidized cytochrome bd-I [67,68]. In the reaction product, heme d was in the ferryl state [69]. As in the case of cytochrome c oxidase [51,52], after the addition of excess peroxide to cytochrome bd-I, the two ferryl species, P and F, were probably produced. P discovered by [47] is a heme d ferryl porphyrin π-cation radical intermediate [49]. Thus, the H2O2-induced difference spectra reported in [67,68] likely reflect a mixture of P and F.
It is known that in the air-oxidized cytochromes bd from E. coli and Azotobacter vinelandii heme d is mostly in the oxygenated form [7,40,70,71]. This state is often called compound A1 (see Figure 6). Jünemann and Wrigglesworth reported that exposure of the A. vinelandii cytochrome bd in an air-oxidized state to alkaline pH leads to deoxygenation of heme d [71]. At alkaline pH, the heme d oxy-complex in the A1 state is destabilized and may decay to the oxidized (O) state (Figure 6).
A1 is a catalytic intermediate of cytochrome bd-I [73], whereas O does not participate in the catalytic cycle [72]. The conversion of A1 into O under alkaline conditions seems to correlate with the observation that the O2-reductase activity of cytochrome bd-I at pH 8.3 is lower than that at pH 7.0 (Vmax of 30 ± 6 mol O2/mol enzyme/s at pH 8.3 versus 152 ± 15 mol O2/mol enzyme/s at pH 7.0). We hypothesize that the addition of ammonia to the oxidized cytochrome bd-I at pH 8.3 promotes the formation of P from O (Figure 6), thereby increasing the enzyme activity. NH3 may be oxidized to NH2OH serving as a two-electron donor in this reaction. NH3 could also react with the one electron-reduced enzyme (O1) with the production of F and NH2OH.

4.3. Possible Physiological Significance of the Difference between Cytochrome bo3 and Cytochrome bd-I in Sensitivity toward Ammonia for E. coli

Along with nitric oxide, carbon monoxide, and hydrogen sulfide, ammonia is considered as a “gasotransmitter” or endogenously generated gaseous signaling molecule [74]. A signaling role of NH3 in cultured rat astrocytes has been reported [75]. The molecule can move across the plasma membranes both passively [76] and actively via the Amt/Rh family of ammonium/ammonia transporting membrane proteins, involving the electrogenic transport mechanism [77,78]. Ammonia is a degradation product of proteins, peptides, amino acids, and urea. It is mainly produced by the gut microbiota and the gut, liver, kidney, and muscle cells. An adult human gut generates 4–10 g of NH3 daily [79]. E. coli is one of the most active ammonia-producers in the gut microbiota. Ammonia can also be recycled into amino acid synthesis [80]. NH3 is a potent infochemical in bacteria–bacteria interactions. It is able to induce oxidative stress responses and increase resistance to antibiotics thus playing a role in defense mechanisms against antimicrobials [81]. At high enough concentrations, ammonia is toxic to cells, especially to neurons. For this reason, the plasma concentration of ammonia in healthy adults is maintained in the range of 10–35 μM [82]. In the intestines, the total ammonia concentration depends on intestinal segment and diet but in general it is about 1000-times higher than in blood [34]. The highest ammonia concentration in the body (27.2 ± 17.5 mM) is reported to be in the large intestinal lumen [34]. Intestinal pH shows high variability depending on the intestinal segment, diet, and regional distribution of microbiota, and there are conditions in which the pH values are in the alkaline region [83,84]. For example, in the distal ileum, the median pH is 8.1 [85]. In light of the above, we suggest that the difference between the two quinol oxidases in the sensitivity toward ammonia can have a physiological significance for E. coli and other enterobacteria. In contrast to the heme–copper oxidase bo3 that is inhibited by NH3 at alkaline pH, the bd-I oxidase under the same conditions is not inhibited but activated by the ligand. Thus cytochrome bd can sustain bacterial respiration in the presence of high concentrations of not only sulfide [26,27,86], but also ammonia.

5. Conclusions

In summary, we investigated the sensitivity of two physiologically important respiratory cytochromes of E. coli, bo3 and bd-I, to ammonia at the level of both isolated enzymes and intact cells. It turned out that at pH 8.3 the isolated heme-copper bo3 oxidase is partly inhibited by NH3. Surprisingly, under the same conditions, the isolated copper-lacking bd-I enzyme is not only resistant to but also activated by this gaseous signaling molecule. Consistently, respiration of intact cells of the E. coli mutant that relies on cytochrome bd-I as the only terminal oxidase is accelerated by NH3. With such a unique trait, the bd-type redox enzyme may provide E. coli and perhaps other bacteria with the ability to maintain the aerobic energy metabolism in the gut and other ammonia-rich environments.

Supplementary Materials

The following are available online at https://www.mdpi.com/2076-3921/10/1/13/s1, Figure S1: O2 consumption traces showing the effect of (NH4)2SO4 on the respiration of E. coli in respiratory mutants at pH 8.3, Figure S2: Effect of (NH4)2SO4 on the respiration of E. coli in respiratory mutants.

Author Contributions

Conceptualization, E.F. and V.B.B.; methodology, E.F., S.A.S. and V.B.B.; formal analysis, V.B.B.; investigation, E.F. and V.B.B.; data curation, E.F. and V.B.B.; writing—original draft preparation, E.F., S.A.S. and V.B.B.; writing—review and editing, E.F., S.A.S. and V.B.B.; visualization, E.F., S.A.S. and V.B.B.; funding acquisition, E.F. and V.B.B. All authors have read and agreed to the published version of the manuscript.

Funding

This research was funded by the Russian Foundation for Basic Research (http://www.rfbr.ru/rffi/eng)—research project number 19-04-00094 (to V.B.B.) and by Sapienza grant number RP1181643681A66B (to E.F.).

Acknowledgments

The authors are indebted to Robert Gennis (University of Illinois at Urbana-Champaign) for the E. coli strain GO105/pTK1, Alex Ter Beek and Joost Teixeira de Mattos (University of Amsterdam) for the E. coli strains TBE025 and TBE037, and Marina Verkhovskaya (University of Helsinki) for the purified E. coli cytochrome bo3. The authors thank Maria Petrosino, Martina Roberta Nastasi and Francesca Giordano for their help with the E. coli cell experiments.

Conflicts of Interest

The authors declare no conflict of interest. The funders had no role in the design of the study; in the collection, analyses, or interpretation of data; in the writing of the manuscript, or in the decision to publish the results.

Abbreviations

KdappApparent dissociation constant
DTTDithiothreitol
Q12,3-dimethoxy-5-methyl-6-(3-methyl-2-butenyl)-1,4-benzoquinone

References

  1. Borisov, V.B.; Verkhovsky, M.I. Oxygen as Acceptor. EcoSal Plus 2015, 6. [Google Scholar] [CrossRef] [PubMed]
  2. Melo, A.M.; Teixeira, M. Supramolecular organization of bacterial aerobic respiratory chains: From cells and back. Biochim. Biophys. Acta 2016, 1857, 190–197. [Google Scholar] [CrossRef] [PubMed]
  3. Borisov, V.B.; Gennis, R.B.; Hemp, J.; Verkhovsky, M.I. The cytochrome bd respiratory oxygen reductases. Biochim. Biophys. Acta 2011, 1807, 1398–1413. [Google Scholar] [CrossRef] [PubMed] [Green Version]
  4. Puustinen, A.; Finel, M.; Haltia, T.; Gennis, R.B.; Wikstrom, M. Properties of the two terminal oxidases of Escherichia coli. Biochemistry 1991, 30, 3936–3942. [Google Scholar] [CrossRef] [PubMed]
  5. Jasaitis, A.; Borisov, V.B.; Belevich, N.P.; Morgan, J.E.; Konstantinov, A.A.; Verkhovsky, M.I. Electrogenic reactions of cytochrome bd. Biochemistry 2000, 39, 13800–13809. [Google Scholar] [CrossRef]
  6. Belevich, I.; Borisov, V.B.; Zhang, J.; Yang, K.; Konstantinov, A.A.; Gennis, R.B.; Verkhovsky, M.I. Time-resolved electrometric and optical studies on cytochrome bd suggest a mechanism of electron-proton coupling in the di-heme active site. Proc. Natl. Acad. Sci. USA 2005, 102, 3657–3662. [Google Scholar] [CrossRef] [Green Version]
  7. Borisov, V.B.; Murali, R.; Verkhovskaya, M.L.; Bloch, D.A.; Han, H.; Gennis, R.B.; Verkhovsky, M.I. Aerobic respiratory chain of Escherichia coli is not allowed to work in fully uncoupled mode. Proc. Natl. Acad. Sci. USA 2011, 108, 17320–17324. [Google Scholar] [CrossRef] [Green Version]
  8. Abramson, J.; Riistama, S.; Larsson, G.; Jasaitis, A.; Svensson-Ek, M.; Laakkonen, L.; Puustinen, A.; Iwata, S.; Wikstrom, M. The structure of the ubiquinol oxidase from Escherichia coli and its ubiquinone binding site. Nat. Struct. Biol. 2000, 7, 910–917. [Google Scholar] [CrossRef]
  9. Safarian, S.; Hahn, A.; Mills, D.J.; Radloff, M.; Eisinger, M.L.; Nikolaev, A.; Meier-Credo, J.; Melin, F.; Miyoshi, H.; Gennis, R.B.; et al. Active site rearrangement and structural divergence in prokaryotic respiratory oxidases. Science 2019, 366, 100–104. [Google Scholar] [CrossRef]
  10. Theßeling, A.; Rasmussen, T.; Burschel, S.; Wohlwend, D.; Kagi, J.; Muller, R.; Bottcher, B.; Friedrich, T. Homologous bd oxidases share the same architecture but differ in mechanism. Nat. Commun. 2019, 10, 5138. [Google Scholar] [CrossRef] [Green Version]
  11. Pereira, M.M.; Santana, M.; Teixeira, M. A novel scenario for the evolution of haem-copper oxygen reductases. Biochim. Biophys. Acta 2001, 1505, 185–208. [Google Scholar] [CrossRef] [Green Version]
  12. Capitanio, N.; Palese, L.L.; Capitanio, G.; Martino, P.L.; Richter, O.M.; Ludwig, B.; Papa, S. Allosteric interactions and proton conducting pathways in proton pumping aa3 oxidases: Heme a as a key coupling element. Biochim. Biophys. Acta 2012, 1817, 558–566. [Google Scholar] [CrossRef] [PubMed] [Green Version]
  13. Maneg, O.; Malatesta, F.; Ludwig, B.; Drosou, V. Interaction of cytochrome c with cytochrome oxidase: Two different docking scenarios. Biochim. Biophys. Acta 2004, 1655, 274–281. [Google Scholar] [CrossRef] [PubMed] [Green Version]
  14. Borisov, V.B.; Siletsky, S.A. Features of organization and mechanism of catalysis of two families of terminal oxidases: Heme-copper and bd-type. Biochemistry (Mosc) 2019, 84, 1390–1402. [Google Scholar] [CrossRef] [PubMed]
  15. Siletsky, S.A.; Borisov, V.B.; Mamedov, M.D. Photosystem II and terminal respiratory oxidases: Molecular machines operating in opposite directions. Front. Biosci. (Landmark Ed.) 2017, 22, 1379–1426. [Google Scholar] [CrossRef] [Green Version]
  16. Forte, E.; Giuffre, A.; Huang, L.S.; Berry, E.A.; Borisov, V.B. Nitric oxide does not inhibit but is metabolized by the cytochrome bcc-aa3 supercomplex. Int. J. Mol. Sci. 2020, 21, 8521. [Google Scholar] [CrossRef]
  17. Choi, S.K.; Schurig-Briccio, L.; Ding, Z.; Hong, S.; Sun, C.; Gennis, R.B. Location of the substrate binding site of the cytochrome bo3 ubiquinol oxidase from Escherichia coli. J. Am. Chem. Soc. 2017, 139, 8346–8354. [Google Scholar] [CrossRef]
  18. Arutyunyan, A.M.; Sakamoto, J.; Inadome, M.; Kabashima, Y.; Borisov, V.B. Optical and magneto-optical activity of cytochrome bd from Geobacillus thermodenitrificans. Biochim. Biophys. Acta 2012, 1817, 2087–2094. [Google Scholar] [CrossRef] [Green Version]
  19. Cotter, P.A.; Chepuri, V.; Gennis, R.B.; Gunsalus, R.P. Cytochrome o (cyoABCDE) and d (cydAB) oxidase gene expression in Escherichia coli is regulated by oxygen, pH, and the fnr gene product. J. Bacteriol. 1990, 172, 6333–6338. [Google Scholar] [CrossRef] [Green Version]
  20. D’Mello, R.; Hill, S.; Poole, R.K. The oxygen affinity of cytochrome bo’ in Escherichia coli determined by the deoxygenation of oxyleghemoglobin and oxymyoglobin: Km values for oxygen are in the submicromolar range. J. Bacteriol. 1995, 177, 867–870. [Google Scholar] [CrossRef] [Green Version]
  21. Belevich, I.; Borisov, V.B.; Konstantinov, A.A.; Verkhovsky, M.I. Oxygenated complex of cytochrome bd from Escherichia coli: Stability and photolability. FEBS Lett. 2005, 579, 4567–4570. [Google Scholar] [CrossRef] [PubMed] [Green Version]
  22. Borisov, V.B.; Forte, E.; Konstantinov, A.A.; Poole, R.K.; Sarti, P.; Giuffre, A. Interaction of the bacterial terminal oxidase cytochrome bd with nitric oxide. FEBS Lett. 2004, 576, 201–204. [Google Scholar] [CrossRef] [Green Version]
  23. Borisov, V.B.; Forte, E.; Sarti, P.; Brunori, M.; Konstantinov, A.A.; Giuffre, A. Redox control of fast ligand dissociation from Escherichia coli cytochrome bd. Biochem. Biophys. Res. Commun. 2007, 355, 97–102. [Google Scholar] [CrossRef] [PubMed]
  24. Mason, M.G.; Shepherd, M.; Nicholls, P.; Dobbin, P.S.; Dodsworth, K.S.; Poole, R.K.; Cooper, C.E. Cytochrome bd confers nitric oxide resistance to Escherichia coli. Nat. Chem. Biol. 2009, 5, 94–96. [Google Scholar] [CrossRef] [PubMed]
  25. Shepherd, M.; Achard, M.E.; Idris, A.; Totsika, M.; Phan, M.D.; Peters, K.M.; Sarkar, S.; Ribeiro, C.A.; Holyoake, L.V.; Ladakis, D.; et al. The cytochrome bd-I respiratory oxidase augments survival of multidrug-resistant Escherichia coli during infection. Sci. Rep. 2016, 6, 35285. [Google Scholar] [CrossRef] [PubMed]
  26. Forte, E.; Borisov, V.B.; Falabella, M.; Colaco, H.G.; Tinajero-Trejo, M.; Poole, R.K.; Vicente, J.B.; Sarti, P.; Giuffre, A. The terminal oxidase cytochrome bd promotes sulfide-resistant bacterial respiration and growth. Sci. Rep. 2016, 6, 23788. [Google Scholar] [CrossRef] [PubMed] [Green Version]
  27. Korshunov, S.; Imlay, K.R.; Imlay, J.A. The cytochrome bd oxidase of Escherichia coli prevents respiratory inhibition by endogenous and exogenous hydrogen sulfide. Mol. Microbiol. 2016, 101, 62–77. [Google Scholar] [CrossRef] [PubMed] [Green Version]
  28. Forte, E.; Borisov, V.B.; Siletsky, S.A.; Petrosino, M.; Giuffre, A. In the respiratory chain of Escherichia coli cytochromes bd-I and bd-II are more sensitive to carbon monoxide inhibition than cytochrome bo3. Biochim. Biophys. Acta Bioenerg. 2019, 1860, 148088. [Google Scholar] [CrossRef]
  29. Borisov, V.B.; Forte, E.; Siletsky, S.A.; Sarti, P.; Giuffre, A. Cytochrome bd from Escherichia coli catalyzes peroxynitrite decomposition. Biochim. Biophys. Acta 2015, 1847, 182–188. [Google Scholar] [CrossRef] [Green Version]
  30. Borisov, V.B.; Davletshin, A.I.; Konstantinov, A.A. Peroxidase activity of cytochrome bd from Escherichia coli. Biochemistry (Mosc) 2010, 75, 428–436. [Google Scholar] [CrossRef]
  31. Borisov, V.B.; Forte, E.; Davletshin, A.; Mastronicola, D.; Sarti, P.; Giuffre, A. Cytochrome bd oxidase from Escherichia coli displays high catalase activity: An additional defense against oxidative stress. FEBS Lett. 2013, 587, 2214–2218. [Google Scholar] [CrossRef] [PubMed]
  32. Al-Attar, S.; Yu, Y.; Pinkse, M.; Hoeser, J.; Friedrich, T.; Bald, D.; de Vries, S. Cytochrome bd displays significant quinol peroxidase activity. Sci. Rep. 2016, 6, 27631. [Google Scholar] [CrossRef] [PubMed] [Green Version]
  33. Borisov, V.B.; Siletsky, S.A.; Paiardini, A.; Hoogewijs, D.; Forte, E.; Giuffre, A.; Poole, R.K. Bacterial oxidases of the cytochrome bd family: Redox enzymes of unique structure, function and utility as drug targets. Antioxid. Redox Signal. 2020. [Google Scholar] [CrossRef] [PubMed]
  34. Eklou-Lawson, M.; Bernard, F.; Neveux, N.; Chaumontet, C.; Bos, C.; Davila-Gay, A.M.; Tome, D.; Cynober, L.; Blachier, F. Colonic luminal ammonia and portal blood L-glutamine and L-arginine concentrations: A possible link between colon mucosa and liver ureagenesis. Amino Acids 2009, 37, 751–760. [Google Scholar] [CrossRef]
  35. Miller, M.J.; Gennis, R.B. The purification and characterization of the cytochrome d terminal oxidase complex of the Escherichia coli aerobic respiratory chain. J. Biol. Chem. 1983, 258, 9159–9165. [Google Scholar]
  36. Borisov, V.B. Interaction of bd-type quinol oxidase from Escherichia coli and carbon monoxide: Heme d binds CO with high affinity. Biochemistry (Mosc) 2008, 73, 14–22. [Google Scholar] [CrossRef]
  37. Puustinen, A.; Verkhovsky, M.I.; Morgan, J.E.; Belevich, N.P.; Wikstrom, M. Reaction of the Escherichia coli quinol oxidase cytochrome bo3 with dioxygen: The role of a bound ubiquinone molecule. Proc. Natl. Acad. Sci. USA 1996, 93, 1545–1548. [Google Scholar] [CrossRef] [Green Version]
  38. Borisov, V.; Arutyunyan, A.M.; Osborne, J.P.; Gennis, R.B.; Konstantinov, A.A. Magnetic circular dichroism used to examine the interaction of Escherichia coli cytochrome bd with ligands. Biochemistry 1999, 38, 740–750. [Google Scholar] [CrossRef]
  39. Cheesman, M.R.; Watmough, N.J.; Pires, C.A.; Turner, R.; Brittain, T.; Gennis, R.B.; Greenwood, C.; Thomson, A.J. Cytochrome bo from Escherichia coli: Identification of haem ligands and reaction of the reduced enzyme with carbon monoxide. Biochem. J. 1993, 289, 709–718. [Google Scholar] [CrossRef] [Green Version]
  40. Borisov, V.B.; Smirnova, I.A.; Krasnosel’skaya, I.A.; Konstantinov, A.A. Oxygenated cytochrome bd from Escherichia coli could be transformed into an oxidized form by lipophilic electron acceptors. Biokhimiia 1994, 59, 598–606. [Google Scholar]
  41. Eun, H.-M. Enzymes and Nucleic Acids. Enzymology Primer for Recombinant DNA Technology; Academic Press: Cambridge, MA, USA, 1996; pp. 1–108. [Google Scholar] [CrossRef]
  42. Puustinen, A.; Morgan, J.E.; Verkhovsky, M.; Thomas, J.W.; Gennis, R.B.; Wikstrom, M. The low spin heme site of cytochrome o from E. coli is promiscuous with respect to heme type. Biochemistry 1992, 31, 10363–10369. [Google Scholar] [CrossRef] [PubMed]
  43. Von der Hocht, I.; van Wonderen, J.H.; Hilbers, F.; Angerer, H.; MacMillan, F.; Michel, H. Interconversions of P and F intermediates of cytochrome c oxidase from Paracoccus denitrificans. Proc. Natl. Acad. Sci. USA 2011, 108, 3964–3969. [Google Scholar] [CrossRef] [PubMed] [Green Version]
  44. Pinakoulaki, E.; Pfitzner, U.; Ludwig, B.; Varotsis, C. Direct detection of Fe(IV)=O intermediates in the cytochrome aa3 oxidase from Paracoccus denitrificans/H2O2 reaction. J. Biol. Chem. 2003, 278, 18761–18766. [Google Scholar] [CrossRef] [PubMed] [Green Version]
  45. Siletsky, S.A.; Konstantinov, A.A. Cytochrome c oxidase: Charge translocation coupled to single-electron partial steps of the catalytic cycle. Biochim. Biophys. Acta 2012, 1817, 476–488. [Google Scholar] [CrossRef] [PubMed] [Green Version]
  46. Papa, S.; Capitanio, G.; Papa, F. The mechanism of coupling between oxido-reduction and proton translocation in respiratory chain enzymes. Biol. Rev. Camb. Philos. Soc. 2018, 93, 322–349. [Google Scholar] [CrossRef]
  47. Belevich, I.; Borisov, V.B.; Verkhovsky, M.I. Discovery of the true peroxy intermediate in the catalytic cycle of terminal oxidases by real-time measurement. J. Biol. Chem. 2007, 282, 28514–28519. [Google Scholar] [CrossRef] [Green Version]
  48. Borisov, V.B.; Belevich, I.; Bloch, D.A.; Mogi, T.; Verkhovsky, M.I. Glutamate 107 in subunit I of cytochrome bd from Escherichia coli is part of a transmembrane intraprotein pathway conducting protons from the cytoplasm to the heme b595/heme d active site. Biochemistry 2008, 47, 7907–7914. [Google Scholar] [CrossRef]
  49. Paulus, A.; Rossius, S.G.; Dijk, M.; de Vries, S. Oxoferryl-porphyrin radical catalytic intermediate in cytochrome bd oxidases protects cells from formation of reactive oxygen species. J. Biol. Chem. 2012, 287, 8830–8838. [Google Scholar] [CrossRef] [Green Version]
  50. Siletsky, S.A. Steps of the coupled charge translocation in the catalytic cycle of cytochrome c oxidase. Front. Biosci. 2013, 18, 36–57. [Google Scholar] [CrossRef]
  51. Wrigglesworth, J. Formation and reduction of a ‘peroxy’ intermediate of cytochrome c oxidase by hydrogen peroxide. Biochem. J. 1984, 217, 715–719. [Google Scholar] [CrossRef] [Green Version]
  52. Fabian, M.; Palmer, G. The interaction of cytochrome oxidase with hydrogen peroxide: The relationship of compounds P and F. Biochemistry 1995, 34, 13802–13810. [Google Scholar] [CrossRef] [PubMed]
  53. Kozuch, J.; von der Hocht, I.; Hilbers, F.; Michel, H.; Weidinger, I.M. Resonance Raman characterization of the ammonia-generated oxo intermediate of cytochrome c oxidase from Paracoccus denitrificans. Biochemistry 2013, 52, 6197–6202. [Google Scholar] [CrossRef] [PubMed]
  54. Ingledew, W.J.; Horrocks, J.; Salerno, J.C. Ligand binding to the haem-copper binuclear catalytic site of cytochrome bo, a respiratory quinol oxidase from Escherichia coli. Eur. J. Biochem. 1993, 212, 657–664. [Google Scholar] [CrossRef] [PubMed]
  55. Cheesman, M.R.; Watmough, N.J.; Gennis, R.B.; Greenwood, C.; Thomson, A.J. Magnetic-circular-dichroism studies of Escherichia coli cytochrome bo. Identification of high-spin ferric, low-spin ferric and ferryl [Fe(IV)] forms of heme o. Eur. J. Biochem. 1994, 219, 595–602. [Google Scholar] [CrossRef] [PubMed]
  56. Wever, R.; Muijsers, A.O.; van Gelder, B.F.; Bakker, E.P.; van Buuren, K.J. Biochemical and biophysical studies on cytochrome c oxidase. XI. Reaction with azide. Biochim. Biophys. Acta 1973, 325, 1–7. [Google Scholar] [CrossRef]
  57. Tsubaki, M.; Mogi, T.; Hori, H.; Sato-Watanabe, M.; Anraku, Y. Infrared and EPR studies on cyanide binding to the heme-copper binuclear center of cytochrome bo-type ubiquinol oxidase from Escherichia coli. Release of a CuB-cyano complex in the partially reduced state. J. Biol. Chem. 1996, 271, 4017–4022. [Google Scholar] [CrossRef] [Green Version]
  58. Tsubaki, M.; Mogi, T.; Hori, H. Fourier-transform infrared studies on azide-binding to the binuclear center of the Escherichia coli bo-type ubiquinol oxidase. FEBS Lett. 1999, 449, 191–195. [Google Scholar] [CrossRef] [Green Version]
  59. Siletsky, S.A.; Belevich, I.; Jasaitis, A.; Konstantinov, A.A.; Wikstrom, M.; Soulimane, T.; Verkhovsky, M.I. Time-resolved single-turnover of ba3 oxidase from Thermus thermophilus. Biochim. Biophys. Acta 2007, 1767, 1383–1392. [Google Scholar] [CrossRef] [Green Version]
  60. Kaila, V.R.; Johansson, M.P.; Sundholm, D.; Laakkonen, L.; Wistrom, M. The chemistry of the CuB site in cytochrome c oxidase and the importance of its unique His-Tyr bond. Biochim. Biophys. Acta 2009, 1787, 221–233. [Google Scholar] [CrossRef] [Green Version]
  61. Lucas, M.F.; Rousseau, D.L.; Guallar, V. Electron transfer pathways in cytochrome c oxidase. Biochim. Biophys. Acta 2011, 1807, 1305–1313. [Google Scholar] [CrossRef] [Green Version]
  62. Lanne, B.; Malmstrom, B.G.; Vanngard, T. The influence of pH on the EPR and redox properties of cytochrome c oxidase in detergent solution and in phospholipid vesicles. Biochim. Biophys. Acta 1979, 545, 205–214. [Google Scholar] [CrossRef]
  63. Branden, M.; Namslauer, A.; Hansson, O.; Aasa, R.; Brzezinski, P. Water-hydroxide exchange reactions at the catalytic site of heme-copper oxidases. Biochemistry 2003, 42, 13178–13184. [Google Scholar] [CrossRef] [PubMed]
  64. Bykov, D.; Plog, M.; Neese, F. Heme-bound nitroxyl, hydroxylamine, and ammonia ligands as intermediates in the reaction cycle of cytochrome c nitrite reductase: A theoretical study. J. Biol. Inorg. Chem. 2014, 19, 97–112. [Google Scholar] [CrossRef]
  65. Safarian, S.; Rajendran, C.; Muller, H.; Preu, J.; Langer, J.D.; Ovchinnikov, S.; Hirose, T.; Kusumoto, T.; Sakamoto, J.; Michel, H. Structure of a bd oxidase indicates similar mechanisms for membrane-integrated oxygen reductases. Science 2016, 352, 583–586. [Google Scholar] [CrossRef] [PubMed] [Green Version]
  66. Proshlyakov, D.A.; Pressler, M.A.; DeMaso, C.; Leykam, J.F.; DeWitt, D.L.; Babcock, G.T. Oxygen activation and reduction in respiration: Involvement of redox-active tyrosine 244. Science 2000, 290, 1588–1591. [Google Scholar] [CrossRef]
  67. Borisov, V.; Gennis, R.; Konstantinov, A.A. Peroxide complex of cytochrome bd: Kinetics of generation and stability. Biochem. Mol. Biol. Int. 1995, 37, 975–982. [Google Scholar]
  68. Borisov, V.B.; Gennis, R.B.; Konstantinov, A.A. Interaction of cytochrome bd from Escherichia coli with hydrogen peroxide. Biokhimiia 1995, 60, 315–327. [Google Scholar]
  69. Kahlow, M.A.; Zuberi, T.M.; Gennis, R.B.; Loehr, T.M. Identification of a ferryl intermediate of Escherichia coli cytochrome d terminal oxidase by Resonance Raman spectrosopy. Biochemistry 1991, 30, 11485–11489. [Google Scholar] [CrossRef]
  70. Kahlow, M.A.; Loehr, T.M.; Zuberi, T.M.; Gennis, R.B. The oxygenated complex of cytochrome d terminal oxidase: Direct evidence for Fe-O2 coordination in a chlorin-containing enzyme by Resonance Raman spectroscopy. J. Am. Chem. Soc. 1993, 115, 5845–5846. [Google Scholar] [CrossRef]
  71. Junemann, S.; Wrigglesworth, J.M. Cytochrome bd oxidase from Azotobacter vinelandii. Purification and quantitation of ligand binding to the oxygen reduction site. J. Biol. Chem. 1995, 270, 16213–16220. [Google Scholar] [CrossRef] [Green Version]
  72. Yang, K.; Borisov, V.B.; Konstantinov, A.A.; Gennis, R.B. The fully oxidized form of the cytochrome bd quinol oxidase from E. coli does not participate in the catalytic cycle: Direct evidence from rapid kinetics studies. FEBS Lett. 2008, 582, 3705–3709. [Google Scholar] [CrossRef] [Green Version]
  73. Borisov, V.B.; Forte, E.; Sarti, P.; Giuffre, A. Catalytic intermediates of cytochrome bd terminal oxidase at steady-state: Ferryl and oxy-ferrous species dominate. Biochim. Biophys. Acta 2011, 1807, 503–509. [Google Scholar] [CrossRef] [PubMed]
  74. Wang, R. Gasotransmitters: Growing pains and joys. Trends Biochem. Sci. 2014, 39, 227–232. [Google Scholar] [CrossRef] [PubMed]
  75. Karababa, A.; Gorg, B.; Schliess, F.; Haussinger, D. O-GlcNAcylation as a novel ammonia-induced posttranslational protein modification in cultured rat astrocytes. Metab. Brain Dis. 2014, 29, 975–982. [Google Scholar] [CrossRef] [PubMed]
  76. Cueto-Rojas, H.F.; Milne, N.; van Helmond, W.; Pieterse, M.M.; van Maris, A.J.A.; Daran, J.M.; Wahl, S.A. Membrane potential independent transport of NH3 in the absence of ammonium permeases in Saccharomyces cerevisiae. BMC Syst. Biol. 2017, 11, 49. [Google Scholar] [CrossRef] [Green Version]
  77. Ullmann, R.T.; Andrade, S.L.; Ullmann, G.M. Thermodynamics of transport through the ammonium transporter Amt-1 investigated with free energy calculations. J. Phys. Chem. B 2012, 116, 9690–9703. [Google Scholar] [CrossRef]
  78. Wacker, T.; Garcia-Celma, J.J.; Lewe, P.; Andrade, S.L. Direct observation of electrogenic NH4+ transport in ammonium transport (Amt) proteins. Proc. Natl. Acad. Sci. USA 2014, 111, 9995–10000. [Google Scholar] [CrossRef] [Green Version]
  79. Oleskin, A.V.; Shenderov, B.A. Neuromodulatory effects and targets of the SCFAs and gasotransmitters produced by the human symbiotic microbiota. Microb. Ecol. Health Dis. 2016, 27, 30971. [Google Scholar] [CrossRef]
  80. Spinelli, J.B.; Yoon, H.; Ringel, A.E.; Jeanfavre, S.; Clish, C.B.; Haigis, M.C. Metabolic recycling of ammonia via glutamate dehydrogenase supports breast cancer biomass. Science 2017, 358, 941–946. [Google Scholar] [CrossRef] [Green Version]
  81. Bernier, S.P.; Letoffe, S.; Delepierre, M.; Ghigo, J.M. Biogenic ammonia modifies antibiotic resistance at a distance in physically separated bacteria. Mol. Microbiol. 2011, 81, 705–716. [Google Scholar] [CrossRef]
  82. Tiso, M.; Schechter, A.N. Nitrate reduction to nitrite, nitric oxide and ammonia by gut bacteria under physiological conditions. PLoS ONE 2015, 10, e0119712. [Google Scholar] [CrossRef] [Green Version]
  83. Jones, J.H. The relation of the pH of intestinal contents to calcium and phosphorus utilization. J. Biol. Chem. 1942, 142, 557–567. [Google Scholar]
  84. Koziolek, M.; Grimm, M.; Becker, D.; Iordanov, V.; Zou, H.; Shimizu, J.; Wanke, C.; Garbacz, G.; Weitschies, W. Investigation of pH and temperature profiles in the GI tract of fasted human subjects using the Intellicap((R)) system. J. Pharm. Sci. 2015, 104, 2855–2863. [Google Scholar] [CrossRef] [PubMed]
  85. Vertzoni, M.; Augustijns, P.; Grimm, M.; Koziolek, M.; Lemmens, G.; Parrott, N.; Pentafragka, C.; Reppas, C.; Rubbens, J.; Van Den Alphabeele, J.; et al. Impact of regional differences along the gastrointestinal tract of healthy adults on oral drug absorption: An UNGAP review. Eur. J. Pharm. Sci. 2019, 134, 153–175. [Google Scholar] [CrossRef] [PubMed]
  86. Forte, E.; Giuffrè, A. How bacteria breathe in hydrogen sulfide-rich environments. Biochemist (Lond) 2016, 38, 8–11. [Google Scholar] [CrossRef]
Figure 1. Effect of (NH4)2SO4 on cytochrome bo3 activity. (A) O2 consumption traces at pH 8.3. 50 mM (NH4)2SO4 inhibits the enzyme by 51% whereas 50 mM K2SO4 inhibits the enzyme by 18% (n = 3 for each experimental condition). (B) O2 consumption traces at pH 7.0. Neither 50 mM (NH4)2SO4 nor 50 mM K2SO4 affects the oxidase activity. (C) Percentage inhibition of O2 reductase activity of cytochrome bo3 measured at pH 8.3 at increasing concentration of (NH4)2SO4. The effect of increasing ionic strength on enzyme activity is taken into account for each data point by subtracting the percent inhibition value in the presence of K2SO4 (control) from that in the presence of (NH4)2SO4 at the same concentration. Experimental data (filled circles) are shown together with their best fit (solid line) to the hyperbolic equation (see Materials and Methods), giving a maximum percent inhibition value Amax of 58.4 ± 10.1%, and Kdapp of 44.2 ± 16.9 mM (NH4)2SO4 (8.9 ± 3.4 mM NH3) (mean ± standard deviation, n = 3, R2 = 0.83663). O2 reductase activity of cytochrome bo3 is sustained by 10 mM DTT and 0.25 mM Q1. Enzyme, 20 nM (A,C) or 12 nM (B). In the absence of (NH4)2SO4, Vmax values are 28 ± 2 and 60 ± 5 mol O2/mol enzyme/s at pH 8.3 and 7.0, respectively.
Antioxidants 10 00013 g001
Figure 2. Absorbance changes of oxidized cytochrome bo3 induced by (NH4)2SO4. (A) Double difference absorption spectra of the isolated cytochrome bo3 (4.8 μM): each spectrum is a difference between two difference spectra, (NH4)2SO4-treated oxidized minus oxidized and K2SO4-treated oxidized minus oxidized at the same concentration of the sulfate. The arrows depict the direction of absorbance changes at increasing [(NH4)2SO4]. (B) Absorbance changes measured at 416–400 nm as a function of [(NH4)2SO4]. Experimental data (filled circles) are shown together with their best fit (solid line) to the hyperbolic equation (see Materials and Methods), giving the value for maximum absorption change at 416–400 nm Amax of 22.1 ± 0.6 mM−1cm−1, and Kdapp of 24.3 ± 2.7 mM (NH4)2SO4 (4.9 ± 0.5 mM NH3) (mean ± standard deviation, n = 3, R2 = 0.98947).
Antioxidants 10 00013 g002
Figure 3. Effect of (NH4)2SO4 on cytochrome bd-I activity. (A) O2 consumption traces at pH 8.3. A total of 25 mM (NH4)2SO4 increases O2 consumption rate of the enzyme by 39% whereas 25 mM K2SO4 increases the rate by 11% (n = 3 for each experimental condition). (B) O2 consumption traces at pH 7.0. Neither 25 mM (NH4)2SO4 nor 25 mM K2SO4 affects the oxidase activity. (C) Dependence of O2 reductase activity of cytochrome bd-I measured at pH 8.3 on the concentration of (NH4)2SO4. Values are expressed with reference to the activity measured before sulfate addition taken as 100%. The effect of increasing ionic strength on enzyme activity is taken into account for each data point by subtracting the activity value in the presence of K2SO4 (control) from that in the presence of (NH4)2SO4 at the same concentration. Experimental data (filled circles) are shown together with their best fit (solid line) to the hyperbolic equation (see Materials and Methods), giving a maximum activity value Amax of 152.9 ± 6.3%, and Kdapp of 28.6 ± 8.7 mM (NH4)2SO4 (5.7 ± 1.7 mM NH3) (mean ± standard deviation, n = 3, R2 = 0.92789). O2 reductase activity of cytochrome bd-I is sustained by 10 mM DTT and 0.25 mM Q1. Enzyme, 7.8 nM (A,C) or 3.9 nM (B). In the absence of (NH4)2SO4, Vmax values are 30 ± 6 and 152 ± 15 mol O2/mol enzyme/s at pH 8.3 and 7.0, respectively.
Antioxidants 10 00013 g003
Figure 4. Absorbance changes of oxidized cytochrome bd-I induced by (NH4)2SO4. (A) Double difference absorption spectra of the isolated cytochrome bd-I (3.2 μM): each spectrum is a difference between two difference spectra, (NH4)2SO4-treated oxidized minus oxidized and K2SO4-treated oxidized minus oxidized at the same concentration of the sulfate. The arrows depict the direction of absorbance changes at increasing [(NH4)2SO4]. (B,C) Absorbance changes measured at 426–408 and 623–595 nm as a function of (NH4)2SO4. Experimental data (filled circles) are shown together with their best fits (solid lines) to the hyperbolic equation (see Materials and Methods), giving the values for maximum absorption changes at 426–408 and 623–595 nm Amax of 8.9 ± 0.6 and 0.8 ± 0.1 mM−1cm−1 and Kdapp of 35.9 ± 7.1 and 24.6 ± 12.4 mM (NH4)2SO4 (7.2 ± 1.4 and 4.9 ± 2.5 mM NH3), respectively (mean ± standard deviation, n = 3; R2 = 0.94547 (Soret region), R2 = 0.69231 (visible region)).
Antioxidants 10 00013 g004
Figure 5. The possible effect of ammonia on the catalytic cycle of cytochrome bo3. Proposed catalytic intermediates O (o33+–OH CuB2+), R (o32+ CuB+), A (o32+–O2 CuB+), P (o34+=O2− CuB2+–OH), and F (o34+=O2− CuB2+) are shown. Possible redox and ligation state of the binuclear site in each intermediate is indicated in brackets. Only chemical protons are shown. Pumped protons are not shown for clarity. The two ferryl species P and F likely differ in the presence of an aromatic amino acid radical in P, as in the intermediate PM of cytochrome c oxidase [66]. NH3 presumably converts F into the PN state (o34+=O2− CuB2+–NH3) and O into the ammonia complex N (o33+–NH2 CuB2+ and/or o33+– NH2 CuB2+–NH3), thereby leading to the inhibition of the oxidase activity.
Antioxidants 10 00013 g005
Figure 6. The possible effect of ammonia on the catalytic cycle of cytochrome bd-I. Enzyme catalytic intermediates O1 (b5582+ b5953+ d3+–OH), A1 (b5583+ b5953+ d2+–O2), A3 (b5582+ b5952+ d2+–O2), P (b5582+ b5953+ d*4+=O2 where d*4+=O2 is a ferryl porphyrin π-cation radical [47,49]), and F (b5583+ b5953+ d4+=O2-) are shown. At alkaline pH, A1 is probably converted into the fully oxidized form O. O is not involved in the catalytic cycle [72]. NH3 possibly promotes the formation of P from O, thereby leading to the acceleration of the oxidase activity. It is also possible that NH3 reacts with O1 producing F. In the latter two reactions, NH3 serves as a two-electron donor being oxidized to NH2OH. The reaction of NH3 with O1 is not shown for the sake of simplicity.
Antioxidants 10 00013 g006
Publisher’s Note: MDPI stays neutral with regard to jurisdictional claims in published maps and institutional affiliations.

