
Age-Related Variance in Performance versus Ratings of Attention and Impulse Regulation in Children: Implications for the Assessment of ADHD

 , ,
, ,
Abstract
:1. Introduction
1.1. Executive Function Task Performance
1.2. Behavioral Ratings of Attention and Impulse Regulation
1.3. Comparing Executive Task Performance and Parent Ratings of Attention and Behavior Regulation
2. Materials and Methods
2.1. Participants
2.2. Measures
2.2.1. Attention and Impulse Regulation
2.2.2. Executive Function: Inhibition
2.2.3. Executive Function: Set-Shifting
2.3. Procedure
2.4. Data Analysis
3. Results
3.1. Descriptive Statistics
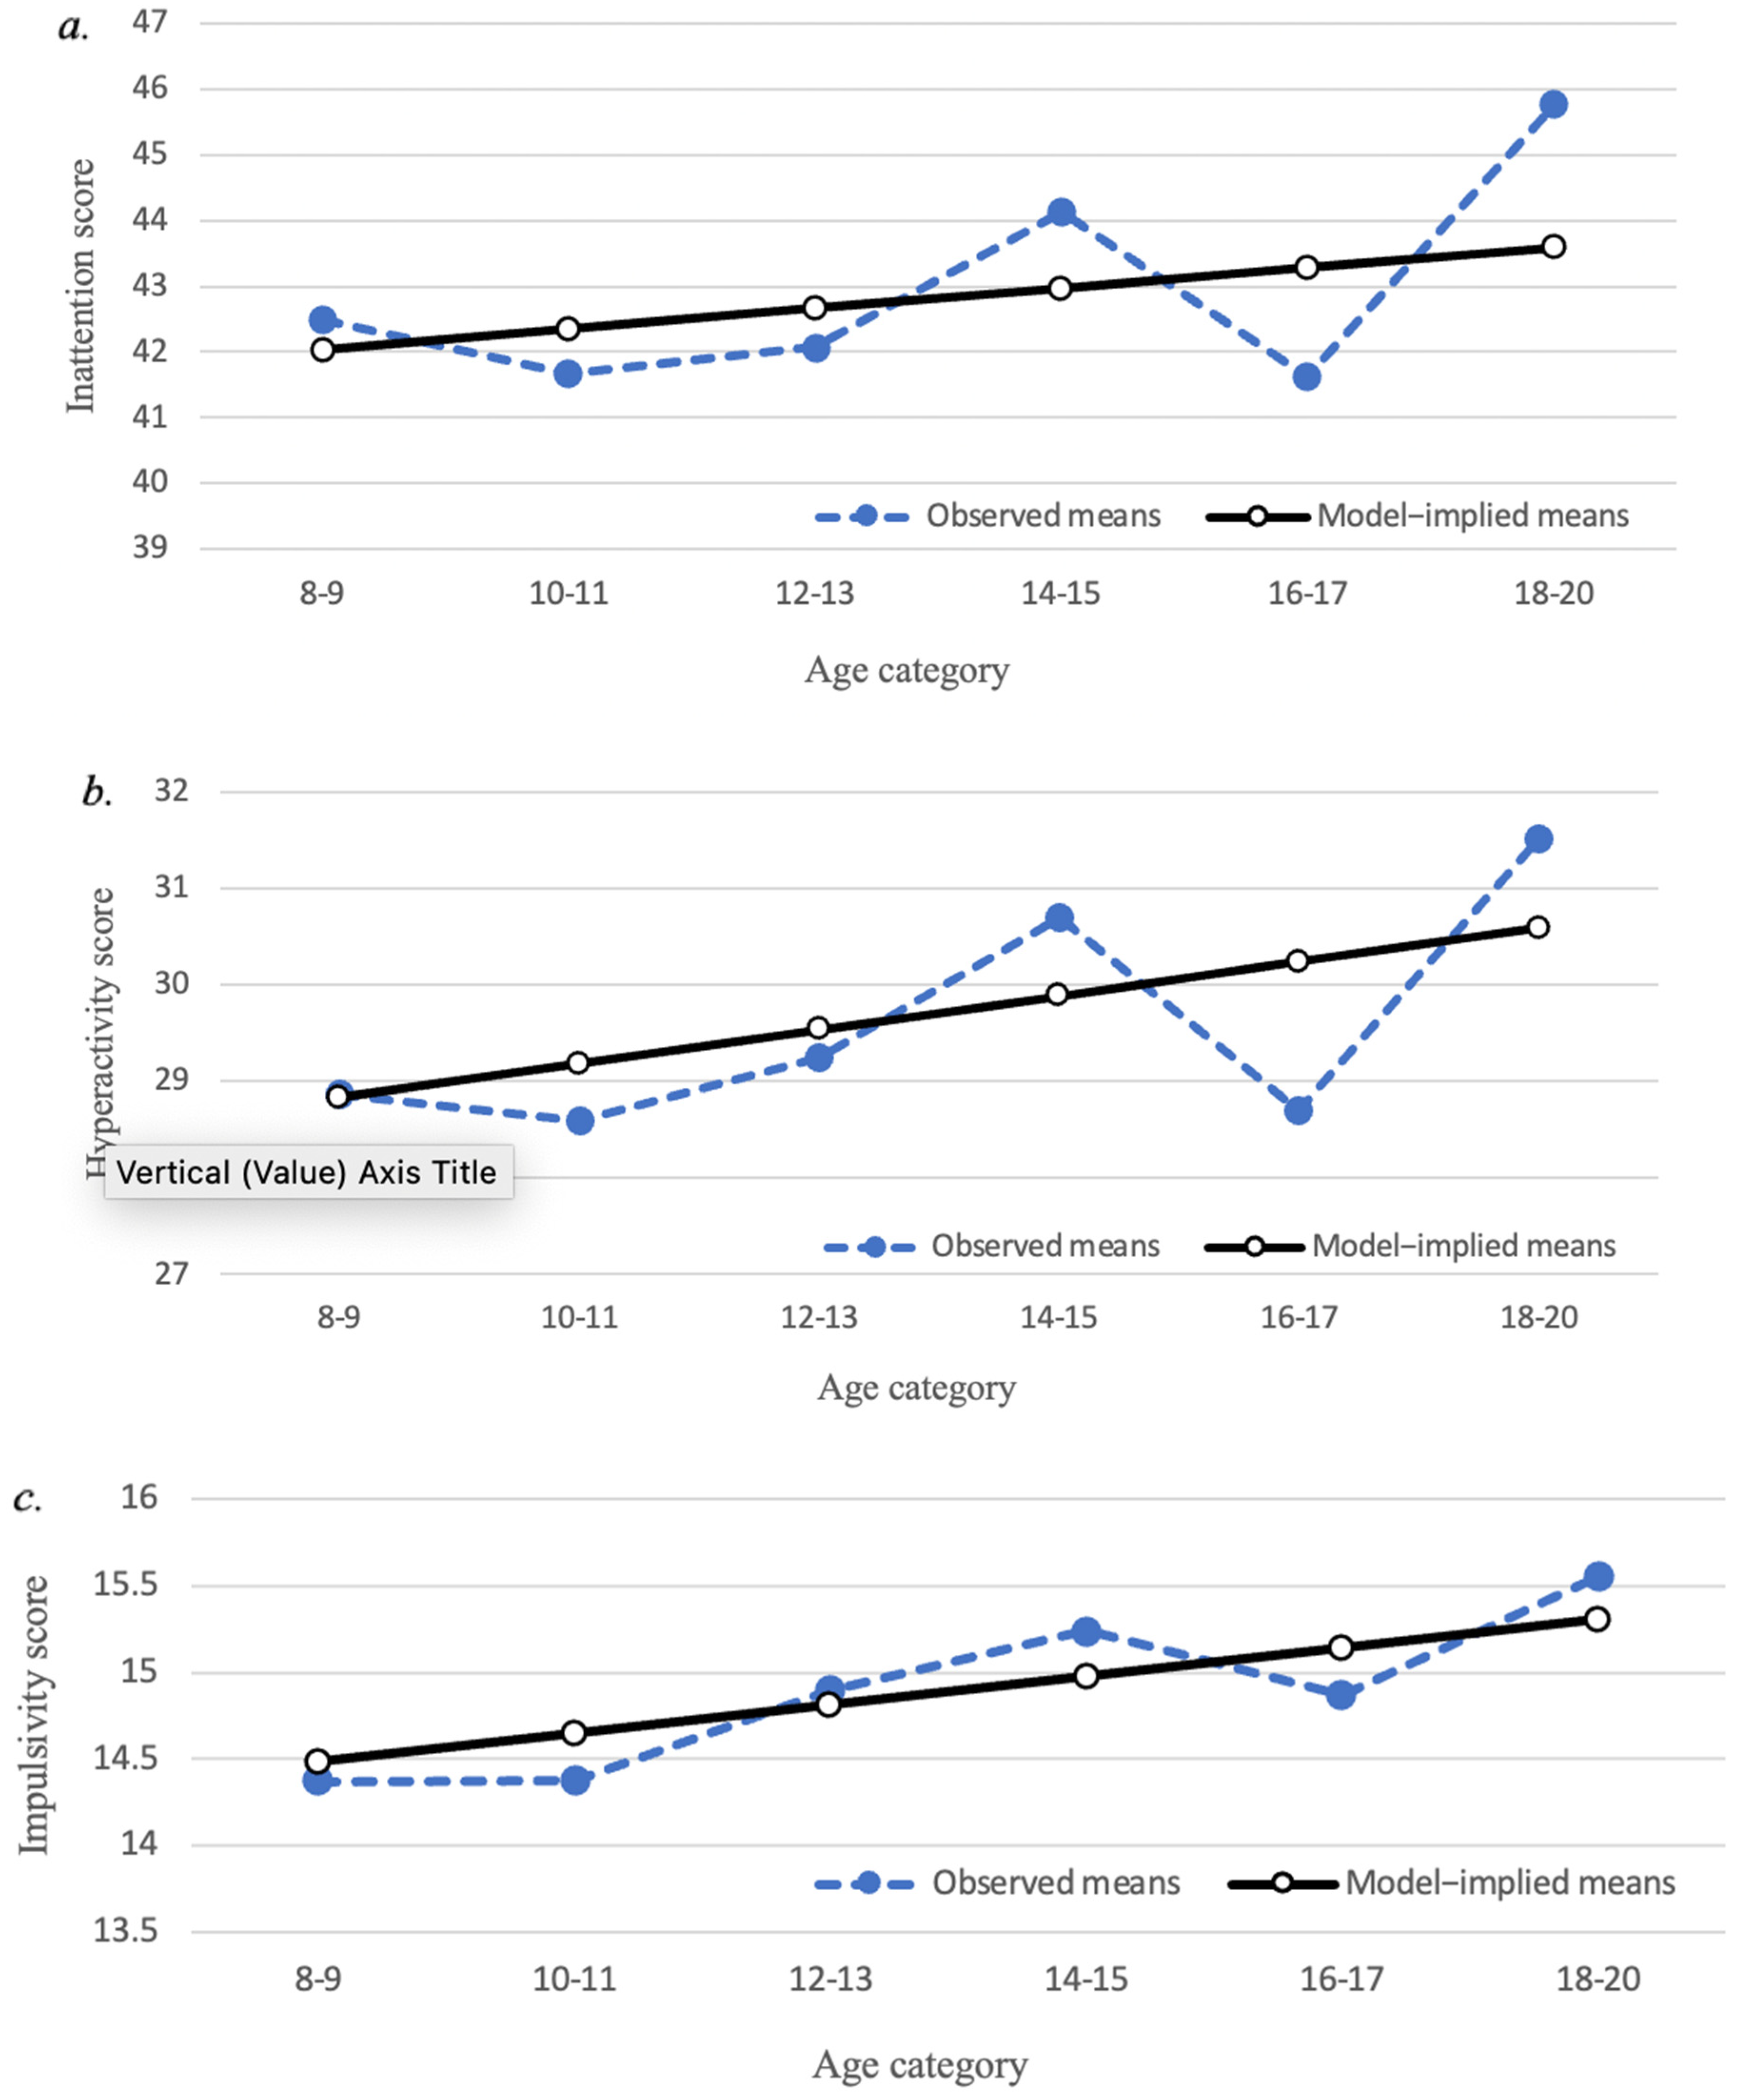
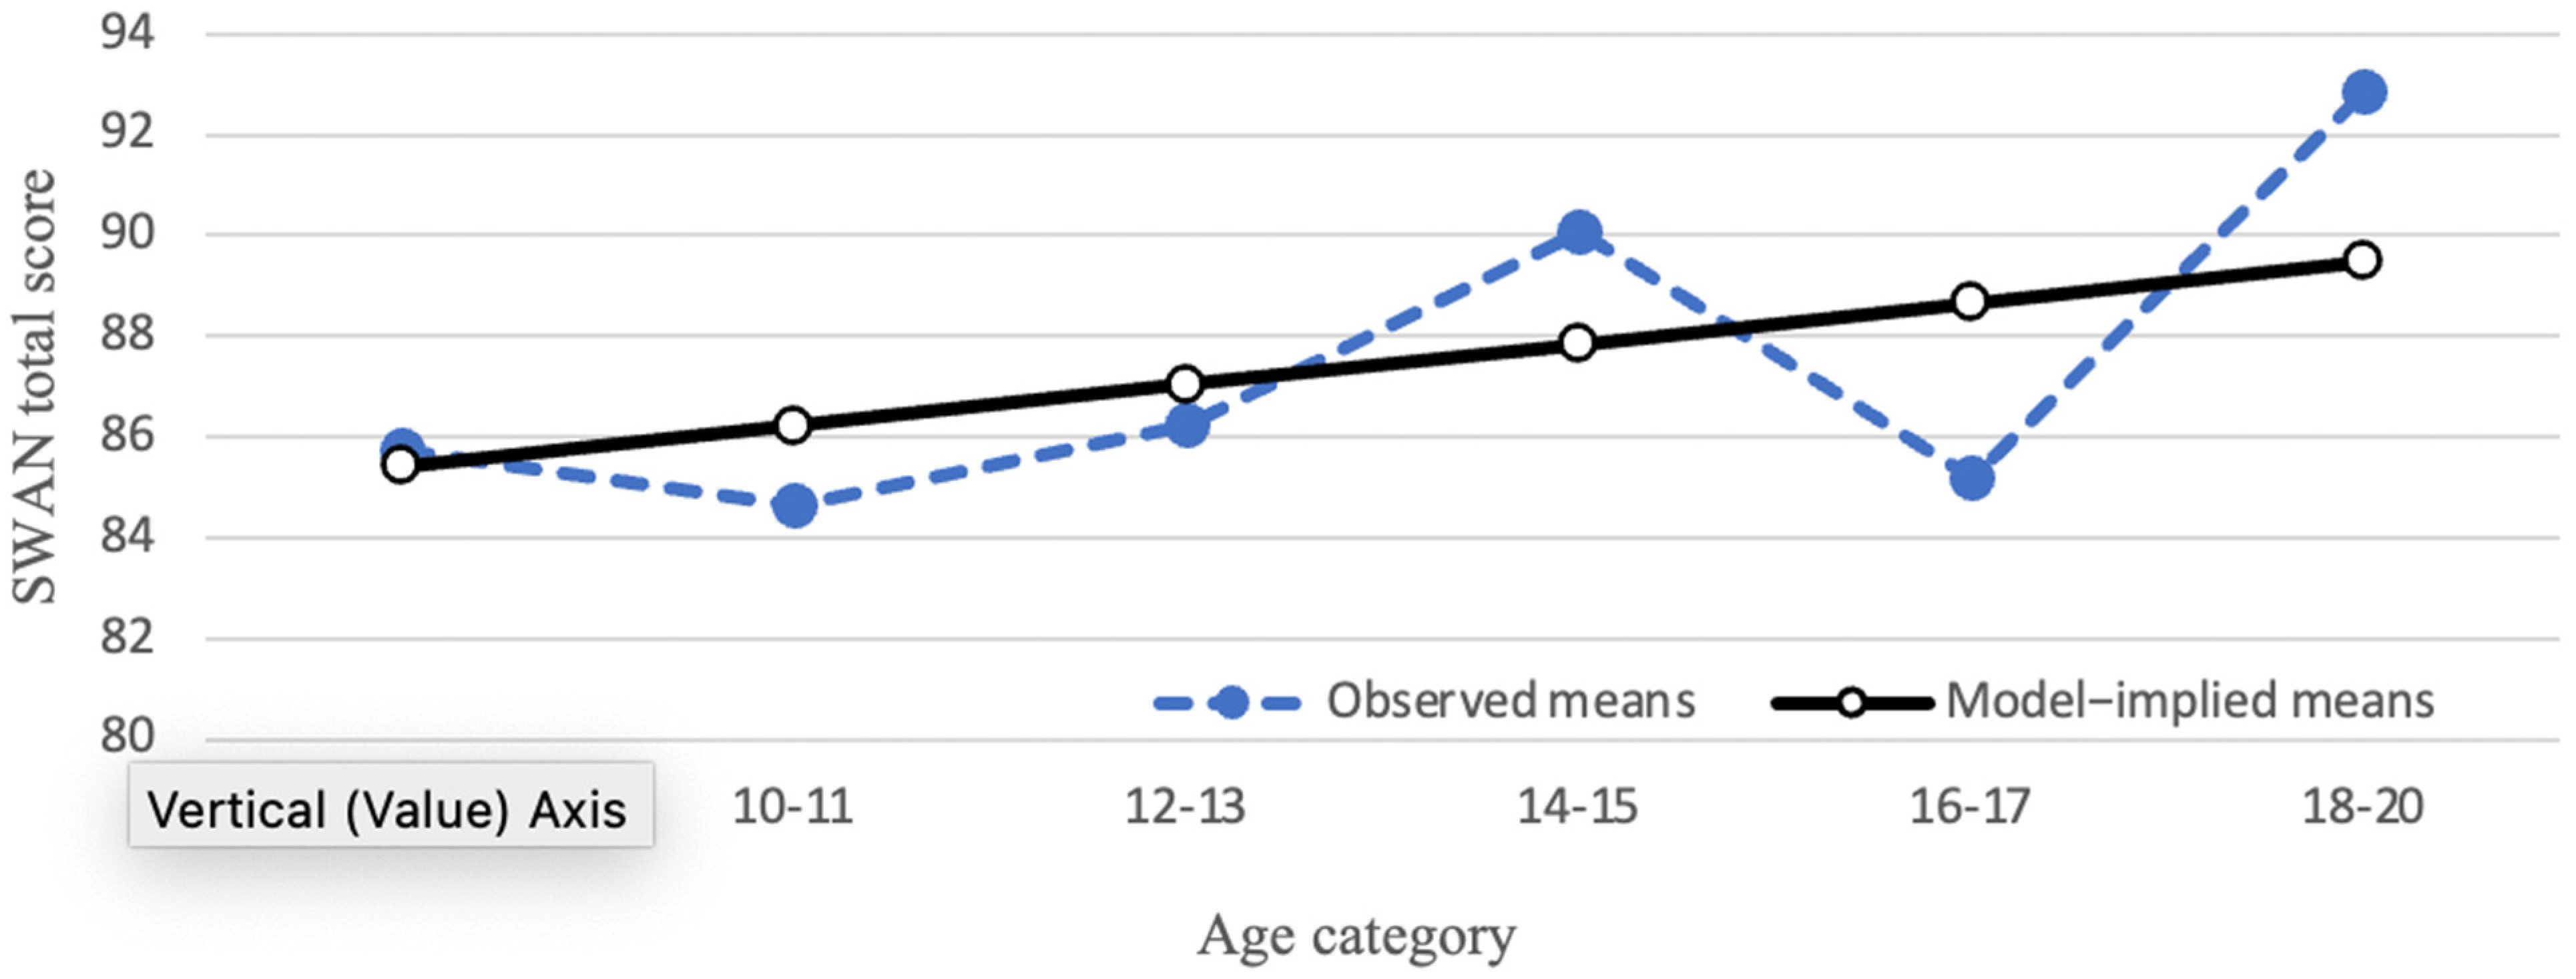
3.2. Trajectories of Parent-Reported Attention and Impulse Regulation
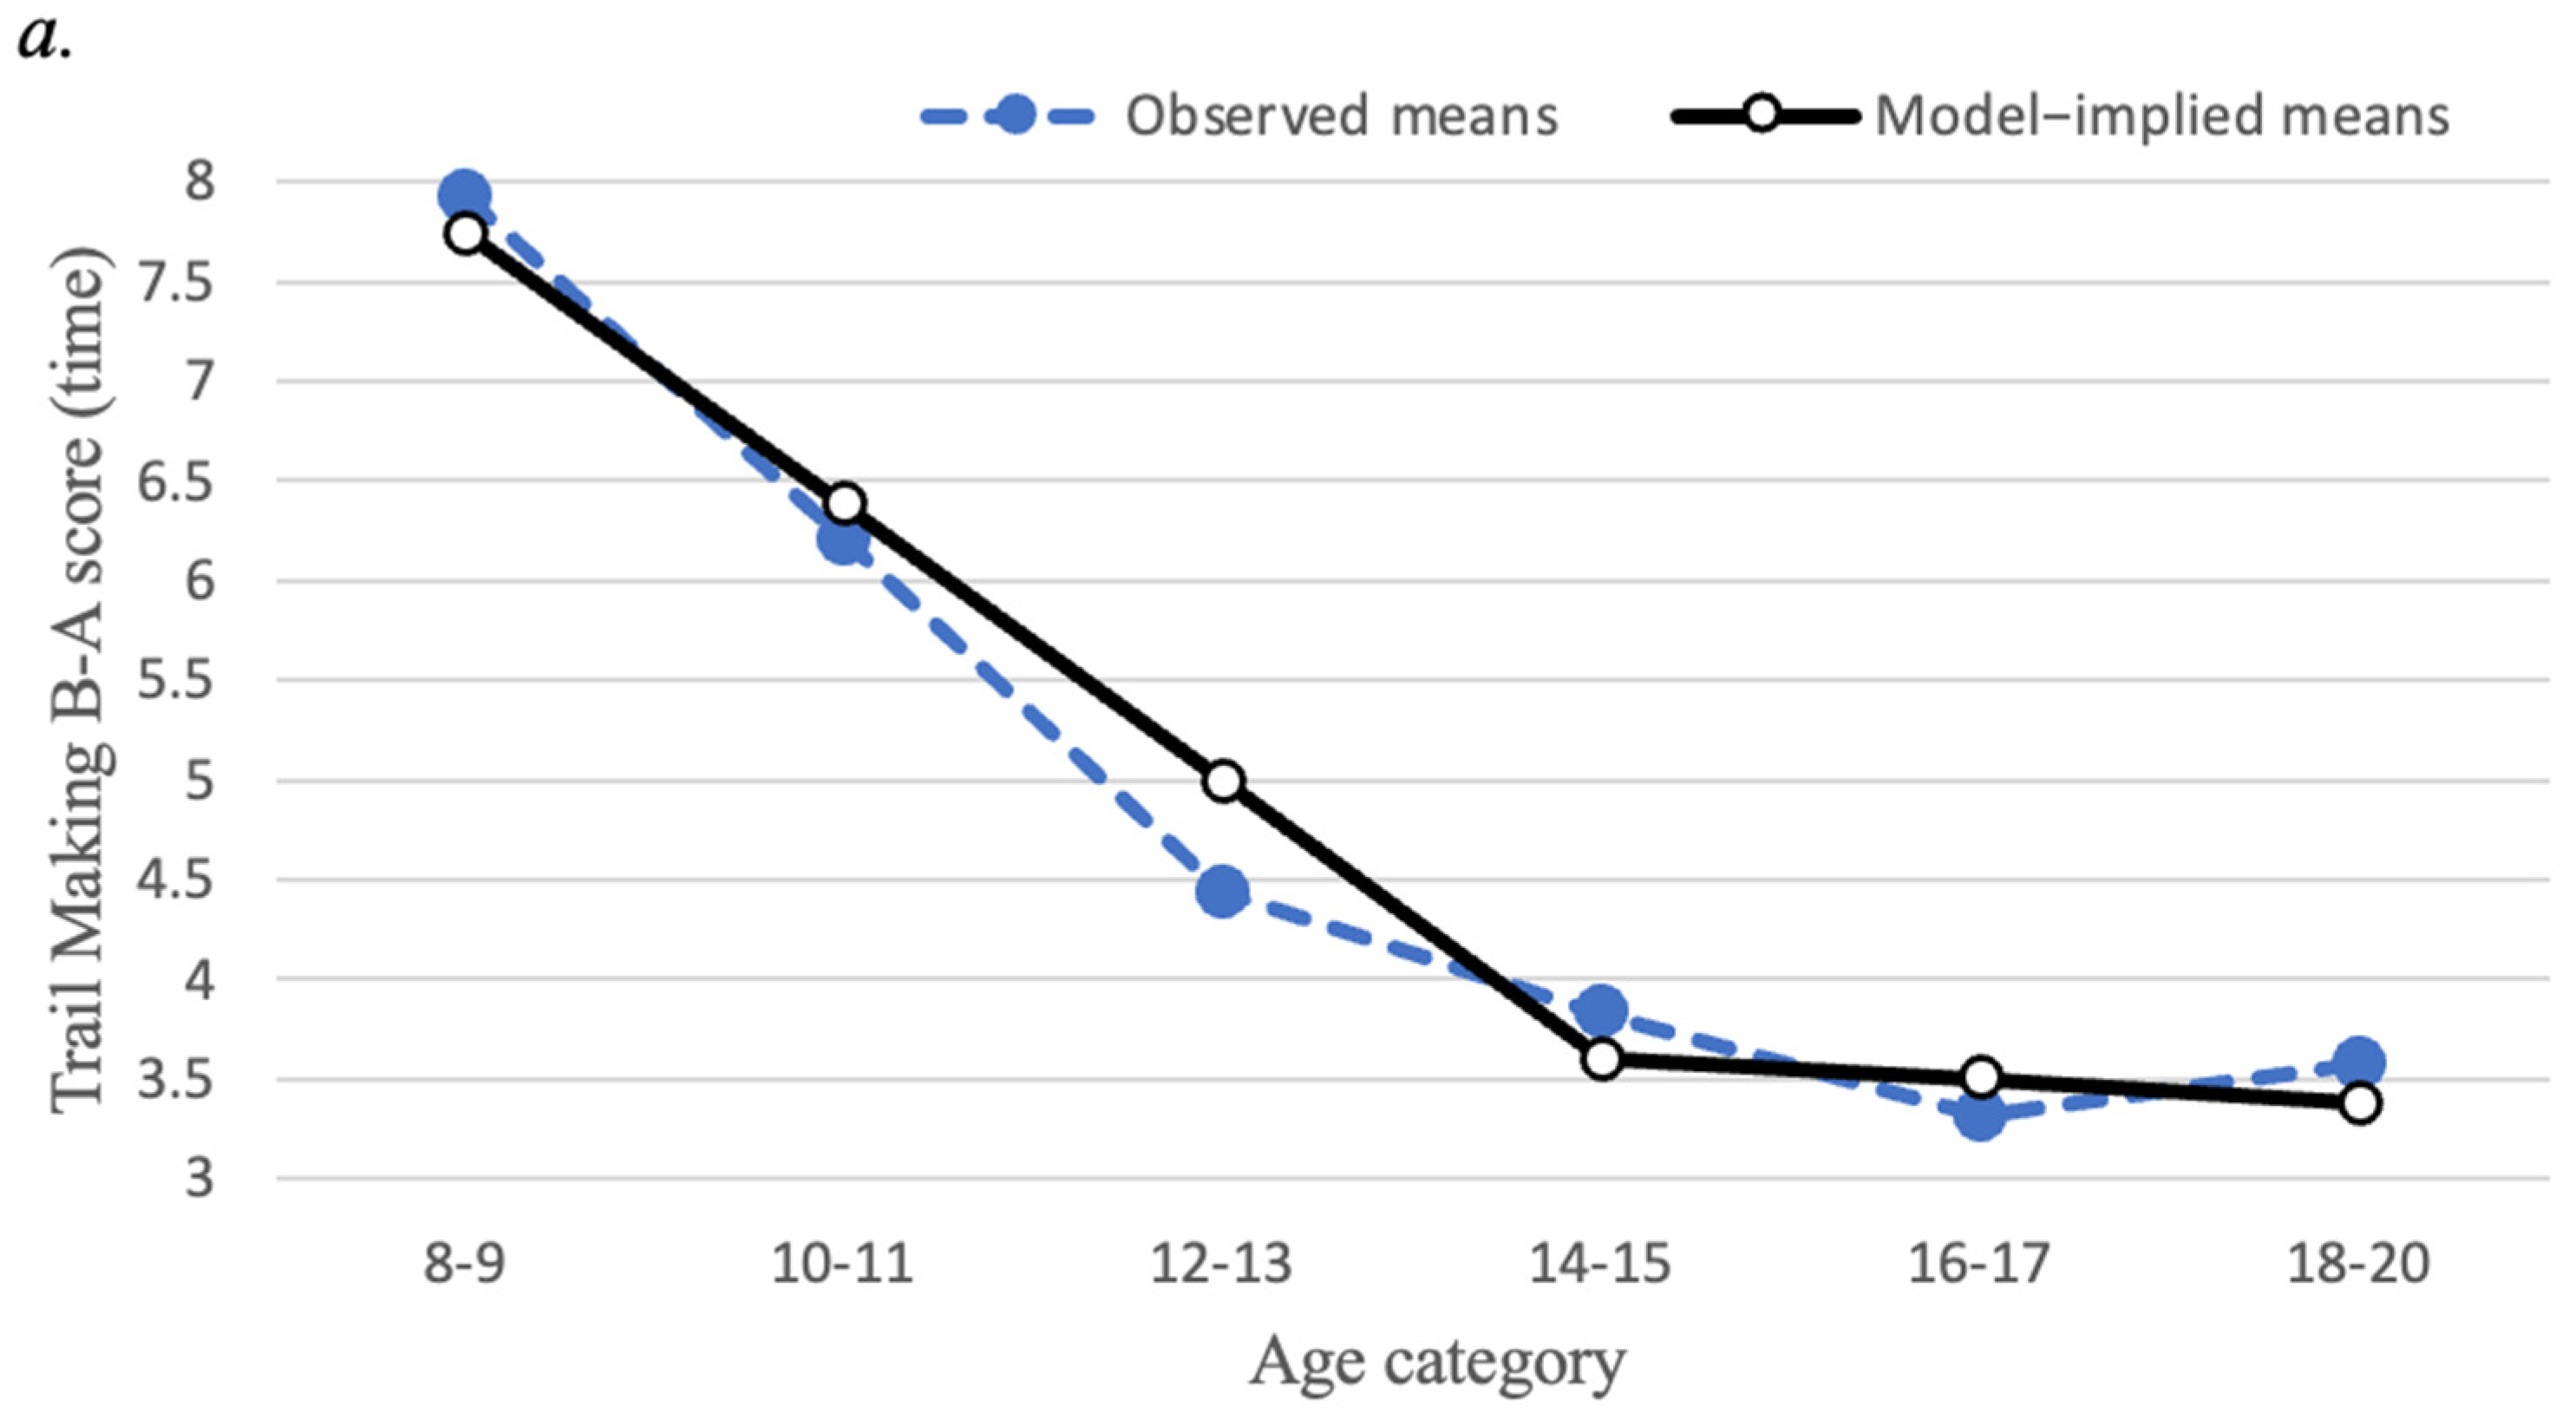
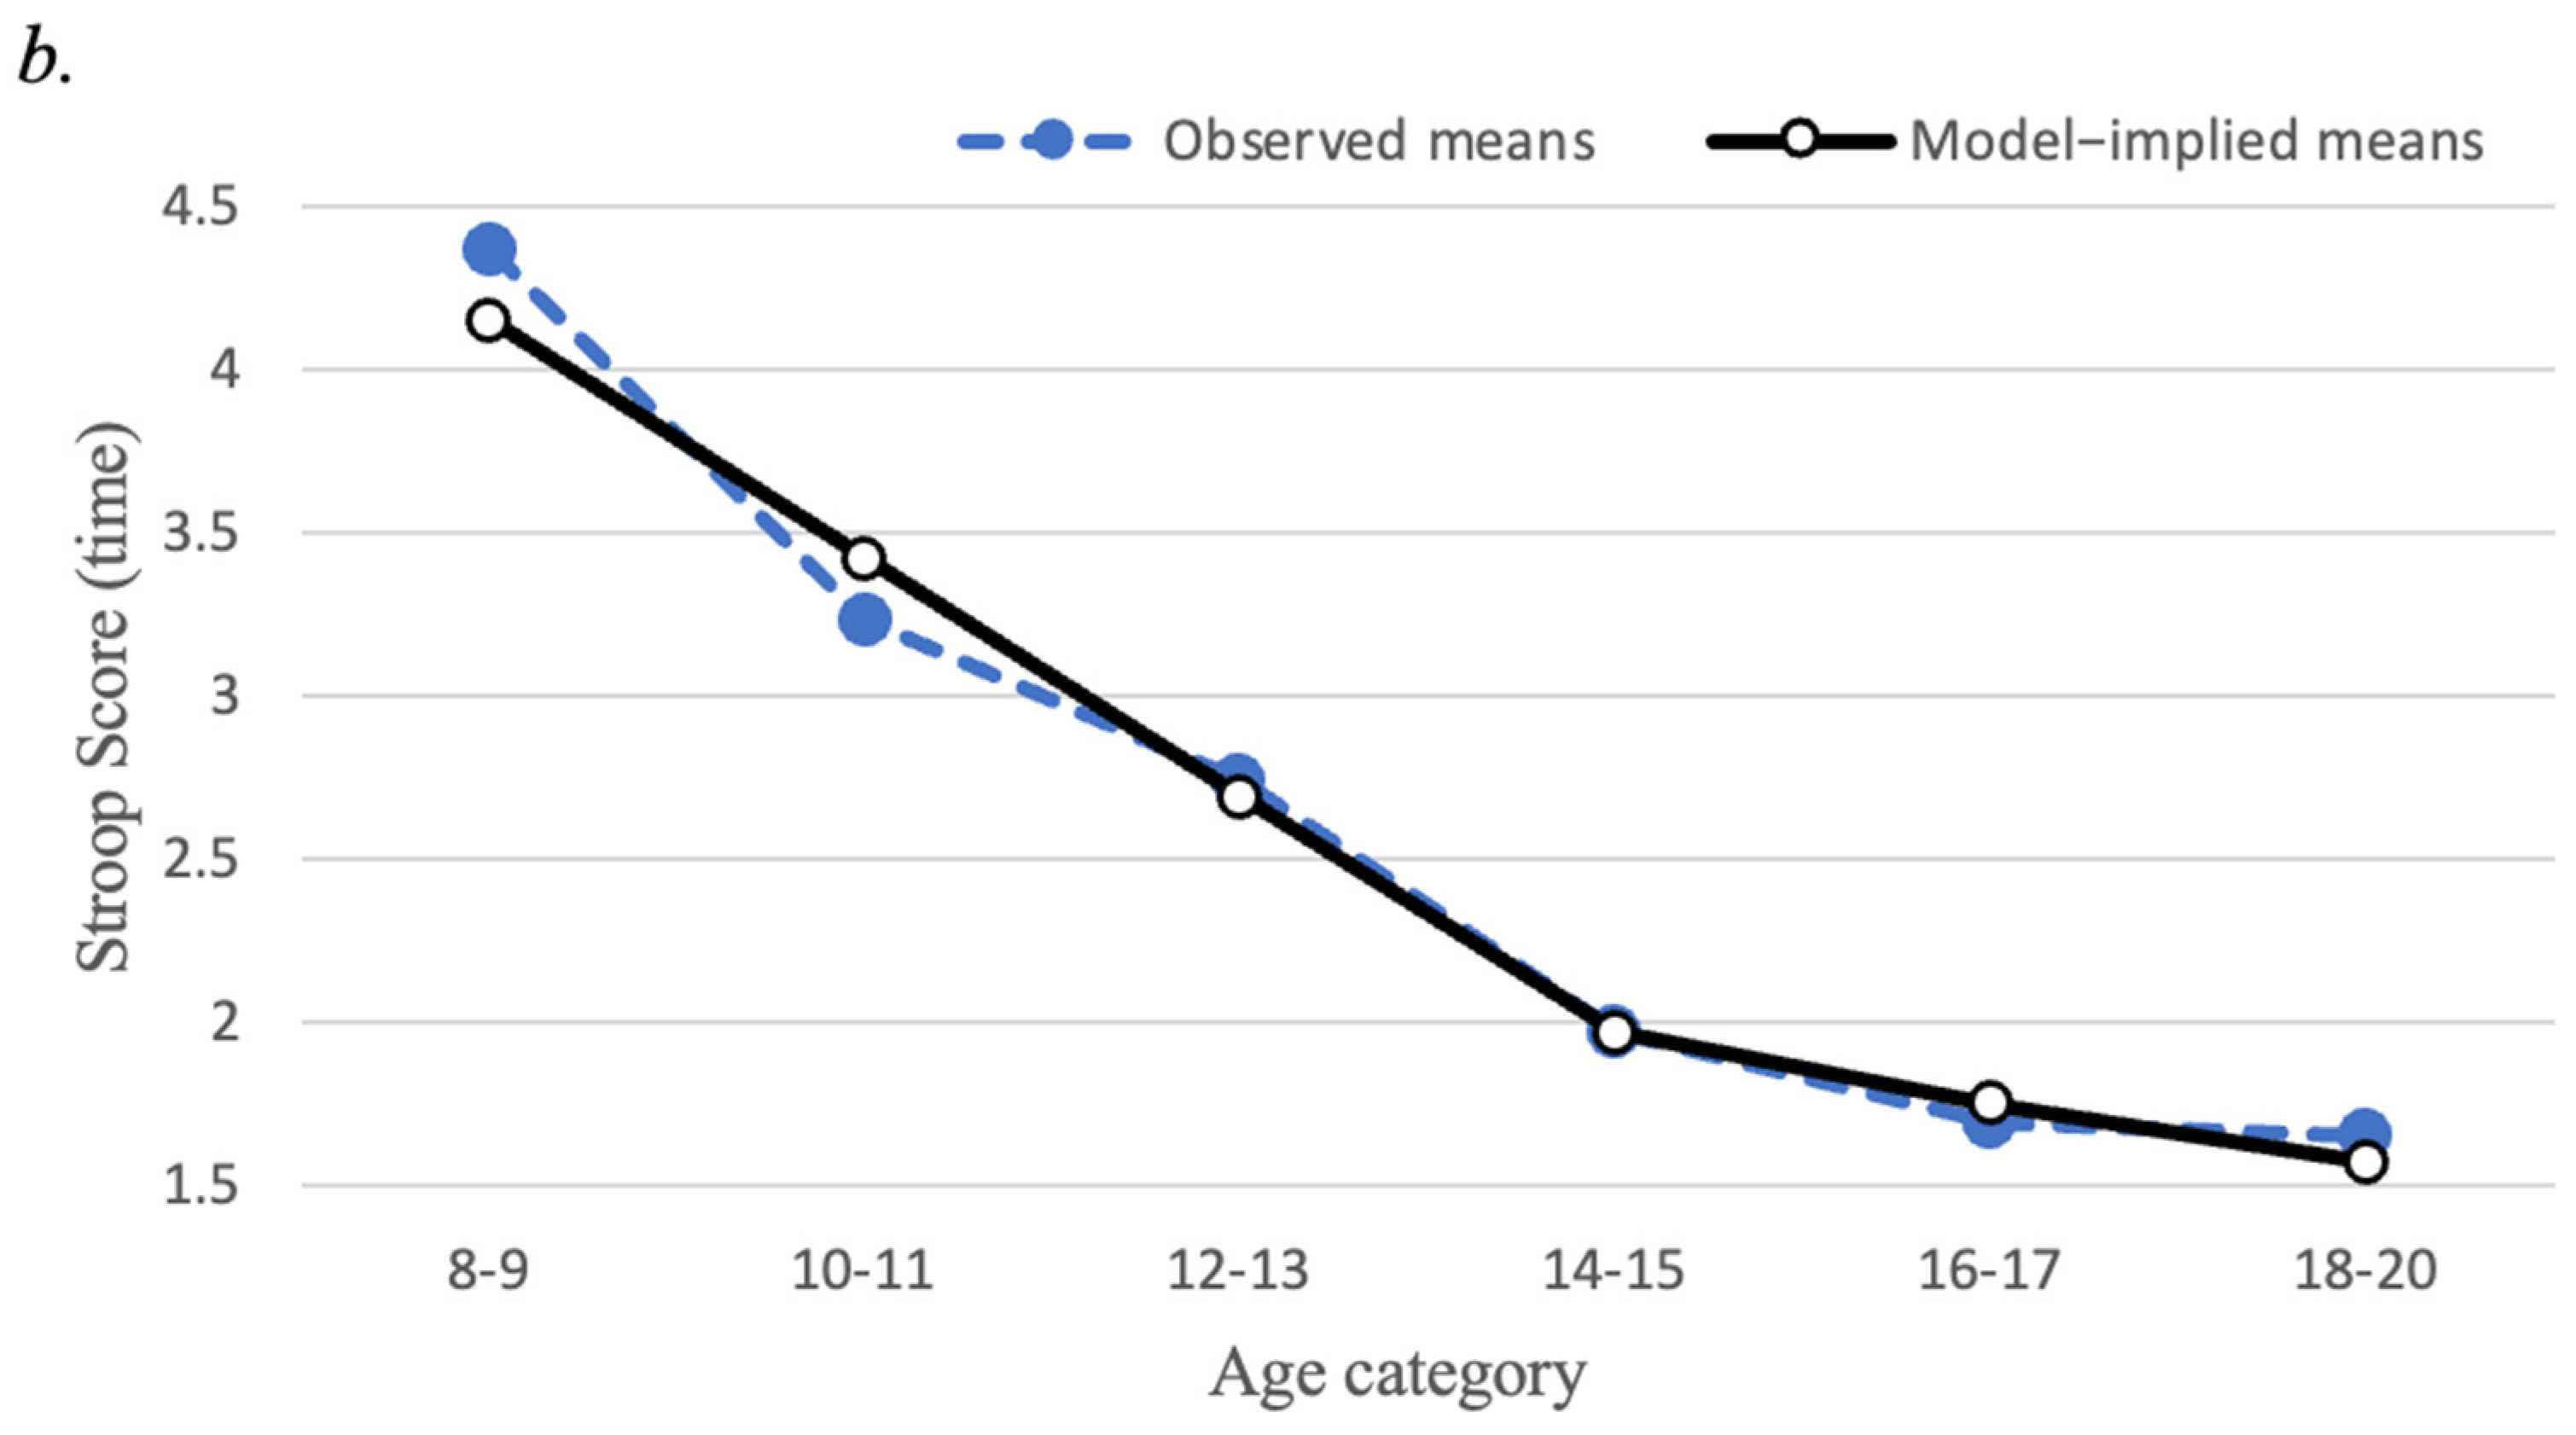
3.3. Trajectories of EF Tasks
3.4. Correlations
4. Discussion
4.1. Considerations for ADHD Assessment
4.2. Limitations and Future Directions
5. Conclusions
Author Contributions
Funding
Institutional Review Board Statement
Informed Consent Statement
Data Availability Statement
Acknowledgments
Conflicts of Interest
References
- Nigg, J.T. Annual research review: On the relations among self-regulation, self-control, executive functioning, effortful control, cognitive control, impulsivity, risk-taking, and inhibition for developmental psychopathology. J. Child Psychol. Psychiatry 2017, 58, 361–383. [Google Scholar] [CrossRef]
- Diamond, A. Executive functions. Annu. Rev. Psychol. 2013, 64, 135–168. [Google Scholar] [CrossRef] [PubMed] [Green Version]
- Steinberg, L. A social neuroscience perspective on adolescent risk-taking. Dev. Rev. 2008, 28, 78–106. [Google Scholar] [CrossRef] [Green Version]
- Monahan, K.C.; Steinberg, L.; Cauffman, E.; Mulvey, E.P. Trajectories of antisocial behavior and psychosocial maturity from adolescence to young adulthood. Dev. Psychol. 2009, 45, 1654–1668. [Google Scholar] [CrossRef] [Green Version]
- Dahl, R.E. Adolescent brain development: A period of vulnerabilities and opportunities. Ann. N. Y. Acad. Sci. 2004, 1021, 1–22. [Google Scholar] [CrossRef]
- Luna, B.; Garver, K.E.; Urban, T.A.; Lazar, N.A.; Sweeney, J.A. Maturation of cognitive processes from late childhood to adulthood. Child Dev. 2004, 75, 1357–1372. [Google Scholar] [CrossRef]
- Carlson, S.; Zelazo, P.; Faja, S. Executive functions. In The Oxford Handbook of Developmental Psychology, Vol. 1: Body and Mind; Zelazo, P.D., Ed.; Oxford University Press: Oxford, UK, 2012; Volume 1, pp. 706–743. [Google Scholar]
- Clark, C.; Prior, M.; Kinsella, G. The relationship between executive function abilities, adaptive behaviour, and academic achievement in children with externalising behaviour problems. J. Child Psychol. Psychiatry 2002, 43, 785–796. [Google Scholar] [CrossRef]
- Craig, F.; Margari, F.; Legrottaglie, A.R.; Palumbi, R.; de Giambattista, C.; Margari, L. A review of executive function deficits in autism spectrum disorder and attention-deficit/hyperactivity disorder. Neuropsychiatr. Dis. Treat. 2016, 12, 1191–1202. [Google Scholar] [CrossRef] [Green Version]
- Willcutt, E.G.; Doyle, A.E.; Nigg, J.T.; Faraone, S.V.; Pennington, B.F. Validity of the executive function theory of attention-deficit/hyperactivity disorder: A meta-analytic review. Biol. Psychiatry 2005, 57, 1336–1346. [Google Scholar] [CrossRef] [PubMed]
- Halse, M.; Steinsbekk, S.; Hammar, Å.; Wichstrøm, L. Longitudinal relations between impaired executive function and symptoms of psychiatric disorders in childhood. J. Child Psychol. Psychiatry 2022. [Google Scholar] [CrossRef]
- McAuley, T.; Chen, S.; Goos, L.; Schachar, R.; Crosbie, J. Is the behavior rating inventory of executive function more strongly associated with measures of impairment or executive function? J. Int. Neuropsychol. Soc. JINS 2010, 16, 495. [Google Scholar] [CrossRef] [PubMed]
- Toplak, M.E.; West, R.F.; Stanovich, K.E. Practitioner review: Do performance-based measures and ratings of executive function assess the same construct? J. Child Psychol. Psychiatry 2013, 54, 131–143. [Google Scholar] [CrossRef] [PubMed]
- Friedman, N.P.; Gustavson, D.E. Do rating and task measures of control abilities assess the same thing? Curr. Dir. Psychol. Sci. 2022, 31, 262–271. [Google Scholar] [CrossRef]
- Snyder, H.R.; Friedman, N.P.; Hankin, B.L. Associations between task performance and self-report measures of cognitive control: Shared versus distinct abilities. Assessment 2021, 28, 1080–1096. [Google Scholar] [CrossRef]
- Benedek, M.; Jauk, E.; Sommer, M.; Arendasy, M.; Neubauer, A.C. Intelligence, creativity, and cognitive control: The common and differential involvement of executive functions in intelligence and creativity. Intelligence 2014, 46, 73–83. [Google Scholar] [CrossRef] [Green Version]
- Miller, E.K.; Cohen, J.D. An integrative theory of prefrontal cortex function. Annu. Rev. Neurosci. 2001, 24, 167–202. [Google Scholar] [CrossRef] [Green Version]
- Best, J.R.; Miller, P.H.; Jones, L.L. Executive functions after age 5: Changes and correlates. Dev. Rev. 2009, 29, 180–200. [Google Scholar] [CrossRef] [Green Version]
- Jurado, M.B.; Rosselli, M. The elusive nature of executive functions: A review of our current understanding. Neuropsychol. Rev. 2007, 17, 213–233. [Google Scholar] [CrossRef]
- Zelazo, P.D.; Craik, F.I.; Booth, L. Executive function across the life span. Acta Psychol. 2004, 115, 167–183. [Google Scholar] [CrossRef]
- Miyake, A.; Friedman, N.P.; Emerson, M.J.; Witzki, A.H.; Howerter, A.; Wager, T.D. The unity and diversity of executive functions and their contributions to complex “Frontal Lobe” tasks: A latent variable analysis. Cogn. Psychol. 2000, 41, 49–100. [Google Scholar] [CrossRef] [Green Version]
- Lehto, J.E.; Juujarvi, P.; Kooistra, L.; Pulkkinen, L. Dimensions of executive functioning: Evidence from children. Br. J. Dev. Psychol. 2003, 21, 59–80. [Google Scholar] [CrossRef]
- Baggetta, P.; Alexander, P.A. Conceptualization and operationalization of executive function. Mind Brain Educ. 2016, 10, 10–33. [Google Scholar] [CrossRef]
- Jewsbury, P.A.; Bowden, S.C.; Strauss, M.E. Integrating the switching, inhibition, and updating model of executive function with the Cattell-Horn-Carroll model. J. Exp. Psychol. Gen. 2016, 145, 220–245. [Google Scholar] [CrossRef]
- Baddeley, A.D.; Hitch, G.J. Developments in the concept of working memory. Neuropsychology 1994, 8, 485–493. [Google Scholar] [CrossRef]
- Baddeley, A. The episodic buffer: A new component of working memory? Trends Cogn. Sci. 2000, 4, 417–423. [Google Scholar] [CrossRef]
- Engle, R.W.; Tuholski, S.W.; Laughlin, J.E.; Conway, A.R.A. Working memory, short-term memory, and general fluid intelligence: A latent-variable approach. J. Exp. Psychol. Gen. 1999, 128, 309–331. [Google Scholar] [CrossRef] [PubMed]
- Anderson, P. Assessment and development of executive function (EF) during childhood. Child Neuropsychol. 2002, 8, 71–82. [Google Scholar] [CrossRef] [PubMed]
- Steinberg, L. Cognitive and affective development in adolescence. Trends Cogn. Sci. 2005, 9, 69–74. [Google Scholar] [CrossRef]
- Zelazo, P.D.; Muller, U.; Frye, D.; Marcovitch, S.; Argitis, G.; Boseovski, J.; Chiang, J.K.; Hongwanishkul, D.; Schuster, B.V.; Sutherland, A. The development of executive function in early childhood. Monogr. Soc. Res. Child Dev. 2003, 68, vii-137. [Google Scholar] [CrossRef]
- Best, J.R.; Miller, P.H. A developmental perspective on executive function. Child Dev. 2010, 81, 1641–1660. [Google Scholar] [CrossRef] [Green Version]
- Carlson, S.M. Developmentally sensitive measures of executive function in preschool children. Dev. Neuropsychol. 2005, 28, 595–616. [Google Scholar] [CrossRef] [PubMed]
- Bunge, S.A.; Zelazo, P.D. A brain-based account of the development of rule use in childhood. Curr. Dir. Psychol. Sci. 2006, 15, 118–121. [Google Scholar] [CrossRef]
- Diamond, A. Normal development of prefrontal cortex from birth to young adulthood: Cognitive functions, anatomy, and biochemistry. In Principles of Frontal Lobe Function; Oxford University Press: New York, NY, USA, 2002; pp. 466–503. [Google Scholar]
- Durston, S.; Davidson, M.C.; Tottenham, N.; Galvan, A.; Spicer, J.; Fossella, J.A.; Casey, B.J. A shift from diffuse to focal cortical activity with development. Dev. Sci. 2006, 9, 1–8. [Google Scholar] [CrossRef]
- Moriguchi, Y.; Hiraki, K. Neural origin of cognitive shifting in young children. Proc. Natl. Acad. Sci. USA 2009, 106, 6017–6021. [Google Scholar] [CrossRef] [PubMed] [Green Version]
- Achenbach, T.M.; Rescorla, L. Aseba School-Age Forms & Profiles; Aseba Burlington, Vt: Burlington, VT, USA, 2001. [Google Scholar]
- Moffitt, T.E.; Arseneault, L.; Belsky, D.; Dickson, N.; Hancox, R.J.; Harrington, H.; Houts, R.; Poulton, R.; Roberts, B.W.; Ross, S.; et al. A gradient of childhood self-control predicts health, wealth, and public safety. Proc. Natl. Acad. Sci. USA 2011, 108, 2693–2698. [Google Scholar] [CrossRef] [Green Version]
- Pelham, W.E., Jr.; Fabiano, G.A.; Massetti, G.M. Evidence-based assessment of attention deficit hyperactivity disorder in children and adolescents. J. Clin. Child Adolesc. Psychol. 2005, 34, 449–476. [Google Scholar] [CrossRef]
- Smith, B.H.; Pelham, W.E.; Gnagy, E.; Molina, B.; Evans, S. The reliability, validity, and unique contributions of self-report by adolescents receiving treatment for attention-deficit/hyperactivity disorder. J. Consult. Clin. Psychol. 2000, 68, 489–499. [Google Scholar] [CrossRef]
- Swanson, J.M.; Schuck, S.; Porter, M.M.; Carlson, C.; Hartman, C.A.; Sergeant, J.A.; Clevenger, W.; Wasdell, M.; McCleary, R.; Lakes, K.; et al. Categorical and dimensional definitions and evaluations of symptoms of ADHD: History of the SNAP and the SWAN rating scales. Int. J. Educ. Psychol. Assess. 2012, 10, 51–70. [Google Scholar] [PubMed]
- Arnett, A.B.; Pennington, B.F.; Friend, A.; Willcutt, E.G.; Byrne, B.; Samuelsson, S.; Olson, R.K. The SWAN captures variance at the negative and positive ends of the ADHD symptom dimension. J. Atten. Disord. 2013, 17, 152–162. [Google Scholar] [CrossRef] [Green Version]
- American Psychiatric Association. Diagnostic and Statistical Manual of Mental Disorders, 5th ed.; (DSM-V); American Psychiatric Association: Arlington, VA, USA, 2013. [Google Scholar]
- Lakes, K.D.; Swanson, J.M.; Riggs, M. The reliability and validity of the English and Spanish Strengths and Weaknesses of ADHD and Normal behavior rating scales in a preschool sample: Continuum measures of hyperactivity and inattention. J. Atten. Disord. 2012, 16, 510–516. [Google Scholar] [CrossRef] [Green Version]
- Holbrook, J.R.; Cuffe, S.P.; Cai, B.; Visser, S.N.; Forthofer, M.S.; Bottai, M.; Ortaglia, A.; McKeown, R.E. Persistence of parent-reported ADHD symptoms from childhood through adolescence in a community sample. J. Atten. Disord. 2016, 20, 11–20. [Google Scholar] [CrossRef] [PubMed] [Green Version]
- Hay, D.A.; Bennett, K.S.; Levy, F.; Sergeant, J.; Swanson, J. A twin study of attention-deficit/hyperactivity disorder dimensions rated by the strengths and weaknesses of ADHD-symptoms and normal-behavior (SWAN) scale. Biol. Psychiatry 2007, 61, 700–705. [Google Scholar] [CrossRef] [PubMed]
- Mischel, W.; Shoda, Y.; Rodriguez, M.I. Delay of gratification in children. Science 1989, 244, 933–938. [Google Scholar] [CrossRef] [Green Version]
- Kochanska, G.; Coy, K.C.; Murray, K.T. The development of self-regulation in the first four years of life. Child Dev. 2001, 72, 1091–1111. [Google Scholar] [CrossRef] [PubMed]
- Duckworth, A.L.; Kern, M.L. A meta-analysis of the convergent validity of self-control measures. J. Res. Personal. 2011, 45, 259–268. [Google Scholar] [CrossRef] [Green Version]
- Barkley, R.A.; Murphy, K.R. Impairment in occupational functioning and adult ADHD: The predictive utility of executive function (EF) ratings versus EF tests. Arch. Clin. Neuropsychol. 2010, 25, 157–173. [Google Scholar] [CrossRef] [Green Version]
- Mazza, G.L.; Smyth, H.L.; Bissett, P.G.; Canning, J.R.; Eisenberg, I.W.; Enkavi, A.Z.; Gonzalez, O.; Kim, S.J.; Metcalf, S.A.; Muniz, F.; et al. Correlation database of 60 cross-disciplinary surveys and cognitive tasks assessing self-regulation. J. Personal. Assess. 2020, 103, 238–245. [Google Scholar] [CrossRef]
- Toplak, M.E.; West, R.F.; Stanovich, K.E. Rational thinking and cognitive sophistication: Development, cognitive abilities, and thinking dispositions. Dev. Psychol. 2014, 50, 1037–1048. [Google Scholar] [CrossRef] [Green Version]
- Stroop, J.R. Studies of interference in serial verbal reactions. J. Exp. Psychol. 1935, 18, 643–662. [Google Scholar] [CrossRef]
- Reitan, R.M. Validity of the trail making test as an indicator of organic brain damage. Percept. Mot. Ski. 1958, 8, 271–276. [Google Scholar] [CrossRef]
- Reitan, R.M. The relation of the trail making test to organic brain damage. J. Consult. Psychol. 1955, 19, 393–394. [Google Scholar] [CrossRef] [PubMed]
- Nesselroade, J.R.; Baltes, P.B. History and rationale of longitudinal research. In Longitudinal Research in the Study of Behavior and Development; Nesselroade, J.R., Baltes, P.B., Eds.; Academic Press: New York, NY, USA, 1979; pp. 1–39. [Google Scholar]
- Bollen, K.A.; Curran, P.J. Latent Curve Models: A Structural Equation Approach; Wiley: Hoboken, NJ, USA, 2006. [Google Scholar]
- Yuan, K.-H.; Bentler, P.M. Three likelihood-based methods for mean and covariance structure analysis with nonnormal missing data. Sociol. Methodol. 2000, 30, 165–200. [Google Scholar] [CrossRef]
- Flora, D.B. Specifying piecewise latent trajectory models for longitudinal data. Struct. Equ. Modeling-A Multidiscip. J. 2008, 15, 513–533. [Google Scholar] [CrossRef]
- Vergunst, F.; Tremblay, R.E.; Galera, C.; Nagin, D.; Vitaro, F.; Boivin, M.; Côté, S.M. Multi-rater developmental trajectories of hyperactivity–impulsivity and inattention symptoms from 1.5 to 17 years: A population-based birth cohort study. Eur. Child Adolesc. Psychiatry 2019, 28, 973–983. [Google Scholar] [CrossRef] [PubMed] [Green Version]
- Biederman, J.; Mick, E.; Faraone, S.V. Age-dependent decline of symptoms of attention deficit hyperactivity disorder: Impact of remission definition and symptom type. Am. J. Psychiatry 2000, 157, 816–818. [Google Scholar] [CrossRef] [PubMed]
- Dopfner, M.; Hautmann, C.; Gortz-Dorten, A.; Klasen, F.; Ravens-Sieberer, U.; The BELLA Study Group. Long-term course of ADHD symptoms from childhood to early adulthood in a community sample. Eur. Child Adolesc. Psychiatry 2015, 24, 665–673. [Google Scholar] [CrossRef] [PubMed]
- Pingault, J.-B.; Viding, E.; Galéra, C.; Greven, C.U.; Zheng, Y.; Plomin, R.; Rijsdijk, F. Genetic and environmental influences on the developmental course of attention-deficit/hyperactivity disorder symptoms from childhood to adolescence. JAMA Psychiatry 2015, 72, 651–658. [Google Scholar] [CrossRef]
- Eisenberg, I.W.; Bissett, P.G.; Zeynep Enkavi, A.; Li, J.; MacKinnon, D.P.; Marsch, L.A.; Poldrack, R.A. Uncovering the structure of self-regulation through data-driven ontology discovery. Nat. Commun. 2019, 10, 2319. [Google Scholar] [CrossRef] [Green Version]
- Rizeq, J.; Flora, D.B.; Toplak, M.E. Changing relations among cognitive abilities across development: Implications for measurement and research. Clin. Neuropsychol. 2017, 31, 1353–1374. [Google Scholar] [CrossRef] [PubMed] [Green Version]
- Conners, C.K. Conners 3rd Edition: Manual; Multi-Health Systems: North Tonawanda, NY, USA, 2008. [Google Scholar]
- DuPaul, G.J.; Power, T.J.; Anastopoulos, A.D.; Reid, R. ADHD Rating Scale-5 for Children and Adolescents: Checklists, Norms, and Clinical Interpretation; The Guilford Press: New York, NY, USA, 2016. [Google Scholar]
- NICHQ Vanderbilt Assessment Scales, 3rd ed.; American Academy of Pediatrics: Itasca, IL, USA, 2019.
- Swanson, J. SNAP-IV Scale; University of California Child Development Center: Irvine, CA, USA, 1995. [Google Scholar]
- Brown, T.E. Brown Attention-Deficit Disorder Scales (ADDScales): For Children and Adolescent: Manual; Psychological Corporation: San Antonio, TX, USA, 2001. [Google Scholar]
- Achenbach, T.M.; Rescorla, L.A. Manual for the ASEBA School-Age Form & Profiles; University of Vermont, Research Centre for Children, Youth & Families: Burlington, VT, USA, 2001. [Google Scholar]
- Reynolds, C.R.; Kamphaus, R.W. BASC-3: Behaviour Assessment System for Children, 3rd ed.; NCS Pearson, Inc.: Bloomington, MN, USA, 2015. [Google Scholar]
- Goodman, R. The Strengths and Difficulties Questionnaire: A research note. J. Child Psychol. Psychiatry 1997, 38, 581–586. [Google Scholar] [CrossRef]
- Bracken, B.A.; Boatwright, B.S. Clinical Assessment of Attention Deficit (Manual); PAR Press: Lutz, FL, USA, 2005. [Google Scholar]
- Gioia, G.; Isquith, P.K.; Guy, S.C.; Kenworth, L. Behavior Rating Inventory of Executive Function (BRIEF), 2nd ed.; PAR Inc.: Lutz, FL, USA, 2015. [Google Scholar]
- Thorell, L.B.; Nyberg, L. The Childhood Executive Functioning Inventory (CHEXI): A new rating instrument for parents and teachers. Dev. Neuropsychol. 2008, 33, 536–552. [Google Scholar]
- Thorell, L.B.; Lazarević, N.; Milovanović, I.; Bugarski Ignjatović, V. Psychometric properties of the Teenage Executive Functioning Inventory (TEXI): A freely available questionnaire for assessing deficits in working memory and inhibition among adolescents. Child Neuropsychol. 2020, 26, 857–864. [Google Scholar] [CrossRef] [Green Version]
- Barkley, R.A. Barkley Deficits in Executive Functioning Scale—Children and Adolescents (BDEFS-CA); Guilford Press: New York, NY, USA, 2012. [Google Scholar]
- Delis, D. Delis Rating of Executive Function (D-REF); Pearson: Bloominton, MN, USA, 2012. [Google Scholar]
- Burton, C.L.; Wright, L.; Shan, J.; Xiao, B.; Dupuis, A.; Goodale, T.; Shaheen, S.M.; Corfield, E.C.; Arnold, P.D.; Schachar, R.J.; et al. SWAN scale for ADHD trait-based genetic research: A validity and polygenic risk study. J. Child Psychol. Psychiatry 2019, 60, 988–997. [Google Scholar] [CrossRef] [PubMed]
- Faraone, S.V.; Asherson, P.; Banaschewski, T.; Biederman, J.; Buitelaar, J.K.; Ramos-Quiroga, J.A.; Rohde, L.A.; Sonuga-Barke, E.J.; Tannock, R.; Franke, B. Attention-deficit/hyperactivity disorder. Nat. Rev. Dis. Primers 2015, 1, 15020. [Google Scholar] [CrossRef] [PubMed]
- Makris, N.; Biederman, J.; Valera, E.M.; Bush, G.; Kaiser, J.; Kennedy, D.N.; Caviness, V.S.; Faraone, S.V.; Seidman, L.J. Cortical thinning of the attention and executive function networks in adults with attention-deficit/hyperactivity disorder. Cereb. Cortex 2007, 17, 1364–1375. [Google Scholar] [CrossRef] [PubMed] [Green Version]
- Shaw, P.; Eckstrand, K.; Sharp, W.; Blumenthal, J.; Lerch, J.P.; Greenstein, D.; Clasen, L.; Evans, A.; Giedd, J.; Rapoport, J.L. Attention-deficit/hyperactivity disorder is characterized by a delay in cortical maturation. Proc. Natl. Acad. Sci. USA 2007, 104, 19649–19654. [Google Scholar] [CrossRef] [PubMed] [Green Version]
- Shaw, P.; Gilliam, M.; Liverpool, M.; Weddle, C.; Malek, M.; Sharp, W.; Greenstein, D.; Evans, A.; Rapoport, J.; Giedd, J. Cortical development in typically developing children with symptoms of hyperactivity and impulsivity: Support for a dimensional view of attention deficit hyperactivity disorder. Am. J. Psychiatry 2011, 168, 143–151. [Google Scholar] [CrossRef] [Green Version]
- Nigg, J.T. What Causes ADHD?: Understanding What Goes Wrong and Why; Guilford Publications: New York, NY, USA, 2009; p. 422. [Google Scholar]
- Hoogman, M.; Bralten, J.; Hibar, D.P.; Mennes, M.; Zwiers, M.P.; Schweren, L.S.J.; van Hulzen, K.J.E.; Medland, S.E.; Shumskaya, E.; Jahanshad, N.; et al. Subcortical brain volume differences in participants with attention deficit hyperactivity disorder in children and adults: A cross-sectional mega-analysis. Lancet Psychiatry 2017, 4, 310–319. [Google Scholar] [CrossRef] [Green Version]
- Rosch, K.S.; Crocetti, D.; Hirabayashi, K.; Denckla, M.B.; Mostofsky, S.H.; Mahone, E.M. Reduced subcortical volumes among preschool-age girls and boys with ADHD. Psychiatry Res. Neuroimaging 2018, 271, 67–74. [Google Scholar] [CrossRef] [Green Version]
- Silk, T.J.; Genc, S.; Anderson, V.; Efron, D.; Hazell, P.; Nicholson, J.M.; Kean, M.; Malpas, C.B.; Sciberras, E. Developmental brain trajectories in children with ADHD and controls: A longitudinal neuroimaging study. BMC Psychiatry 2016, 16, 59. [Google Scholar] [CrossRef] [Green Version]
- Battaglia, S.; Thayer, J.F. Functional interplay between central and autonomic nervous systems in human fear conditioning. Trends Neurosci. 2022, 45, 504–506. [Google Scholar] [CrossRef]
- Stein, D.J.; Szatmari, P.; Gaebel, W.; Berk, M.; Vieta, E.; Maj, M.; de Vries, Y.A.; Roest, A.M.; de Jonge, P.; Maercker, A.; et al. Mental, behavioral and neurodevelopmental disorders in the ICD-11: An international perspective on key changes and controversies. BMC Med. 2020, 18, 21. [Google Scholar] [CrossRef] [PubMed] [Green Version]
- Ackerman, P.L. Intelligence, attention, and learning: Maximal and typical performance. Curr. Top. Hum. Intell. 1994, 4, 1–27. [Google Scholar]
- Ackerman, P.L. A theory of adult intellectual development: Process, personality, interests, and knowledge. Intelligence 1996, 22, 227–257. [Google Scholar] [CrossRef]
- Ackerman, P.L.; Kanfer, R. Cognitive, affective, and conative aspects of adult intellect within a typical and maximal performance framework. In Motivation, Emotion, and Cognition; Routledge: London, UK, 2004; pp. 133–156. [Google Scholar]
- Ackerman, P.L.; Heggestad, E.D. Intelligence, personality, and interests: Evidence for overlapping traits. Psychol. Bull. 1997, 121, 219. [Google Scholar] [CrossRef]
- Cronbach, L.J. Essentials of Psychological Testing; Harper: New York, NY, USA, 1949. [Google Scholar]
- Matthews, G.; Zeidner, M.; Roberts, R.D. Emotional Intelligence: Science and Myth; MIT Press: Cambridge, MA, USA, 2004. [Google Scholar]
- Stanovich, K.E. Distinguishing the reflective, algorithmic, and autonomous minds: Is it time for a tri-process theory? In Two Minds: Dual Processes and Beyond; Evans, J., Frankish, K., Eds.; Oxford University Press: Oxford, UK, 2009; pp. 55–88. [Google Scholar]


| Variables | n | Mean | SD | Median | Range (Min, Max) | Skewness | Kurtosis |
|---|---|---|---|---|---|---|---|
| Age | 204 | 10.15 | 1.73 | 10.00 | 8, 14 | 0.58 | −0.61 |
| Executive Function Tasks | |||||||
| Stroop Interference Time | 204 | 36.69 | 14.03 | 34.50 | 9.0, 83.0 | 0.78 | 0.75 |
| TMT Part B-A Time | 204 | 69.02 | 44.33 | 58.90 | −2.0, 256.1 | 1.54 | 3.26 |
| Behavior Ratings of Attention and Impulse Regulation | |||||||
| SWAN Inattention | 191 | 42.21 | 9.26 | 41.00 | 15, 60 | −0.15 | −0.38 |
| SWAN Hyperactivity | 191 | 28.97 | 6.14 | 28.00 | 10, 42 | 0.13 | −0.52 |
| SWAN Impulsivity | 191 | 14.55 | 3.13 | 14.00 | 4, 21 | 0.03 | −0.20 |
| SWAN Total Score | 191 | 85.74 | 17.03 | 83.00 | 29, 121 | −0.02 | −0.25 |
| Group | 1 | 2 | 3 | 4 | 5 | 6 | 7 | |
|---|---|---|---|---|---|---|---|---|
| 1. Age | Total Sample | - | −0.63 * | −0.55 * | 0.03 | 0.06 | −0.03 | −0.04 |
| ADHD Risk | - | −0.66 * | −0.62 * | −0.12 | −0.06 | 0.04 | −0.09 | |
| 2. Stroop Interference Time | Total Sample | - | 0.59 * | −0.18 * | −0.15 * | 0.10 | −0.16 * | |
| ADHD Risk | - | 0.73 * | −0.18 * | −0.06 | −0.14 | −0.17 | ||
| 3. TMT Part B-A Time | Total Sample | - | −0.28 * | −0.21 * | −0.16 * | −0.27 * | ||
| ADHD Risk | - | −0.13 | −0.03 | −0.10 | −0.12 | |||
| 4.SWAN Inattention Ratings | Total Sample | - | 0.77 * | 0.44 * | 0.95 * | |||
| ADHD Risk | - | 0.47 * | 0.30 * | 0.88 * | ||||
| 5. SWAN Hyperactivity Ratings | Total Sample | - | 0.48 * | 0.92 * | ||||
| ADHD Risk | - | 0.55 * | 0.78 * | |||||
| 6. SWAN Impulsivity Ratings | Total Sample | - | 0.58 * | |||||
| ADHD Risk | - | 0.62 * | ||||||
| 7. SWAN Total Score Ratings | Total Sample | - | ||||||
| ADHD Risk | - |
| Group | 1 | 2 | 3 | 4 | 5 | 6 | 7 | |
|---|---|---|---|---|---|---|---|---|
| 1. Age | Total Sample | - | −0.25 * | −0.35 * | −0.06 | 0.01 | 0.02 | −0.02 |
| ADHD Risk | −0.25 | −0.39 * | −0.08 | 0.02 | 0.19 | 0.01 | ||
| 2. Stroop Interference Time | Total Sample | - | 0.43 * | −0.26 * | −0.21 ** | 0.12 | −0.23 * | |
| ADHD Risk | - | 0.62 * | −0.42 * | −0.22 | −0.27 | −0.38 * | ||
| 3. TMT Part B-A | Total Sample | - | −0.33 * | −0.25 * | −0.22 * | −0.32 * | ||
| ADHD Risk | - | −0.32 * | −0.16 | −0.23 | −0.29 * | |||
| 4. SWAN Inattention Ratings | Total Sample | - | 0.76 * | 0.36 * | 0.94 * | |||
| ADHD Risk | - | 0.59 * | 0.46 * | 0.90 * | ||||
| 5. SWAN Hyperactivity Ratings | Total Sample | - | 0.39 * | 0.92 * | ||||
| ADHD Risk | - | 0.66 * | 0.86 * | |||||
| 6. SWAN Impulsivity Ratings | Total Sample | - | 0.51 * | |||||
| ADHD Risk | - | 0.73 * | ||||||
| 7. SWAN Total Score Ratings | Total Sample | - | ||||||
| ADHD Risk | - |
| Group | 1 | 2 | 3 | 4 | 5 | 6 | 7 | |
|---|---|---|---|---|---|---|---|---|
| 1. Age | Total Sample | - | −0.18 * | −0.16 | 0.02 | 0.004 | 0.01 | 0.03 |
| ADHD Risk | - | −0.37 * | −0.38 * | −0.05 | −0.30 | −0.08 | −0.17 | |
| 2. Stroop Interference Time | Total Sample | - | 0.35 * | −0.08 | −0.01 | −0.04 | −0.05 | |
| ADHD Risk | - | 0.59 * | −0.15 | 0.28 | 0.07 | 0.01 | ||
| 3. TMT Part B-A | Total Sample | - | −0.28 * | −0.16 | −0.18 * | −0.24 * | ||
| ADHD Risk | - | −0.05 | 0.25 | 0.19 | 0.10 | |||
| 4. SWAN Inattention Ratings | Total Sample | - | 0.78 * | 0.70 * | 0.95 * | |||
| ADHD Risk | - | 0.32 | 0.09 | 0.87 * | ||||
| 5. SWAN Hyperactivity Ratings | Total Sample | - | 0.81 * | 0.93 * | ||||
| ADHD Risk | - | 0.40 * | 0.71 * | |||||
| 6. SWAN Impulsivity Ratings | Total Sample | - | 0.85 * | |||||
| ADHD Risk | - | 0.45 * | ||||||
| 7. SWAN Total Score Ratings | Total Sample | - | ||||||
| ADHD Risk | - |
| Name of Scale | Description | Age Range | Rater | Normed for Age? | Instructions to Rater |
|---|---|---|---|---|---|
| Strengths and Weaknesses of Attention-Deficit/Hyperactivity Symptoms and Normal Behaviors (SWAN) rating scale [41,42] | In total, 18 DSM-5 items using competency-based or strength-based descriptions rather than symptoms of ADHD. The items measure behavioral characteristics representative of the attention skills of the general population. | 6–18 years | Parent Teacher | No | “Children differ in their abilities to focus attention, control activity, and inhibit impulses. For each item listed below, how does this child compare to other children of the same age? Please select the best rating on your observations over the past month.” |
| Conners (3rd edition) [66] Short and Full-Length Versions DSM-5 Updated Forms | A multi-informant assessment of children and adolescents that takes into account home, social and school settings. It includes 18 DSM-5 symptoms for ADHD. | 6–18 years | Parent Teacher | Yes | “Here, are some things parents might say about their children. Please tell us about your child and what he/she has been like in the PAST MONTH. Read each item carefully, then decide how well it describes your child or how frequently it has happened.” |
| 8–18 years | Self | ||||
| ADHD Rating Scale-5 for Children and Adolescents [67] | Includes 18 DSM-5 item criteria for (ADHD). | Child Version (5–10 years) | Parent Teacher | Yes | “Circle the number that best describes your child’s behavior over the past 6 months.” |
| Adolescent Version (11–17 years) | Parent Teacher | ||||
| NICHQ Vanderbilt ADHD Diagnostic Parent/Teacher Rating Scales (3rd Edition) [68] | Questionnaire used by health care professionals to help diagnose ADHD in children. | 6–12 years | Parent Teacher | No | “Each rating should be considered in the context of what is appropriate for the age of your child. When completing this form, please think about your child’s behaviors in the past 6 months.” |
| SNAP-IV ADHD Symptom Checklist (90-item, 18-item and 26-item scales) [69] | Behavior rating scales as assessment tool for diagnosing attention-deficit hyperactivity disorder (ADHD) based on the DSM-IV. | 6–18 years | Parent Teacher | No | “For each item, check the column which best describes this child/adolescent: not at all, just a little, quite a bit, or very much.” |
| Brown Executive Function/Attention Scale (Brown EF/A Scales) [70] | A set of rating scales designed to evaluate executive functions related to attention-deficit/hyperactivity disorder (ADHD). | Primary/ Preschool Version (3–7 years) | Parent Teacher | Yes | “Item by item, read each symptom listed, and circle the number beneath the words that tell how much you believe that feeling or behavior has been a problem for your child in the past 6 months.” |
| School-age Version (8–12years) | Parent Teacher Self | ||||
| Adolescent Version (13–18 years) | Parent Self | ||||
| Achenbach System of Empirically Based Assessment (CBCL) [71] | Assesses adaptive and maladaptive functioning. Empirically based syndrome scales relevant to ADHD behaviors (attention problems) and DSM-5-oriented scale (attention-deficit/hyperactivity problems). | CBCL (6–18 years) | Parent | Yes | “Below is a list of items that describe children and youths. For each item that describes your child now or within the past 6 months, please circle the 2 if the item is very true or often true of your child. Circle the 1 if the item is somewhat or sometimes true of your child. If the item is not true of your child, circle the 0. Please answer all items as well as you can, even if some do not seem to apply to your child.” |
| TRF (6–18 years) | Teacher | ||||
| YSR (11–18 years) | Self | ||||
| Behavior Assessment System for Children—Third Edition (BASC-3) [72] | A comprehensive assessment of behavior and emotions for children and adolescents. Scales such as hyperactivity and attention problems are relevant behavioral ratings for ADHD. | 2–21 years | Parent (PRS) Teacher (TRS) | Yes | “This form contains phrases that describe how children may act. Please read each phrase and select the response that describes how this child has behaved recently (in the last several months).” |
| 6 years through college age | Self | ||||
| The Strengths and Difficulties Questionnaire (SDQ) [73] | A brief behavioral screening questionnaire for children and adolescents. It exists in several versions to meet the needs of researchers, clinicians and educationalists. All versions of the SDQ ask about 25 attributes, some positive and others negative. | Preschool 2–4 years | Parent/ Teacher | No | “For each item, please mark the box for Not True, Somewhat True or Certainly True. It would help us if you answered all items as best you can even if you are not absolutely certain or the item seems daft! Please give your answers on the basis of the child’s behavior over the last six months.” |
| School-age 4–17 years | Parent Teacher | ||||
| 11–17 years | Self | ||||
| Clinical Assessment of Attention Deficit—Child (CAT-C) [74] | A questionnaire that provides a comprehensive assessment of attention deficit disorder with and without hyperactivity. Linkage to the DSM-IV diagnostic criteria, with comprehensive content coverage both within and across scales/clusters assists in rendering a differential diagnosis. | 8–18 years | Parent Teacher Self | Yes | “Please read these instructions before completing this Rating Form. Mark all of your answers directly on this form. This booklet has sentences that may describe your CHILD lately. Please read each sentence carefully and select the response that best describes how much you agree or disagree with each sentence. Then, circle the number that matches your answer. Circle one response for each sentence.” |
| Behavior Rating Inventory of Executive Function (BRIEF-2), Second Edition [75] Screening and Full-Length Versions | The BRIEF-2 is a rating scale that assesses executive function in the children and adolescents. It is designed to assist school psychologists as they assess, plan interventions for and monitor students with executive dysfunction. | 5–18 years | Parent Teacher | Yes | “Below is a list of statements that describe children. We would like to know if your child has had problems with these behaviors over the past 6 months. Please answer all the items the best that you can. Please DO NOT SKIP ANY ITEMS. Think about your child as you read each statement and circle.” |
| 11–18 years | Self | ||||
| The Childhood Executive Functioning Inventory (CHEXI) [76] Teenage Executive Functioning Inventory (TEXI) [77] | A rating of instruments for parents and teachers that was developed in 2008 for measuring executive function. | 4–12 years | Parent or Teacher | No | “Below, you will find a number of statements. Please read each statement carefully and thereafter indicate how well that statement is true for the child. You indicate your response by circling one of the numbers (from 1 to 5) after each statement.” |
| 13–19 years | Parent/ Teacher Self | ||||
| Barkley Deficits in Executive Functioning Scale: Children and Adolescents (BDEFS-CA) [78] | The Appendix contains long forms (10–15 min) and short forms (3–5 min) for parents to complete and profiles. A short clinical interview form based on the short-form rating scale, for use in unusual circumstances where a parent is unable to complete a rating scale. It is an empirically based tool for evaluating clinically significant dimensions of child and adolescent executive functioning (EF). | 6–17 years | Parent | Yes | “How often does your child experience each of these problems? Please circle the number next to each item that best describes his/her behavior DURING THE PAST 6 MONTHS. If your child is currently taking medication for any psychiatric or psychological disorder, please rate his/her behavior based on how he/she acts while OFF the medication.” |
| Delis Rating of Executive Functions (D-REF) [79] | A behavior rating scale designed to assess behaviors that may reflect difficulties with executive functioning. | 5–18 years | Parent Teacher | Yes | “The following statements describe behaviors and feelings of children and adolescents. Please read each statement carefully and decide which frequency applies to your child within the past 6 months. Remember to give your own opinion of the child’s behavior and select the frequency that you feel best applies. If you change your mind, mark through the answer you want to change and circle the new one: Circle S/N for Seldom/Never if the behavior occurs less than once every 3 months or never. Circle M for Monthly if the behavior occurs at least once every 1–3 months (and less than once a week). Circle W for Weekly if the behavior occurs at least once a week (and less than once a day). Circle D for Daily if the behavior occurs at least once a day” |
| 11–18 years | Self |
Publisher’s Note: MDPI stays neutral with regard to jurisdictional claims in published maps and institutional affiliations. |
© 2022 by the authors. Licensee MDPI, Basel, Switzerland. This article is an open access article distributed under the terms and conditions of the Creative Commons Attribution (CC BY) license (https://creativecommons.org/licenses/by/4.0/).
Share and Cite
Lyon, R.E.; Rizeq, J.; Flora, D.B.; Martinussen, R.; Andrade, B.F.; Toplak, M.E. Age-Related Variance in Performance versus Ratings of Attention and Impulse Regulation in Children: Implications for the Assessment of ADHD. Brain Sci. 2022, 12, 1033. https://doi.org/10.3390/brainsci12081033
Lyon RE, Rizeq J, Flora DB, Martinussen R, Andrade BF, Toplak ME. Age-Related Variance in Performance versus Ratings of Attention and Impulse Regulation in Children: Implications for the Assessment of ADHD. Brain Sciences. 2022; 12(8):1033. https://doi.org/10.3390/brainsci12081033
Chicago/Turabian StyleLyon, Rachael E., Jala Rizeq, David B. Flora, Rhonda Martinussen, Brendan F. Andrade, and Maggie E. Toplak. 2022. "Age-Related Variance in Performance versus Ratings of Attention and Impulse Regulation in Children: Implications for the Assessment of ADHD" Brain Sciences 12, no. 8: 1033. https://doi.org/10.3390/brainsci12081033
APA StyleLyon, R. E., Rizeq, J., Flora, D. B., Martinussen, R., Andrade, B. F., & Toplak, M. E. (2022). Age-Related Variance in Performance versus Ratings of Attention and Impulse Regulation in Children: Implications for the Assessment of ADHD. Brain Sciences, 12(8), 1033. https://doi.org/10.3390/brainsci12081033