
Immune Landscape in PTEN-Related Glioma Microenvironment: A Bioinformatic Analysis


Abstract
1. Introduction
2. Materials and Methods
2.1. Data Acquisition
2.2. Statistical Bioinformatics Analysis
2.3. Estimation of Immune Infiltrating Cells
3. Results
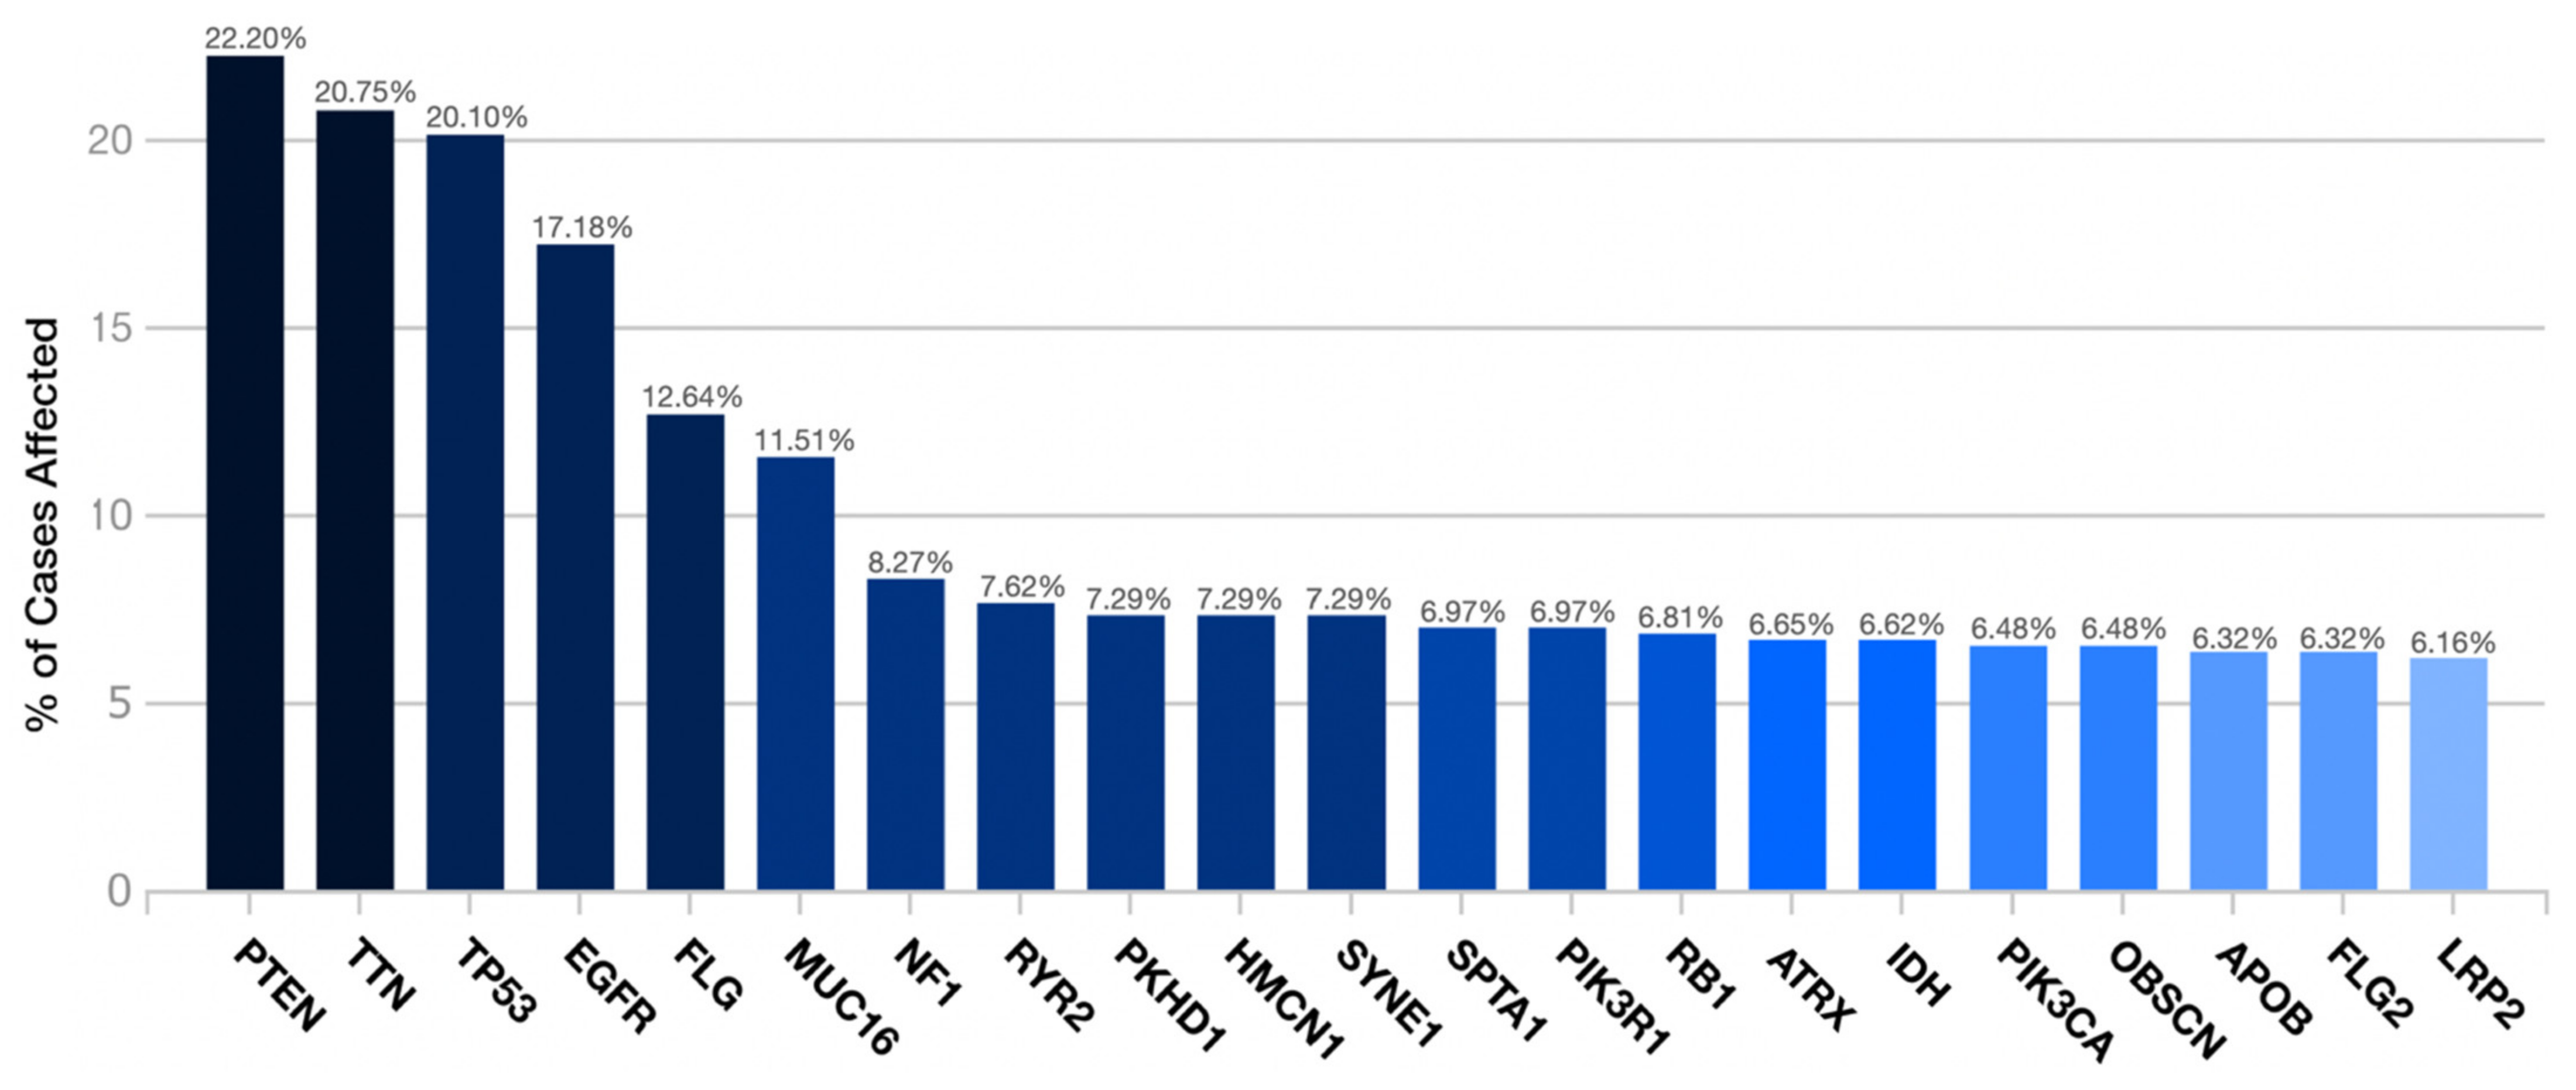
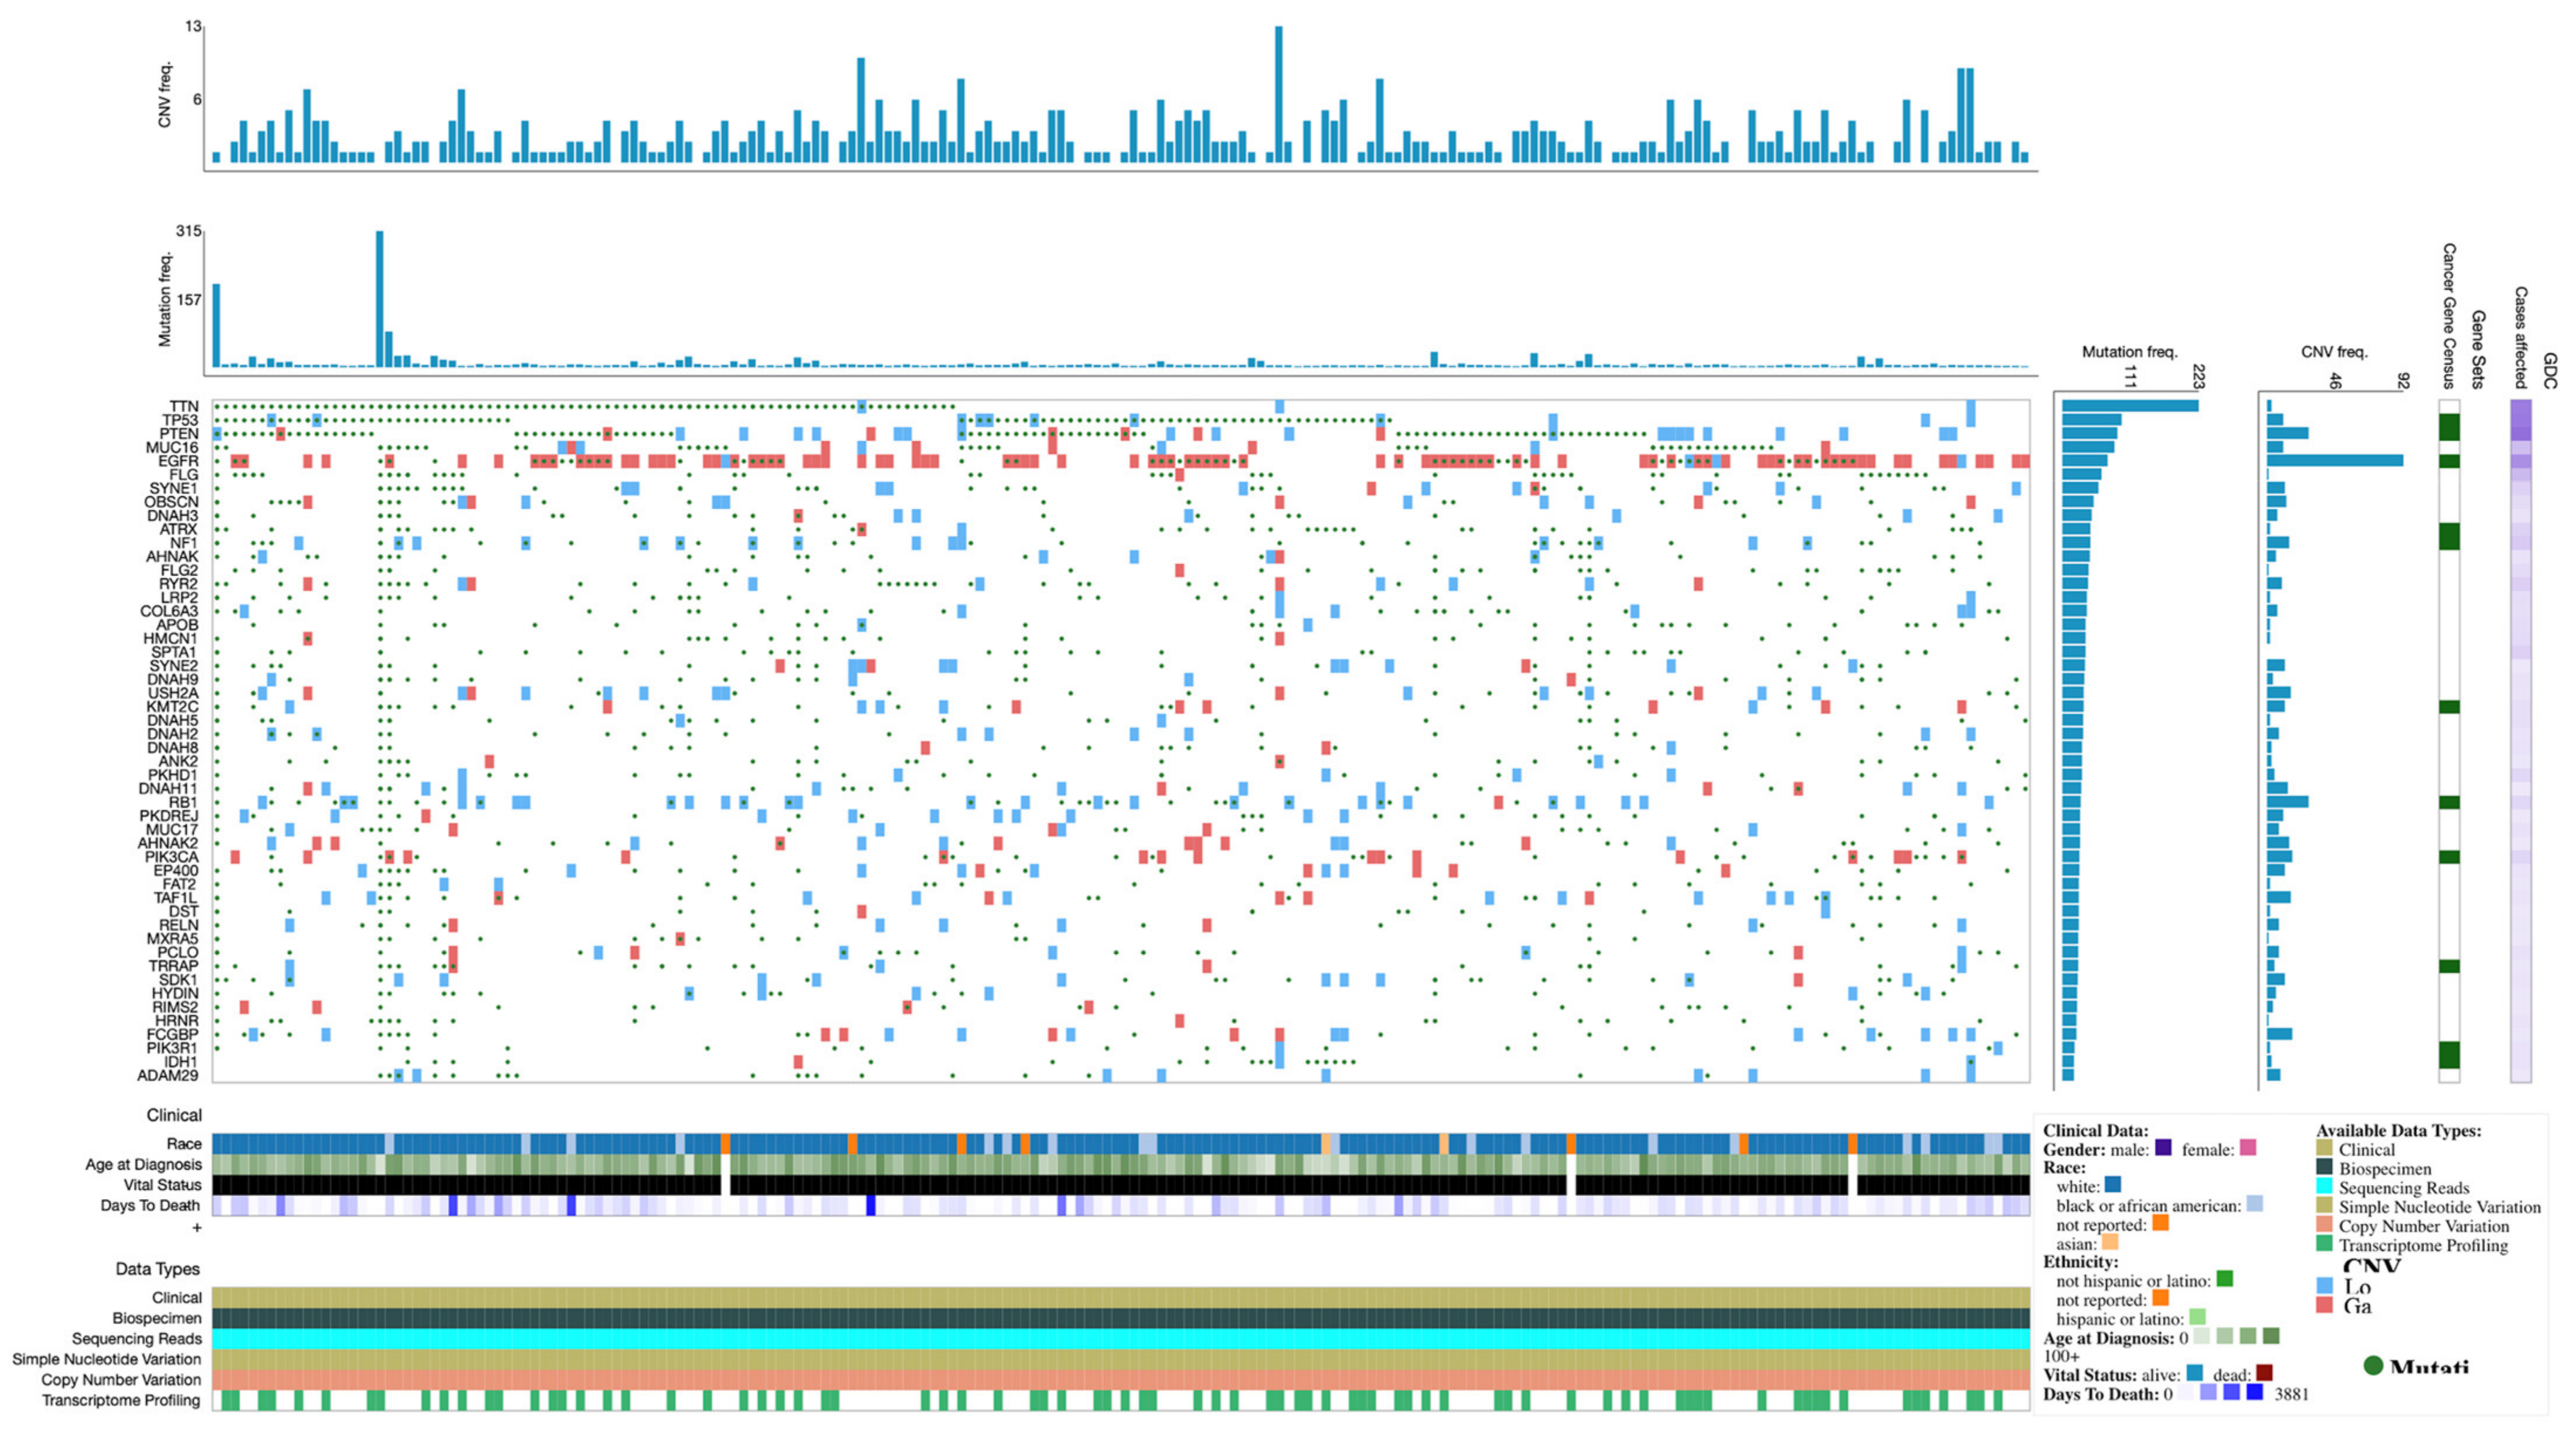
3.1. Demographics and Gene Mutation Profiles
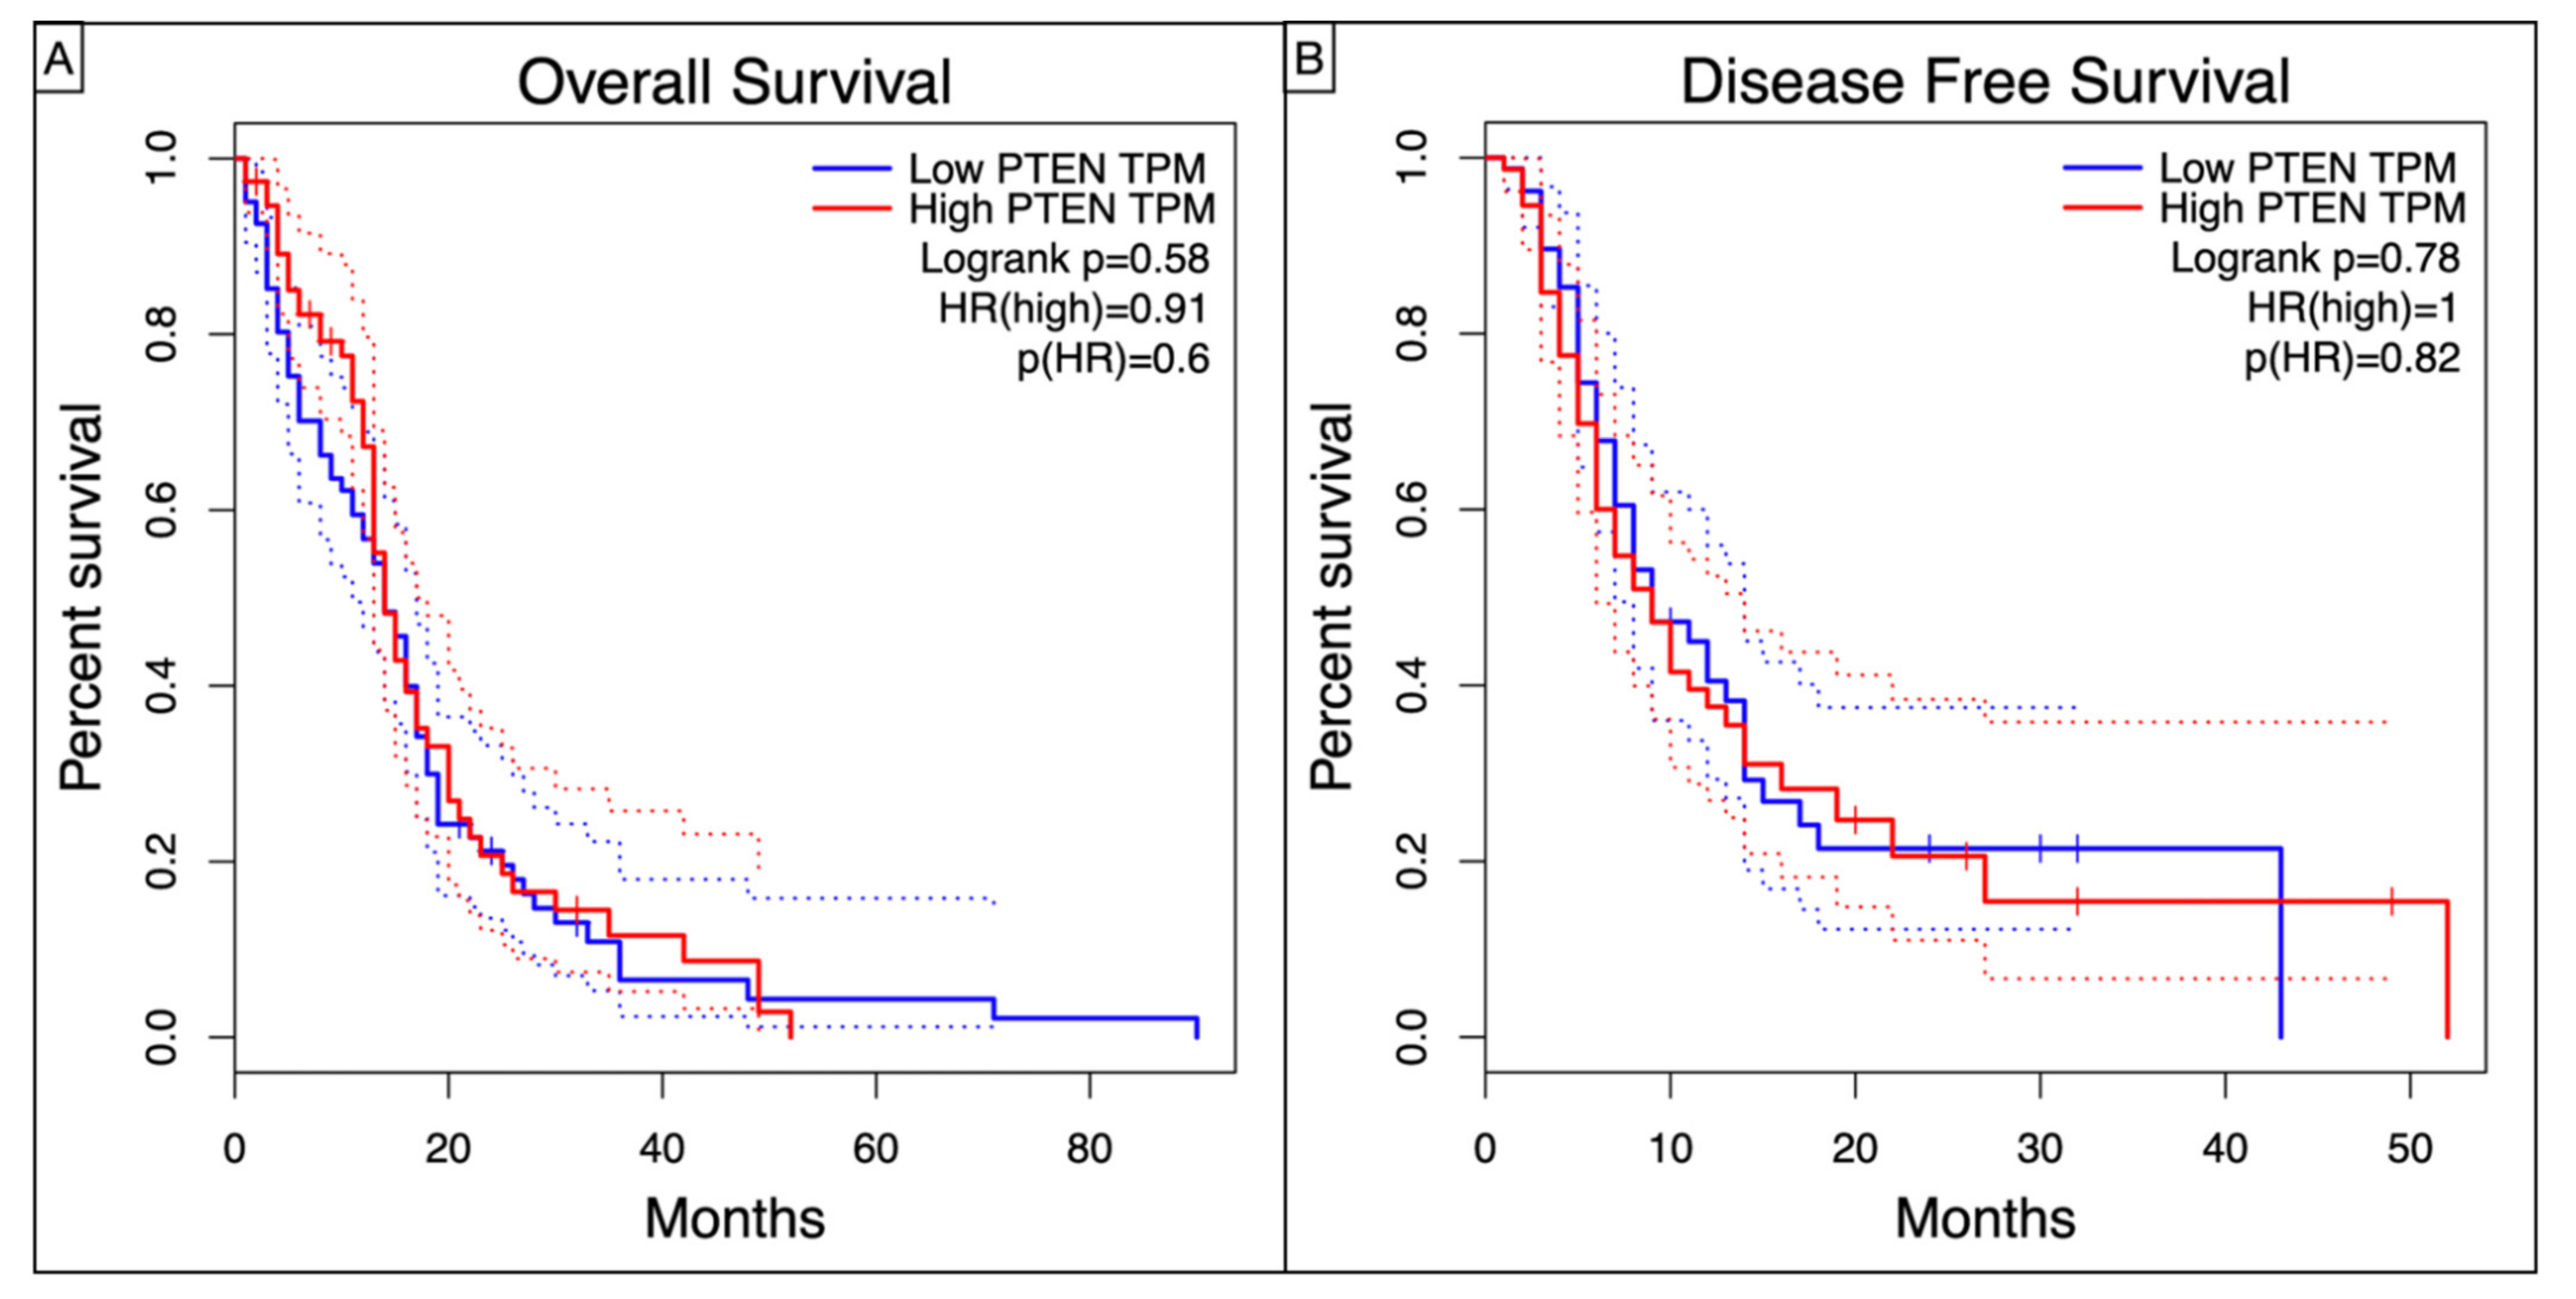
3.2. Survival Analysis
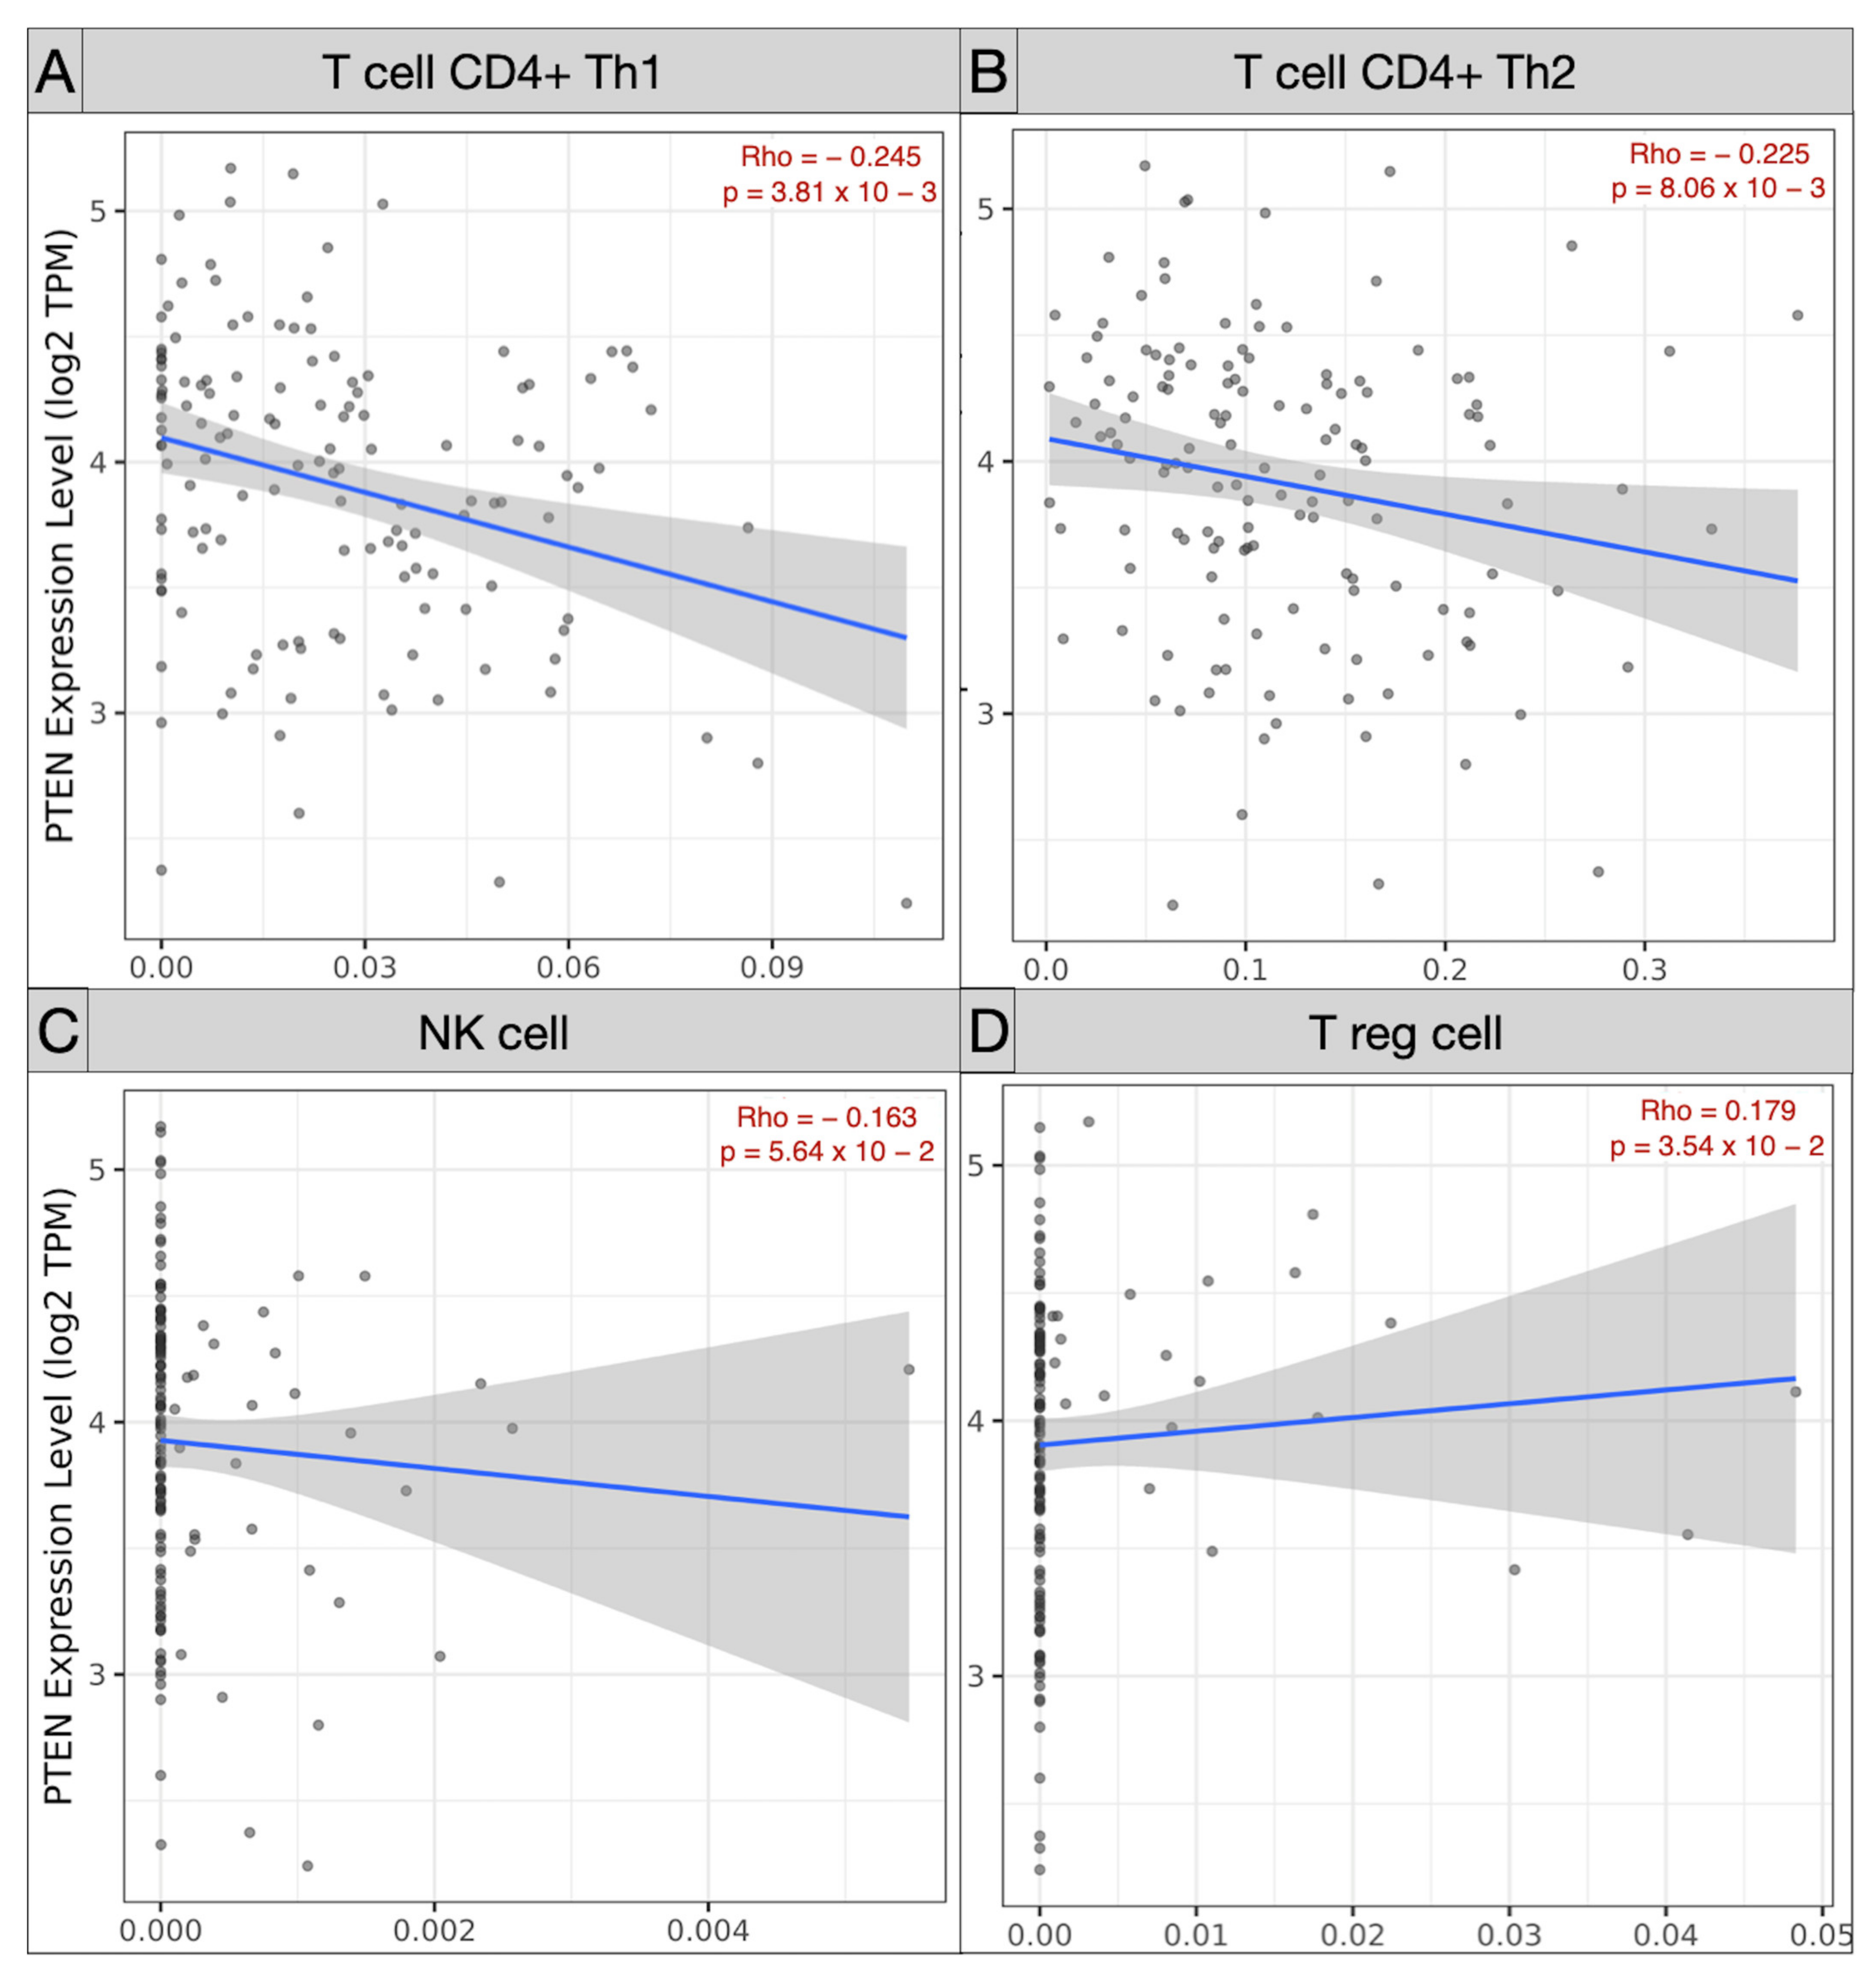
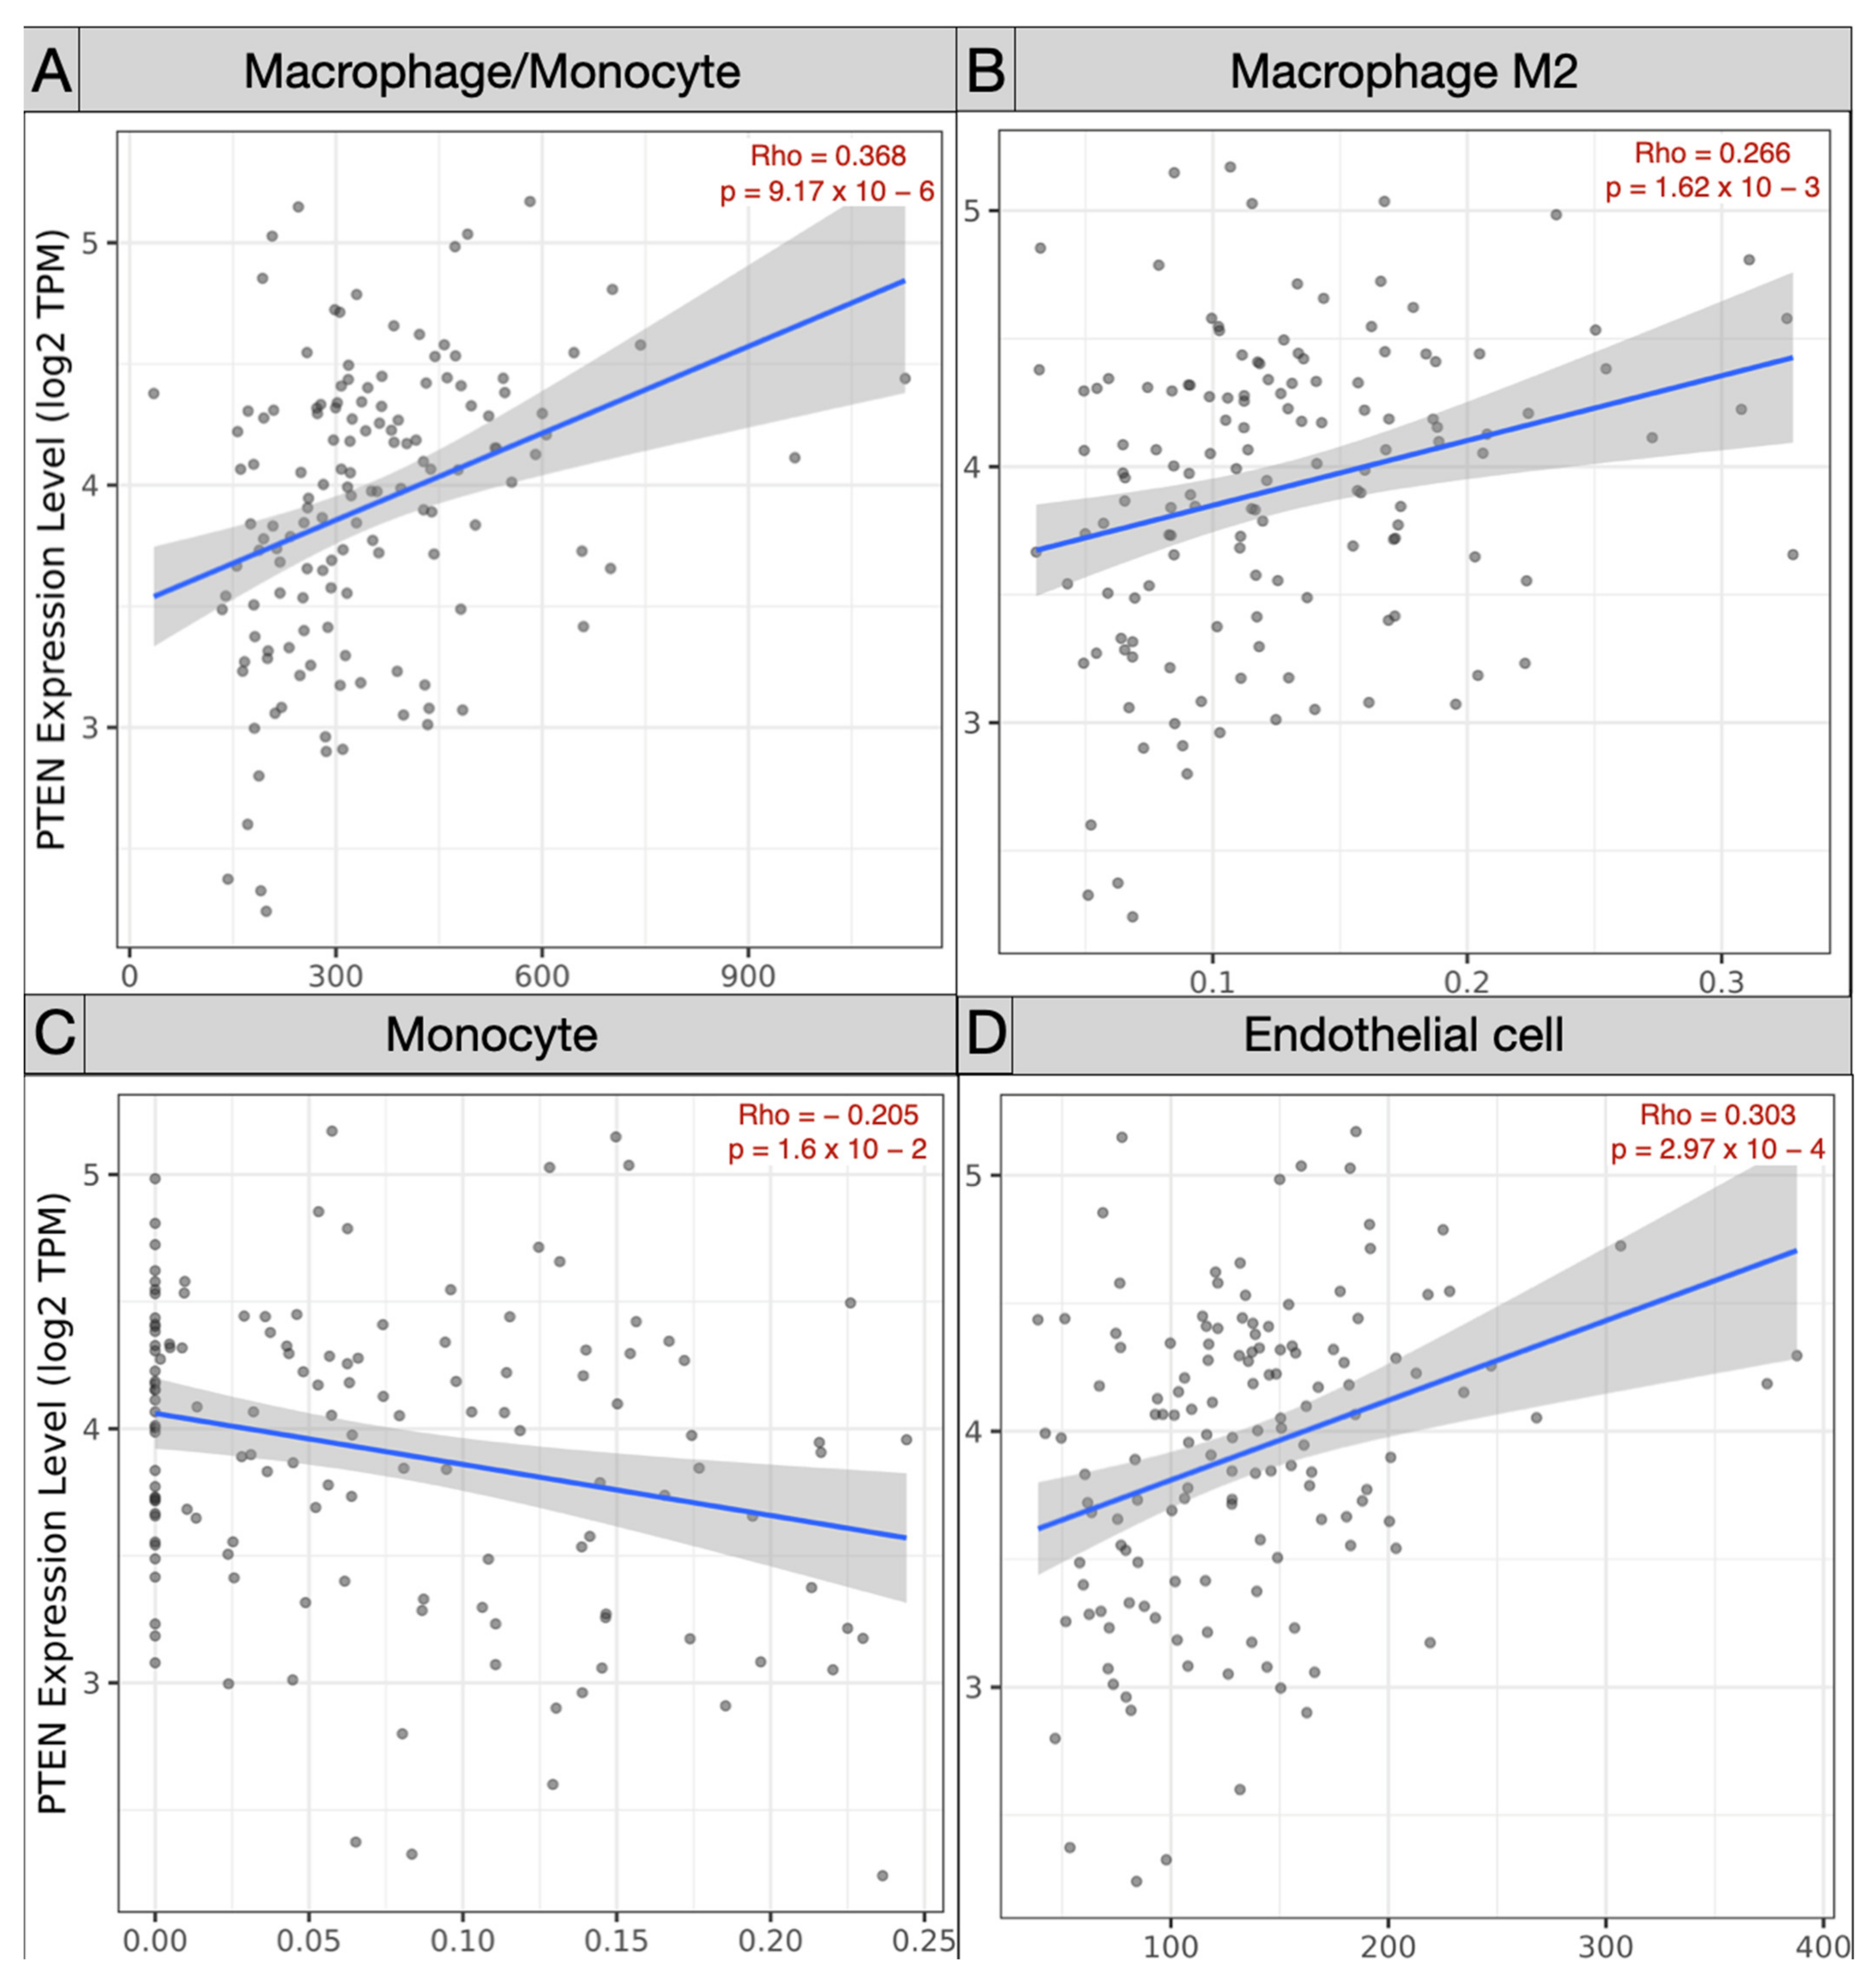
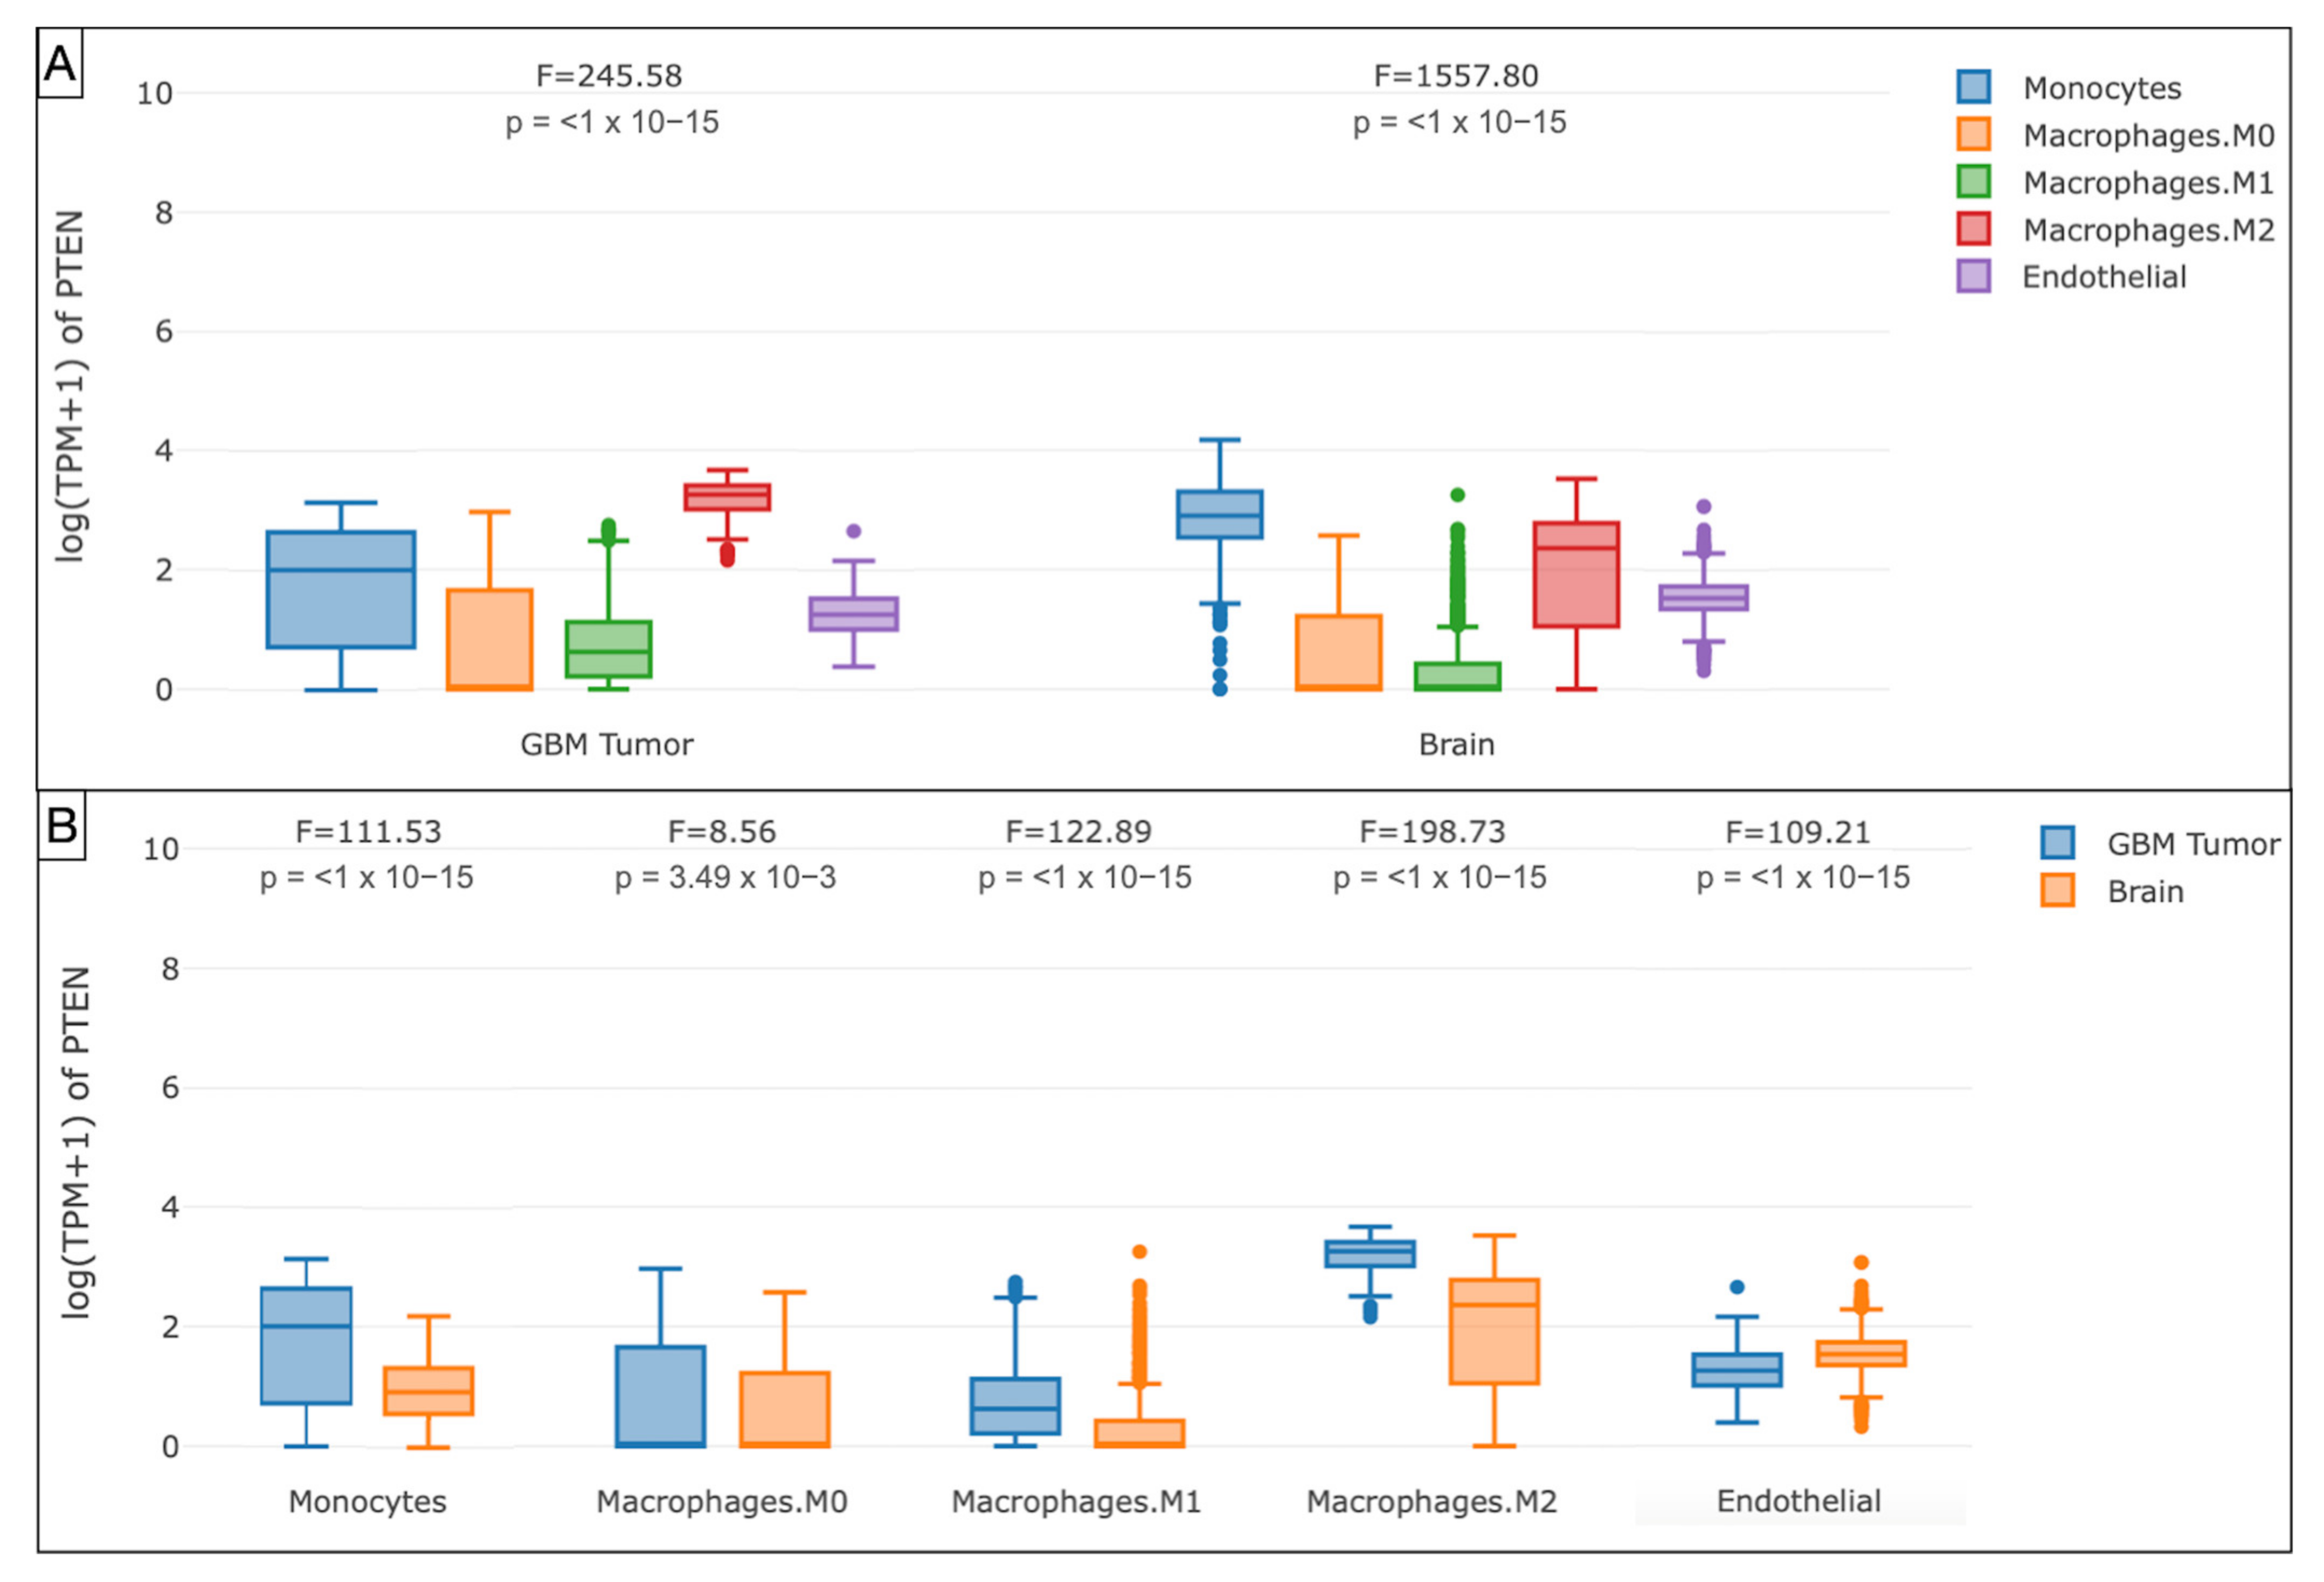
3.3. Immune Landscape in PTEN-Related Glioma Microenvironment
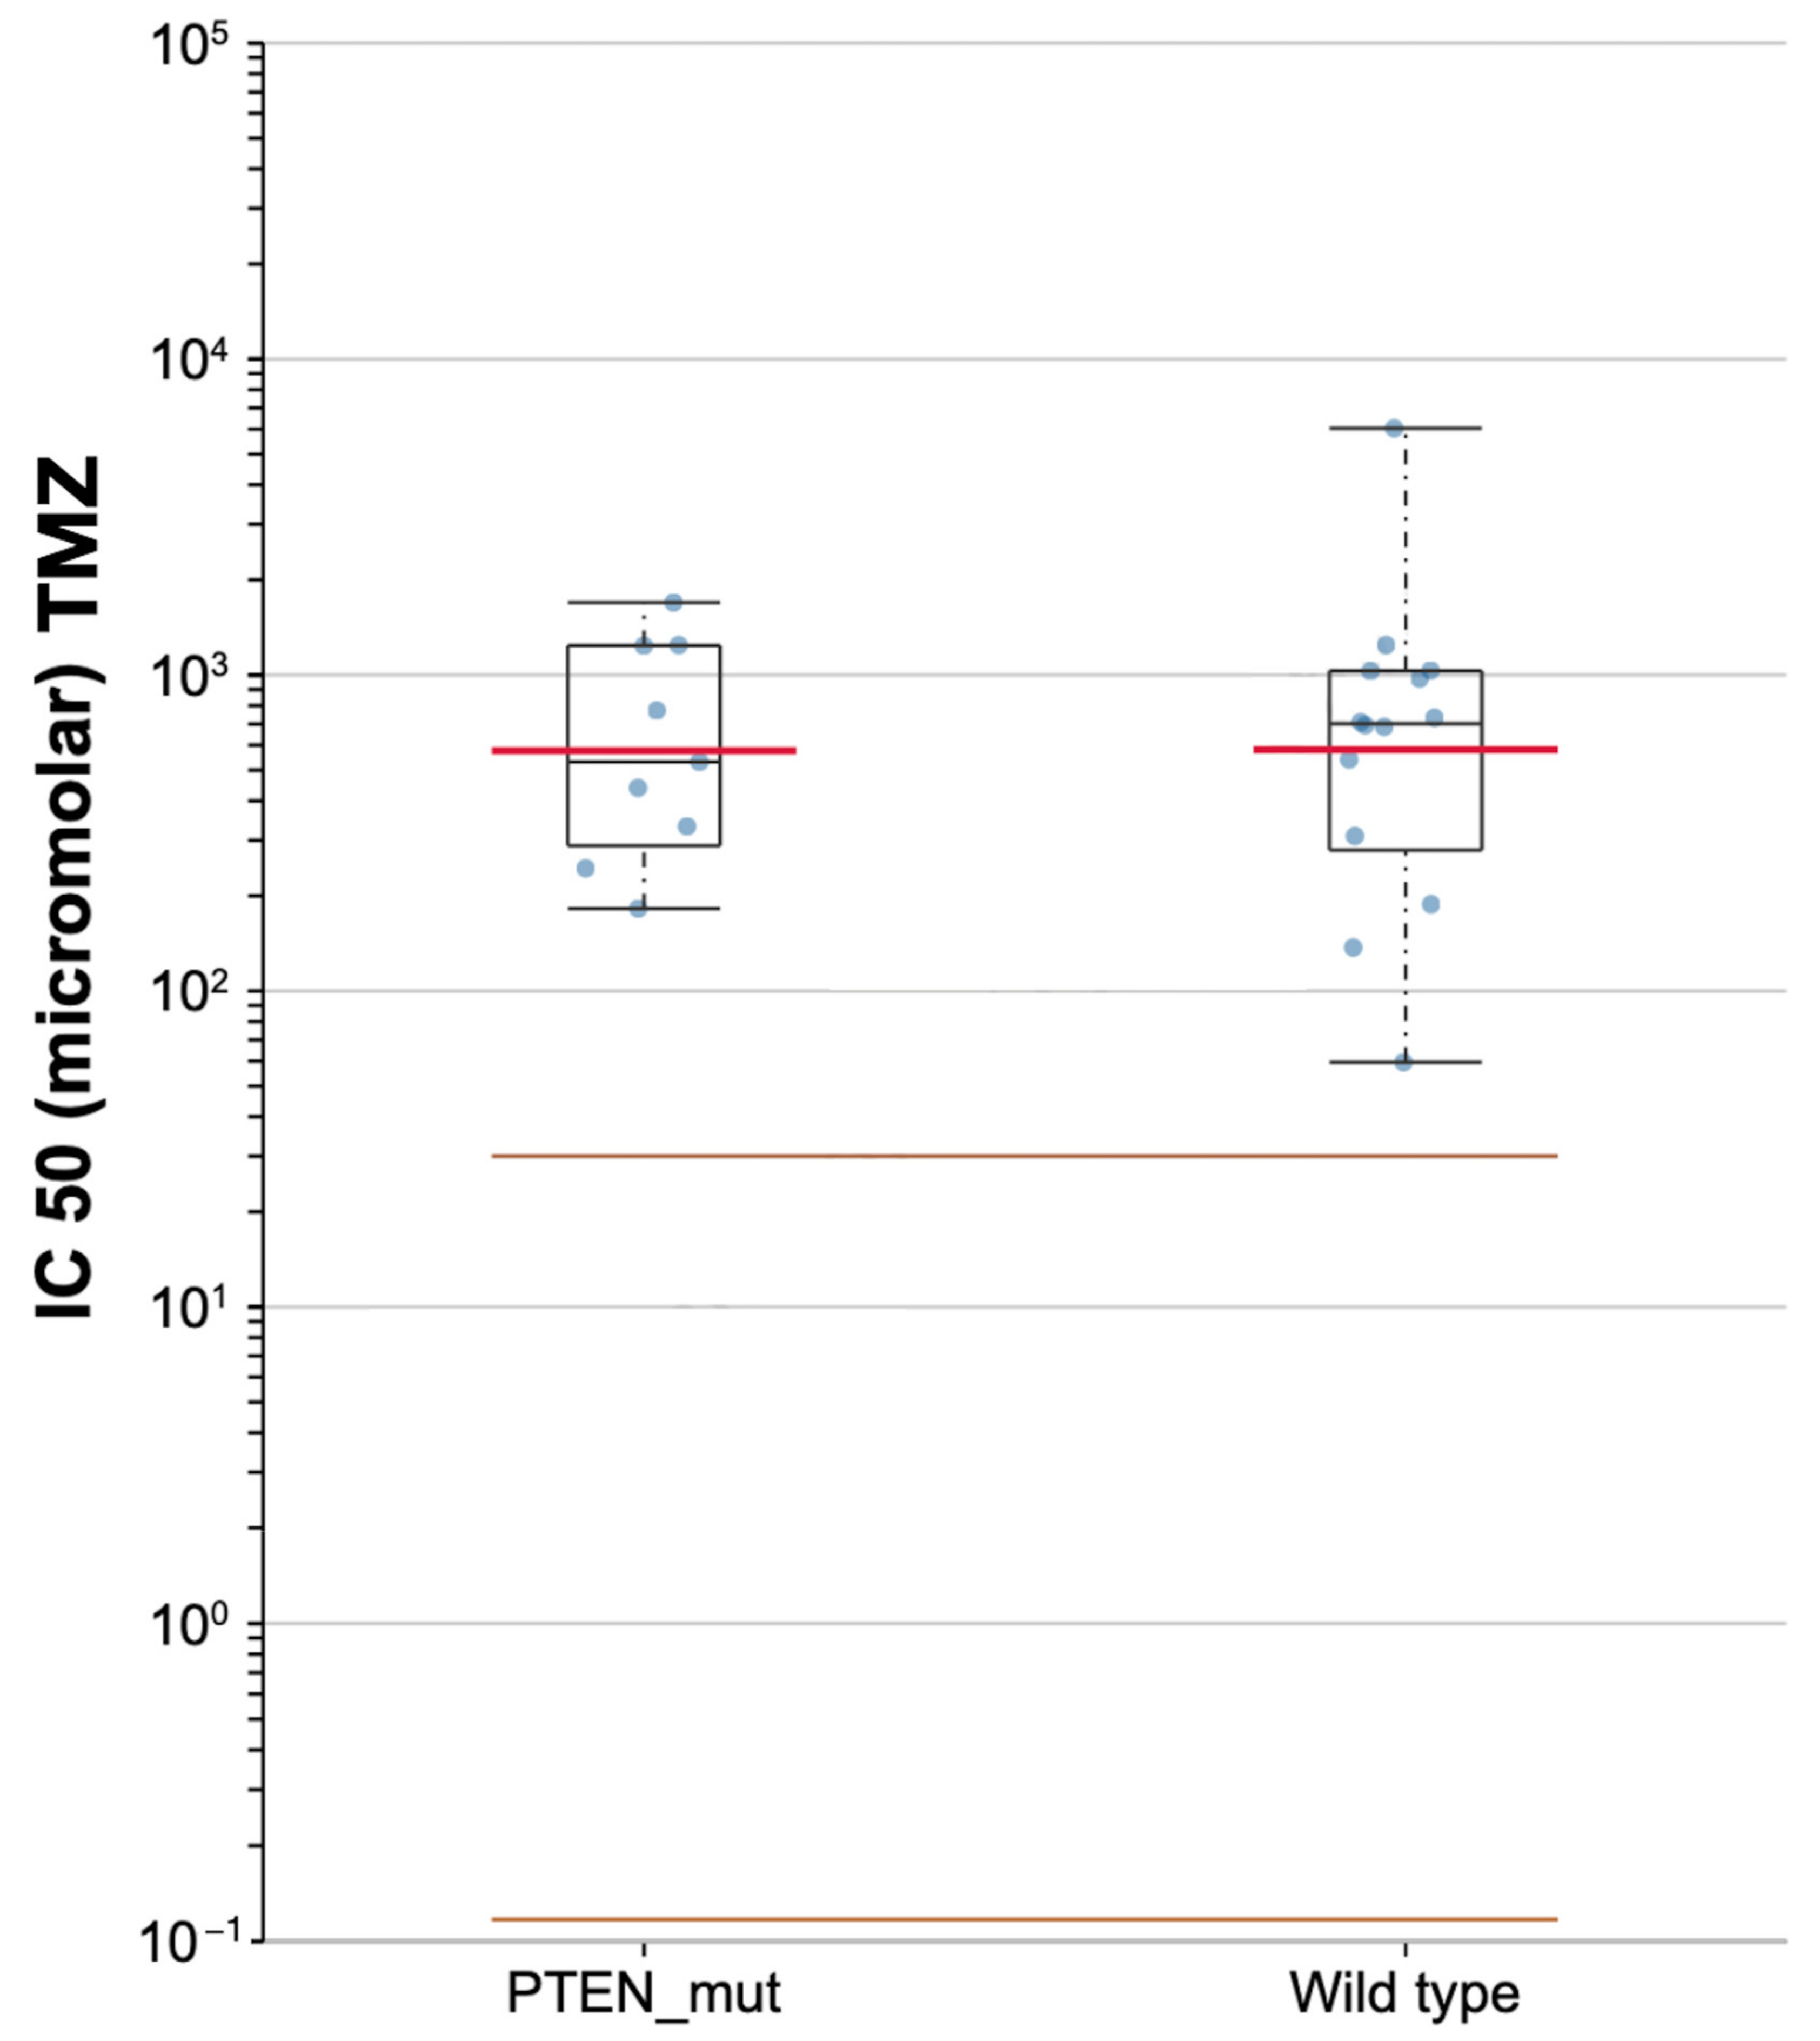
3.4. Prediction of Chemotherapeutic Response
4. Discussion
Limitations of the Study
5. Conclusions
Author Contributions
Funding
Institutional Review Board Statement
Data Availability Statement
Conflicts of Interest
References
- Ostrom, Q.T.; Gittleman, H.; Liao, P.; Rouse, C.; Chen, Y.; Dowling, J.; Wolinsky, Y.; Kruchko, C.; Barnholtz-Sloan, J. CBTRUS statistical report: Primary brain and central nervous system tumors diagnosed in the United States in 2007–2011. Neuro Oncol. 2014, 16 (Suppl. S4), iv1–iv63. [Google Scholar] [CrossRef] [PubMed]
- Ferlay, J.; Steliarova-Foucher, E.; Lortet-Tieulent, J.; Rosso, S.; Coebergh, J.W.; Comber, H.; Forman, D.; Bray, F. Cancer incidence and mortality patterns in Europe: Estimates for 40 countries in 2012. Eur. J. Cancer 2013, 49, 1374–1403. [Google Scholar] [CrossRef] [PubMed]
- Soerjomataram, I.; Lortet-Tieulent, J.; Parkin, D.M.; Ferlay, J.; Mathers, C.; Forman, D.; Bray, F. Global burden of cancer in 2008: A systematic analysis of disability-adjusted life-years in 12 world regions. Lancet 2012, 380, 1840–1850. [Google Scholar] [CrossRef]
- Ladomersky, E.; Genet, M.; Zhai, L.; Gritsina, G.; Lauing, K.L.; Lulla, R.R.; Fangusaro, J.; Lenzen, A.; Kumthekar, P.; Raizer, J.J.; et al. Improving vaccine efficacy against malignant glioma. Oncoimmunology 2016, 5, e1196311. [Google Scholar] [CrossRef]
- Ostrom, Q.T.; Gittleman, H.; Stetson, L.; Virk, S.M.; Barnholtz-Sloan, J.S. Epidemiology of gliomas. Cancer Treat. Res. 2015, 163, 1–14. [Google Scholar] [CrossRef]
- Wrensch, M.; Minn, Y.; Chew, T.; Bondy, M.; Berger, M.S. Epidemiology of primary brain tumors: Current concepts and review of the literature. Neuro Oncol. 2002, 4, 278–299. [Google Scholar] [CrossRef]
- Leenstra, S.; Oskam, N.T.; Bijleveld, E.H.; Bosch, D.A.; Troost, D.; Hulsebos, T.J. Genetic sub-types of human malignant astrocytoma correlate with survival. Int. J. Cancer 1998, 79, 159–165. [Google Scholar] [CrossRef]
- Attarian, F.; Taghizadeh-Hesary, F.; Fanipakdel, A.; Javadinia, S.A.; Porouhan, P.; PeyroShabany, B.; Fazilat-Panah, D. A Systematic Review and Meta-Analysis on the Number of Adjuvant Temozolomide Cycles in Newly Diagnosed Glioblastoma. Front. Oncol. 2021, 11, 1–6. [Google Scholar] [CrossRef]
- Johnson, D.R.; O’Neill, B.P. Glioblastoma survival in the United States before and during the temozolomide era. J. Neurooncol. 2012, 107, 359–364. [Google Scholar] [CrossRef]
- Eagan, R.T.; Scott, M. Evaluation of prognostic factors in chemotherapy of recurrent brain tumors. J. Clin. Oncol. 1983, 1, 38–44. [Google Scholar] [CrossRef]
- Wen, P.Y.; Kesari, S. Malignant gliomas in adults. N. Engl. J. Med. 2008, 359, 492–507. [Google Scholar] [CrossRef]
- Perry, J.R.; Laperriere, N.; O’Callaghan, C.J.; Brandes, A.A.; Menten, J.; Phillips, C.; Fay, M.; Nishikawa, R.; Cairncross, J.G.; Roa, W.; et al. Short-Course Radiation plus Temozolomide in Elderly Patients with Glioblastoma. N. Engl. J. Med. 2017, 376, 1027–1037. [Google Scholar] [CrossRef]
- Cancer Genome Atlas (TCGA) Research Network. Comprehensive genomic characterization defines human glioblastoma genes and core pathways. Nature 2008, 455, 1061–1068. [Google Scholar] [CrossRef]
- Parsons, D.W.; Jones, S.; Zhang, X.; Lin, J.C.; Leary, R.J.; Angenendt, P.; Mankoo, P.; Carter, H.; Siu, I.M.; Gallia, G.L.; et al. An integrated genomic analysis of human glioblastoma multiforme. Science 2008, 321, 1807–1812. [Google Scholar] [CrossRef]
- Verhaak, R.G.; Hoadley, K.A.; Purdom, E.; Wang, V.; Qi, Y.; Wilkerson, M.D.; Miller, C.R.; Ding, L.; Golub, T.; Mesirov, J.P.; et al. Integrated genomic analysis identifies clinically relevant subtypes of glioblastoma characterized by abnormalities in PDGFRA, IDH1, EGFR, and NF1. Cancer Cell 2010, 17, 98–110. [Google Scholar] [CrossRef]
- Palumbo, P.; Lombardi, F.; Siragusa, G.; Dehcordi, S.R.; Luzzi, S.; Cimini, A.; Cifone, M.G.; Cinque, B. Involvement of NOS2 Activity on Human Glioma Cell Growth, Clonogenic Potential, and Neurosphere Generation. Int. J. Mol. Sci. 2018, 19, 2801. [Google Scholar] [CrossRef]
- Palumbo, P.; Lombardi, F.; Augello, F.R.; Giusti, I.; Luzzi, S.; Dolo, V.; Cifone, M.G.; Cinque, B. NOS2 inhibitor 1400W Induces Autophagic Flux and Influences Extracellular Vesicle Profile in Human Glioblastoma U87MG Cell Line. Int. J. Mol. Sci. 2019, 20, 3010. [Google Scholar] [CrossRef]
- Louis, D.N.; Perry, A.; Wesseling, P.; Brat, D.J.; Cree, I.A.; Figarella-Branger, D.; Hawkins, C.; Ng, H.K.; Pfister, S.M.; Reifenberger, G.; et al. The 2021 WHO Classification of Tumors of the Central Nervous System: A summary. Neuro Oncol. 2021, 23, 1231–1251. [Google Scholar] [CrossRef]
- James, C.D.; Galanis, E.; Frederick, L.; Kimmel, D.W.; Cunningham, J.M.; Atherton-Skaff, P.J.; O’Fallon, J.R.; Jenkins, R.B.; Buckner, J.C.; Hunter, S.B.; et al. Tumor suppressor gene alterations in malignant gliomas: Histopathological associations and prognostic evaluation. Int. J. Oncol. 1999, 15, 547–553. [Google Scholar] [CrossRef]
- Rasheed, B.K.; Stenzel, T.T.; McLendon, R.E.; Parsons, R.; Friedman, A.H.; Friedman, H.S.; Bigner, D.D.; Bigner, S.H. PTEN gene mutations are seen in high-grade but not in low-grade gliomas. Cancer Res. 1997, 57, 4187–4190. [Google Scholar]
- Yang, Y.; Shao, N.; Luo, G.; Li, L.; Zheng, L.; Nilsson-Ehle, P.; Xu, N. Mutations of PTEN gene in gliomas correlate to tumor differentiation and short-term survival rate. Anticancer Res. 2010, 30, 981–985. [Google Scholar] [PubMed]
- Javadinia, S.A.; Shahidsales, S.; Fanipakdel, A.; Joudi-Mashhad, M.; Mehramiz, M.; Talebian, S.; Maftouh, M.; Mardani, R.; Hassanian, S.M.; Khazaei, M.; et al. Therapeutic potential of targeting the Wnt/β-catenin pathway in the treatment of pancreatic cancer. J. Cell. Biochem. 2018, 120, 6833–6840. [Google Scholar] [CrossRef] [PubMed]
- Sun, H.; Lesche, R.; Li, D.M.; Liliental, J.; Zhang, H.; Gao, J.; Gavrilova, N.; Mueller, B.; Liu, X.; Wu, H. PTEN modulates cell cycle progression and cell survival by regulating phosphatidylinositol 3,4,5,-trisphosphate and Akt/protein kinase B signaling pathway. Proc. Natl. Acad. Sci. USA 1999, 96, 6199–6204. [Google Scholar] [CrossRef] [PubMed]
- Li, J.; Yen, C.; Liaw, D.; Podsypanina, K.; Bose, S.; Wang, S.I.; Puc, J.; Miliaresis, C.; Rodgers, L.; McCombie, R.; et al. PTEN, a putative protein tyrosine phosphatase gene mutated in human brain, breast, and prostate cancer. Science 1997, 275, 1943–1947. [Google Scholar] [CrossRef]
- Cantley, L.C. The phosphoinositide 3-kinase pathway. Science 2002, 296, 1655–1657. [Google Scholar] [CrossRef]
- Javadinia, S.A.; Shahidsales, S.; Fanipakdel, A.; Mostafapour, A.; Joudi-Mashhad, M.; Ferns, G.A.; Avan, A. The Esophageal Cancer and the PI3K/AKT/mTOR Signaling Regulatory microRNAs: A Novel Marker for Prognosis, and a Possible Target for Immunotherapy. Curr. Pharm. Des. 2018, 24, 4646–4651. [Google Scholar] [CrossRef]
- Ming, M.; He, Y.Y. PTEN in DNA damage repair. Cancer Lett. 2012, 319, 125–129. [Google Scholar] [CrossRef]
- Yang, Y.; Shao, N.; Luo, G.; Li, L.; Nilsson-Ehle, P.; Xu, N. Relationship between PTEN gene expression and differentiation of human glioma. Scand. J. Clin. Lab. Investig. 2006, 66, 469–475. [Google Scholar] [CrossRef]
- Kitange, G.J.; Templeton, K.L.; Jenkins, R.B. Recent advances in the molecular genetics of primary gliomas. Curr. Opin. Oncol. 2003, 15, 197–203. [Google Scholar] [CrossRef]
- Qin, Z.; Zhang, X.; Chen, Z.; Liu, N. Establishment and validation of an immune-based prognostic score model in glioblastoma. Int. Immunopharmacol. 2020, 85, 106636. [Google Scholar] [CrossRef]
- Gieryng, A.; Pszczolkowska, D.; Walentynowicz, K.A.; Rajan, W.D.; Kaminska, B. Immune microenvironment of gliomas. Lab. Investig. 2017, 97, 498–518. [Google Scholar] [CrossRef]
- Wilcox, J.A.; Ramakrishna, R.; Magge, R. Immunotherapy in Glioblastoma. World Neurosurg. 2018, 116, 518–528. [Google Scholar] [CrossRef]
- Grabowski, M.M.; Sankey, E.W.; Ryan, K.J.; Chongsathidkiet, P.; Lorrey, S.J.; Wilkinson, D.S.; Fecci, P.E. Immune suppression in gliomas. J. Neurooncol. 2021, 151, 3–12. [Google Scholar] [CrossRef]
- Hanaei, S.; Afshari, K.; Hirbod-Mobarakeh, A.; Mohajer, B.; Amir Dastmalchi, D.; Rezaei, N. Therapeutic efficacy of specific immunotherapy for glioma: A systematic review and meta-analysis. Rev. Neurosci. 2018, 29, 443–461. [Google Scholar] [CrossRef]
- Giotta Lucifero, A.; Luzzi, S.; Brambilla, I.; Trabatti, C.; Mosconi, M.; Savasta, S.; Foiadelli, T. Innovative therapies for malignant brain tumors: The road to a tailored cure. Acta Biomed. 2020, 91, 5–17. [Google Scholar] [CrossRef]
- Luzzi, S.; Crovace, A.M.; Del Maestro, M.; Giotta Lucifero, A.; Elbabaa, S.K.; Cinque, B.; Palumbo, P.; Lombardi, F.; Cimini, A.; Cifone, M.G.; et al. The cell-based approach in neurosurgery: Ongoing trends and future perspectives. Heliyon 2019, 5, e02818. [Google Scholar] [CrossRef]
- Giotta Lucifero, A.; Luzzi, S. Against the Resilience of High-Grade Gliomas: The Immunotherapeutic Approach (Part I). Brain Sci. 2021, 11, 386. [Google Scholar] [CrossRef]
- Giotta Lucifero, A.; Luzzi, S. Against the Resilience of High-Grade Gliomas: Gene Therapies (Part II). Brain Sci. 2021, 11, 976. [Google Scholar] [CrossRef]
- Luzzi, S.; Giotta Lucifero, A.; Brambilla, I.; Trabatti, C.; Mosconi, M.; Savasta, S.; Foiadelli, T. The impact of stem cells in neuro-oncology: Applications, evidence, limitations and challenges. Acta Biomed. 2020, 91, 51–60. [Google Scholar] [CrossRef]
- Colaprico, A.; Silva, T.C.; Olsen, C.; Garofano, L.; Cava, C.; Garolini, D.; Sabedot, T.S.; Malta, T.M.; Pagnotta, S.M.; Castiglioni, I.; et al. TCGAbiolinks: An R/Bioconductor package for integrative analysis of TCGA data. Nucleic Acids Res. 2016, 44, e71. [Google Scholar] [CrossRef]
- Yang, W.; Soares, J.; Greninger, P.; Edelman, E.J.; Lightfoot, H.; Forbes, S.; Bindal, N.; Beare, D.; Smith, J.A.; Thompson, I.R.; et al. Genomics of Drug Sensitivity in Cancer (GDSC): A resource for therapeutic biomarker discovery in cancer cells. Nucleic Acids Res. 2012, 41, D955–D961. [Google Scholar] [CrossRef] [PubMed]
- Ortega-Molina, A.; Serrano, M. PTEN in cancer, metabolism, and aging. Trends Endocrinol. Metab. 2013, 24, 184–189. [Google Scholar] [CrossRef] [PubMed]
- Smith, J.S.; Tachibana, I.; Passe, S.M.; Huntley, B.K.; Borell, T.J.; Iturria, N.; O’Fallon, J.R.; Schaefer, P.L.; Scheithauer, B.W.; James, C.D.; et al. PTEN mutation, EGFR amplification, and outcome in patients with anaplastic astrocytoma and glioblastoma multiforme. J. Natl. Cancer Inst. 2001, 93, 1246–1256. [Google Scholar] [CrossRef] [PubMed]
- Srividya, M.R.; Thota, B.; Shailaja, B.C.; Arivazhagan, A.; Thennarasu, K.; Chandramouli, B.A.; Hegde, A.S.; Santosh, V. Homozygous 10q23/PTEN deletion and its impact on outcome in glioblastoma: A prospective translational study on a uniformly treated cohort of adult patients. Neuropathology 2011, 31, 376–383. [Google Scholar] [CrossRef] [PubMed]
- Koul, D. PTEN signaling pathways in glioblastoma. Cancer Biol. Ther. 2008, 7, 1321–1325. [Google Scholar] [CrossRef] [PubMed]
- D’Urso, O.F.; D’Urso, P.I.; Marsigliante, S.; Storelli, C.; Luzi, G.; Gianfreda, C.D.; Montinaro, A.; Distante, A.; Ciappetta, P. Correlative analysis of gene expression profile and prognosis in patients with gliomatosis cerebri. Cancer 2009, 115, 3749–3757. [Google Scholar] [CrossRef] [PubMed]
- Abdullah, J.M.; Farizan, A.; Asmarina, K.; Zainuddin, N.; Ghazali, M.M.; Jaafar, H.; Isa, M.N.; Naing, N.N. Association of loss of heterozygosity and PTEN gene abnormalities with paraclinical, clinical modalities and survival time of glioma patients in Malaysia. Asian J. Surg. 2006, 29, 274–282. [Google Scholar] [CrossRef][Green Version]
- Xu, J.; Li, Z.; Wang, J.; Chen, H.; Fang, J.Y. Combined PTEN Mutation and Protein Expression Associate with Overall and Disease-Free Survival of Glioblastoma Patients. Transl. Oncol. 2014, 7, 196–205.e191. [Google Scholar] [CrossRef]
- Han, F.; Hu, R.; Yang, H.; Liu, J.; Sui, J.; Xiang, X.; Wang, F.; Chu, L.; Song, S. PTEN gene mutations correlate to poor prognosis in glioma patients: A meta-analysis. Onco Targets Ther. 2016, 9, 3485–3492. [Google Scholar] [CrossRef]
- Erira, A.; Velandia, F.; Penagos, J.; Zubieta, C.; Arboleda, G. Differential Regulation of the EGFR/PI3K/AKT/PTEN Pathway between Low- and High-Grade Gliomas. Brain Sci. 2021, 11, 1655. [Google Scholar] [CrossRef]
- Sasaki, H.; Zlatescu, M.C.; Betensky, R.A.; Ino, Y.; Cairncross, J.G.; Louis, D.N. PTEN is a target of chromosome 10q loss in anaplastic oligodendrogliomas and PTEN alterations are associated with poor prognosis. Am. J. Pathol. 2001, 159, 359–367. [Google Scholar] [CrossRef]
- Zhang, P.; Meng, X.; Liu, L.; Li, S.; Li, Y.; Ali, S.; Li, S.; Xiong, J.; Liu, X.; Li, S.; et al. Identification of the Prognostic Signatures of Glioma With Different PTEN Status. Front. Oncol. 2021, 11, 633357. [Google Scholar] [CrossRef]
- Cordell, E.C.; Alghamri, M.S.; Castro, M.G.; Gutmann, D.H. T lymphocytes as dynamic regulators of glioma pathobiology. Neuro Oncol. 2022, noac055. [Google Scholar] [CrossRef]
- Codrici, E.; Popescu, I.D.; Tanase, C.; Enciu, A.M. Friends with Benefits: Chemokines, Glioblastoma-Associated Microglia/Macrophages, and Tumor Microenvironment. Int. J. Mol. Sci. 2022, 23, 2509. [Google Scholar] [CrossRef]
- DeCordova, S.; Shastri, A.; Tsolaki, A.G.; Yasmin, H.; Klein, L.; Singh, S.K.; Kishore, U. Molecular Heterogeneity and Immunosuppressive Microenvironment in Glioblastoma. Front. Immunol. 2020, 11, 1402. [Google Scholar] [CrossRef]
- Ma, Q.; Long, W.; Xing, C.; Chu, J.; Luo, M.; Wang, H.Y.; Liu, Q.; Wang, R.F. Cancer Stem Cells and Immunosuppressive Microenvironment in Glioma. Front. Immunol. 2018, 9, 2924. [Google Scholar] [CrossRef]
- Grover, P.; Goel, P.N.; Greene, M.I. Regulatory T Cells: Regulation of Identity and Function. Front. Immunol. 2021, 12, 750542. [Google Scholar] [CrossRef]
- Strauss, L.; Bergmann, C.; Whiteside, T.L. Human circulating CD4+CD25highFoxp3+ regulatory T cells kill autologous CD8+ but not CD4+ responder cells by Fas-mediated apoptosis. J. Immunol. 2009, 182, 1469–1480. [Google Scholar] [CrossRef]
- Boer, M.C.; Joosten, S.A.; Ottenhoff, T.H. Regulatory T-Cells at the Interface between Human Host and Pathogens in Infectious Diseases and Vaccination. Front. Immunol. 2015, 6, 217. [Google Scholar] [CrossRef]
- Sakaguchi, S. Regulatory T cells: Key controllers of immunologic self-tolerance. Cell 2000, 101, 455–458. [Google Scholar] [CrossRef]
- Scheinecker, C.; Göschl, L.; Bonelli, M. Treg cells in health and autoimmune diseases: New insights from single cell analysis. J. Autoimmun. 2020, 110, 102376. [Google Scholar] [CrossRef] [PubMed]
- Togashi, Y.; Shitara, K.; Nishikawa, H. Regulatory T cells in cancer immunosuppression—Implications for anticancer therapy. Nat. Rev. Clin. Oncol. 2019, 16, 356–371. [Google Scholar] [CrossRef] [PubMed]
- Okeke, E.B.; Uzonna, J.E. The Pivotal Role of Regulatory T Cells in the Regulation of Innate Immune Cells. Front. Immunol. 2019, 10, 680. [Google Scholar] [CrossRef] [PubMed]
- Nishikawa, H.; Sakaguchi, S. Regulatory T cells in tumor immunity. Int. J. Cancer 2010, 127, 759–767. [Google Scholar] [CrossRef]
- Takeuchi, Y.; Nishikawa, H. Roles of regulatory T cells in cancer immunity. Int. Immunol. 2016, 28, 401–409. [Google Scholar] [CrossRef]
- Kim, J.H.; Kim, B.S.; Lee, S.K. Regulatory T Cells in Tumor Microenvironment and Approach for Anticancer Immunotherapy. Immune Netw. 2020, 20, e4. [Google Scholar] [CrossRef]
- Gajewski, T.F. Identifying and Overcoming Immune Resistance Mechanisms in the Melanoma Tumor Microenvironment. Clin. Cancer Res. 2006, 12, 2326s–2330s. [Google Scholar] [CrossRef]
- Shevach, E.M. CD4+CD25+ suppressor T cells: More questions than answers. Nat. Rev. Immunol. 2002, 2, 389–400. [Google Scholar] [CrossRef]
- Mantovani, A.; Sozzani, S.; Locati, M.; Allavena, P.; Sica, A. Macrophage polarization: Tumor-associated macrophages as a paradigm for polarized M2 mononuclear phagocytes. Trends Immunol. 2002, 23, 549–555. [Google Scholar] [CrossRef]
- Yunna, C.; Mengru, H.; Lei, W.; Weidong, C. Macrophage M1/M2 polarization. Eur. J. Pharmacol. 2020, 877, 173090. [Google Scholar] [CrossRef]
- Mignogna, C.; Signorelli, F.; Vismara, M.F.; Zeppa, P.; Camastra, C.; Barni, T.; Donato, G.; Di Vito, A. A reappraisal of macrophage polarization in glioblastoma: Histopathological and immunohistochemical findings and review of the literature. Pathol. Res. Pract. 2016, 212, 491–499. [Google Scholar] [CrossRef]
- Hughes, R.; Qian, B.Z.; Rowan, C.; Muthana, M.; Keklikoglou, I.; Olson, O.C.; Tazzyman, S.; Danson, S.; Addison, C.; Clemons, M.; et al. Perivascular M2 Macrophages Stimulate Tumor Relapse after Chemotherapy. Cancer Res. 2015, 75, 3479–3491. [Google Scholar] [CrossRef]
- Fan, Y.; Ye, J.; Shen, F.; Zhu, Y.; Yeghiazarians, Y.; Zhu, W.; Chen, Y.; Lawton, M.T.; Young, W.L.; Yang, G.Y. Interleukin-6 stimulates circulating blood-derived endothelial progenitor cell angiogenesis in vitro. J. Cereb. Blood Flow Metab. 2008, 28, 90–98. [Google Scholar] [CrossRef]
- Chen, Y.; Song, Y.; Du, W.; Gong, L.; Chang, H.; Zou, Z. Tumor-associated macrophages: An accomplice in solid tumor progression. J. Biomed. Sci. 2019, 26, 78. [Google Scholar] [CrossRef]
- Hussain, S.F.; Yang, D.; Suki, D.; Aldape, K.; Grimm, E.; Heimberger, A.B. The role of human glioma-infiltrating microglia/macrophages in mediating antitumor immune responses. Neuro Oncol. 2006, 8, 261–279. [Google Scholar] [CrossRef]
- Zhu, C.; Kros, J.M.; Cheng, C.; Mustafa, D. The contribution of tumor-associated macrophages in glioma neo-angiogenesis and implications for anti-angiogenic strategies. Neuro Oncol. 2017, 19, 1435–1446. [Google Scholar] [CrossRef]
- Qian, B.Z.; Pollard, J.W. Macrophage diversity enhances tumor progression and metastasis. Cell 2010, 141, 39–51. [Google Scholar] [CrossRef]
- Zhou, F.; Shi, Q.; Fan, X.; Yu, R.; Wu, Z.; Wang, B.; Tian, W.; Yu, T.; Pan, M.; You, Y.; et al. Diverse Macrophages Constituted the Glioma Microenvironment and Influenced by PTEN Status. Front. Immunol. 2022, 13, 841404. [Google Scholar] [CrossRef]
- Stupp, R.; Hegi, M.E.; Mason, W.P.; van den Bent, M.J.; Taphoorn, M.J.; Janzer, R.C.; Ludwin, S.K.; Allgeier, A.; Fisher, B.; Belanger, K.; et al. Effects of radiotherapy with concomitant and adjuvant temozolomide versus radiotherapy alone on survival in glioblastoma in a randomised phase III study: 5-year analysis of the EORTC-NCIC trial. Lancet Oncol. 2009, 10, 459–466. [Google Scholar] [CrossRef]
- Stupp, R.; Mason, W.P.; van den Bent, M.J.; Weller, M.; Fisher, B.; Taphoorn, M.J.; Belanger, K.; Brandes, A.A.; Marosi, C.; Bogdahn, U.; et al. Radiotherapy plus concomitant and adjuvant temozolomide for glioblastoma. N. Engl. J. Med. 2005, 352, 987–996. [Google Scholar] [CrossRef]
- Sano, T.; Lin, H.; Chen, X.; Langford, L.A.; Koul, D.; Bondy, M.L.; Hess, K.R.; Myers, J.N.; Hong, Y.K.; Yung, W.K.; et al. Differential expression of MMAC/PTEN in glioblastoma multiforme: Relationship to localization and prognosis. Cancer Res. 1999, 59, 1820–1824. [Google Scholar] [PubMed]
- McEllin, B.; Camacho, C.V.; Mukherjee, B.; Hahm, B.; Tomimatsu, N.; Bachoo, R.M.; Burma, S. PTEN loss compromises homologous recombination repair in astrocytes: Implications for glioblastoma therapy with temozolomide or poly(ADP-ribose) polymerase inhibitors. Cancer Res. 2010, 70, 5457–5464. [Google Scholar] [CrossRef] [PubMed]
- Inaba, N.; Kimura, M.; Fujioka, K.; Ikeda, K.; Somura, H.; Akiyoshi, K.; Inoue, Y.; Nomura, M.; Saito, Y.; Saito, H.; et al. The effect of PTEN on proliferation and drug-, and radiosensitivity in malignant glioma cells. Anticancer Res. 2011, 31, 1653–1658. [Google Scholar] [PubMed]
- Zając, A.; Sumorek-Wiadro, J.; Langner, E.; Wertel, I.; Maciejczyk, A.; Pawlikowska-Pawlęga, B.; Pawelec, J.; Wasiak, M.; Hułas-Stasiak, M.; Bądziul, D.; et al. Involvement of PI3K Pathway in Glioma Cell Resistance to Temozolomide Treatment. Int. J. Mol. Sci. 2021, 22, 5155. [Google Scholar] [CrossRef]
- Carico, C.; Nuño, M.; Mukherjee, D.; Elramsisy, A.; Dantis, J.; Hu, J.; Rudnick, J.; Yu, J.S.; Black, K.L.; Bannykh, S.I.; et al. Loss of PTEN is not associated with poor survival in newly diagnosed glioblastoma patients of the temozolomide era. PLoS ONE 2012, 7, e33684. [Google Scholar] [CrossRef]
- Giotta Lucifero, A.; Luzzi, S.; Brambilla, I.; Schena, L.; Mosconi, M.; Foiadelli, T.; Savasta, S. Potential roads for reaching the summit: An overview on target therapies for high-grade gliomas. Acta Biomed. 2020, 91, 61–78. [Google Scholar] [CrossRef]
- Giotta Lucifero, A.; Luzzi, S.; Brambilla, I.; Guarracino, C.; Mosconi, M.; Foiadelli, T.; Savasta, S. Gene therapies for high-grade gliomas: From the bench to the bedside. Acta Biomed. 2020, 91, 32–50. [Google Scholar] [CrossRef]
- Luzzi, S.; Giotta Lucifero, A.; Brambilla, I.; Magistrali, M.; Mosconi, M.; Savasta, S.; Foiadelli, T. Adoptive immunotherapies in neuro-oncology: Classification, recent advances, and translational challenges. Acta Biomed. 2020, 91, 18–31. [Google Scholar] [CrossRef]


| Variable | Data |
|---|---|
| Case no. | 617 |
| Average pts. age (yrs ± SD) | 58.8 ± 14 |
| Sex | |
| Male no. (%) | 367 (59.5) |
| Female no. (%) | 230 (37.3) |
| NOS no. (%) | 20 (3.2) |
| Ethnicity | |
| Caucasian no. (%) | 594 (96.3) |
| African no. (%) | 20 (3.2) |
| Asian no. (%) | 3 (0.5) |
| Histological type | |
| Glioblastoma no. (%) | 617 (100) |
| IDH wild-type ratio/IDH-mutant ratio | 577:40 |
| Primary site | |
| Brain no. (%) | 617 (100) |
| Adjuvant treatment | |
| Pharmacotherapy no. (%) | 322 (52.2) |
| Radiation Therapy no. (%) | 278 (45) |
| NOS no. (%) | 17 (2.8) |
| Vital status | |
| Dead no. (%) | 427 (69.2) |
| Alive no. (%) | 151 (24.5) |
| NOS no. (%) | 39 (6.3) |
| Average FU (months) | 14.7 |
| PTEN Mutations no. pts (%) | 137 (22.2) |
Publisher’s Note: MDPI stays neutral with regard to jurisdictional claims in published maps and institutional affiliations. |
© 2022 by the authors. Licensee MDPI, Basel, Switzerland. This article is an open access article distributed under the terms and conditions of the Creative Commons Attribution (CC BY) license (https://creativecommons.org/licenses/by/4.0/).
Share and Cite
Giotta Lucifero, A.; Luzzi, S. Immune Landscape in PTEN-Related Glioma Microenvironment: A Bioinformatic Analysis. Brain Sci. 2022, 12, 501. https://doi.org/10.3390/brainsci12040501
Giotta Lucifero A, Luzzi S. Immune Landscape in PTEN-Related Glioma Microenvironment: A Bioinformatic Analysis. Brain Sciences. 2022; 12(4):501. https://doi.org/10.3390/brainsci12040501
Chicago/Turabian StyleGiotta Lucifero, Alice, and Sabino Luzzi. 2022. "Immune Landscape in PTEN-Related Glioma Microenvironment: A Bioinformatic Analysis" Brain Sciences 12, no. 4: 501. https://doi.org/10.3390/brainsci12040501
APA StyleGiotta Lucifero, A., & Luzzi, S. (2022). Immune Landscape in PTEN-Related Glioma Microenvironment: A Bioinformatic Analysis. Brain Sciences, 12(4), 501. https://doi.org/10.3390/brainsci12040501