Abstract
In this narrative review, we focus on the role of quantitative EEG technology in the diagnosis and prognosis of patients with unresponsive wakefulness syndrome and minimally conscious state. This paper is divided into two main parts, i.e., diagnosis and prognosis, each consisting of three subsections, namely, (i) resting-state EEG, including spectral power, functional connectivity, dynamic functional connectivity, graph theory, microstates and nonlinear measurements, (ii) sleep patterns, including rapid eye movement (REM) sleep, slow-wave sleep and sleep spindles and (iii) evoked potentials, including the P300, mismatch negativity, the N100, the N400 late positive component and others. Finally, we summarize our findings and conclude that QEEG is a useful tool when it comes to defining the diagnosis and prognosis of DOC patients.
1. Introduction
In recent years, neurological intensive care and medical care in general have improved substantially. Hence, more people are surviving severe brain injuries. Thus, the percentage of people dying from traumatic brain injuries, for example, decreased from 16% in 2000 to 11% in 2010 [1]. Nevertheless, not all people fully recover, and many patients remain in a prolonged coma, defined as a state of absence of arousal (eye opening) and awareness (non-reflexive behavior or command following) [2], in the acute state, and a substantial number (10–15% [3]) of survivors stay with disorders of consciousness (DOC). DOC describe a continuum of states with no arousal or awareness to states of full arousal and awareness. Patients with DOC are categorized as being in one of three main states: (i) coma, (ii) unresponsive wakefulness state (UWS) and (iii) minimally conscious state (MCS) [4]. Patients in UWS open their eyes spontaneously but are unresponsive to external stimuli or show just reflex movements, see, e.g., [5,6,7,8]. Patients with MCS, in contrast, show evidence of awareness of themselves or of their environment, though this awareness fluctuates [4]. MCS plus (MCS+) patients show high-level behavioral responses, namely, command following and intelligible verbalization, or non-functional communication. On the other hand, MCS minus (MCS−) patients only show low-level behavioral responses. These may include visual pursuit, the localization of noxious stimuli or appropriate crying or smiling when exposed to emotional stimuli [9]. Patients that regain consciousness after being in MCS are referred to as being in emerging MCS (EMCS), i.e., they are already able to functionally communicate and functionally use objects [10]. Moreover, on the upper boundary of MCS, there is severe neurocognitive disorder (SND). Those patients show evidence of arousal and awareness, i.e., consciousness, but have severe impairment to two or more cognitive sub-functions [11]. Another state which must not be confused with DOC is the so-called locked-in syndrome (LIS). In contrast to patients with severe disturbances of consciousness, patients with LIS are aware of themselves and their environment but are fully de-efferentiated, due to bilateral transection of pyramidal tracts at the level of pons or cerebral peduncles, leading to complete immobility except for vertical gaze [2]. Some studies included conscious subjects (CS), i.e., patients with brain injuries who are fully conscious, e.g., [12].
Over the years, various scales have been introduced to categorize DOC patients, see, e.g., [13] for a review. The Glasgow–Liège Scale (GLS), which was introduced in 1982, is a combination of the Glasgow Coma Scale (GCS) [14] and quantified analysis of brain stem reflexes [15]. Moreover, there is the Innsbruck Coma Sale (ICS), which is similar to the GCS and also has number of separate assessments which are added up to an aggregate score [16]. The Wessex Head Injury Matrix (WHIM) was developed for assessing and monitoring patients’ recovery after severe head injury [17]. The state-of-the-art scale to assess coma in the non-emergency setting today is the JFK Coma Recovery Scale-Revised (CRS-R) [18], which is based on the Disability Rating Scale (DRS) [19] and the Coma Recovery Scale (CRS) [20]. The Coma/Near Coma (CNC) Scale is, similar to the DRS, related to the patient’s status, course and outline, but also to the underlying electro-neuro-physiological dysfunction [21].
The American Academy of Neurology and the American Clinical Neurophysiology Society define quantitative EEG (QEEG) as: “… the mathematical processing of digitally recorded EEG in order to highlight specific waveform components, transform the EEG into a format or domain that elucidates relevant information, or associate numerical results with the EEG data for subsequent review or comparison” [22]. It involves the use of computers, and several measures, e.g., the power spectrum, can be derived from it. In this review, we will critically assess the role of QEEG in the diagnosis and prognosis of patients with DOC. We will focus on QEEG because it is, other than functional magnetic resonance imaging (fMRI) or positron emission tomography (PET), non-invasive, less expensive, widely applicable and a bedside measurement.
Behavioral tests are the gold standard for diagnosis and the following prognosis, even though they have limitations [23]. Hence, clinicians and neuroscientists often seek for additional tests to behavioral tests. Here, we review the current literature on diagnosis and prognosis of DOC patients and attempt to give the reader an overview of the parameters that can be extracted from EEG and their usefulness. Our focus lies on the diagnosis and prognosis of DOC patients, since those are the two most important factors for clinical use. Diagnosis is the first step in clinic decision making, on which the choice of treatment is based. The right treatment can just be found with the right diagnosis at hand. Prognosis is important for ethical reasons and especially of interest to the relatives of the patients. Hence, we provide an overview of the research over the last 20 years (2000–2020) of all the different parameters extracted from EEG recordings used for diagnosis and prognosis, and we summarize our findings in two tables at the end. Some existing reviews just focus on prognosis [24] or just present work conducted on resting-state EEG [25], [26]. Other reviews focus on BCI [27] or also EEG reactivity and transcranial magnetic stimulation (TMS)-EEG [28,29]. Another review on EEG and neuroimaging can be found, e.g., in [30]. Moreover, there are also some reviews focusing on interventions and therapy [31,32]. We did not include any of the other mentioned topics, except diagnosis and prognosis, because we intended to write a focused review with just the two most important aspects for clinical practice, and including all mentioned aspects would go beyond the scope of our discussion.
2. Methods
We searched the database PubMed for articles using the following search term: “(EEG OR electroencephalography OR electroencephalogram OR QEEG) AND (DOC OR disorders of consciousness OR vegetative state OR VS or unresponsive wakefulness syndrome OR UWS OR MCS OR minimally consciousness state OR coma)”, which returned over 10,000 results. Hence, we reduced our search to “EEG AND DOC”, which returned 214 results. Since we restricted our search, we checked the bibliography of all found papers for relevant studies and also included those in our research. After an initial screening of the titles and abstracts, we could reduce the number of papers before conducting a full-text analysis. We included 86 papers in this review (from our PubMed search and citation search from [24,28,33]). The criteria for study selection were as follows:
We focused on the diagnosis and prognosis of DOC patients using QEEG. Hence, we excluded papers focusing on basic research, e.g., [34], or on brain computer interfaces or treatment response, e.g., [28]. We did not include active paradigms such as the imaginary paradigm. Moreover, we excluded papers focusing on machine learning for which we refer the reader to [35]. Furthermore, we excluded papers dealing with other types of measurements, e.g., fMRI, PET or TMS. For a review about fMRI and QEEG for DOC patients, see, e.g., [30]. We also did not include the prediction of acute severe brain injury, where we refer to [36]. The entire process is summarized in the flow chart in Figure 1.
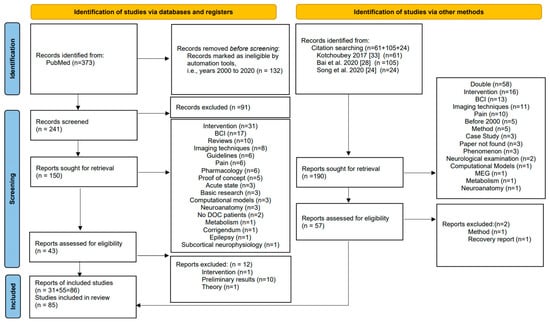
Figure 1.
PRISMA flow chart (following the example in [42]) explaining our inclusion and exclusion criteria.
In order to be able to better compare the different results found in the literature, we performed a calculation of Cohen’s d [37] and its confidence interval for each of the investigated parameters whenever possible. Cohen’s d is a common way to measure the effect size of two subject groups, with values lying between 0 and 0.1 indicating no effect, values between 0.2 and 0.4 indicating a small effect, values between 0.5 and 0.7 indicating an intermediate effect and values larger than 0.8 indicating a large effect. Negative values describe an adverse effect [37]. Cohen’s d can be interpreted as the number of standard deviations that the means of two groups differ by.
We calculated Cohen’s d as follows:
- If sample sizes (n1, n2), means (mean1, mean2) and standard deviations (sd1, sd2) were available, we calculated d directly as
- If a t statistic and sample sizes were available, we used
- For F statistics with the first degree of freedom equal to one, resulting from a comparison between two groups, we first calculated a t statistic by taking the square root of F and then proceeded as above.
- For chi-squared statistics with one degree of freedom, we first transformed to a correlation viaand then to Cohen’s d via
- For an area under the curve (AUC), we usedwhere −1 is the inverse of the distribution function of the standard normal distribution.
- For 2 × 2 contingency tables, we performed Fisher’s exact test as implemented in R using the command fisher.test. The odds ratios (OR) and limits of their confidence intervals were then transformed using
- When confidence intervals were not given for the originally reported effect measure, we calculated confidence intervals for Cohen’s d using
For actual calculation, we used either the statistical software package R (Version 4.0.5) [38], a website-based calculator [39] or a conversion table [40]. References for the above formulae can be found at [39], and the formula for the confidence interval can be found at [41], p. 238.
We summarized the results including the Cohen’s d values and confidence intervals in Section 4. We decided not to pool effects from different studies since the considerable heterogeneity in study designs and outcome measures meant they were largely not comparable with each other.
All abbreviation used throughout the paper can be found in Abbreviation.
3. Results
3.1. Diagnosis
3.1.1. Resting-State EEG
Resting-state EEG is an easily applicable measurement where the subject is not required to perform any task, and where no stimuli are presented. Hence, it is ideal for DOC patients. The EEG oscillations are generally divided into the following bands: delta band (0.5–3 Hz), theta band (4–7 Hz), alpha band (8–13 Hz), beta band (14–30 Hz) and gamma band (>30 Hz). Sometimes, these bands are further divided into sub-bands, or authors use slightly different frequency boundaries. If this is the case, we will mention it when we describe the paper. An overview of the papers and a quick summary of the results of each study can be found in Table 1.

Table 1.
Overview of findings for diagnosis and resting-state EEG; abbreviations can be found in Abbreviation.
Spectral Power
Spectral power analysis is a standard QEEG method showing the distribution of the signal’s power over specific frequency bins or, in other words, the frequency content of the signal. The frequency bands that are most important for distinguishing patients in UWS, MCS and SND seem to be the alpha, delta and theta bands. The powers of delta and theta bands were increased in MCS when compared to SND patients [11]. Several studies showed that UWS patients had decreased alpha but increased delta power when compared to MCS patients [52,55,62,65,66]. Theta power is not so well studied, but it was found to be higher in UWS patients compared to healthy controls [55]. However, Piarulli et al. reported that UWS patients had lower theta power when compared to MCS patients [62], whereas another study presented no differences between UWS and MCS patients [65]. Hardly any papers deal with beta or gamma band frequencies. One study, however, showed no difference in beta and gamma band power between UWS and MCS patients [65]. Normalized delta power was found to be lower in patients with MCS than in patients with UWS. In contrast, normalized theta and alpha powers were higher in CS than in UWS patients [59]. A significant negative correlation between CRS values and relative delta power in the parieto-occipital, fronto-central and midline regions, as well as a positive correlation between CRS values and relative alpha power in the parieto-occipital, fronto-central and midline regions, was found [60]. The powers of delta and alpha bands were also found to have a correlation with CRS-R scores, i.e., alpha power increases and delta power decreases with increasing CRS-R values [56,65]. Moreover, Lechinger et al. found a positive correlation between the ratios of frequencies above and below 8 Hz and the CRS-R. Additionally, the spectral peak frequency was correlated with the CRS-R score of patients with UWS and MCS [55]. The theta band power was also found to significantly correlate with clinical variables such as the CRS-R score and other demographic factors [69]. When focusing on LIS patients vs. healthy controls, Babiloni and colleagues showed that alpha power was lower, whereas delta power was higher, in the LIS group [45]. Coleman et al. reported that the power ratio index, defined as the ratio of percentage power in slow-wave activity (delta and theta frequency bands) to that in fast-wave activity (alpha and beta frequency bands), was significantly higher in UWS compared to MCS patients. [73]. Source localization incorporating the low-resolution electromagnetic tomography (LORETA) model [74] was used in some studies, revealing higher amplitudes of theta frequencies and delta frequencies in posterior sources of MCS patients compared to SND patients. Furthermore, fast frequencies showed lower source magnitudes in MCS patients when considering the temporal and frontal lobes [11]. Naro et al. also used LORETA and found a significant difference in source power between UWS and MCS patients. Delta power is different in frontal sources, that is, it is increased in UWS. Theta power in frontal and parietal sources was more abnormal in UWS, as was alpha power in parietal and occipital sources. Beta power in central sources showed a positive correlation with the motor item score. Moreover, gamma power in parietal sources was also more abnormal in UWS [61]. Rossi Sebastiano et al. reported that the absolute total power is related to etiology. Thus, lower absolute total power was found in anoxic patients. However, the absolute total power was not able to distinguish between traumatic and vascular etiologies. Lutkenhoff et al. analyzed DOC patients, their power spectrum and subcortical damage measured via magnetic resonance imaging. They found that the EEG power spectra were associated with the subcortical damage of the patient’s brain. The ratio of beta to delta relative powers was lower with higher atrophy in the bilateral thalamus and globus pallidus. The power spectrum total density was lower with more widespread atrophy in the brainstem, the left globus pallidus and the right caudate [72].
Functional Connectivity
Functional connectivity describes different measures quantifying how neural activities of two different brain areas relate to each other. For a tutorial review, see [75]. Since there are many different types of measurements, it is hard to find multiple papers dealing with the same measurement. However, some publications focused on the number of connections in general. SND patients were found to have a larger number of connections than MCS patients [46,53]. Additionally, MCS patients had significantly higher connectivity in the alpha and beta bands when compared to UWS patients [52]. Coherence was also analyzed in some studies, but it was not possible to differentiate between MCS and UWS patients using coherence patterns [63]. Another research group, however, reported that coherence in alpha and beta frequencies was larger in UWS than in MCS patients [66]. Focusing on cross-approximate entropy, the interconnections of UWS patients were generally suppressed for local and distant cortical networks, whereas the interconnection of local cortical networks was increased for patients with MCS [50]. Granger causality is also a well-known parameter; however, no conclusive results were found when comparing SND and MCS patients [53]. The outgoing Granger causality distribution is wider in comparison to the incoming values for UWS, MCS and EMCS patients as well as healthy controls. Focusing on the UWS group, it was found that electrodes from central, occipital and temporal areas showed dissymmetry between outgoing and incoming information. Comparing MCS and EMCS patients, the bottleneck regions move more towards occipital areas. Moreover, considering healthy controls, lateral parietal electrodes showed the biggest difference between incoming and outgoing information. Differences in the distribution of the overall redundancy and synergy balance between all groups (UWS, MCS, EMCS, healthy controls), except EMCS vs. controls, were high [58]. Transfer entropy could not differentiate four groups, UWS, MCS, EMCS and healthy controls [58]. However, another study could distinguish between UWS and MCS patients using transfer entropy, yielding the best results in the alpha band [66]. Weighted symbolic mutual information increases with the level of consciousness and can be used to distinguish between UWS patients, MCS patients and conscious patients [54,66]. Moreover, this measure does not depend on etiology or the time since insult [54]. Höller et al. investigated 44 different biomarkers and found that partial coherence, generalized partial directed coherence and directed transfer function could differentiate UWS patients from MCS patients as well as healthy controls from UWS and MCS patients [57]. Considering weighted symbolic mutual information, it was found that inter-electrode information exchanges were higher in brain-injured but conscious patients when compared to UWS patients, and they were lower in the theta and alpha bands for UWS patients than for MCS and conscious patients [59]. Using symbolic transfer entropy, altered directed information flow was found for DOC patients. This indicates impaired feed-backward connectivity [64]. Focusing on the CRS-R, it was found that alpha band connectivity, both the imaginary and real parts of coherence, the phase lag index and quadratic self-coupling in different bands (delta, theta and alpha) were correlated with the CRS-R [34,52,69].
Dynamic Functional Connectivity
The above measures use static functional connectivity; however, there is also a dynamic approach—see, e.g., [76]. Time-dependent phase synchronization of delta, theta, alpha, beta and gamma bands was analyzed. The changes in dynamic functional connectivity matrices and the topography (mainly in the gamma range) over time were significantly different between MCS and UWS patients. Moreover, it was found that the degree of dynamic functional connectivity and the CRS-R were significantly correlated [65].
Graph Theory
Graph theory is a mathematical tool, which includes the use of nodes—for EEG, typically electrodes or sources—and connections, aspects of the signal in the node, between them. The combination of nodes and edges forms a network which can be characterized via different measures—see, e.g., [77,78]. Local and global efficiency were reduced, and fewer hubs were found in the alpha band of DOC patients’ networks when comparing them to healthy controls. Moreover, network modules in the alpha band of DOC patients were spatially circumscribed. Considering the delta and theta bands, the differences between the metrics were partially reversed, being more similar to each other in the DOC patient group than to the healthy subjects. Furthermore, metrics of network efficiency of the alpha band correlated with the level of behavioral awareness [56]. The clustering coefficient and the characteristic path length (of all networks from delta, theta, alpha and beta frequencies) were both able to distinguish between UWS and MCS patients [66]. Subnetworks in UWS patients have decreased functional connectivity compared to MCS patients. Considering nodes, altered functional topology of regions in the limbic and temporo-parieto-occipital parts was found in UWS patients [67]. DOC patients showed impaired network integration, i.e., global information processing, when compared to healthy controls. Moreover, network segregation, i.e., local information processing, was increased in DOC patients compared to healthy controls. The level of consciousness was lower when the large-scale functional brain networks’ integration was lower [68]. Cai et al. analyzed network segregation and integration in cross-frequency bands using a multiplex framework. Integration of the networks of the five common frequencies resulted in a frequency-based multiplex network. They found that networks of DOC patients have decreased segregation and increased integration when it comes to inter-frequency dynamics. Increased temporal and spatial variability were found to correlate with the level of consciousness. The behavioral performance of DOC patients was significantly correlated with the alteration of cross-frequency networks on a global as well as a local scale [70]. Using multiplex and multilayer network metrics, it was shown that the heterogeneity of functional networks, especially the fronto-parietal network, could discriminate between UWS and MCS patients. These results could not be found when focusing on individual frequency-specific networks. A positive correlation between the hub vulnerability of the regions and the behavioral performance was found. Considering multiplex analysis, a separation at the group level could be achieved. On the other hand, multilayer analysis was able to differentiate DOC patients individually [71].
Microstates
EEG microstates are stable scalp potential fields, which last a short time. We refer the reader to [79] for a review. Altered states of consciousness were related to a decreased number of microstate types. Moreover, unawareness and lower diversity in alpha-rhythmic microstates were associated. The duration and probability of the occurrence of fast alpha-rhythmic microstates were related to consciousness, whereas the duration and probability of occurrence of slow alpha-rhythmic, delta-rhythmic and theta-rhythmic microstates were related to unawareness [51]. The percentage of time which was spent in microstate D in the alpha frequency band was the best measure for classifying UWS and MCS patients [66].
Nonlinear Measures
Besides the above, there are a lot more measures which can be derived from transformed EEG signals, which will be summarized in this section. The bispectral index, a measurement coming from anesthesia monitoring, was found to have a correlation with the level of consciousness, measured via GLS and WHIM. A bispectral index cut-off of 50 was able to distinguish between unconscious (coma or UWS) patients and conscious (MCS or EMCS) patients [43,44]. The mean approximate entropy of UWS patients was lowest, followed by MCS patients and controls [47,49,50,66]. Mean EEG entropy values were found to be lower in UWS than in MCS patients [48]. The Lempel–Ziv complexity was highest for conscious patients (stroke or brain trauma), followed by MCS and UWS patients [12]. The Kolmogorov–Chaitin complexity increased with the state of consciousness and was successfully used to differentiate between UWS and MCS patients, especially when focusing on the parietal region. Permutation entropy-based measures could be used to differentiate UWS patients from others, especially in the theta range. A higher permutation entropy corresponded to a higher state of consciousness (most successful when derived from centro-posterior regions) [59,64,66]. MCS patients were found to have a higher mean spectral entropy than UWS patients [62].
3.1.2. Sleep Patterns
In this section, we describe the findings from diagnosis using sleep patterns. See Table 2 for an overview. When it comes to rapid eye movement (REM) sleep, different results are found in the literature. Oksenberg et al. found that all UWS patients showed REM sleep [80], whereas another study reported that during the night, MCS patients, but not UWS patients, showed REM sleep stages [81]. Mertel et al. found that 12% of MCS patients, 44% of UWS patients and non-tetraplegic control patients lacked REM sleep patterns [82]. For UWS patients with REM sleep, it was shown that the duration of REM sleep is lower than for healthy subjects, but not if only focused on nocturnal periods [80]. Moreover, the density of REM was reduced in UWS patients when comparing to healthy subjects [80]. Non-REM 2 stages were found more often in MCS than in UWS patients [83].
Table 2.
Overview of findings for diagnosis and sleep patterns; abbreviations can be found in Abbreviation.
Slow-wave sleep was found in 30% of UWS and 80% of MCS patients [84]. Rossi Sebastiano et al. reported that slow-wave sleep occurs more often in MCS than in UWS patients [83]. Another study, however, found no slow-wave sleep in UWS during the night at all. They also showed a homoeostatic decline in slow-wave activity in MCS patients [81]. Children with DOC had globally reduced slow-wave activity build-up when compared to healthy and brain-injured, but conscious, children [88]. Slow-wave sleep has a correlation with the CRS-R. The CRS-R was correlated with slow-wave activity [85]; however, it was negatively correlated with the amount of slow waves during the night period [89]. The duration of slow-wave sleep was positively correlated to the CRS-R [83].
Sleep spindles seem to be correlated with consciousness and several cognitive processes performed during the night (e.g., memory consolidation). As expected, it was found that 21% of MCS and 62% of UWS patients do not present with sleep spindles [82]. Additionally, the power of sleep spindles was lower in UWS than in MCS or EMCS patients [90]. Moreover, DOC patients, who showed command following in fMRI, had spindle activity during their sleep [87]. However, sleep spindles did not vary between day and night sleep in UWS and MCS patients. There was a correlation between the behavioral diagnosis (UWS, MCS and LIS) and sleep spindles [85], as well as the density of sleep spindles during night periods in the parietal areas for UWS, MCS and healthy controls [89].
Another study compared polysomnography and evoked potentials and found that the correlation with the clinical evaluation (including CRS-R, DRS and GCS) is higher than the one between evoked potentials and clinical evaluation [86].
3.1.3. Evoked Potentials
Evoked potentials are “electrical manifestations of the brain’s reception of and response to an external stimulus” [91]. In the EEG, these evoked potentials can be seen as peaks, which can be either positive or negative. We use the conventions of naming the peaks P (positive) or N (negative) and provide the latency in milliseconds (ms). For more information on evoked potentials, see, e.g., [92].
Most papers that deal with evoked potentials use auditory stimuli. We focus here on late auditory evoked potentials, i.e., more than 50 ms post-stimulus. The early auditory evoked potentials occur around 2–8 ms post-stimulus and reflect activity from the auditory pathway, whereas the late auditory potentials are a sign of cognitive processing [93]. For papers using other stimuli, we will specifically mention them in the following. Table 3 shows an overview and a summary of all studies presented in this section.
Table 3.
Overview of findings for diagnosis and evoked potentials; abbreviations can be found in Abbreviation.
P300
The P300 is evoked by oddball paradigms. This means that a series of similar stimuli is presented to the subject which is suddenly interrupted by a different stimulus. This can be, for example, a different tone in a series of similar tones, or one’s own name in a series of names. It is often either passive (just by listening for auditory stimuli) or active (by counting the odd stimulus). The P300 was found to be different among subgroups of DOC patients. As such, the P300 was found in healthy, LIS and MCS patients, but not in most UWS patients [96,109,121]. Another study also reported moderate differences in the P300 in different patient groups (UWS or MCS) [59]. Kempney et al. found statistically significant differences in EEG responses to the patients’ (UWS/MCS) own name, which were sometimes similar to those of healthy controls [118]. Sergent and co-authors introduced a 1.5-h EEG protocol and found a significant P300 in 9 out of 15 healthy subjects, 1 out of 4 UWS and 4 out of 8 MCS patients and none in the only conscious patient [116]. Comparing the passive to the active paradigm also revealed good results in the sense that MCS patients and healthy controls showed a larger P300 in the active vs. the passive paradigm. This could not be observed for UWS patients [97,105]. Another study reported higher responses in the counting task (active) than in the passive task for all MCS and healthy subjects at an individual level [108]. Real at al. found that the P300 was lower in patients (UWS and MCS) when compared to healthy controls but could not differentiate between the two patient groups [114]. Schnakers et al. also tried to find differences between MCS+ and MCS− in their study which also included UWS and healthy controls. Here, 5 out of 8 MCS+, 3 out of 8 MCS− and 1 out of 10 UWS patients showed an enhanced P300 amplitude when comparing the active to the passive condition. No difference between MCS+ and healthy controls was found [111]. What was also considered was the latency. Hence, it was found that the P300 latency is significantly delayed in patients (UWS and MCS) when compared to healthy subjects [96,116]. Another study even found a larger increase in latency for UWS patients when compared to MCS patients and healthy controls [117]. Cavinato et al. found a correlation between the level of complexity of the stimulus and the increase in P300 latency for MCS patients and healthy controls, but not for UWS patients [101]. Considering the etiology, the novelty P300 was less often found in patients with anoxia than those with any other etiology [99], and Wu et al. showed that the P300 was clearer in non-traumatic patients when compared to patients with traumatic etiologies [121]. Annen and colleagues investigated the P300 responses to auditory and vibrotactile stimulation. They did not find differences in the P300 characteristics when comparing UWS to MCS patients or even when comparing traumatic vs. non-traumatic etiologies. The performances of the two different stimuli (auditory and vibrotactile) were independent of each other [120]. Investigating the P300 response in relation to the CRS-R score, it was shown that the amplitude of the novelty P300 is correlated with the CRS-R and even more with the auditory sub-score [105]. Gibson et al. focused on the P300a and P300b, and they reported that 8 out of 13 patients showed the P300a, but not the P300b. Only patients who were able to follow commands were also found to have event-related potentials of attentional orienting [113]. Another study even found one UWS patient who presented the P300a as well as the P300b [104].
Mismatch Negativity (MMN)
The mismatch negativity (MMN) is a negative component which is found as a response of the brain to the violation of a rule. This can be a sequence of tones which is interrupted by another tone but can be also designed for basically any other sequence of stimuli. For more details and underlying mechanisms, see [122]. When it comes to MMN and DOC patients, different results have been published. One study reported that MMN was found in 5 out of 27 patients (UWS and MCS) [99], and another reported it in 7 out of 12 [98], while another study found MMN in all UWS and MCS patients [105]. Erlbeck et al. found MMN in just 2 out of 19 DOC patients [115]. Some studies tried to distinguish UWS and MCS patients using MMN. It was found that the presence of MMN does not differentiate the two groups, but its significance was lower in UWS patients [102]. Another study was able to distinguish healthy from DOC patients but not the two patient groups (UWS, MCS) [59]. Wang et al. reported higher MMN latency for UWS patients when compared to MCS patients or healthy controls [117]. A relation between the CRS and MMN was found, i.e., the amplitude was higher for higher levels of consciousness [102]. Boly et al. found that effective connectivity during MMN revealed impaired backward connectivity from the frontal to temporal areas in UWS [100].
N100
The N100 belongs to the negative evoked potentials and has its peak at around 100 ms after the stimulus. It is largest in central areas but can be found at many sites [93]. Kotchoubey et al. reported that more frequent N100 components of event-related brain responses to stimuli of different complexity levels were related to a lower level of disability. The N100 was found more frequently in MCS than in UWS patients [95]. Wu et al. observed an N100 response to auditory stimuli in both MCS and UWS patients [121].
N400
The next peak we want to focus on is the negative peak at around 400 ms, i.e., the N400, which was found to have high effectiveness when it comes to examining aspects of language processing [123]. All DOC patients showed a higher N400 peak amplitude in the fronto-central regions as an answer to incongruous words or sentences [103,107]. UWS patients were found to have a delayed N400 in incongruous conditions when comparing them to MCS patients. Moreover, there was a correlation between the clinical scales (CNC and DRS) and the peak amplitude as well as latency [107]. The N400 was observed in the UWS group, the MCS group and healthy controls [110]. Beukema et al. found cortical responses to sound in all patients. In some patients, the auditory processing level exceeded what was expected from behavioral assessment. However, auditory processing did not differentiate between UWS patients and MCS patients [112]. Another study reported that most DOC patients did not show any responses [115]. However, Schoenle and Witzke could use the N400 to distinguish non-UWS, near-UWS and UWS [94].
Late Positive Component (LPC)
The LPC is found over parietal brain parts and in the interval of 400–800 ms post-stimulus and is important in memory paradigms [124]. Rohaut et al. observed that LPC was present in just 6 out of 19 healthy controls, 5 out of 14 MCS patients and in just one out of 15 UWS patients [110]. Another study, not distinguishing UWS and MCS, found an LPC in 2 out of 19 DOC patients [115]. Wu et al. found no LPC in UWS [121].
Other Measures
The P200 occurs more frequently in MCS compared to UWS [95]. Considering healthy controls, a large global effect on the global field power plots was found. This could not be statistically significantly observed for the other groups, i.e., conscious patients, UWS and MCS patients. However, an analysis could confirm a relationship between the CRS and the presence of a global effect [102]. The response score to visual stimuli increased with increasing consciousness over time. Visually evoked potentials were smaller in amplitude and longer in latencies when comparing UWS patients to healthy controls [106]. Contingent negative variation was significant in all healthy controls and a conscious patient, for five out of eight MCS and for three out of four UWS patients. Moreover, action anticipation, attention shift to the cue side and significant contextual modulation did not provide any significant results. Furthermore, local incongruence detection and lateralized readiness potential were more often observed in healthy controls, followed by conscious patients, MCS patients and UWS patients [116]. DOC patients were found to have a lower number of trials with delta event-related synchronization. Moreover, a positive correlation between the P300 and the number of epochs with delta event-related synchronization was observed [119].
3.2. Prognosis
The literature on prognosis is very heterogeneous concerning the follow-up time, and the number of papers is less than that for diagnosis. In the following, we summarize the most important results.
3.2.1. Resting State
An overview of this section is given in Table 4.
Table 4.
Overview of findings for prognosis and resting-state EEG; abbreviations can be found in Abbreviation.
Spectral Power
Alpha power seems to be an indicator for a good outcome. Hence, a correlation between alpha power and recovery of UWS patients after three months was found [125]. Moreover, the power of alpha performed even better at predicting the outcome (follow-up 589.26 ± 1125.32 days) than indexing consciousness [66]. A bad outcome (after six months) was associated with a higher probability of slow theta and delta oscillations, in combination but also on their own. Furthermore, patients who survived had a higher probability of alpha and fast theta oscillations, again in combination or on their own [126]. It was found that the theta band was important, that is, the higher the values of the normalized power, the higher the chance of recovery (<42 days) [59]. Furthermore, the power of delta frequencies also performed better at predicting the outcome (follow-up 589.26 ± 1125.32 days) than indexing consciousness [66]. Bareham et al. were able to predict the CRS-R of the follow-up measurement (three months later) by the present EEG recordings [69].
Functional Connectivity
The strength as well as the number of functional connections was statistically higher in the first assessment (three months post-injury) for patients who recovered (three months later) in comparison to patients who did not recover [127]. Parietal and fronto-parietal coherence could predict recovery from UWS to MCS in a follow-up measurement 12 months later [63]. Moreover, it was shown that coherences for all frequencies were higher for patients with an improved outcome (follow-up 589.26 ± 1125.32 days). Focusing on the imaginary part of coherence, only the beta band could reach significant results [66]. Another study showed that delta frequency network centrality could predict the outcome after one year [128]. Moreover, weighted symbolic mutual information and transfer entropy were also effective measures for predicting the outcome (follow-up 589.26 ± 1125.32 days) [66]. Frontal quadratic phase self-coupling in the theta band significantly differentiated between patients who recovered and those who did not (follow-up three months) [34].
Graph Theory
Non-traumatic patients who had a positive outcome (after one year) showed significantly higher mesoscale modularity within the delta band, while traumatic patients showed significantly higher microscale clustering coefficients for networks of the delta frequency [128]. The average clustering coefficient calculated from thresholding alpha and beta coherences predicted the outcome for a follow-up after evaluation of 589.26 ± 1125.32 days (the thresholding did not have much effect). The clustering coefficient in the theta range also showed significant results, whereas the path length failed to provide significant results [66]. A lower clustering coefficient, as well as a higher path length variance and modularity, was reported for patients with a favorable outcome (three months later) compared to those with an unfavorable outcome, at a group level. Considering all features, the variance of the path length had the best positive predictive value for a favorable outcome as well as specificity for an unfavorable outcome [129].
Microstates
Microstate A, the first of the four global microstates, was the most informative one for prediction (follow-up after 589.26 ± 1125.32 days), i.e., the duration of this state in the delta band, the frequency and percentage of time spent in this state in the theta band and the frequency of the microstate in the band from 2 to 20 Hz were all significant [66].
Nonlinear Measures
Patients who recovered (one year post-insult) had higher bispectral indices than those who did not [44]. UWS patients who had the lowest approximate entropy values remained in UWS or died (6 months later). On the other hand, patients with the highest values of approximate entropy became MCS patients or even better [49]. Approximate entropy in the alpha band was successful when predicting the outcome (follow-up after 589.26 ± 1125.32 days) but performed worse than permutation entropy in the delta and theta bands [66].
3.2.2. Sleep Patterns
Sleep patterns seem to be a good indicator for recovery—see Table 5 for an overview. The appearance of organized sleep patterns predicted a positive outcome (3–34 months later) [130]. A better outcome (follow-up 18.5 ± 9.9 months) was correlated with the visual index indication of sleep integrity, and adding a quantitative sleep index further empowered the prediction [131]. Another study also reported a significant correlation between the consciousness state (conscious including MCS+, MCS−, EMCS and conscious without DOC, vs. non-conscious, including UWS and death) after one month for patients initially in a coma and the on-admission sleep EEG patterns [132]. Focusing just on REM sleep, no significant differences between UWS patients who recovered after 6 months and those who did not were found [80]. The presence of sleep spindles is related to a clinical improvement after 6 months [84]. Parietal sleep spindles were even linearly correlated with the outcome (1–150 months) [89]. Parietal slow-wave activity build-up was lowest in children who had a poor outcome (time interval between 16.1 and 1.5 months) [88].
Table 5.
Overview of findings for prognosis and sleep patterns; abbreviations can be found in Abbreviation.
3.2.3. Evoked Potentials
The results of the papers dealing with prognosis and evoked potentials can be found in Table 6. In one study, all but one patient who showed a parietal component in the late part of the P300 woke up (defined as good recovery, moderate or severe disability) three months after coma onset [133]. A detectable P300 was found more often in post-traumatic UWS patients who regained consciousness one year later compared to those who did not [134]. However, another paper reported that a P300 was found in many UWS and MCS patients, but it was not correlated with outcome (2–14 years) [135]. Patients with a two-peak P300 to the oddball own name paradigm had a higher chance of recovering within a short time [109]. Another study found no correlation with the outcome (6 months post-injury) and EEG background activity or the P300 to event-related potentials [136]. MMN was related to a better outcome (6 months later) [95] and recovery of consciousness (three months later) [98]. A significant relationship between speech N400 occurrence and recovery (2–14 years) was found [135]. Faugeras and colleagues used the protocol by Bekinschtein et al. [137]. They found two UWS patients who showed a neural signature of consciousness by the given protocol. It was also these two patients who showed clinical signs of consciousness after three to four days [138]. In a re-analysis focusing on the global field power, only UWS patients presenting with a global effect showed improved consciousness after the EEG measurement (within three and four days) [102]. Wijnen et al. investigated UWS patients who were regaining consciousness using visual stimuli. They also assessed the long-term outcome (two to three years later) and found that visual evoked potentials from the first measurement were related to the long-term outcome [106]. Xu et al. reported that somatosensory evoked potentials were correlated with outcome (one year later) [139].
Table 6.
Overview of findings for prognosis and evoked potentials; abbreviations can be found in Abbreviation.
4. Conclusions and Discussion
4.1. Diagnosis
Many studies investigated the power spectra of UWS and MCS patients. The conclusion of these papers is that the delta power and the power ratio index are lower in MCS when compared to UWS, while the alpha power is higher in MCS patients than in UWS patients. The connectivity measures reveal that connectivity, dynamic functional connectivity, the imaginary part of coherence, phase lag entropy, the phase lag index, quadratic self-coupling in the alpha band, transfer entropy and weighted symbolic mutual information are all higher with a higher level of consciousness. Coherence, the phase locking index in the delta band and quadratic self-coupling in the theta band were lower for MCS than for UWS patients. The graph theory part showed a higher clustering coefficient, hub vulnerability, network integration and local and global efficiency in the alpha band, but a lower characteristic path length and network segregation for a higher consciousness level. Furthermore, more microstates are correlated with higher consciousness. From the nonlinear dynamics section, we learn that the bispectral index, approximate entropy, entropy, Lempel–Ziv complexity, Kolmogorov–Chaitin complexity and permutation entropy are all higher in MCS than in UWS patients. The section about sleep in DOC patients (Section 3.1.2) shows us that REM duration, sleep spindle occurrence and spindle power are increased with increased consciousness, i.e., these parameters are higher in MCS than in UWS patients. The last diagnostic section about evoked potentials (Section 3.1.3) lets us conclude that the N100, N400, P200, P300, MMN, LPC, global effect and visual evoked potentials have greater values for MCS compared to UWS patients. Some measures, e.g., slow-wave sleep and theta power, have been found to be higher with higher consciousness in some studies, whereas the opposite was reported in other papers. For a full summary of the different parameters and the diagnostic values including references, see Table 7.
Table 7.
Overview of different values and their correlation with consciousness; abbreviations can be found in Abbreviation. d is Cohen’s d and the values in parenthesis are the confidence intervals. Fz, Cz, Pz, Oz refer to the EEG electrodes’ location. Papers that do not present enough data to calculate Cohen’s d are not included in the table.
4.2. Prognosis
Considering prognosis, the consensus is that higher values indicate a better prognosis for nearly all measurements of the alpha power, approximate entropy, bispectral index, coherence, entropy, global effect, mesoscale modularity in the delta band, microscale clustering coefficient in the delta band, MMN, modified Valente‘s grade, modularity, N400, number of functional connections, organized sleep patterns, P300, partial coherence, quadratic phase self-coupling in the theta band, sleep spindles, slow-wave build-up, strength of functional connections, theta normalized power, fast theta power, transfer entropy, variance of path length, visual evoked potentials and weighted symbolic mutual information in the alpha band. The only parameters which are higher for worse outcome are characteristic path length, delta power, network centrality in the delta band and slow theta power. The results considering the clustering coefficient were mixed. Table 8 shows an overview of all parameters for prognosis with their respective references.
Table 8.
Overview of different values and the correlation with better outcome; abbreviations can be found in Abbreviation. d is Cohen’s d and the values in parenthesis are the confidence intervals. Papers that do not present enough data to calculate Cohen’s d are not included in the table.
4.3. Conclusions
In this narrative review, we discussed different metrics that can be extracted from EEG. However, not all of these measures have been equally well investigated and, thus, not all of them can be immediately clinically applied. The measures that are most often reported are alpha and delta power. These are easy to calculate and seem to provide conclusive results and as such should be brought into clinical practice. The theta band, even though often reported, does not seem to provide any conclusive results and as such should be investigated in further studies before bringing it into clinical practice. Sleep EEG is often used and reveals consistent results. The P300 is another measure that should be used in clinical practice because several papers are published on this topic with matching results.
What also has to be kept in mind is that the sample size of the different papers varies a lot. This means that not all results are equally trustworthy. The results of studies which include more subjects and have smaller confidence intervals for their parameters can be seen as more reliable, whereas studies with small sample sizes or large confidence intervals need to be treated with caution.
Concluding our review, we can say that the diagnosis and prognosis of DOC patients are still very difficult tasks. However, QEEG, especially resting-state analysis and sleep patterns, should become a part of the daily routine when treating these patients because it is easy to measure and provides conclusive results.
Author Contributions
Conceptualization, B.W., S.M.G. and E.T.; methodology, B.W., S.M.G. and E.T.; validation, K.L., A.B.K., S.L., K.S., A.T. and J.B.; investigation, B.W. and P.B.L.; data curation, B.W. and P.B.L.; writing—original draft preparation, B.W.; writing—review and editing, K.L., P.B.L., A.B.K., S.L., K.S., A.T., J.B. and E.T.; supervision, E.T.; project administration, E.T. All authors (except S.M.G., who deceased on 7 November 2020) have read and agreed to the published version of the manuscript.
Funding
This research received no external funding.
Acknowledgments
B.W. and K.L. thank Masayuki Murata for his support during the preparation of this manuscript.
Conflicts of Interest
The authors declare no conflict of interest.
Abbreviation
| Abbreviation | Meaning |
| AUC | Area Under the Curve |
| CNC | Coma/Near Coma |
| CRS | Coma Recovery Scale |
| CRS-R | Coma Recovery Scale-Revised |
| CS | Conscious Subject |
| DOC | Disorders of Consciousness |
| DRS | Disability Rating Scale |
| EEG | Electroencephalogram |
| EMCS | Emerging Minimally Conscious State |
| fMRI | Functional Magnetic Resonance Imaging |
| GCS | Glasgow Coma Scale |
| GOS | Glasgow Outcome Scale |
| GOS-E | Glasgow Outcome Scale-Extended |
| GLS | Glasgow–Liège Scale |
| HC | Healthy Control |
| ICS | Innsbruck Coma Sale |
| LIS | Locked-In Syndrome |
| LPC | Late Positive Component |
| MCS | Minimally Conscious State |
| MCS+ | Minimally Conscious State Plus |
| MCS− | Minimally Conscious State Minus |
| MMN | Mismatch Negativity |
| Ms | Milliseconds |
| OFN | Other First Name |
| OR | Odds Ratio |
| PET | Positron Emission Tomography |
| QEEG | Quantitative Electroencephalogram |
| REM | Rapid Eye Movement |
| Sd | Standard Deviation |
| SND | Severe Neurocognitive Disorder |
| SON | Subject’s Own Name |
| TC | Tetraplegic Controls |
| TMS | Transcranial Magnetic Stimulation |
| UWS | Unresponsive Wakefulness Syndrome |
| WHIM | Wessex Head Injury Matrix |
References
- Siman-Tov, M.; Radomislensky, I.; Israel Trauma Group; Peleg, K. Reduction in trauma mortality in Israel during the last decade (2000–2010): The impact of changes in the trauma system. Injury 2013, 44, 1448–1452. [Google Scholar] [CrossRef]
- Plum, F.; Posner, J.B. Diagnosis of Stupor and Coma, 4th ed.; F. A. Davis Company: Philadelphia, PA, USA, 1966. [Google Scholar]
- Xie, Q.; Ni, X.; Yu, R.; Li, Y.; Huang, R. Chronic disorders of consciousness. Exp. Ther. Med. 2017, 14, 1277–1283. [Google Scholar] [CrossRef]
- Giacino, J.T.; Ashwal, S.; Childs, N.; Cranford, R.; Jennett, B.; Katz, D.I.; Kelly, J.P.; Rosenberg, J.H.; Whyte, J.; Zafonte, R.D.; et al. The minimally conscious state: Definition and diagnostic criteria. Neurology 2002, 58, 349–353. [Google Scholar] [CrossRef]
- Kretschmer, E. Das apallische Syndrom. Z. Für Gesamte Neurol. Psychiatr. 1940, 169, 576–579. [Google Scholar] [CrossRef]
- Gerstenbrand, F. Das Traumatische Apallische Syndrom: Klinik, Morphologie, Pathophysiologie und Behandlung; Springer: Wien, Austria, 1967; ISBN 978-3-7091-8168-3. [Google Scholar]
- Jennett, B.; Plum, F. Persistent vegetative state after brain damage. A syndrome in search of a name. Lancet Lond. Engl. 1972, 1, 734–737. [Google Scholar] [CrossRef]
- Von Wild, K.; Laureys, S.T.; Gerstenbrand, F.; Dolce, G.; Onose, G. The vegetative state—A syndrome in search of a name. J. Med. Life 2012, 5, 3–15. [Google Scholar]
- Bruno, M.-A.; Vanhaudenhuyse, A.; Thibaut, A.; Moonen, G.; Laureys, S. From unresponsive wakefulness to minimally conscious PLUS and functional locked-in syndromes: Recent advances in our understanding of disorders of consciousness. J. Neurol. 2011, 258, 1373–1384. [Google Scholar] [CrossRef]
- Bodart, O.; Laureys, S.; Gosseries, O. Coma and disorders of consciousness: Scientific advances and practical considerations for clinicians. Semin. Neurol. 2013, 33, 83–90. [Google Scholar] [CrossRef]
- Leon-Carrion, J.; Martin-Rodriguez, J.F.; Damas-Lopez, J.; Barroso y Martin, J.M.; Dominguez-Morales, M.R. Brain function in the minimally conscious state: A quantitative neurophysiological study. Clin. Neurophysiol. 2008, 119, 1506–1514. [Google Scholar] [CrossRef]
- Wu, D.-Y.; Cai, G.; Yuan, Y.; Liu, L.; Li, G.-Q.; Song, W.-Q.; Wang, M.-B. Application of nonlinear dynamics analysis in assessing unconsciousness: A preliminary study. Clin. Neurophysiol. 2011, 122, 490–498. [Google Scholar] [CrossRef]
- Seel, R.; Sherer, M.; Whyte, J.; Katz, D.; Giacino, J.; Rosenbaum, A.; Hammond, F.; Kalmar, K.; Pape, T.; Zafonte, R.; et al. Assessment Scales for Disorders of Consciousness: Evidence-Based Recommendations for Clinical Practice and Research. Arch. Phys. Med. Rehabil. 2010, 91, 1795–1813. [Google Scholar] [CrossRef]
- Teasdale, G.; Jennett, B. Assessment of coma and impaired consciousness. A practical scale. Lancet Lond. Engl. 1974, 2, 81–84. [Google Scholar] [CrossRef]
- Born, J.D. The Glasgow-Liège Scale. Acta Neurochir. (Wien.) 1988, 91, 1–11. [Google Scholar] [CrossRef]
- Benzer, A.; Mitterschiffthaler, G.; Marosi, M.; Luef, G.; Pühringer, F.; De La Renotiere, K.; Lehner, H.; Schmutzhard, E. Prediction of non-survival after trauma: Innsbruck Coma Scale. Lancet Lond. Engl. 1991, 338, 977–978. [Google Scholar] [CrossRef]
- Shiel, A.; Horn, S.A.; Wilson, B.A.; Watson, M.J.; Campbell, M.J.; McLellan, D.L. The Wessex Head Injury Matrix (WHIM) main scale: A preliminary report on a scale to assess and monitor patient recovery after severe head injury. Clin. Rehabil. 2000, 14, 408–416. [Google Scholar] [CrossRef]
- Giacino, J.T.; Kalmar, K.; Whyte, J. The JFK Coma Recovery Scale-Revised: Measurement characteristics and diagnostic utility. Arch. Phys. Med. Rehabil. 2004, 85, 2020–2029. [Google Scholar] [CrossRef]
- Rappaport, M.; Hall, K.M.; Hopkins, K.; Belleza, T.; Cope, D.N. Disability rating scale for severe head trauma: Coma to community. Arch. Phys. Med. Rehabil. 1982, 63, 118–123. [Google Scholar]
- Giacino, J.T.; Kezmarsky, M.A.; DeLuca, J.; Cicerone, K.D. Monitoring rate of recovery to predict outcome in minimally responsive patients. Arch. Phys. Med. Rehabil. 1991, 72, 897–901. [Google Scholar] [CrossRef]
- Rappaport, M. The Disability Rating and Coma/Near-Coma scales in evaluating severe head injury. Neuropsychol. Rehabil. 2005, 15, 442–453. [Google Scholar] [CrossRef]
- Nuwer, M. Assessment of digital EEG, quantitative EEG, and EEG brain mapping: Report of the American Academy of Neurology and the American Clinical Neurophysiology Society*. Neurology 1997, 49, 277–292. [Google Scholar] [CrossRef]
- Giacino, J.T.; Schnakers, C.; Rodriguez-Moreno, D.; Kalmar, K.; Schiff, N.; Hirsch, J. Behavioral assessment in patients with disorders of consciousness: Gold standard or fool’s gold? Prog. Brain Res. 2009, 177, 33–48. [Google Scholar]
- Song, M.; Yang, Y.; Yang, Z.; Cui, Y.; Yu, S.; He, J.; Jiang, T. Prognostic models for prolonged disorders of consciousness: An integrative review. Cell. Mol. Life Sci. CMLS 2020, 77, 3945–3961. [Google Scholar] [CrossRef]
- Bai, Y.; Xia, X.; Li, X. A Review of Resting-State Electroencephalography Analysis in Disorders of Consciousness. Front. Neurol. 2017, 8, 471. [Google Scholar] [CrossRef]
- Corchs, S.; Chioma, G.; Dondi, R.; Gasparini, F.; Manzoni, S.; Markowska-Kacznar, U.; Mauri, G.; Zoppis, I.; Morreale, A. Computational Methods for Resting-State EEG of Patients With Disorders of Consciousness. Front. Neurosci. 2019, 13, 807. [Google Scholar] [CrossRef] [PubMed]
- Annen, J.; Laureys, S.; Gosseries, O. Brain-computer interfaces for consciousness assessment and communication in severely brain-injured patients. Handb. Clin. Neurol. 2020, 168, 137–152. [Google Scholar]
- Bai, Y.; Lin, Y.; Ziemann, U. Managing disorders of consciousness: The role of electroencephalography. J. Neurol. 2020. [Google Scholar] [CrossRef]
- Comanducci, A.; Boly, M.; Claassen, J.; De Lucia, M.; Gibson, R.M.; Juan, E.; Laureys, S.; Naccache, L.; Owen, A.M.; Rosanova, M.; et al. Clinical and advanced neurophysiology in the prognostic and diagnostic evaluation of disorders of consciousness: Review of an IFCN-endorsed expert group. Clin. Neurophysiol. 2020, 131, 2736–2765. [Google Scholar] [CrossRef] [PubMed]
- Jain, R.; Ramakrishnan, A.G. Electrophysiological and Neuroimaging Studies-During Resting State and Sensory Stimulation in Disorders of Consciousness: A Review. Front. Neurosci. 2020, 14, 555093. [Google Scholar] [CrossRef]
- Ragazzoni, A.; Cincotta, M.; Giovannelli, F.; Cruse, D.; Young, G.B.; Miniussi, C.; Rossi, S. Clinical neurophysiology of prolonged disorders of consciousness: From diagnostic stimulation to therapeutic neuromodulation. Clin. Neurophysiol. 2017, 128, 1629–1646. [Google Scholar] [CrossRef]
- Li, X.; Li, C.; Hu, N.; Wang, T. Music Interventions for Disorders of Consciousness: A Systematic Review and Meta-analysis. J. Neurosci. Nurs. J. Am. Assoc. Neurosci. Nurses 2020, 52, 146–151. [Google Scholar] [CrossRef] [PubMed]
- Kotchoubey, B. Evoked and event-related potentials in disorders of consciousness: A quantitative review. Conscious. Cogn. 2017, 54, 155–167. [Google Scholar] [CrossRef]
- Bai, Y.; Xia, X.; Wang, Y.; He, J.; Li, X. Electroencephalography quadratic phase self-coupling correlates with consciousness states and restoration in patients with disorders of consciousness. Clin. Neurophysiol. 2019, 130, 1235–1242. [Google Scholar] [CrossRef]
- Noirhomme, Q.; Brecheisen, R.; Lesenfants, D.; Antonopoulos, G.; Laureys, S. “Look at my classifier’s result”: Disentangling unresponsive from (minimally) conscious patients. NeuroImage 2017, 145, 288–303. [Google Scholar] [CrossRef]
- Fidali, B.C.; Stevens, R.D.; Claassen, J. Novel approaches to prediction in severe brain injury. Curr. Opin. Neurol. 2020, 33, 669–675. [Google Scholar] [CrossRef]
- Cohen, J. Statistical Power Analysis for the Behavioral Sciences; Academic Press: Cambridge, MA, USA, 2013; ISBN 978-1-4832-7648-9. [Google Scholar]
- R Core Team. R: A Language and Environment for Statistical Computing; R Foundation for Statistical Computing: Vienna, Austria, 2020; Available online: https://www.R-project.org/ (accessed on 17 May 2021).
- Lenhard, W.; Lenhard, A. Calculation of Effect Sizes. Dettelb. (Germany) Psychom. 2016. Available online: https://www.psychometrica.de/effect_size.html (accessed on 17 May 2021). [CrossRef]
- Salgado, J.F. Transforming the Area under the Normal Curve (AUC) into Cohen’s d, Pearson’s rpb, Odds-Ratio, and Natural Log Odds-Ratio: Two Conversion Tables. Eur. J. Psychol. Appl. Leg. Context 2018, 10, 35–47. [Google Scholar] [CrossRef]
- Cooper, H.; Hedges, L.V.; Hedges, P.L.V. The Handbook of Research Synthesis; Russell Sage Foundation: New York, NY, USA, 1994; ISBN 978-0-87154-226-7. [Google Scholar]
- Page, M.J.; McKenzie, J.E.; Bossuyt, P.M.; Boutron, I.; Hoffmann, T.C.; Mulrow, C.D.; Shamseer, L.; Tetzlaff, J.M.; Akl, E.A.; Brennan, S.E.; et al. The PRISMA 2020 statement: An updated guideline for reporting systematic reviews. BMJ 2021, 372, n71. [Google Scholar] [CrossRef] [PubMed]
- Schnakers, C.; Majerus, S.; Laureys, S. Bispectral analysis of electroencephalogram signals during recovery from coma: Preliminary findings. Neuropsychol. Rehabil. 2005, 15, 381–388. [Google Scholar] [CrossRef]
- Schnakers, C.; Ledoux, D.; Majerus, S.; Damas, P.; Damas, F.; Lambermont, B.; Lamy, M.; Boly, M.; Vanhaudenhuyse, A.; Moonen, G.; et al. Diagnostic and prognostic use of bispectral index in coma, vegetative state and related disorders. Brain Inj. 2008, 22, 926–931. [Google Scholar] [CrossRef]
- Babiloni, C.; Pistoia, F.; Sarà, M.; Vecchio, F.; Buffo, P.; Conson, M.; Onorati, P.; Albertini, G.; Rossini, P.M. Resting state eyes-closed cortical rhythms in patients with locked-in-syndrome: An EEG study. Clin. Neurophysiol. 2010, 121, 1816–1824. [Google Scholar] [CrossRef]
- Pollonini, L.; Pophale, S.; Situ, N.; Wu, M.-H.; Frye, R.E.; Leon-Carrion, J.; Zouridakis, G. Information communication networks in severe traumatic brain injury. Brain Topogr. 2010, 23, 221–226. [Google Scholar] [CrossRef]
- Sarà, M.; Pistoia, F. Complexity loss in physiological time series of patients in a vegetative state. Nonlinear Dyn. Psychol. Life Sci. 2010, 14, 1–13. [Google Scholar]
- Gosseries, O.; Schnakers, C.; Ledoux, D.; Vanhaudenhuyse, A.; Bruno, M.-A.; Demertzi, A.; Noirhomme, Q.; Lehembre, R.; Damas, P.; Goldman, S.; et al. Automated EEG entropy measurements in coma, vegetative state/unresponsive wakefulness syndrome and minimally conscious state. Funct. Neurol. 2011, 26, 25–30. [Google Scholar]
- Sarà, M.; Pistoia, F.; Pasqualetti, P.; Sebastiano, F.; Onorati, P.; Rossini, P.M. Functional isolation within the cerebral cortex in the vegetative state: A nonlinear method to predict clinical outcomes. Neurorehabil. Neural Repair 2011, 25, 35–42. [Google Scholar] [CrossRef]
- Wu, D.; Cai, G.; Zorowitz, R.D.; Yuan, Y.; Wang, J.; Song, W. Measuring interconnection of the residual cortical functional islands in persistent vegetative state and minimal conscious state with EEG nonlinear analysis. Clin. Neurophysiol. 2011, 122, 1956–1966. [Google Scholar] [CrossRef]
- Fingelkurts, A.A.; Fingelkurts, A.A.; Bagnato, S.; Boccagni, C.; Galardi, G. EEG oscillatory states as neuro-phenomenology of consciousness as revealed from patients in vegetative and minimally conscious states. Conscious. Cogn. 2012, 21, 149–169. [Google Scholar] [CrossRef]
- Lehembre, R.; Marie-Aurélie, B.; Vanhaudenhuyse, A.; Chatelle, C.; Cologan, V.; Leclercq, Y.; Soddu, A.; Macq, B.; Laureys, S.; Noirhomme, Q. Resting-state EEG study of comatose patients: A connectivity and frequency analysis to find differences between vegetative and minimally conscious states. Funct. Neurol. 2012, 27, 41–47. [Google Scholar]
- Leon-Carrion, J.; Leon-Dominguez, U.; Pollonini, L.; Wu, M.-H.; Frye, R.E.; Dominguez-Morales, M.R.; Zouridakis, G. Synchronization between the anterior and posterior cortex determines consciousness level in patients with traumatic brain injury (TBI). Brain Res. 2012, 1476, 22–30. [Google Scholar] [CrossRef]
- King, J.-R.; Sitt, J.D.; Faugeras, F.; Rohaut, B.; El Karoui, I.; Cohen, L.; Naccache, L.; Dehaene, S. Information sharing in the brain indexes consciousness in noncommunicative patients. Curr. Biol. CB 2013, 23, 1914–1919. [Google Scholar] [CrossRef]
- Lechinger, J.; Bothe, K.; Pichler, G.; Michitsch, G.; Donis, J.; Klimesch, W.; Schabus, M. CRS-R score in disorders of consciousness is strongly related to spectral EEG at rest. J. Neurol. 2013, 260, 2348–2356. [Google Scholar] [CrossRef]
- Chennu, S.; Finoia, P.; Kamau, E.; Allanson, J.; Williams, G.B.; Monti, M.M.; Noreika, V.; Arnatkeviciute, A.; Canales-Johnson, A.; Olivares, F.; et al. Spectral signatures of reorganised brain networks in disorders of consciousness. PLoS Comput. Biol. 2014, 10, e1003887. [Google Scholar] [CrossRef]
- Höller, Y.; Thomschewski, A.; Bergmann, J.; Kronbichler, M.; Crone, J.S.; Schmid, E.V.; Butz, K.; Höller, P.; Nardone, R.; Trinka, E. Connectivity biomarkers can differentiate patients with different levels of consciousness. Clin. Neurophysiol. 2014, 125, 1545–1555. [Google Scholar] [CrossRef]
- Marinazzo, D.; Gosseries, O.; Boly, M.; Ledoux, D.; Rosanova, M.; Massimini, M.; Noirhomme, Q.; Laureys, S. Directed information transfer in scalp electroencephalographic recordings: Insights on disorders of consciousness. Clin. EEG Neurosci. 2014, 45, 33–39. [Google Scholar] [CrossRef]
- Sitt, J.D.; King, J.-R.; El Karoui, I.; Rohaut, B.; Faugeras, F.; Gramfort, A.; Cohen, L.; Sigman, M.; Dehaene, S.; Naccache, L. Large scale screening of neural signatures of consciousness in patients in a vegetative or minimally conscious state. Brain J. Neurol. 2014, 137, 2258–2270. [Google Scholar] [CrossRef] [PubMed]
- Rossi Sebastiano, D.; Panzica, F.; Visani, E.; Rotondi, F.; Scaioli, V.; Leonardi, M.; Sattin, D.; D’Incerti, L.; Parati, E.; Ferini Strambi, L.; et al. Significance of multiple neurophysiological measures in patients with chronic disorders of consciousness. Clin. Neurophysiol. 2015, 126, 558–564. [Google Scholar] [CrossRef]
- Naro, A.; Bramanti, P.; Leo, A.; Cacciola, A.; Bramanti, A.; Manuli, A.; Calabrò, R.S. Towards a method to differentiate chronic disorder of consciousness patients’ awareness: The Low-Resolution Brain Electromagnetic Tomography Analysis. J. Neurol. Sci. 2016, 368, 178–183. [Google Scholar] [CrossRef] [PubMed]
- Piarulli, A.; Bergamasco, M.; Thibaut, A.; Cologan, V.; Gosseries, O.; Laureys, S. EEG ultradian rhythmicity differences in disorders of consciousness during wakefulness. J. Neurol. 2016, 263, 1746–1760. [Google Scholar] [CrossRef]
- Schorr, B.; Schlee, W.; Arndt, M.; Bender, A. Coherence in resting-state EEG as a predictor for the recovery from unresponsive wakefulness syndrome. J. Neurol. 2016, 263, 937–953. [Google Scholar] [CrossRef]
- Thul, A.; Lechinger, J.; Donis, J.; Michitsch, G.; Pichler, G.; Kochs, E.F.; Jordan, D.; Ilg, R.; Schabus, M. EEG entropy measures indicate decrease of cortical information processing in Disorders of Consciousness. Clin. Neurophysiol. 2016, 127, 1419–1427. [Google Scholar] [CrossRef] [PubMed]
- Naro, A.; Bramanti, A.; Leo, A.; Cacciola, A.; Manuli, A.; Bramanti, P.; Calabrò, R.S. Shedding new light on disorders of consciousness diagnosis: The dynamic functional connectivity. Cortex 2018, 103, 316–328. [Google Scholar] [CrossRef]
- Stefan, S.; Schorr, B.; Lopez-Rolon, A.; Kolassa, I.-T.; Shock, J.P.; Rosenfelder, M.; Heck, S.; Bender, A. Consciousness Indexing and Outcome Prediction with Resting-State EEG in Severe Disorders of Consciousness. Brain Topogr. 2018, 31, 848–862. [Google Scholar] [CrossRef] [PubMed]
- Cacciola, A.; Naro, A.; Milardi, D.; Bramanti, A.; Malatacca, L.; Spitaleri, M.; Leo, A.; Muscoloni, A.; Cannistraci, C.V.; Bramanti, P.; et al. Functional Brain Network Topology Discriminates between Patients with Minimally Conscious State and Unresponsive Wakefulness Syndrome. J. Clin. Med. 2019, 8, 306. [Google Scholar] [CrossRef] [PubMed]
- Rizkallah, J.; Annen, J.; Modolo, J.; Gosseries, O.; Benquet, P.; Mortaheb, S.; Amoud, H.; Cassol, H.; Mheich, A.; Thibaut, A.; et al. Decreased integration of EEG source-space networks in disorders of consciousness. NeuroImage Clin. 2019, 23, 101841. [Google Scholar] [CrossRef] [PubMed]
- Bareham, C.A.; Roberts, N.; Allanson, J.; Hutchinson, P.J.A.; Pickard, J.D.; Menon, D.K.; Chennu, S. Bedside EEG predicts longitudinal behavioural changes in disorders of consciousness. NeuroImage Clin. 2020, 28, 102372. [Google Scholar] [CrossRef] [PubMed]
- Cai, L.; Wang, J.; Guo, Y.; Lu, M.; Dong, Y.; Wei, X. Altered inter-frequency dynamics of brain networks in disorder of consciousness. J. Neural Eng. 2020, 17, 036006. [Google Scholar] [CrossRef]
- Naro, A.; Maggio, M.G.; Leo, A.; Calabrò, R.S. Multiplex and Multilayer Network EEG Analyses: A Novel Strategy in the Differential Diagnosis of Patients with Chronic Disorders of Consciousness. Int. J. Neural Syst. 2020, 2050052. [Google Scholar] [CrossRef]
- Lutkenhoff, E.S.; Nigri, A.; Rossi Sebastiano, D.; Sattin, D.; Visani, E.; Rosazza, C.; D’Incerti, L.; Bruzzone, M.G.; Franceschetti, S.; Leonardi, M.; et al. EEG Power spectra and subcortical pathology in chronic disorders of consciousness. Psychol. Med. 2020, 1–10. [Google Scholar] [CrossRef]
- Coleman, M.R.; Menon, D.K.; Fryer, T.D.; Pickard, J.D. Neurometabolic coupling in the vegetative and minimally conscious states: Preliminary findings. J. Neurol. Neurosurg. Psychiatry 2005, 76, 432–434. [Google Scholar] [CrossRef] [PubMed]
- Saletu, B.; Anderer, P.; Saletu-Zyhlarz, G.M. EEG Topography and Tomography (LORETA) in the Classification and Evaluation of the Pharmacodynamics of Psychotropic Drugs. Clin. EEG Neurosci. 2006, 37, 66–80. [Google Scholar] [CrossRef]
- Bastos, A.M.; Schoffelen, J.-M. A Tutorial Review of Functional Connectivity Analysis Methods and Their Interpretational Pitfalls. Front. Syst. Neurosci. 2016, 9, 175. [Google Scholar] [CrossRef]
- Hutchison, R.M.; Womelsdorf, T.; Allen, E.A.; Bandettini, P.A.; Calhoun, V.D.; Corbetta, M.; Penna, S.D.; Duyn, J.H.; Glover, G.H.; Gonzalez-Castillo, J.; et al. Dynamic functional connectivity: Promise, issues, and interpretations. NeuroImage 2013, 80, 360–378. [Google Scholar] [CrossRef] [PubMed]
- Sporns, O. Networks of the Brain; MIT Press: Cambridge, MA, USA, 2010; ISBN 978-0-262-28892-7. [Google Scholar]
- Kaminski, M.; Blinowska, K.J. Is Graph Theoretical Analysis a Useful Tool for Quantification of Connectivity Obtained by Means of EEG/MEG Techniques? Front. Neural Circuits 2018, 12, 76. [Google Scholar] [CrossRef] [PubMed]
- Michel, C.M.; Koenig, T. EEG microstates as a tool for studying the temporal dynamics of whole-brain neuronal networks: A review. NeuroImage 2018, 180, 577–593. [Google Scholar] [CrossRef] [PubMed]
- Oksenberg, A.; Gordon, C.; Arons, E.; Sazbon, L. Phasic activities of rapid eye movement sleep in vegetative state patients. Sleep 2001, 24, 703–706. [Google Scholar] [CrossRef] [PubMed]
- Landsness, E.; Bruno, M.-A.; Noirhomme, Q.; Riedner, B.; Gosseries, O.; Schnakers, C.; Massimini, M.; Laureys, S.; Tononi, G.; Boly, M. Electrophysiological correlates of behavioural changes in vigilance in vegetative state and minimally conscious state. Brain J. Neurol. 2011, 134, 2222–2232. [Google Scholar] [CrossRef] [PubMed]
- Mertel, I.; Pavlov, Y.G.; Barner, C.; Müller, F.; Diekelmann, S.; Kotchoubey, B. Sleep in disorders of consciousness: Behavioral and polysomnographic recording. BMC Med. 2020, 18, 350. [Google Scholar] [CrossRef]
- Rossi Sebastiano, D.; Visani, E.; Panzica, F.; Sattin, D.; Bersano, A.; Nigri, A.; Ferraro, S.; Parati, E.; Leonardi, M.; Franceschetti, S. Sleep patterns associated with the severity of impairment in a large cohort of patients with chronic disorders of consciousness. Clin. Neurophysiol. 2018, 129, 687–693. [Google Scholar] [CrossRef]
- Cologan, V.; Drouot, X.; Parapatics, S.; Delorme, A.; Gruber, G.; Moonen, G.; Laureys, S. Sleep in the unresponsive wakefulness syndrome and minimally conscious state. J. Neurotrauma 2013, 30, 339–346. [Google Scholar] [CrossRef]
- Malinowska, U.; Chatelle, C.; Bruno, M.-A.; Noirhomme, Q.; Laureys, S.; Durka, P.J. Electroencephalographic profiles for differentiation of disorders of consciousness. Biomed. Eng. Online 2013, 12, 109. [Google Scholar] [CrossRef] [PubMed]
- De Biase, S.; Gigli, G.L.; Lorenzut, S.; Bianconi, C.; Sfreddo, P.; Rossato, G.; Basaldella, F.; Fuccaro, M.; Corica, A.; Tonon, D.; et al. The importance of polysomnography in the evaluation of prolonged disorders of consciousness: Sleep recordings more adequately correlate than stimulus-related evoked potentials with patients’ clinical status. Sleep Med. 2014, 15, 393–400. [Google Scholar] [CrossRef] [PubMed]
- Forgacs, P.B.; Conte, M.M.; Fridman, E.A.; Voss, H.U.; Victor, J.D.; Schiff, N.D. Preservation of electroencephalographic organization in patients with impaired consciousness and imaging-based evidence of command-following. Ann. Neurol. 2014, 76, 869–879. [Google Scholar] [CrossRef]
- Mouthon, A.-L.; van Hedel, H.J.A.; Meyer-Heim, A.; Kurth, S.; Ringli, M.; Pugin, F.; Huber, R. High-density electroencephalographic recordings during sleep in children with disorders of consciousness. NeuroImage Clin. 2016, 11, 468–475. [Google Scholar] [CrossRef]
- Wislowska, M.; Del Giudice, R.; Lechinger, J.; Wielek, T.; Heib, D.P.J.; Pitiot, A.; Pichler, G.; Michitsch, G.; Donis, J.; Schabus, M. Night and day variations of sleep in patients with disorders of consciousness. Sci. Rep. 2017, 7, 266. [Google Scholar] [CrossRef]
- Zieleniewska, M.; Duszyk, A.; Różański, P.; Pietrzak, M.; Bogotko, M.; Durka, P. Parametric Description of EEG Profiles for Assessment of Sleep Architecture in Disorders of Consciousness. Int. J. Neural Syst. 2019, 29, 1850049. [Google Scholar] [CrossRef]
- Chiappa, K.H. Evoked Potentials in Clinical Medicine; Lippincott Williams & Wilkins: Philadelphia, PA, USA, 1997; ISBN 978-0-397-51659-9. [Google Scholar]
- Sloan, T.B.; Jameson, L.; Janik, D. Chapter 7-EVOKED POTENTIALS. In Cottrell and Young’s Neuroanesthesia, 5th ed.; Cottrell, J.E., Young, W.L., Eds.; Mosby: Philadelphia, PA, USA, 2010; pp. 115–130. ISBN 978-0-323-05908-4. [Google Scholar]
- Munte, T.F.; Urbach, T.P.; Duzel, E.; Kutas, M. Event-related brain potentials in the study of human cognition and neuropsychology; Elsevier Science Publishers B.V.: Amsterdam, The Netherlands, 2000; p. 97. [Google Scholar]
- Schoenle, P.W.; Witzke, W. How vegetative is the vegetative state? Preserved semantic processing in VS patients—Evidence from N 400 event-related potentials. NeuroRehabilitation 2004, 19, 329–334. [Google Scholar] [CrossRef] [PubMed]
- Kotchoubey, B.; Lang, S.; Mezger, G.; Schmalohr, D.; Schneck, M.; Semmler, A.; Bostanov, V.; Birbaumer, N. Information processing in severe disorders of consciousness: Vegetative state and minimally conscious state. Clin. Neurophysiol. 2005, 116, 2441–2453. [Google Scholar] [CrossRef]
- Perrin, F.; Schnakers, C.; Schabus, M.; Degueldre, C.; Goldman, S.; Brédart, S.; Faymonville, M.-E.; Lamy, M.; Moonen, G.; Luxen, A.; et al. Brain response to one’s own name in vegetative state, minimally conscious state, and locked-in syndrome. Arch. Neurol. 2006, 63, 562–569. [Google Scholar] [CrossRef]
- Schnakers, C.; Perrin, F.; Schabus, M.; Majerus, S.; Ledoux, D.; Damas, P.; Boly, M.; Vanhaudenhuyse, A.; Bruno, M.-A.; Moonen, G.; et al. Voluntary brain processing in disorders of consciousness. Neurology 2008, 71, 1614–1620. [Google Scholar] [CrossRef] [PubMed]
- Qin, P.; Di, H.; Yan, X.; Yu, S.; Yu, D.; Laureys, S.; Weng, X. Mismatch negativity to the patient’s own name in chronic disorders of consciousness. Neurosci. Lett. 2008, 448, 24–28. [Google Scholar] [CrossRef] [PubMed]
- Fischer, C.; Luaute, J.; Morlet, D. Event-related potentials (MMN and novelty P3) in permanent vegetative or minimally conscious states. Clin. Neurophysiol. 2010, 121, 1032–1042. [Google Scholar] [CrossRef] [PubMed]
- Boly, M. Measuring the fading consciousness in the human brain. Curr. Opin. Neurol. 2011, 24, 394–400. [Google Scholar] [CrossRef]
- Cavinato, M.; Volpato, C.; Silvoni, S.; Sacchetto, M.; Merico, A.; Piccione, F. Event-related brain potential modulation in patients with severe brain damage. Clin. Neurophysiol. 2011, 122, 719–724. [Google Scholar] [CrossRef]
- Faugeras, F.; Rohaut, B.; Weiss, N.; Bekinschtein, T.; Galanaud, D.; Puybasset, L.; Bolgert, F.; Sergent, C.; Cohen, L.; Dehaene, S.; et al. Event related potentials elicited by violations of auditory regularities in patients with impaired consciousness. Neuropsychologia 2012, 50, 403–418. [Google Scholar] [CrossRef]
- Balconi, M.; Arangio, R.; Guarnerio, C. Disorders of consciousness and N400 ERP measures in response to a semantic task. J. Neuropsychiatry Clin. Neurosci. 2013, 25, 237–243. [Google Scholar] [CrossRef]
- Chennu, S.; Finoia, P.; Kamau, E.; Monti, M.M.; Allanson, J.; Pickard, J.D.; Owen, A.M.; Bekinschtein, T.A. Dissociable endogenous and exogenous attention in disorders of consciousness. NeuroImage Clin. 2013, 3, 450–461. [Google Scholar] [CrossRef]
- Risetti, M.; Formisano, R.; Toppi, J.; Quitadamo, L.R.; Bianchi, L.; Astolfi, L.; Cincotti, F.; Mattia, D. On ERPs detection in disorders of consciousness rehabilitation. Front. Hum. Neurosci. 2013, 7, 775. [Google Scholar] [CrossRef]
- Wijnen, V.J.M.; Eilander, H.J.; de Gelder, B.; van Boxtel, G.J.M. Visual processing during recovery from vegetative state to consciousness: Comparing behavioral indices to brain responses. Neurophysiol. Clin. 2014, 44, 457–469. [Google Scholar] [CrossRef] [PubMed]
- Balconi, M.; Arangio, R. The relationship between coma near coma, disability ratings, and event-related potentials in patients with disorders of consciousness: A semantic association task. Appl. Psychophysiol. Biofeedback 2015, 40, 327–337. [Google Scholar] [CrossRef] [PubMed]
- Hauger, S.L.; Schnakers, C.; Andersson, S.; Becker, F.; Moberget, T.; Giacino, J.T.; Schanke, A.-K.; Løvstad, M. Neurophysiological Indicators of Residual Cognitive Capacity in the Minimally Conscious State. Behav. Neurol. 2015, 2015, 145913. [Google Scholar] [CrossRef] [PubMed]
- Li, R.; Song, W.-Q.; Du, J.-B.; Huo, S.; Shan, G.-X. Connecting the P300 to the diagnosis and prognosis of unconscious patients. Neural Regen. Res. 2015, 10, 473–480. [Google Scholar]
- Rohaut, B.; Faugeras, F.; Chausson, N.; King, J.-R.; Karoui, I.E.; Cohen, L.; Naccache, L. Probing ERP correlates of verbal semantic processing in patients with impaired consciousness. Neuropsychologia 2015, 66, 279–292. [Google Scholar] [CrossRef]
- Schnakers, C.; Giacino, J.T.; Løvstad, M.; Habbal, D.; Boly, M.; Di, H.; Majerus, S.; Laureys, S. Preserved covert cognition in noncommunicative patients with severe brain injury? Neurorehabil. Neural Repair 2015, 29, 308–317. [Google Scholar] [CrossRef]
- Beukema, S.; Gonzalez-Lara, L.E.; Finoia, P.; Kamau, E.; Allanson, J.; Chennu, S.; Gibson, R.M.; Pickard, J.D.; Owen, A.M.; Cruse, D. A hierarchy of event-related potential markers of auditory processing in disorders of consciousness. NeuroImage Clin. 2016, 12, 359–371. [Google Scholar] [CrossRef]
- Gibson, R.M.; Chennu, S.; Fernández-Espejo, D.; Naci, L.; Owen, A.M.; Cruse, D. Somatosensory attention identifies both overt and covert awareness in disorders of consciousness. Ann. Neurol. 2016, 80, 412–423. [Google Scholar] [CrossRef]
- Real, R.G.L.; Veser, S.; Erlbeck, H.; Risetti, M.; Vogel, D.; Müller, F.; Kotchoubey, B.; Mattia, D.; Kübler, A. Information processing in patients in vegetative and minimally conscious states. Clin. Neurophysiol. 2016, 127, 1395–1402. [Google Scholar] [CrossRef]
- Erlbeck, H.; Real, R.G.L.; Kotchoubey, B.; Mattia, D.; Bargak, J.; Kübler, A. Basic discriminative and semantic processing in patients in the vegetative and minimally conscious state. Int. J. Psychophysiol. 2017, 113, 8–16. [Google Scholar] [CrossRef] [PubMed]
- Sergent, C.; Faugeras, F.; Rohaut, B.; Perrin, F.; Valente, M.; Tallon-Baudry, C.; Cohen, L.; Naccache, L. Multidimensional cognitive evaluation of patients with disorders of consciousness using EEG: A proof of concept study. NeuroImage Clin. 2017, 13, 455–469. [Google Scholar] [CrossRef] [PubMed]
- Wang, X.-Y.; Wu, H.-Y.; Lu, H.-T.; Huang, T.-T.; Zhang, H.; Zhang, T. Assessment of mismatch negativity and P300 response in patients with disorders of consciousness. Eur. Rev. Med. Pharmacol. Sci. 2017, 21, 4896–4906. [Google Scholar] [PubMed]
- Kempny, A.M.; James, L.; Yelden, K.; Duport, S.; Farmer, S.F.; Diane Playford, E.; Leff, A.P. Patients with a severe prolonged Disorder of Consciousness can show classical EEG responses to their own name compared with others’ names. NeuroImage Clin. 2018, 19, 311–319. [Google Scholar] [CrossRef]
- Rivera-Lillo, G.; Rojas-Líbano, D.; Burgos, P.; Egaña, J.I.; Chennu, S.; Maldonado, P.E. Reduced delta-band modulation underlies the loss of P300 responses in disorders of consciousness. Clin. Neurophysiol. 2018, 129, 2613–2622. [Google Scholar] [CrossRef]
- Annen, J.; Mertel, I.; Xu, R.; Chatelle, C.; Lesenfants, D.; Ortner, R.; Bonin, E.A.C.; Guger, C.; Laureys, S.; Müller, F. Auditory and Somatosensory P3 Are Complementary for the Assessment of Patients with Disorders of Consciousness. Brain Sci. 2020, 10, 748. [Google Scholar] [CrossRef]
- Wu, M.; Li, F.; Wu, Y.; Zhang, T.; Gao, J.; Xu, P.; Luo, B. Impaired Frontoparietal Connectivity in Traumatic Individuals with Disorders of Consciousness: A Dynamic Brain Network Analysis. Aging Dis. 2020, 11, 301–314. [Google Scholar] [CrossRef]
- Garrido, M.I.; Kilner, J.M.; Stephan, K.E.; Friston, K.J. The mismatch negativity: A review of underlying mechanisms. Clin. Neurophysiol. 2009, 120, 453–463. [Google Scholar] [CrossRef]
- Kutas, M.; Federmeier, K.D. Thirty years and counting: Finding meaning in the N400 component of the event related brain potential (ERP). Annu. Rev. Psychol. 2011, 62, 621–647. [Google Scholar] [CrossRef]
- Friedman, D.; Johnson, R. Event-related potential (ERP) studies of memory encoding and retrieval: A selective review. Microsc. Res. Tech. 2000, 51, 6–28. [Google Scholar] [CrossRef]
- Babiloni, C.; Sarà, M.; Vecchio, F.; Pistoia, F.; Sebastiano, F.; Onorati, P.; Albertini, G.; Pasqualetti, P.; Cibelli, G.; Buffo, P.; et al. Cortical sources of resting-state alpha rhythms are abnormal in persistent vegetative state patients. Clin. Neurophysiol. 2009, 120, 719–729. [Google Scholar] [CrossRef] [PubMed]
- Fingelkurts, A.A.; Fingelkurts, A.A.; Bagnato, S.; Boccagni, C.; Galardi, G. Life or death: Prognostic value of a resting EEG with regards to survival in patients in vegetative and minimally conscious States. PLoS ONE 2011, 6, e25967. [Google Scholar] [CrossRef] [PubMed]
- Fingelkurts, A.A.; Fingelkurts, A.A.; Bagnato, S.; Boccagni, C.; Galardi, G. Prognostic value of resting-state electroencephalography structure in disentangling vegetative and minimally conscious states: A preliminary study. Neurorehabil. Neural Repair 2013, 27, 345–354. [Google Scholar] [CrossRef] [PubMed]
- Chennu, S.; Annen, J.; Wannez, S.; Thibaut, A.; Chatelle, C.; Cassol, H.; Martens, G.; Schnakers, C.; Gosseries, O.; Menon, D.; et al. Brain networks predict metabolism, diagnosis and prognosis at the bedside in disorders of consciousness. Brain J. Neurol. 2017, 140, 2120–2132. [Google Scholar] [CrossRef]
- Kustermann, T.; Ata Nguepnjo Nguissi, N.; Pfeiffer, C.; Haenggi, M.; Kurmann, R.; Zubler, F.; Oddo, M.; Rossetti, A.O.; De Lucia, M. Brain functional connectivity during the first day of coma reflects long-term outcome. NeuroImage Clin. 2020, 27, 102295. [Google Scholar] [CrossRef]
- Valente, M.; Placidi, F.; Oliveira, A.J.; Bigagli, A.; Morghen, I.; Proietti, R.; Gigli, G.L. Sleep organization pattern as a prognostic marker at the subacute stage of post-traumatic coma. Clin. Neurophysiol. 2002, 113, 1798–1805. [Google Scholar] [CrossRef]
- Arnaldi, D.; Terzaghi, M.; Cremascoli, R.; De Carli, F.; Maggioni, G.; Pistarini, C.; Nobili, F.; Moglia, A.; Manni, R. The prognostic value of sleep patterns in disorders of consciousness in the sub-acute phase. Clin. Neurophysiol. 2016, 127, 1445–1451. [Google Scholar] [CrossRef]
- Yang, X.; Song, C.; Yuan, F.; Zhao, J.; Jiang, Y.; Yang, F.; Kang, X.; Jiang, W. Prognostic roles of sleep electroencephalography pattern and circadian rhythm biomarkers in the recovery of consciousness in patients with coma: A prospective cohort study. Sleep Med. 2020, 69, 204–212. [Google Scholar] [CrossRef]
- Fischer, C.; Dailler, F.; Morlet, D. Novelty P3 elicited by the subject’s own name in comatose patients. Clin. Neurophysiol. 2008, 119, 2224–2230. [Google Scholar] [CrossRef] [PubMed]
- Cavinato, M.; Freo, U.; Ori, C.; Zorzi, M.; Tonin, P.; Piccione, F.; Merico, A. Post-acute P300 predicts recovery of consciousness from traumatic vegetative state. Brain Inj. 2009, 23, 973–980. [Google Scholar] [CrossRef] [PubMed]
- Steppacher, I.; Eickhoff, S.; Jordanov, T.; Kaps, M.; Witzke, W.; Kissler, J. N400 predicts recovery from disorders of consciousness. Ann. Neurol. 2013, 73, 594–602. [Google Scholar] [CrossRef] [PubMed]
- Estraneo, A.; Fiorenza, S.; Magliacano, A.; Formisano, R.; Mattia, D.; Grippo, A.; Romoli, A.M.; Angelakis, E.; Cassol, H.; Thibaut, A.; et al. Multicenter prospective study on predictors of short-term outcome in disorders of consciousness. Neurology 2020, 95, e1488–e1499. [Google Scholar] [CrossRef]
- Bekinschtein, T.A.; Dehaene, S.; Rohaut, B.; Tadel, F.; Cohen, L.; Naccache, L. Neural signature of the conscious processing of auditory regularities. Proc. Natl. Acad. Sci. USA 2009, 106, 1672–1677. [Google Scholar] [CrossRef] [PubMed]
- Faugeras, F.; Rohaut, B.; Weiss, N.; Bekinschtein, T.A.; Galanaud, D.; Puybasset, L.; Bolgert, F.; Sergent, C.; Cohen, L.; Dehaene, S.; et al. Probing consciousness with event-related potentials in the vegetative state. Neurology 2011, 77, 264–268. [Google Scholar] [CrossRef]
- Xu, W.; Jiang, G.; Chen, Y.; Wang, X.; Jiang, X. Prediction of minimally conscious state with somatosensory evoked potentials in long-term unconscious patients after traumatic brain injury. J. Trauma Acute Care Surg. 2012, 72, 1024–1029. [Google Scholar] [CrossRef]
Publisher’s Note: MDPI stays neutral with regard to jurisdictional claims in published maps and institutional affiliations. |
© 2021 by the authors. Licensee MDPI, Basel, Switzerland. This article is an open access article distributed under the terms and conditions of the Creative Commons Attribution (CC BY) license (https://creativecommons.org/licenses/by/4.0/).