Abstract
In this paper, data envelopment analysis (DEA) is applied to exhaustively examine the efficiency of the main airline companies in the European airspace by using novel input/output parameters: business management factors, network analysis metrics, as well as social media estimators. Furthermore, we also use network analysis to provide a better differentiation among efficiency values. Results indicate that user engagement, as well as the analysis of the position within the airspace-from an operative perspective, influence the efficiency of the airline companies, allowing a more comprehensive understanding of its functioning.
1. Introduction
As has occurred in many other business sectors, the airline industry has grown considerably as a consequence of the arrival of the internet, which has allowed multiple new opportunities, from online ticket purchase to real-time information updates for customers about flights or company functioning. The position of airlines in the virtual world of the internet is considered a key point to attract new customers and keep them faithful. Twitter accounts, Facebook pages, or YouTube channels, just to mention a few, are online media used for this purpose.
We can find in the literature many works assessing the efficiency of airlines [1,2,3,4,5,6,7,8,9,10]. Analysis of the efficiency of the airline industry has traditionally been carried out from an economic perspective, mainly using micro-and/or macro-economic estimates to assess the viability of a company, its business plan, its fleet optimization, or its route planning, just to mention a few [2,7,10,11,12,13,14]. Some authors focus on specific economic variables such as the cost or passenger revenue [2,15,16], while others analyze efficiency by taking into account other airline features, such as fleet or aircraft departures [17,18], and some even include variables such as network size [1,16] or aircraft manufacturers [19].
The maximum efficiency an institution can attain is determined by the heterogeneity of its [1,2,3,4,5,6,7,8,9,10] resources and the capabilities of its management [20]. Resource-based theory [21,22,23] has been widely adopted as the reference point for research into efficient production management within institutions as it can help explain why some firms consistently outperform others. Actually, only a few approaches include some other more heterogeneous aspects of study when considering how to evaluate the efficiency of an airline [1,24]. However, the emergence of new features able to describe the functioning and the position of an airline in the market—such as its relative presence on the internet or its development with regard to other companies—have brought about new opportunities to compare its behavior in the airline business. Designing new models to utilize those non-economic parameters in order to study efficiency has become an interesting topic to address. This paper attempts to add into the equation some important features not often included into the efficiency analysis of airlines, namely social media indicators or network analysis measures.
We propose a novel approach that addresses the aforementioned issues by using data envelopment analysis (DEA) techniques along with several variables relevant to the efficiency of an airline, such as business management factors, the position of the company in terms of network analysis, and social media indicators. We aim to compare how including the two latter factors in the analysis of efficiency may produce different results from relying on traditional economic variables. To the best of our knowledge, this is the first paper on this topic and should help to build a more holistic view of the airline industry.
The paper is organized as follows. In the next section, we motivate our work by reviewing some related work in the literature. In Section 3, we present the methodology we use to study efficiency throughout the paper. Section 4 sets out the data collected related to the European airlines we study. We present the results obtained in Section 5. Finally, we discuss the results, draw some conclusions, and sketch some future avenues for research in Section 6.
2. Background
Air transport contributed more than €110 billion to the European GDP(gross domestic product) in 2014, and airlines have usually been effective in improving productivity [25]. The efficiency of the internal management of institutions is a function of the costs and benefits of their activities [26]. Literature has plenty of examples of the use of DEA to measure efficiency in airlines (see Table 1). This technique has often been utilized to evaluate efficiency through the use of financial resource indicators, both at corporate and at market level [27]. However, there exist two main trends in which airlines have been evaluated in the last years, in terms of performance: economic and/or operative [28,29,30,31] and economic and/or environmental [7,14,32].

Table 1.
Summary of literature related to DEA (data envelopment analysis) in the airline industry. BCC: Banker–Charnes–Cooper. CCR: Charnes–Cooper–Rhodes. EBIT: Earnings before interest and tax.
There have been a considerable number of studies measuring the efficiency of European institutions through DEA [14,33,34], between others. Barros and Peypoch [35] used DEA-CCR(Charnes–Cooper–Rhodes) and two-stage regression to analyze technical efficiency and concluded that airlines should consider managerial causes of inefficiency scores when developing strategies, whilst Lee and Worthington [36] employed a double bootstrapping DEA model to analyze the period following deregulation of the European airline industry and financial turmoil in the US airline industry. Another study [14] used network slacks-based measures to analyze how including aviation in the European Union Emission Trading Scheme has affected airline efficiency since 2008. Merkert and Williams [37] used two-stage DEA to measure the efficiency of 18 European public service obligation (PSO) airlines over two fiscal years and concluded that operators with a large number of PSO contracts appear to be more efficient than those with only a few such contracts.
There are also studies of European airlines that have used DEA to explore environmental factors [34]; these studies suggest that the average productivity of airlines, which take an environmentally sensitive approach to growth, is lower than that of airlines taking a more traditional approach. More recent research [33] has used network-based DEA and shows a dynamic component, since performance differed across types of airlines during the 2000s.
However, in the above works, although the methodology applied to obtain conclusions is based on DEA, and they have brought about some important advances in gaining a better understanding of the functioning of the airline industry, they have not addressed airlines in Europe as an ecosystem, where other factors may be considered. As an example, in [38], the authors present a review specific to European airlines and social media research, which concludes that new information and communication technology has had a profound impact on airlines’ delivery and consumption, increasing customer engagement, and loyalty in a technologically connected world [32,38,39,40,41,42]. With this in mind, in this paper, we add analysis of social media indicators to a DEA-based approach measurement of the efficiency of airlines.
To understand the functioning of a complex system, it is essential to analyze its structure [43]. There is some research which has used network analysis to study the development of the airline industry. For instance, Brueckner [44] presented a simple rule for the computation of airport congestion tolls, reflecting the internalization of congestion by analyzing a complex network formed by hub airports. Bagler [45] analyzed the Indian airport network (as a weighted network), concluding that it follows a small-world model and comparing it to the worldwide airport network. To the best of our knowledge, however, network analysis has not previously been used to estimate airline efficiency. In this paper, we propose to study the network formed by the airports in which the airlines operate. By analyzing such a network, we will be able to extract certain centrality measures that may provide useful information about the airline business positioning. As we will detail, these centrality scores will be incorporated into a DEA process as input variables.
3. Methodology
3.1. Data Envelopment Analysis (DEA)
DEA can be roughly defined as a non-parametric method of measuring the efficiency of a decision-making unit (DMU) with multiple inputs and/or multiple outputs. DEA is used to measure the relative productivity of a DMU by comparing it with other homogeneous units, transforming the same group of measurable positive inputs into the same types of measurable positive outputs. Charnes, Cooper, and Rhodes [49] introduced the DEA method to address the problem of efficiency measurement for DMUs with multiple inputs and multiple outputs in the absence of market prices.
They coined the expression ‘decision making units’ (DMU) to include non-market agencies such as schools, hospitals, and courts, which produce identifiable and measurable outputs from measurable inputs but generally lack market prices for outputs (and often for some inputs as well). Supposing that there are firms, each producing outputs from inputs, firm uses the input bundle to produce the output bundle. As noted above, measurement of average productivity requires the aggregation of inputs and outputs. Charnes et al. [49] proposed a minimization problem to obtain the efficiency score, assuming a constant returns scale (CRS). This represents the global technical efficiency of a DMU, known as the CCR (Charnes–Cooper–Rhodes) model. They assume that there are DMUs to be evaluated. Each DMU consumes varying amounts of different inputs to yield different outputs. More in particular, DMU consumes amount of input and produces amount of output . Equation (1) presents the multiplier CCR model in an output-oriented version displayed as a linear programming problem:
where is an element defined to be a negligible positive real number, and are the weight vectors of output variables. If the constraint holds, then the model is called BCC (Banker–Charnes–Cooper) proposed by Banker et al. [50]. This model incorporates the property of variable returns to scale (VRS).
3.2. Bootstrapping DEA Technique
Data errors may severely affect the efficacy of DEA. The DEA method uses a sample for the efficiency analysis, so the specific differences that can be found in estimations may be only motivated by sampling noise to a great extent than precise deviation in efficiency scores of the units. In this paper, we use a bootstrapping approach to address to this problem. Bootstrapping, introduced by Efron [51], is based on the idea of re-sampling from an original sample to create replica datasets which we can use to make statistical inferences. The ‘smoothed bootstrap’ approach of Simar and Wilson [52,53] is used in this study. The theoretical foundations of this method are set out in [53].
The key assumption underlying this approach is that the known bootstrap distribution will mimic the original, unknown distribution provided that the known data generating process (DGP) is a consistent estimator of the unknown DGP. The most common approach is to estimate the original densities of the performance scores non-parametrically using kernel smoothing methods, combined with a reflection method [54]. If this approach is followed, the bootstrap process will generate values that mimic the distributions that would be generated from unobserved and unknown DGP [52,55]. This work uses the bootstrapping technique proposed by Martínez-Núñez and Pérez-Aguiar [56] which can be summarized as follows:
- Calculate the DEA efficiency score with the original data .
- Use Kernel density estimation and the reflection method to generate a random sample with replacement from the original DEA efficiency score .
- Generate using:where is a random draw from a standard normal distribution and h is a control parameter.
- Obtain from
- Generate resampled pseudo-efficiencies using
- Obtain a0 new data sample using .
- Calculate the DEA efficiency score with data, .
- Repeat steps 2 to 7 B times to create a set with B efficiency estimates for each unit:
The bootstrap estimate of the DEA bias is obtained through
A bias corrected efficiency estimator is then obtained by defining
3.3. Calculating Centrality Measures to Feature DEA
In this section, we intend to show how network analysis may be an important factor to consider when studying the efficiency of airline companies. We claim that using this kind of analysis allows additional relevant input properties to be included in the analysis of an organization’s efficiency. In particular, we are interested in studying how centrality measures affect efficiency in the airline industry. With that in mind, we propose to develop a network model extracting relationships among airlines in terms of common operations airports, as well as incorporating centrality measures such as degree and eigenvector centrality into DEA efficiency analysis.
3.3.1. Network Model
Network analysis focuses on the use of different metrics with sets of entities linked to one another in some way. First, we define the sorts of networks we examine in this paper—i.e., those generated from European airline companies and their relationships in the European airspace. Let be a graph in which represents the set of airlines and stands for the set of links or connections between them. Let , with , be an edge in representing that airlines and operate in the same airport. For the purpose of this paper, we consider relationships to be bidirectional—that is, if there is , necessarily also exists. Thus, the graph generated by the network is undirected.
3.3.2. Airline Analysis Using Centrality Network Metrics
There are many different metrics that make it possible to uncover some interesting individual behaviors and global properties in a network. We claim that in the domain we consider (airlines), centrality metrics are necessary to shed light on the importance of the position of an airline in the network generated. In other words, centrality metrics attempt to measure how well placed an airline is in relation to the other companies in the airspace—in this case, European airspace. The concept of centrality encapsulates micro measures that allow us to compare nodes and to say something about how a given node relates to the overall network [57,58]. Our hypothesis lies in finding out whether deep knowledge of the position of the airlines in the context of the overlying network generated from the relationships that emerge in the European airspace may bring about certain benefits when studying the efficiency. Let us now set out the different metrics we use to accomplish this task.
Degree centrality. The simplest way of measuring the position of a node in a network (henceforth we use the terms ‘node’ and ‘airline’ synonymously when referring to an entity in the network) is to consider the so-called degree centrality. This represents the number of links that a node has. Formally:
where denotes the degree of node in the network. This metric shows how well a firm is connected in terms of direct links. We can also provide an average degree centrality value as follows:
This value represents an average estimate for the number of relationships between the companies as a macro indicator of its presence in Europe.
Although degree centrality may be an important factor when analyzing an airspace network, it misses certain aspects that should be considered. While it captures the geographical distribution of an airline perfectly, it does not reflect the strength of its position within the network—i.e., the importance of the firm relative to the whole airline industry. In any case, it may be that an airline has relatively few relationships but lies in a critical location within the network. In other words, different airlines might yield different performances depending on the airports they operate in, even if the number of links they have remain the same. We use eigenvector centrality to overcome this issue.
Eigenvector centrality. Eigenvector centrality (we also use eigencentrality interchangeably throughout the paper), proposed by Bonacich [59], is able to represent the importance of a node in the network. Let be the eigenvector centrality associated with a network: the crux is that the centrality of a node is proportional to the sum of the centrality of its neighbors. Formally:
in which is a scalar called eigenvalue and is an adjacency matrix representing the network. The Perron–Frobenius theorem from linear algebra guarantees that when we work with an undirected network, being a connected component—as occurs in our case—iterating over Equation (4) always converges on a fixed-point equivalent to:
As our airlines’ network is undirected, then , so resulting in:
As a set of separate equations (with being elements of the adjacency matrix ), we obtain:
To solve this set of equations, we need to find eigenvalue–eigenvector pairs . A matrix can have several eigenvalues (to find the eigenvalues of matrix we simply solve the determinant , where stands for the identity matrix.), and, in turn, several associated eigenvectors. Again, following the Perron–Frobenius theorem, we choose the highest eigenvalue in order to assure positive values in the correspondent eigenvector (positive centrality scores). If we take as the highest eigenvalue in Equation (7) then, after bringing the right-side terms to the left-hand side, we have:
Computing eigenvector centralities can be done in a reasonable time (it presents a complexity of ).
In summary, eigenvector centrality allows us to calculate how important an airline is in the airspace being analyzed by taking into account the importance of the surrounding companies.
3.4. A Network-Based Approach to Refine DEA
As mentioned, DEA proves to be a rather good method to assess the efficiency of organizations. In particular, DEA outputs an efficiency frontier that may be used to determine a reference for efficiency performance. However, this efficiency frontier usually contains more than one unique efficient organization. In this paper, we adhere to the approach by Liu and Lu [60] to better discriminate between the efficiency of the efficient organizations involved in the DEA process. This approach transforms DEA output results (organizations’ efficiency) into a weighted directed network and then uses eigenvector centrality to rank the importance of each organization, so better distinguishing between efficient entities. Since we use a completely different domain of study, we have adapted Liu and Lu’s approach as follows in the next description.
Stage 1. Run DEA with the different proposed models to obtain the efficiency of the studied organizations.
Stage 2. For each model, benchmark the individual efficiencies of each airline with regards to the efficiency frontier (i.e., efficient airlines). This process outputs a lambda value of if organization i is an exemplar of organization j, with . In other words, lambda values represent estimates to achieve target efficiency. A value of means airline i is not a model of reference for airline j. If then there exists an endorsement relationship between airlines i and j. Note that does not have to be confused with algebraic eigenvalues in Section 3.3.2. Since notation for both terms is accepted worldwide, we prefer not to change either of them.
Stage 3. We aggregate the lambda values resulting from each model for which we ran DEA, so obtaining a lambda matrix as follows:
Stage 4. We use the aggregated lambda values from the previous step to generate a network in the following way:
Airlines are represented by network nodes.
A link between two nodes i and j, denoted as , is created if there exists a lambda value which is, in turn, the weight of the link between the two nodes.
Stage 5. Calculate the eigenvector centrality for every node in the network. This step will return a ranking, from which a better discrimination of the efficiency of the airlines involved will be easily extracted.
4. Model Data
We have used data from 43 European airlines to demonstrate how DEA can be used to assess efficiency, and to offer additional data about European airlines’ competitiveness. Firstly, we collected information concerning the balance sheet for the year 2014 from the AMADEUS database (https://amadeus.bvdinfo.com) edited by Bureau van Dijk. Secondly, data relating to the airlines’ operations was obtained from Openflights.org. (http://openflights.org/) Data concerning social media networks was collected by trawling different web channels, such as YouTube, Twitter, and Facebook. It has been compulsory to normalize negative values due to the characteristics of the DEA model applied in this work.
This paper presents an incremental DEA multistage model whose main purpose is the measurement of efficiency at different layers from a strategic perspective. The comprehensive model integrating all layers is the so-called overall DEA model. Three layers are analyzed using DEA: business DEA layer, network DEA layer, and social media DEA layer. Each layer has several steps in which the variables presented in Table 2 are examined.
Table 2.
Variables selected for each DEA layer model.
4.1. Input–Output Data for Bus-DEA Layer
Regarding inputs, in this study a combination of these companies’ economic and human resource data was collected; these inputs were used in previous works, among other purposes, to analyze the best practice frontier performance in companies. We selected the following variables: total assets in balance sheet in 2014 [36,61]; number of employees for year 2014 as a measure of human resources [7,19,24,32,36]; and number of destinations as an indicator of geographical diversification [4]. On the other hand, the selected outputs measuring performance of business management in European airlines are sales as the profitability measure supported in the literature in previous works by Cui, Banker, and Thore [28,62,63], and millions of passengers in 2014, as a quantum of the service’s users). The source of information was the AMADEUS database edited by Bureau van Dijk.
4.2. Input–Output Data for Net-DEA Layer
Besides traditional business management variables, we claim that other types of analysis may be used to include in DEA layers, in particular, when studying airlines. We adhere to the use of network analysis to obtain centrality measures, representing how well positioned each company is with regards to its competitors. With that in mind, we work on an airlines network built as detailed in Section 3. Over this network, we calculate degree and eigenvector centrality measures that we will use in the net-DEA layer.
4.3. Input–Output Data for SM-DEA (Social Media-DEA) Layer
The present boom of social media in almost all consumption areas and habits is unquestionable. Social networks contribute to strengthening relationships among and between airline organizations and individuals. To do so, interaction and engagement are the most important functions of social media regarding the management of airlines. Social media had an important effect on companies’ performance through a sustainable brand [38,42]. Given the increasing importance of social media in airlines, the necessary next step has to do with the integration of related indicators to assess the efficiency and performance of airlines.
We add to previous DEA layer inputs–outputs data that represent support for and acceptance of a company in social networks for the SM-DEA layer.
As Martínez-Núñez and Pérez-Aguiar [56] assert, Web 2.0 technologies are features with two types of variables—firstly, response levels: number of fans, followers, hits, comments, and tweets received; and secondly, company activity levels: comments, tweets, followings, responses, publications/posts, applications, events, surveys. We incorporate different features to the SM-DEA model as inputs: tweets/days, publication/days, and number of released videos as measure of activity level in social networks [56,64,65]. As outputs we use Twitter likes, Facebook likes, and views in YouTube channels as the user response.
The information on practice of Web 2.0 technologies is based on indicators of social media activity in 2014; the data were obtained directly from the Web 2.0 tools themselves.
4.4. Model Summary and Statistical Analysis
The variables selected in each step analyzed in the different layers are displayed in Table 2. This first approach presents an incremental DEA multistage model whose main purpose is the measurement of efficiency at different layers from a strategic perspective. The model is created from a resources and capabilities view. The starting point of this model is that the network development and its impact on organizations modify the way airlines manage their services. Several factors linked to the analysis of the types of network defined in the previous sections have been selected as efficiency components in order to corroborate this starting point. On the one hand, operational networks as physical resources are studied; on the other, the incorporation of social media networks and their relationships with the customer have also been evaluated. Social media estimates must be understood as intangible components that are measured in different intermediate homogeneous steps, thereby analyzing their influence on the airline sector efficiency.
Table 3 shows all the quantitative variables used and its descriptive statistics for the 43 European airlines analyzed.
Table 3.
Statistical summary of the variables in different DEA layer models.
5. Results
We first show the results obtained by using DEA with the different layers selected to analyze the efficiency of the airlines.
Then we use the approach adopted from Liu et Lu [60] (see Section 3.4) to rank airlines, sorted by their importance in a referential network created by benchmarking DEA outputs.
5.1. DEA Model
We propose an incremental multistage DEA model based on Martínez-Núñez and Pérez-Aguiar [56], starting with a basic layer model (the bus-DEA layer) where business management is measured according to the economic, human, and physical resources. Later, physical variables are incorporated into the operational network resource, building the net-DEA layer. Several variables from social media networks are then integrated to form the SM-DEA layer.
The effects and implications of each social media and operation network variables were analyzed and those most representative were selected to generate a holistic comprehensive model (the overall model). All layer models were created with an output orientation. This technique aims to maximize outputs with the same set of input values [66].
5.1.1. Bus-DEA Layer (Business-DEA)
The influence of business management data in the DEA assessment has been analyzed in steps 1 and 2. The efficiency of the various airline companies is shown in Table 4, which gives a descriptive analysis of the efficiency coefficients.
Table 4.
Original DEA efficiency coefficients (steps 1 and 2). DMU: decision-making unit.
Step 1 analyses only the economic and human resources of these companies, understood as businesses where the special features of the air transport sector are not considered. The average efficiency is 0.4973 and 0.6477, depending on the DEA model orientation (CCR and BCC, respectively). This suggests that companies in this sector could improve their levels of activity in terms of revenue with the same levels of input use by 51% based on constant returns, and by 36% based on variable returns. Returns may seem low in this step, but one must bear in mind that this step lacks contextual variables linked to the air transport sector, such as passengers and destinations.
These contextual variables are incorporated into Step 2 where 14 airlines are globally efficient, all of them working at an optimal scale. There are 22 efficient firms in the BCC model, which means that eight of them are technically efficient but could scale their activity to achieve global efficiency. A high value (0.93) of scale efficiency versus pure technical efficiency is also noted. The standard deviation of efficiency scores in the two steps (both in CCR and BCC orientation) exceeds 0.20, except in scale step 2 (0.1108). This means that the global inefficiencies can be assigned to managerial or operational inefficiencies. In the light of the results and the analysis of previous works, step 2 appears to be the step that best fits a basic step based on variable returns and output orientation.
As a result of the deterministic nature of the DEA method, the analysis of efficiency estimates in the presence of sample variations through the bootstrapping DEA approach is the suitable next step in an efficiency analysis [53] for the following step. For each step, we present a table showing the bootstrapping DEA results, including the average of the bias-corrected efficiency scores, bias, standard deviation, and 95% confidence intervals (lower bound and upper bound) for the bias-corrected efficiency scores.
5.1.2. Net-DEA Layer (Network-DEA)
This kind of layer provides the efficiency score changes of all the airline companies when reassigning as input some operational resources variables that, at a network level, provide information on the European destination distribution of the airlines. Table 5 shows the original values and bootstrapped performance estimates of each step of the network-DEA layer. Therefore, the number of air routes of each airline and its strategic positioning with respect to other firms are also analyzed.
Table 5.
Original and bootstrapped DEA efficiency coefficients of net-DEA models.
As is pointed out in Section 4.2, two selected metrics make it possible to discover some interesting individual behaviors and global properties of a network.
Fried et al. [67] indicates that bias-corrected efficiency is preferable to original efficiency estimates because the estimated bias is larger than the standard deviation in every case. Therefore, the analysis described hereafter takes into account the average bias-corrected efficiency scores. Conclusions concerning efficiency changes in steps can be deduced by analysis of the bootstrap confidence intervals. A two-unit increase in efficiency score can be observed and a three-unit increase in both average bias-corrected efficiency score and inefficient average bias-corrected efficiency DMUs—three points in Step 5 that incorporates the two network variables with respect to Step 3. However, there are no significant differences between Step 4 and Step 5, as they have the same number of efficient DMUs and less than one percentage point difference in the bootstrap median score.
The eigenvector centrality has been selected as the critical factor for operational resources network management, given the results of the net-DEA Llyer and according to the higher correlation of Step 4 in relation to Steps 3 and 5 (0.956 and 0.997 Spearman’s coefficient, respectively).
5.1.3. SM-DEA Layer (Social Media-DEA)
The results for the different steps of the SM-DEA layer calculated are shown in Table 6. A trend can be appreciated when associating the efficient airline firms with indicators of their involvement in social media networks.
Table 6.
Original and bootstrapped DEA efficiency coefficients of SM (Social Media)-DEA steps.
The virtual network platforms analyzed in this work are public and external resources to the firms. These resources do not have shortage and any stakeholder can isolate one network from the others. Thereby, the use of one or another virtual network would not suggest any increment of efficiency. But this is not so. The results of the SM-DEA layer show an increase in average efficiency for companies that use Twitter (Step 7) versus the other platforms studied. There is an increase of six and nine efficient companies (respectively) with respect to Step 6 (Facebook) and Step 8 (YouTube). In addition, Step 7 (Twitter) has the lowest interval that does not overlap with the other two steps. Furthermore, Step 6 (Facebook) presents the highest average efficiency score of inefficient DMUs. The potential increasing output of incorporating at least the Facebook platform is 0.0875 and 0.0142 (average efficiency increase of Step 7 and Step 8 with respect to Step 6, respectively). That is, when a sector-average firm starts to participate in social media, the performance of its outputs enhances by this ratio.
The Facebook metrics have been selected as critical factors for new technological resources, given the results of the SM-DEA layer and according to the higher correlation of Step 6 in relation to Steps 7 and 8 (0.842 and 0.713 Spearman’s coefficients, respectively).
5.1.4. Overall Model
Specific input reallocation for each type of network (either physical or virtual) gives rise to an efficiency improvement in the overall model. The most efficient airlines combine different resources linked to networks in a way that gives rise to current, future, or potential competences that are interesting to analyze from a strategic point of view.
Analysis of the different steps indicates that the overall model (Step 9) obtains an increase in efficient enterprises of more than 18.5% and an improvement of more than 12% in the corrected average efficiency compared to Step 2. As pointed out in Table 7, the incorporation of factors linked to operational networks (Step 4)—understood as nodes with the potential for developing new business opportunities—generates an improvement in efficiency on the overall model. However, the efficiency improvement in social networks (Step 6) is much clearer, since the increase in the number of users and the social networks management generate valuable data and information with direct and positive implications for efficiency.
Table 7.
Original and bootstrapped DEA efficiency coefficients of overall steps.
The comparison between Step 6 (social network layer) and Step 4 (network layer) indicates a clear efficiency increase in Step 6. Three firms have been incorporated into the efficient frontier and there is an improvement in the average efficiency of the inefficient firms of more than seven percentage points, without any overlap between intervals. Therefore, these results indicate that the influence of the direct effects of the physical networks on efficiency improvement is lower that the indirect effects linked to social networks, where user enrolment generates profit but without any direct compensation.
5.2. Discriminating Efficiencies by Ranking Centralities
Many methods of discriminating between DEA results have been proposed [68,69,70]. Liu and Lu [60] suggested a method that turns DEA results into a network for the second stage analysis, and uses the tools developed in the social network analysis community to further discriminate DEA results. At this point, and using the results previously presented in this section, we run the mechanism adapted from Liu and Lu [60]. Aggregated lambda values are presented in Appendix B. As follows from our adaptation of Liu and Lu’s model, we create a network based on the lambda values resulting from benchmarking the efficiencies obtained by the DEA analysis with the different proposed models. Then we calculated the eigenvector centrality of different companies in order better to discriminate efficiencies of DMUs. We present the ranking obtained in Table 8.
Table 8.
Ranking of DMUs by their eigenvector centrality.
Results show that bigger companies, in terms of incomes or engagement in social media, are not the most efficient ones when sorted after applying the mechanism. This leads us to think whether the management strategy those big companies are following has been correctly designed. More recent companies, compared to the rulers of the market in the last 50 years (Turkish Airlines, KLM, or TAP), such as AirEuropa, Air Berlin, or SAS seem to better perform in the current market. Reasons might be very diverse: from a more specific passenger target to the decision of operating in a more local area or region.
Figure 1 represents the weighted network of airlines by using their lambda values. Bigger nodes denote a higher efficiency score, while edges are determined by lambda values between two different companies.
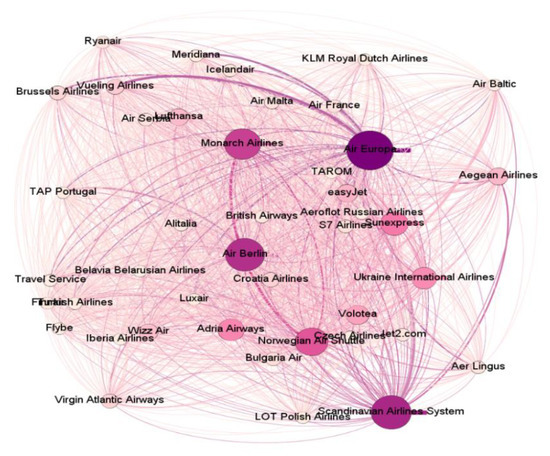
Figure 1.
Airline lambda-based network displayed by eigenvector centrality (darker and bigger nodes represent greater efficiency).
5.3. Discussion on the Results
We illustrate our approach clearly, using a bubble chart to visualize the information so that the relationship between airline centrality and efficiency can be checked. We try to show how eigenvector centrality values influence the efficiency of airlines taken into account other factors (engagement, fleet size, and income). The following bubble charts combine efficiency (X axis) and the eigenvector centrality calculated as detailed in Section 3.3.2 (Y axis). The size of the bubbles is determined by engagement, (Figure 2), fleet number (Figure 3), and income (Figure 4).
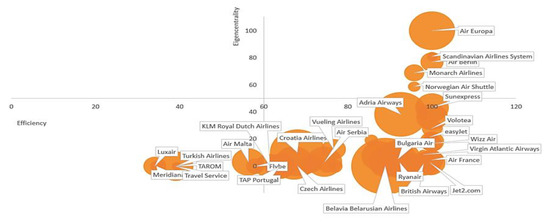
Figure 2.
Bubble chart representing efficiency vs. eigencentrality. Node size denotes engagement for the company in social media.
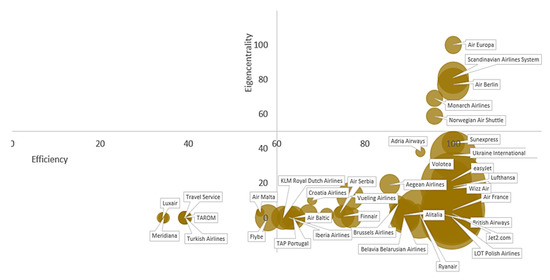
Figure 3.
Bubble chart representing efficiency vs. eigencentrality. Node size denotes airline fleet volume.
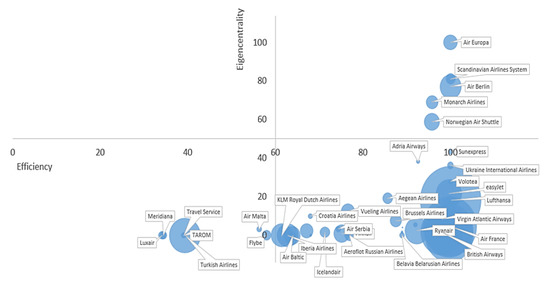
Figure 4.
Bubble chart representing efficiency vs. eigencentrality. Node size denotes airline total incomes.
The graph is divided into four quadrants. The first quadrant is the upper right-hand corner of the graph, where we see airlines with efficiency and eigencentrality values close to 1 (Air Europa, Scandinavian Air Lines, Air Berlin, Monarch Airlines, Norwegian Air)—that is, 10.6% of the sample. The second quadrant, in the lower right-hand corner, includes low values of eigencentrality and a range of efficiency between 0.5 and 1, and corresponds to 72.3% of the European airlines studied. The third quadrant, the lower left-hand corner, includes low values of both x and y (Luxair, Travel Service, Meridiana, TAROM, Turkish Airlines), and that corresponds to 17.2% of the sample. Finally, the fourth quadrant, the upper left-hand corner, includes high values of eigencentrality and low values of efficiency: we can observe that there is not one airline in this quadrant, which is consistent with benchmark’s definition. From a quality perspective, we can find three groups of airlines. The first group (first quadrant) corresponds to the group leaders: the majority are efficient and are the most referenced for the rest of the DMU (despite not having a big income and their fleet not being particularly large, nor even their engagement in social media). We might suggest that this type of airline chooses a segmentation market strategy and operates on the optimal scale. In other cases, companies cannot achieve their objectives (growth, profitability, market presence, social recognition, etc.) within their current activity and opt for another type of strategy: diversification. This is the situation of the second group (second quadrant, right side): efficient airlines with low values for eigencentrality (such as Air France or Lufthansa), large fleet, their own way of operating, and singular features.
In the third group, we find low values of eigencentrality, inefficient airlines, with low-medium income and fleet and with a reasonable value for engagement in social networks. These airlines should leverage their recognition and positioning in social media as an intangible value and improve the way they operate.
For further details on the results, please check Appendix A and Appendix B.
6. Conclusions
Formulating a strategy to compete in one or more countries is complex [71]. Nowadays, the network concept is largely used, being applied in multiple scenarios—IT, logistics or business, among others. Networks represent the ability to establish links and make exchanges, whether physical or in the form of information. The use of network (social or physical) knowledge and the benefit obtained is applied by the organizations, making a resource from the opportunities. The measures of centrality provide valuable information on the positioning of airlines in the European airspace, so providing a more complete benchmarking than the one used so far in DEA.
In this work, we calculate the efficiency scores for 43 selected European airlines from 2014, using an incremental DEA multistage model [56] whose main purpose is the measurement of efficiency at different layers from a strategic perspective. Following [36,55], the bootstrap method is also used to address problems caused by DEA models’ sensitivity to errors in the data. This suggests the importance of seeking mechanisms to coordinate corporate and competitive strategies—in this sense, including not only economic indicators, but also network and social media indicators, in DEA models, taking advantage of the amount of data available today. These should be considered key factors in making management decisions. This confirms similar findings in Duygun [33], which include intangible inputs related to customer satisfaction levels in a network DEA from the point of view of customer satisfaction, cost minimization, and an efficient route system. Airline organizations have identified the need to offer their customers a wide range of different social media platforms [38]. This work has found that not all airlines operate the different platforms with the same efficiency. Faber [72] identified that two channels (Facebook and Twitter) were most likely to be used by airline organizations; the results of this work show that the efficiency scores of the Twitter step surpass those of the Facebook step. These findings are similar to Zarrella [73], who suggested that the efforts involved in Twitter engagement pay off quickly and result in a great buzz.
Social media marketing initiatives should not only be measured in monetary units but should also investigate consumer intentions to engage in social media applications [74]. To identify social media marketing’s acceptance amongst consumers, measures like the frequency of website visits (i.e., traffic), the number of comments or ‘likes’ in a social network, or the number of replies on media-sharing websites can provide information on a social media application’s attractiveness [75]. DEA methodology allows the efficiency measurement of all these variables. As stated by Martínez-Núñez and Pérez-Aguiar [56], this work confirms that airlines can improve their efficiency by enhancing their social media management capabilities and incorporating Web 2.0 technologies into their business strategy. This work also finds that this new and digitalized communication is becoming increasingly influential in efficiency improvement versus analysis of the route network positioning factors.
As we have shown in the paper, we adhere (and adapt) the method used by Liu and Lu [60], using the eigenvector centrality for refining efficient DMUs. However, in that paper, the authors collect and aggregate lambda values from any possible combination of input/output parameters (in different stages), while, in our case, we only use the results from steps we consider relevant in our domain. We claim our choice is correct in most cases, since domains with many potential input/output parameters (such as the airline industry) might generate combinations not relevant or even counterproductive, in terms of the assessment of efficiency scores.
We prove that, to become and to remain successful, organizations have to accept that within the social media environment, consumer power is much stronger than their own [75]. Consequently, companies need to reconsider their strategic approach to social media marketing practices, showing willingness ‘to give up control of the message’ [76] as well as allowing consumers to provide criticism and constructive input. This concept becomes more understandable if this process is seen as a virtual network of relationships, where efficiency means knowing how to manage and recognize different user segments in different platforms simultaneously. Results also indicate that the influence of the direct effects of the physical networks on the efficiency improvement is lower than the indirect effects linked to social networks, where user enrolment generates profit but without any direct compensation.
As future research avenues, we plan to study the results from different perspectives, for example, a group-based analysis, focusing on the results obtained by airlines belonging to the same group (e.g., IAG is a holding company which emerged after the fusion of Iberia and British Airways, including Aer Lingus and Vueling). Results obtained from individual efficiencies compared to the cluster companies they belong to might yield interesting insights into the group development and the strategy it follows. The same study might be applied to airline alliances, such as Star Alliance, One World, or Sky Team. We also intend to study the value of social media on the efficiency calculation, but from a local perspective. That is, we are interested in determining whether local companies are relatively popular in the radius of action in which they operate, instead of comparing global estimates. For example, a company only operating in a single country does not need to attract users from foreign countries or, at least, not on the same level as multinational companies do.
Author Contributions
Conceptualization, R.H., M.P.L. and M.M.-N.; Methodology, R.H., M.P.L. and M.M.-N.; validation, R.H., M.P.L. and M.M.-N.; investigation, R.H., M.P.L. and M.M.-N.; data curation, R.H., M.P.L. and M.M.-N.; writing—original draft preparation, R.H., M.P.L. and M.M.-N.; writing—review and editing, R.H., M.P.L. and M.M.-N.
Funding
This research received no external funding.
Acknowledgments
This work has been supported by the project TIN2016-78011-C4-3-R and DGA-FSE, Government of Aragón (COSMOS Group and Group Reference CREVALOR: S42_17R) and co-financed with FEDER 2014-2020 “Construyendo Europa desde Aragón”.
Conflicts of Interest
The authors declare no conflict of interest.
Appendix A
Table A1.
DEA efficiency scores with different steps.
Table A1.
DEA efficiency scores with different steps.
| Air Line Company | Business Management | Network Management | Online Social Network Management | TOTAL | |||||||||||||||
|---|---|---|---|---|---|---|---|---|---|---|---|---|---|---|---|---|---|---|---|
| Model 1 | Model 2 | Model 3 | Model 4 | Model 5 | Model 6 | Model 7 | Model 8 | Model 9 | |||||||||||
| (Basic) | (Air-Line Basic) | (Degree Net) | (Eigencentrality Net) | (Total Net) | (Facebook SM) | (Twitter SM) | (YouTube SM) | (Integral) | |||||||||||
| DMU | Name | Original | Bias- correc | Original | Bias- correc | Original | Bias- correc | Original | Bias- correc | Original | Bias- correc | Original | Bias- correc | Original | Bias- correc | Original | Bias- correc | Original | Bias- correc |
| A01 | Adria Airways | 0.6293 | 0.3313 | 1 | 1 | 1 | 1 | 1 | 1 | 1 | 1 | 1 | 1 | 1 | 1 | 1 | 1 | 1 | 1 |
| A02 | Aegean Airlines | 0.7939 | 0.6152 | 0.7939 | 0.7542 | 0.8222 | 0.7628 | 1 | 1 | 1 | 1 | 0.7982 | 0.7759 | 1 | 1 | 0.8308 | 0.7961 | 1 | 1 |
| A03 | Aer Lingus | 0.5407 | 0.3374 | 0.5502 | 0.5099 | 0.5502 | 0.5096 | 0.6295 | 0.5882 | 0.6295 | 0.5843 | 1 | 1 | 1 | 1 | 0.5502 | 0.515 | 1 | 1 |
| A04 | Aeroflot Russian Airlines | 0.7939 | 0.6152 | 0.7939 | 0.7542 | 0.7939 | 0.7481 | 0.7939 | 0.731 | 0.7939 | 0.7341 | 0.7982 | 0.7759 | 1 | 1 | 0.8308 | 0.7961 | 0.7982 | 0.766 |
| A05 | Air Berlin | 1 | 1 | 1 | 1 | 1 | 1 | 1 | 1 | 1 | 1 | 1 | 1 | 1 | 1 | 1 | 1 | 1 | 1 |
| A06 | Air Europa | 1 | 1 | 1 | 1 | 1 | 1 | 1 | 1 | 1 | 1 | 1 | 1 | 1 | 1 | 1 | 1 | 1 | 1 |
| A07 | Air France | 0.9939 | 0.9877 | 1 | 1 | 1 | 1 | 1 | 1 | 1 | 1 | 1 | 1 | 1 | 1 | 1 | 1 | 1 | 1 |
| A08 | Air Malta | 0.4136 | 0.3028 | 0.4941 | 0.4505 | 0.4941 | 0.4517 | 0.5284 | 0.4884 | 0.5284 | 0.491 | 0.7281 | 0.6894 | 1 | 1 | 0.5056 | 0.4655 | 0.7536 | 0.7265 |
| A09 | Air Serbia | 0.4242 | 0.2407 | 0.6682 | 0.6369 | 0.6682 | 0.637 | 0.7575 | 0.7247 | 0.7575 | 0.726 | 1 | 1 | 1 | 1 | 0.7768 | 0.73 | 1 | 1 |
| A10 | Air Baltic | 0.5672 | 0.3966 | 0.6169 | 0.5747 | 0.6169 | 0.5741 | 0.7905 | 0.7196 | 0.7905 | 0.7243 | 0.6322 | 0.6047 | 0.7919 | 0.7662 | 0.6368 | 0.5987 | 0.8326 | 0.799 |
| A11 | Alitalia | 0.0072 | 0.0009 | 1 | 1 | 1 | 1 | 1 | 1 | 1 | 1 | 1 | 1 | 1 | 1 | 1 | 1 | 1 | 1 |
| A12 | Belavia Belarusian Airlines | 0.0069 | 0.0011 | 1 | 1 | 1 | 1 | 1 | 1 | 1 | 1 | 1 | 1 | 1 | 1 | 1 | 1 | 1 | 1 |
| A13 | British Airways | 0.9072 | 0.816 | 1 | 1 | 1 | 1 | 1 | 1 | 1 | 1 | 1 | 1 | 1 | 1 | 1 | 1 | 1 | 1 |
| A14 | Brussels Airlines | 0.7656 | 0.5788 | 0.7656 | 0.7209 | 0.7802 | 0.7237 | 1 | 1 | 1 | 1 | 1 | 1 | 1 | 1 | 0.8921 | 0.8475 | 1 | 1 |
| A15 | Bulgaria Air | 0.4367 | 0.2757 | 1 | 1 | 1 | 1 | 1 | 1 | 1 | 1 | 1 | 1 | 1 | 1 | 1 | 1 | 1 | 1 |
| A16 | Croatia Airlines | 0.4215 | 0.2832 | 0.546 | 0.5179 | 0.546 | 0.5189 | 0.6086 | 0.5789 | 0.6086 | 0.5803 | 1 | 1 | 1 | 1 | 0.6712 | 0.6414 | 1 | 1 |
| A17 | Czech Airlines | 0.4218 | 0.283 | 0.544 | 0.5329 | 0.561 | 0.5339 | 0.6236 | 0.5939 | 0.6236 | 0.5953 | 1 | 1 | 1 | 1 | 0.6862 | 0.6564 | 1 | 1 |
| A18 | easyJet | 0.9816 | 0.9634 | 1 | 1 | 1 | 1 | 1 | 1 | 1 | 1 | 1 | 1 | 1 | 1 | 1 | 1 | 1 | 1 |
| A19 | Finnair | 0.6985 | 0.4719 | 0.7026 | 0.6423 | 0.7327 | 0.6786 | 0.7432 | 0.6934 | 0.8473 | 0.7897 | 0.8189 | 0.7673 | 1 | 1 | 0.6856 | 0.6438 | 1 | 1 |
| A20 | Flybe | 0.5064 | 0.2466 | 0.5677 | 0.5127 | 0.5677 | 0.5072 | 0.7914 | 0.7307 | 0.7914 | 0.7315 | 0.5677 | 0.5349 | 0.5677 | 0.5427 | 0.6956 | 0.6465 | 0.7914 | 0.7623 |
| A21 | Iberia Airlines | 0.5672 | 0.3255 | 0.6559 | 0.6118 | 0.6665 | 0.5857 | 0.6826 | 0.6225 | 0.7482 | 0.6877 | 0.7188 | 0.6957 | 0.7086 | 0.6932 | 0.6736 | 0.6388 | 0.8261 | 0.7892 |
| A22 | Icelandair | 0.4816 | 0.3144 | 0.5547 | 0.4986 | 0.5547 | 0.4976 | 0.6742 | 0.6161 | 0.7695 | 0.709 | 0.8209 | 0.7842 | 1 | 1 | 1 | 1 | 1 | 1 |
| A23 | Jet2.com | 0.9847 | 0.9696 | 1 | 1 | 1 | 1 | 1 | 1 | 1 | 1 | 1 | 1 | 1 | 1 | 1 | 1 | 1 | 1 |
| A24 | KLM Royal Dutch Airlines | 0.5672 | 0.3255 | 0.6559 | 0.6118 | 0.6559 | 0.6092 | 0.6625 | 0.6222 | 0.6625 | 0.6116 | 0.7188 | 0.6957 | 0.7086 | 0.6932 | 0.6736 | 0.6388 | 0.7489 | 0.7214 |
| A25 | LOT Polish Airlines | 0.9847 | 0.9696 | 1 | 1 | 1 | 1 | 1 | 1 | 1 | 1 | 1 | 1 | 1 | 1 | 1 | 1 | 1 | 1 |
| A26 | Lufthansa | 1 | 1 | 1 | 1 | 1 | 1 | 1 | 1 | 1 | 1 | 1 | 1 | 1 | 1 | 1 | 1 | 1 | 1 |
| A27 | Luxair | 0.3008 | 0.1962 | 0.3008 | 0.2851 | 0.3008 | 0.2824 | 0.3991 | 0.3843 | 0.3991 | 0.3829 | 0.4316 | 0.4225 | 0.4012 | 0.3931 | 0.3008 | 0.2871 | 0.4492 | 0.4385 |
| A28 | Meridiana | 0.3008 | 0.1962 | 0.3008 | 0.2851 | 0.3093 | 0.2883 | 0.4081 | 0.391 | 0.4081 | 0.3848 | 0.4316 | 0.4225 | 0.4012 | 0.3931 | 0.3008 | 0.2871 | 0.4634 | 0.4503 |
| A29 | Monarch Airlines | 0.7965 | 0.6186 | 1 | 1 | 1 | 1 | 1 | 1 | 1 | 1 | 1 | 1 | 1 | 1 | 1 | 1 | 1 | 1 |
| A30 | Norwegian Air Shuttle | 0.7965 | 0.6186 | 1 | 1 | 1 | 1 | 1 | 1 | 1 | 1 | 1 | 1 | 1 | 1 | 1 | 1 | 1 | 1 |
| A31 | Ryanair | 0.6151 | 0.3089 | 1 | 1 | 1 | 1 | 1 | 1 | 1 | 1 | 1 | 1 | 1 | 1 | 1 | 1 | 1 | 1 |
| A32 | S7 Airlines | 0.0758 | 0.009 | 1 | 1 | 1 | 1 | 1 | 1 | 1 | 1 | 1 | 1 | 1 | 1 | 1 | 1 | 1 | 1 |
| A33 | Scandinavian Airlines System | 1 | 1 | 1 | 1 | 1 | 1 | 1 | 1 | 1 | 1 | 1 | 1 | 1 | 1 | 1 | 1 | 1 | 1 |
| A34 | Sunexpress | 1 | 1 | 1 | 1 | 1 | 1 | 1 | 1 | 1 | 1 | 1 | 1 | 1 | 1 | 1 | 1 | 1 | 1 |
| A35 | TAP Portugal | 0.643 | 0.3878 | 0.6838 | 0.6294 | 0.6838 | 0.627 | 0.6838 | 0.6359 | 0.6838 | 0.6347 | 0.717 | 0.6889 | 0.8251 | 0.7959 | 0.6838 | 0.6426 | 0.717 | 0.6961 |
| A36 | TAROM | 0.2526 | 0.1788 | 0.3231 | 0.3095 | 0.3231 | 0.3033 | 0.3231 | 0.3059 | 0.324 | 0.3049 | 0.5342 | 0.5261 | 0.4081 | 0.4023 | 0.681 | 0.6602 | 0.5342 | 0.5258 |
| A37 | Travel Service | 0.2376 | 0.1638 | 0.3081 | 0.2945 | 0.3081 | 0.2883 | 0.3081 | 0.2909 | 0.309 | 0.2899 | 0.5192 | 0.5111 | 0.3931 | 0.3873 | 0.666 | 0.6452 | 0.5192 | 0.5108 |
| A38 | Turkish Airlines | 0.2676 | 0.1938 | 0.3381 | 0.3245 | 0.3381 | 0.3183 | 0.3381 | 0.3209 | 0.339 | 0.3199 | 0.5492 | 0.5411 | 0.4231 | 0.4173 | 0.696 | 0.6752 | 0.5492 | 0.5419 |
| A39 | Ukraine International Airlines | 1 | 1 | 1 | 1 | 1 | 1 | 1 | 1 | 1 | 1 | 1 | 1 | 1 | 1 | 1 | 1 | 1 | 1 |
| A40 | Virgin Atlantic Airways | 0.9057 | 0.814 | 1 | 1 | 1 | 1 | 1 | 1 | 1 | 1 | 1 | 1 | 1 | 1 | 1 | 1 | 1 | 1 |
| A41 | Volotea | 1 | 1 | 1 | 1 | 1 | 1 | 1 | 1 | 1 | 1 | 1 | 1 | 1 | 1 | 1 | 1 | 1 | 1 |
| A42 | Vueling Airlines | 0.7633 | 0.561 | 0.7759 | 0.7108 | 0.7759 | 0.7125 | 0.7759 | 0.706 | 0.7759 | 0.7106 | 0.7884 | 0.7391 | 1 | 1 | 1 | 1 | 0.7884 | 0.7516 |
| A43 | Wizz Air | 1 | 1 | 1 | 1 | 1 | 1 | 1 | 1 | 1 | 1 | 1 | 1 | 1 | 1 | 1 | 1 | 1 | 1 |
Appendix B
Table A2.
Benchmarking (lambda values) aggregated lambda values resulting from bootstrapping.
Table A2.
Benchmarking (lambda values) aggregated lambda values resulting from bootstrapping.
| Airline Company | ||||||||||||||||||||||||||||
|---|---|---|---|---|---|---|---|---|---|---|---|---|---|---|---|---|---|---|---|---|---|---|---|---|---|---|---|---|
| DMU | Name | A01 | A02 | A03 | A05 | A06 | A07 | A08 | A09 | A13 | A14 | A15 | A16 | A18 | A22 | A23 | A26 | A29 | A30 | A31 | A32 | A33 | A34 | A39 | A40 | A41 | A42 | A43 |
| A01 | Adria Airways | 8 | 0 | 0 | 0 | 0.03 | 0 | 0 | 0 | 0 | 0 | 0 | 0 | 0 | 0 | 0 | 0 | 0 | 0 | 0 | 0 | 0 | 0.7 | 0 | 0 | 0.27 | 0 | 0 |
| A02 | Aegean Airlines | 0 | 4 | 0 | 0 | 1.89 | 0 | 0 | 0 | 0 | 0 | 0 | 0 | 0 | 0 | 0 | 0 | 0.07 | 0 | 0 | 0 | 2.52 | 0.41 | 0.01 | 0 | 0 | 0 | 0.07 |
| A03 | Aer Lingus | 0.52 | 0 | 2 | 1.43 | 2.63 | 0 | 0 | 0 | 0 | 0 | 0 | 0 | 0.36 | 0 | 0 | 0 | 0.44 | 0.74 | 0 | 0 | 0 | 0 | 0.41 | 0 | 0 | 0 | 0.47 |
| A04 | Aeroflot Russian Airlines | 0 | 1 | 0 | 0 | 3.15 | 0 | 0 | 0 | 0 | 0 | 0 | 0 | 0 | 0 | 0 | 0 | 0 | 0 | 0 | 0 | 4.08 | 0.57 | 0.01 | 0 | 0 | 0 | 0.14 |
| A05 | Air Berlin | 0 | 0 | 0 | 9 | 0 | 0 | 0 | 0 | 0 | 0 | 0 | 0 | 0 | 0 | 0 | 0 | 0 | 0 | 0 | 0 | 0 | 0 | 0 | 0 | 0 | 0 | 0 |
| A06 | Air Europa | 0 | 0 | 0 | 0 | 9 | 0 | 0 | 0 | 0 | 0 | 0 | 0 | 0 | 0 | 0 | 0 | 0 | 0 | 0 | 0 | 0 | 0 | 0 | 0 | 0 | 0 | 0 |
| A07 | Air France | 0 | 0 | 0 | 0.25 | 0 | 8 | 0 | 0 | 0 | 0 | 0 | 0 | 0 | 0 | 0 | 0.75 | 0 | 0 | 0 | 0 | 0 | 0 | 0 | 0 | 0 | 0 | 0 |
| A08 | Air Malta | 4.41 | 0.08 | 0 | 0.02 | 0.97 | 0 | 1 | 0 | 0 | 0.02 | 0 | 1.02 | 0 | 0 | 0 | 0 | 0.14 | 0.17 | 0 | 0 | 0.45 | 0.72 | 0 | 0 | 0 | 0 | 0 |
| A09 | Air Serbia | 3.91 | 0.18 | 0 | 0 | 0.19 | 0 | 0 | 3 | 0 | 0 | 0 | 0 | 0 | 0 | 0 | 0 | 0.24 | 0.14 | 0 | 0 | 0.79 | 0.58 | 0 | 0 | 0 | 0 | 0 |
| A10 | Air Balt ic | 4.4 | 0.87 | 0 | 0 | 0.69 | 0 | 0 | 0 | 0 | 0 | 0 | 0.16 | 0 | 0 | 0 | 0 | 0.19 | 0 | 0 | 0.05 | 1 | 1.36 | 0 | 0 | 0.34 | 0 | 0 |
| A11 | Alitalia | 0 | 0 | 0 | 0 | 0 | 0 | 0 | 0 | 0 | 0 | 0 | 0 | 0 | 0 | 0 | 0 | 0 | 0 | 0 | 0 | 0 | 0 | 1 | 0 | 0 | 0 | 0 |
| A12 | Belavia Belarusian Airlines | 0 | 0 | 0 | 0 | 0 | 0 | 0 | 0 | 0 | 0 | 0 | 0 | 0 | 0 | 0 | 0 | 0 | 0 | 0 | 0 | 0 | 0 | 1 | 0 | 0 | 0 | 0 |
| A13 | Brit ish Airways | 0 | 0 | 0 | 0.1 | 0 | 0 | 0 | 0 | 8 | 0 | 0 | 0 | 0 | 0 | 0 | 0.36 | 0 | 0 | 0 | 0 | 0 | 0 | 0.54 | 0 | 0 | 0 | 0 |
| A14 | Brussels Airlines | 0 | 0 | 0 | 0 | 3.17 | 0 | 0 | 0 | 0 | 5 | 0 | 0 | 0 | 0 | 0 | 0 | 0.05 | 0 | 0 | 0 | 0.23 | 0.23 | 0 | 0 | 0.24 | 0.07 | 0 |
| A15 | Bulgaria Air | 0 | 0 | 0 | 0 | 0.15 | 0 | 0 | 0 | 0 | 0 | 8 | 0 | 0 | 0 | 0 | 0 | 0 | 0 | 0 | 0 | 0 | 0.1 | 0 | 0 | 0.76 | 0 | 0 |
| A16 | Croatia Airlines | 3.96 | 0.16 | 0 | 0 | 0.28 | 0 | 0 | 0 | 0 | 0 | 0 | 3 | 0 | 0 | 0 | 0 | 0.16 | 0.16 | 0 | 0 | 0.52 | 0.74 | 0 | 0 | 0 | 0 | 0 |
| A17 | Czech Airlines | 3.96 | 0.16 | 0 | 0 | 0.28 | 0 | 0 | 0 | 0 | 0 | 0 | 3 | 0 | 0 | 0 | 0 | 0.16 | 0.16 | 0 | 0 | 0.52 | 0.74 | 0 | 0 | 0 | 0 | 0 |
| A18 | easyJet | 0 | 0 | 0 | 0.69 | 0 | 0 | 0 | 0 | 0 | 0 | 0 | 0 | 8 | 0 | 0 | 0.02 | 0 | 0 | 0 | 0 | 0 | 0 | 0.29 | 0 | 0 | 0 | 0 |
| A19 | Finnair | 0.64 | 0 | 0.02 | 2.06 | 1.98 | 0 | 0 | 0 | 0 | 0 | 0 | 0 | 0.49 | 0 | 0 | 0 | 0 | 0.26 | 0 | 0 | 0.37 | 0 | 0.36 | 0.81 | 0 | 0 | 0 |
| A20 | Flybe | 2.63 | 0.87 | 0 | 0.03 | 1.49 | 0 | 0 | 0 | 0 | 0 | 0 | 0 | 0.25 | 0 | 0 | 0 | 0 | 0 | 0 | 0 | 0.42 | 0 | 0.12 | 0 | 0.15 | 0.41 | 2.63 |
| A21 | Iberia Airlines | 0.48 | 0 | 0 | 1.08 | 1.11 | 0.28 | 0 | 0 | 0.12 | 0.43 | 0 | 0 | 3.18 | 0 | 0.04 | 0.35 | 0 | 0.39 | 0.07 | 0 | 0.08 | 0 | 0.03 | 1.38 | 0 | 0 | 0 |
| A22 | Icelandair | 0.68 | 0 | 0 | 0.13 | 2.66 | 0.01 | 0 | 0 | 0 | 0 | 0.8 | 0 | 0.03 | 3 | 0 | 0 | 0 | 1.14 | 0 | 0 | 0.07 | 0 | 0.02 | 0.45 | 0 | 0 | 0 |
| A23 | Jet2.com | 0 | 0 | 0 | 0 | 0 | 0 | 0 | 0 | 0 | 0 | 0 | 0 | 0 | 0 | 8 | 0.5 | 0 | 0 | 0 | 0 | 0 | 0 | 0.5 | 0 | 0 | 0 | 0 |
| A24 | KLM Royal Dutch Airlines | 0 | 0 | 0 | 1.17 | 1.11 | 0.36 | 0 | 0 | 0 | 0.28 | 0 | 0 | 3.08 | 0.05 | 0 | 0.34 | 0 | 0.2 | 0.14 | 0 | 0.08 | 0 | 0.03 | 2.18 | 0 | 0 | 0 |
| A25 | LOT Polish Airlines | 0 | 0 | 0 | 0 | 0 | 0 | 0 | 0 | 0 | 0 | 0 | 0 | 0 | 0 | 8 | 0.5 | 0 | 0 | 0 | 0 | 0 | 0 | 0.5 | 0 | 0 | 0 | 0 |
| A26 | Lufthansa | 0 | 0 | 0 | 0 | 0 | 0 | 0 | 0 | 0 | 0 | 0 | 0 | 0 | 0 | 0 | 9 | 0 | 0 | 0 | 0 | 0 | 0 | 0 | 0 | 0 | 0 | 0 |
| A27 | Luxair | 0.74 | 0 | 0 | 0.4 | 3.9 | 0 | 0 | 0 | 0 | 1.21 | 0 | 1.22 | 0 | 0 | 0 | 0 | 0.57 | 0 | 0 | 0 | 0 | 0.06 | 0.06 | 0.05 | 0.16 | 0.05 | 0.56 |
| A28 | Meridiana | 0.9 | 0 | 0 | 0.45 | 3.76 | 0 | 0 | 0 | 0 | 1.11 | 0 | 1.25 | 0.05 | 0 | 0 | 0 | 0.57 | 0.01 | 0 | 0 | 0 | 0.06 | 0.04 | 0.02 | 0.24 | 0.05 | 0.49 |
| A29 | Monarch Airlines | 0 | 0 | 0 | 0.16 | 0.28 | 0 | 0 | 0 | 0 | 0 | 0 | 0 | 0 | 0 | 0 | 0 | 6 | 2 | 0 | 0 | 0.56 | 0 | 0 | 0 | 0 | 0 | 0 |
| A30 | Norwegian Air Shuttle | 0 | 0 | 0 | 0.16 | 0.28 | 0 | 0 | 0 | 0 | 0 | 0 | 0 | 0 | 0 | 0 | 0 | 5 | 3 | 0 | 0 | 0.56 | 0 | 0 | 0 | 0 | 0 | 0 |
| A31 | Ryanair | 0 | 0 | 0 | 0.37 | 0 | 0 | 0 | 0 | 0 | 0 | 0 | 0 | 0 | 0 | 0 | 0.05 | 0 | 0 | 8 | 0 | 0 | 0 | 0.57 | 0 | 0 | 0 | 0 |
| A32 | S7 Airlines | 0 | 0 | 0 | 0 | 0.02 | 0 | 0 | 0 | 0 | 0 | 0 | 0 | 0 | 0 | 0 | 0 | 0 | 0 | 0 | 8 | 0 | 0 | 0 | 0 | 0.97 | 0 | 0 |
| A33 | Scandinavian Airlines System | 0 | 0 | 0 | 0 | 0 | 0 | 0 | 0 | 0 | 0 | 0 | 0 | 0 | 0 | 0 | 0 | 0 | 0 | 0 | 0 | 9 | 0 | 0 | 0 | 0 | 0 | 0 |
| A34 | Sunexpress | 0 | 0 | 0 | 0 | 0 | 0 | 0 | 0 | 0 | 0 | 0 | 0 | 0 | 0 | 0 | 0 | 0 | 0 | 0 | 0 | 0 | 9 | 0 | 0 | 0 | 0 | 0 |
| A35 | TAP Portugal | 0 | 0 | 0 | 3.38 | 1.12 | 0 | 0 | 0 | 0 | 0 | 0 | 0 | 0 | 0 | 0 | 0.02 | 0.09 | 0 | 0 | 0 | 0.26 | 0 | 0.33 | 3.35 | 0 | 0.45 | 0 |
| A36 | TAROM | 2.4 | 0 | 0 | 0 | 1 | 0 | 0.14 | 0.03 | 0 | 0 | 0.18 | 1.56 | 0.04 | 0 | 0 | 0 | 1.46 | 0.74 | 0 | 0.14 | 0.64 | 0.26 | 0 | 0 | 0.22 | 0.17 | 0 |
| A37 | Travel Service | 2.43 | 0 | 0 | 0.02 | 0.97 | 0 | 0.14 | 0.03 | 0 | 0 | 0.18 | 1.56 | 0.04 | 0 | 0 | 0 | 1.47 | 0.72 | 0 | 0.14 | 0.63 | 0.26 | 0 | 0 | 0.22 | 0.17 | 0 |
| A38 | Turkish Airlines | 2.39 | 0 | 0 | 0 | 1.01 | 0 | 0.14 | 0.03 | 0 | 0 | 0.18 | 1.56 | 0.04 | 0 | 0 | 0 | 1.69 | 0.51 | 0 | 0.14 | 0.64 | 0.26 | 0 | 0 | 0.22 | 0.17 | 0 |
| A39 | Ukraine International Airlines | 0 | 0 | 0 | 0 | 0 | 0 | 0 | 0 | 0 | 0 | 0 | 0 | 0 | 0 | 0 | 0 | 0 | 0 | 0 | 0 | 0 | 0 | 9 | 0 | 0 | 0 | 0 |
| A40 | Virgin Atlantic Airways | 0 | 0 | 0 | 0.84 | 0 | 0 | 0 | 0 | 0 | 0 | 0 | 0 | 0 | 0 | 0 | 0 | 0 | 0 | 0 | 0 | 0.16 | 0 | 0 | 8 | 0 | 0 | 0 |
| A41 | Volotea | 0 | 0 | 0 | 0 | 0 | 0 | 0 | 0 | 0 | 0 | 0 | 0 | 0 | 0 | 0 | 0 | 0 | 0 | 0 | 0 | 0 | 0 | 0 | 0 | 9 | 0 | 0 |
| A42 | Vueling Airlines | 0.02 | 0 | 0 | 0.1 | 5.11 | 0 | 0 | 0 | 0 | 0 | 0 | 0 | 0.32 | 0 | 0 | 0 | 0 | 0 | 0 | 0 | 0.18 | 0 | 0.31 | 0 | 0 | 2 | 0.94 |
| A43 | Wizz Air | 0 | 0 | 0 | 0 | 0 | 0 | 0 | 0 | 0 | 0 | 0 | 0 | 0 | 0 | 0 | 0 | 0 | 0 | 0 | 0 | 0 | 0 | 0 | 0 | 0 | 0 | 9 |
References
- Bauer, P. Decomposing TFP growth in the presence of cost inefficiency, nonconstant returns to scale, and technological progress. J. Product. Anal. 1990, 1, 287–299. [Google Scholar] [CrossRef]
- Good, D.H.; Nadiri, M.I.; Sickles, R.C. Efficiency and productivity growth comparisons of European and US Air carriers: A first look at the data. J. Product. Anal. 1993, 4, 115–125. [Google Scholar] [CrossRef]
- Baltagi, B.; Griffin, J.; Rich, D. Airline deregulation: The cost pieces of the puzzle. Int. Econ. Rev. 1995, 245–258. [Google Scholar] [CrossRef]
- Barbot, C.; Costa, Á.; Sochirca, E. Airlines performance in the new market context: A comparative productivity and efficiency analysis. J. Air Transp. Manag. 2008, 14, 270–274. [Google Scholar] [CrossRef]
- Charnes, A.; Gallegos, A.; Li, H. Robustly efficient parametric frontiers via Multiplicative DEA for domestic and international operations of the Latin American airline industry. Eur. J. Oper. Res. 1996, 88, 525–536. [Google Scholar] [CrossRef]
- Good, D.H.; Röller, L.H.; Sickles, R.C. Airline efficiency differences between Europe and the US: Implications for the pace of EC integration and domestic regulation. Eur. J. Oper. Res. 1995, 80, 508–518. [Google Scholar] [CrossRef]
- Arjomandi, A.; Seufert, J.H. An evaluation of the world’s major airlines’ technical and environmental performance. Econ. Model. 2014, 41, 1–12. [Google Scholar] [CrossRef]
- Tsionas, E.; Assaf, A.G.; Gillen, D.; Mattila, A.S. Modeling technical and service efficiency. Transp. Res. Part B Methodol. 2017, 96, 113–125. [Google Scholar] [CrossRef]
- Cui, Q. Investigating the airlines emission reduction through carbon trading under CNG2020 strategy via a Network Weak Disposability DEA. Energy 2019, 180, 763–771. [Google Scholar] [CrossRef]
- Yu, H.; Zhang, Y.; Zhang, A.; Wang, K.; Cui, Q. A comparative study of airline efficiency in China and India: A dynamic network DEA approach. Res. Transp. Econ. 2019. [Google Scholar] [CrossRef]
- Lozano, S.; Gutiérrez, E. Efficiency Analysis and Target Setting of Spanish Airports. Netw. Spat. Econ. 2011, 11, 139–157. [Google Scholar] [CrossRef]
- Figueiredo, S.; Gomes, J.; Paula, A.; Baptista, C.; de Mello, S.; Angulo, L. Evaluation of Brazilian airlines nonradial efficiencies and targets using an alternative DEA approach. Int. Trans. Oper. Res. 2016, 23, 669–689. [Google Scholar] [CrossRef]
- Choi, K.; Lee, D.; Olson, D.L. Service quality and productivity in the US airline industry: A service quality-adjusted DEA model. Serv. Bus. 2013, 9, 137–160. [Google Scholar] [CrossRef]
- Li, Y.; Wang, Y.; Cui, Q. Has airline efficiency affected by the inclusion of aviation into European Union Emission Trading Scheme? Evidences from 22 airlines during 2008–2012. Energy 2016, 96, 8–22. [Google Scholar] [CrossRef]
- Koka, B.R.; Prescott, J.E. Strategic Alliances as Social Capital: A Multidimensional View. Strateg. Manag. J. 2002, 23, 795–816. [Google Scholar] [CrossRef]
- Barros, C.; Leach, S. Analyzing the performance of the English FA Premier League with an econometric frontier model. J. Sports Econom. 2006, 7, 391–407. [Google Scholar] [CrossRef]
- Sjögren, S.; Söderberg, M. Productivity of airline carriers and its relation to deregulation, privatisation and membership in strategic alliances. Transp. Res. Part E Logist. Transp. Rev. 2011, 47, 228–237. [Google Scholar] [CrossRef]
- Greer, M. Is it the labor unions’ fault? Dissecting the causes of the impaired technical efficiencies of the legacy carriers in the United States. Transp. Res. Part A Policy Pract. 2009, 43, 779–789. [Google Scholar] [CrossRef]
- Merkert, R.; Hensher, D. The Impact of Strategic Management and Fleet Planning on Airline efficiency. Transp. Res. Part A Policy Pract. 2011, 45, 689–695. [Google Scholar] [CrossRef]
- Taymaz, E. Are small firms really less productive? Small Bus. Econ. 2005, 25, 429–445. [Google Scholar] [CrossRef]
- Barney, J. Firm Resources and Sustained Competitive Advantage. J. Manag. 1991, 17, 99–120. [Google Scholar] [CrossRef]
- Barney, J. Resource-based theories of competitive advantage: A ten-year retrospective on the resource-based view. J. Manag. 2001, 27, 643–650. [Google Scholar] [CrossRef]
- Mellroth, P.; Karlsson, J.; Steiner, H. A scavenger function for a Drosophila peptidoglycan recognition protein. J. Biol. Chem. 2003, 278, 7059–7064. [Google Scholar] [CrossRef] [PubMed]
- Barros, C.; Liang, Q.; Peypoch, N. The technical efficiency of US Airlines. Transp. Res. Part A Policy Pract. 2013, 50, 139–148. [Google Scholar] [CrossRef]
- Union, I. Communication from the Commission to the European Parliament, the Council, the European Economic and Social Committee and the Committee of the Regions. A New Skills Agenda for Europe. Brussels, Belgium, 2014. Available online: https://eur-lex.europa.eu/legal-content/EN/ALL/?uri=COM:2015:614:FIN (accessed on 24 September 2017).
- Davis, H.S. The Measurement of Productive Efficiency. Ind. Study Econ. Prog. 2018, 16–35. [Google Scholar] [CrossRef]
- Liu, J.; Lu, L.; Lu, W.; Lin, B. A survey of DEA applications. Omega 2013, 41, 893–902. [Google Scholar] [CrossRef]
- Cui, Q.; Li, Y. Evaluating energy efficiency for airlines: An application of VFB-DEA. J. Air Transp. Manag. 2015, 44, 34–41. [Google Scholar] [CrossRef]
- Greer, M.R. Nothing focuses the mind on productivity quite like the fear of liquidation: Changes in airline productivity in the United States, 2000–2004. Transp. Res. Part A Policy Pract. 2008, 42, 414–426. [Google Scholar] [CrossRef]
- Mallikarjun, S. Efficiency of US airlines: A strategic operating model. J. Air Transp. Manag. 2015, 43, 46–56. [Google Scholar] [CrossRef]
- Oum, T.H.; Pathomsiri, S.; Yoshida, Y. Limitations of DEA-based approach and alternative methods in the measurement and comparison of social efficiency across firms in different transport modes: An empirical study in Japan. Transp. Res. Part E Logist. Transp. Rev. 2013, 57, 16–26. [Google Scholar] [CrossRef]
- Chang, Y.-T.; Park, H.; Jeong, J.; Lee, J. Evaluating economic and environmental efficiency of global airlines: A SBM-DEA approach. Transp. Res. Part D Transp. Environ. 2014, 27, 46–50. [Google Scholar] [CrossRef]
- Duygun, M.; Prior, D.; Shaban, M.; Tortosa-Ausina, E. Disentangling the European airlines efficiency puzzle: A network data envelopment analysis approach. Omega 2015, 60, 2–14. [Google Scholar] [CrossRef]
- Scotti, D.; Volta, N. An empirical assessment of the co2-sensitive productivity of European airlines from 2000 to 2010. Transp. Res. Part D Transp. Environ. 2015, 37, 137–149. [Google Scholar] [CrossRef]
- Barros, C.P.; Peypoch, N. An evaluation of European airlines’ operational performance. Int. J. Prod. Econ. 2009, 122, 525–533. [Google Scholar] [CrossRef]
- Lee, B.L.; Worthington, A.C. Technical efficiency of mainstream airlines and low-cost carriers: New evidence using bootstrap data envelopment analysis truncated regression. J. Air Transp. Manag. 2014, 38, 15–20. [Google Scholar] [CrossRef]
- Merkert, R.; Williams, G. Determinants of European PSO airline efficiency—Evidence from a semi-parametric approach. J. Air Transp. Manag. 2013, 29, 11–16. [Google Scholar] [CrossRef]
- Knoblich, S.; Martin, A.; Nash, R.; Stansbie, P. Keys to Success in Social Media Marketing (SMM)—Prospects for the German Airline Industry. Tour. Hosp. Res. 2015, 1–18. [Google Scholar] [CrossRef]
- Felix, R.; Rauschnabel, P.A.; Hinsch, C. Elements of strategic social media marketing: A holistic framework. J. Bus. Res. 2016. [Google Scholar] [CrossRef]
- Hudson, S.; Roth, M.S.; Madden, T.J.; Hudson, R. The effects of social media on emotions, brand relationship quality, and word of mouth: An empirical study of music festival attendees. Tour. Manag. 2015, 47, 68–76. [Google Scholar] [CrossRef]
- Jucaityt, I.; Mašinskien, J. Peculiarities of social media integration into marketing communication. Procedia-Soc. Behav. Sci. 2014, 156, 490–495. [Google Scholar] [CrossRef][Green Version]
- Lee, Y.-K.; Park, J.-W. Impact of a sustainable brand on improving business performance of airport enterprises: The case of Incheon International Airport. J. Air Transp. Manag. 2016, 53, 46–53. [Google Scholar] [CrossRef]
- Estrada, E.; Gómez-Gardeñes, J. Network bipartivity and the transportation efficiency of European passenger airlines. Phys. D Nonlinear Phenom. 2016, 323, 57–63. [Google Scholar] [CrossRef]
- Brueckner, J.K. Internalization of airport congestion: A network analysis. Int. J. Ind. Organ. 2005, 23, 599–614. [Google Scholar] [CrossRef]
- Bagler, G. Analysis of the airport network of India as a complex weighted network. Phys. A Stat. Mech. Its Appl. 2008, 387, 2972–2980. [Google Scholar] [CrossRef]
- Jain, R.K.; Natarajan, R. A DEA study of airlines in India. Asia Pac. Manag. Rev. 2015, 20, 285–292. [Google Scholar] [CrossRef]
- Wanke, P.; Barros, C.P. Efficiency in Latin American airlines: A two-stage approach combining Virtual Frontier Dynamic DEA and Simplex Regression. J. Air Transp. Manag. 2016, 54, 93–103. [Google Scholar] [CrossRef]
- Omrani, H.; Soltanzadeh, E. Journal of Air Transport Management Dynamic DEA models with network structure: An application for Iranian airlines. J. Air Transp. Manag. 2016, 57, 52–61. [Google Scholar] [CrossRef]
- Charnes, A.; Cooper, W.; Rhodes, E. Measuring the efficiency of decision making units. Eur. J. Oper. Res. 1978, 2, 429–444. [Google Scholar] [CrossRef]
- Banker, R.D.; Charnes, A.; Cooper, W.W. Some Models for Estimating Technical and Scale Inefficiencies in Data Envelopment Analysis. Manag. Sci. 1984, 30, 1078–1092. [Google Scholar] [CrossRef]
- Efron, B. Bootstrap Methods: Another Look at the Jackknife; Springer: New York, NY, USA, 1992. [Google Scholar]
- Simar, L.; Wilson, P. A general methodology for bootstrapping in non-parametric frontier models. J. Appl. Stat. 2000, 27, 779–802. [Google Scholar] [CrossRef]
- Simar, L.; Wilson, P. Sensitivity Analysis of Efficiency Scores: How to Bootstrap in Nonparametric Frontier Models. Manag. Sci. 1998. [Google Scholar] [CrossRef]
- Silverman, B.; Young, G. The bootstrap: To smooth or not to smooth? Biometrika 1987, 74, 469–479. [Google Scholar] [CrossRef]
- Simar, L.; Wilson, P. Statistical inference in nonparametric frontier models: The state of the art. J. Product. Anal. 2000, 13, 49–78. [Google Scholar]
- Martínez-Núñez, M.; Pérez-Aguiar, W.S. Efficiency analysis of information technology and online social networks management: An integrated DEA-model assessment. Inf. Manag. 2014, 51, 712–725. [Google Scholar] [CrossRef]
- Freeman, L.C. A Set of Measures of Centrality Based on Betweenness. Sociometry 1977, 40, 35–41. [Google Scholar] [CrossRef]
- Jackson, M.O. Social and Economic Networks; Princeton University Press: Princeton, NJ, USA, 2008. [Google Scholar]
- Bonacich, P. Power and Centrality: A Family of Measures. Am. J. Sociol. 1987, 92, 1170–1182. [Google Scholar] [CrossRef]
- Liu, J.; Lu, W. A network-based approach for increasing discrimination in data envelopment analysis. J. Oper. Res. Soc. 2009, 60, 1502–1510. [Google Scholar] [CrossRef]
- Sigala, M. The information and communication technologies productivity impact on the UK hotel sector. Int. J. Oper. Prod. Manag. 2003, 23, 1224–1245. [Google Scholar] [CrossRef]
- Banker, R.; Morey, R. Efficiency analysis for exogenously fixed inputs and outputs. Oper. Res. 1986, 34, 513–521. [Google Scholar] [CrossRef]
- Thore, S.; Kozmetsky, G.; Phillips, F. DEA of financial statements data: The US computer industry. J. Product. Anal. 1994, 5, 229–248. [Google Scholar] [CrossRef]
- Groza, M.D.; Pronschinske, M. Attracting Facebook fans: The importance of authenticity and engagement as a social networking strategy for professional sport teams. Sport Mark. Q. 2012, 21, 221–231. [Google Scholar]
- Stavros, C.; Meng, M.D.; Westberg, K.; Farrelly, F. Understanding fan motivation for interacting on social media. Sport Manag. Rev. 2014, 17, 455–469. [Google Scholar] [CrossRef]
- Cooper, W.; Seiford, L.; Tone, K. Introduction to Data Envelopment Analysis and Its Uses: With DEA-Solver Software and References; Springer Science & Business Media: New York, NY, USA, 2006. [Google Scholar]
- Fried, H.; Schmidt, S.; Yaisawarng, S. Incorporating the operating environment into a nonparametric measure of technical efficiency. J. Product. Anal. 1999, 12, 249–267. [Google Scholar] [CrossRef]
- Angulo-Meza, L.; Lins, M. Review of methods for increasing discrimination in data envelopment analysis. Ann. Oper. Res. 2002, 225–242. [Google Scholar] [CrossRef]
- Adler, N.; Friedman, L.; Sinuany-Stern, Z. Review of ranking methods in the data envelopment analysis context. Eur. J. Oper. Res. 2002, 249–265. [Google Scholar] [CrossRef]
- Lu, W.; Lo, S. An interactive benchmark model ranking performers—Application to financial holding companies. Math. Comput. Model. 2009, 49, 172–179. [Google Scholar] [CrossRef]
- Helfat, C.; Peteraf, M. The dynamic resource-based view: Capability lifecycles. Strateg. Manag. J. 2003, 24, 997–1010. [Google Scholar] [CrossRef]
- Faber, M. Social Media bei Airlines, TOUROM-Studie. Kastellaun, Frankfurt, Germany, 2011. [Google Scholar]
- Zarrella, D. The Social Media Marketing Book; O’Reilly Media Inc.: Sebastopol, CA, USA, 2009. [Google Scholar]
- Hoffman, D.; Fodor, M. Can you measure the ROI of your social media marketing? MIT Sloan Manag. Rev. 2010, 52, 41. [Google Scholar]
- Latorre-Martínez, M.P.; Iñíguez-Berrozpe, T.; Plumed-Lasarte, M. Image-focused social media for a market analysis of tourism consumption. Int. J. Technol. Manag. 2014, 64, 17–30. [Google Scholar] [CrossRef]
- Kietzmann, J.; Hermkens, K.; McCarthy, I.; Silvestre, B. Social media? Get serious! Understanding the functional building blocks of social media. Bus. Horiz. 2011, 54, 241–251. [Google Scholar] [CrossRef]
© 2019 by the authors. Licensee MDPI, Basel, Switzerland. This article is an open access article distributed under the terms and conditions of the Creative Commons Attribution (CC BY) license (http://creativecommons.org/licenses/by/4.0/).