Featured Application
The obtained optimal sound absorption performance can promote practical application of a composite structure of a microperforated panel and porous metal in noise reduction.
Abstract
The composite structure of a microperforated panel and porous metal is a promising sound absorber for industrial noise reduction, sound absorption performance of which can be improved through parameter optimization. A theoretical model is constructed for the composite structure of a microperforated panel and porous metal based on Maa’s theory and the Johnson–Champoux–Allard model. When the limited total thickness is 30 mm, 50 mm, and 100 mm respectively, dimensional optimization of structural parameters of the proposed composite structure is conducted for the optimal average sound absorption coefficient in the frequency range (2000 Hz, 6000 Hz) through a cuckoo search algorithm. Simulation models of the composite structures with optimal structural parameters are constructed based on the finite element method. Validations of the optimal composite structures are conducted based on the standing wave tube method. Comparative analysis of the theoretical data, simulation data, and experimental data validates feasibility and effectiveness of the parameter optimization. The optimal sandwich structure with an actual total thickness of 36.8 mm can obtain the average sound absorption coefficient of 97.65% in the frequency range (2000 Hz, 6000 Hz), which is favorable to promote practical application of the composite structures in the fields of sound absorption and noise reduction.
1. Introduction
The noises generated by large mechanical and electrical apparatuses are major component of industrial noise, which not only impair health of the operators, but also are detrimental to the residents living around the workshops [1]. In addition to traditional control strategies [2,3], such as the application of equipment with less noise, reasonable layout of the workshops, appropriate planting of vegetation, and wearing of personal protective appliance, installation of a proper acoustic absorber around the noise source or on the wall of the workshop is an effective method to reduce reflecting superposition of the noise [4]. This is favorable to effectively decrease the noise inside and outside the workshop, therefore the development of a novel acoustic absorber is one of the research focuses in the field of industrial noise reduction.
Many sound absorbing materials and structures have been developed to reduce industrial noise. Maa [5,6] proposed the classical microperforated panel and proved it an effective and simple method to reduce the industrial noise within the low-and-medium frequency range. Ning et al. [7] further developed the novel microperforated panel with arbitrary cross-sectional perforations, and the research products indicated that changing cross-sectional roughness of the perforations was an efficient method to improve its sound absorption performance. Yang et al. [8] pointed out that porous metal could achieve a high sound absorption coefficient in the medium-and-high frequency range, and Bai et al. [9] further improved sound absorption efficiency of the porous metal through the compression process and quantificationally investigated the effect of the compression ratio. In addition to these traditional sound absorbing materials and structures, some novel acoustic meta-structures and metamaterials are also proposed [10,11,12,13,14]. Cheng et al. [10] has developed a 0.15λ-thick, 15%-filling ratio ultra-sparse meta-surface based on artificial Mie resonance. With careful design of the coupled resonators by Li et al. [11,12], over 99% energy absorption at the central frequency of 511 Hz with a 50% absorption bandwidth of 140 Hz was achieved. An acoustic super-lens using single-phase metamaterials with star-shaped structure were proposed by Chen et al. [13,14], which could obtain band gap and double-negative properties. However, fabrication costs of the acoustic metamaterials are high in general and the structures of them are usually complicated at present, which limit their practical applications. Meanwhile, each single traditional sound absorber has its weakness, such as finite absorption band, excessive occupied space, and so on. Thus, the composite structure consisting of a single sound absorber is considered as the development direction of novel acoustic absorbers.
Sound absorption performances of flax fiber and its reinforced composite, as well as balsa wood, were evaluated by Zhang et al. [15] and Zheng et al. [16] respectively, and it showed that the natural-materials-based sandwich structure has a high sound absorption coefficient within the high frequency range. Kim et al. [17,18] proposed a composite sound absorption structure, and the composite helical-shaped sound absorber coated with the carbon fiber exhibits excellent sound absorption property, especially within the low frequency range. Barium titanate/nitrile butadiene rubber (BT/NBR) and polyurethane (PU) foam were combined to prepare sound absorbing material with an alternating multilayered structure by Jiang et al. [19,20,21], and it has excellent sound absorption performance within the low frequency range due to the organic combinations of airflow resistivity, resonance absorption, and interface dissipation. Lv et al. [22,23] took discarded polyester as reinforced material and thermoplastic polyurethane as matrix material to fabricate a three-layer structural composite for sound absorption, research results of which indicate that the proposed composite has better sound absorption property and application prospects than the monolayer samples. Among these composite structures, the combination of a microperforated panel and porous metal is considered as a promising acoustic absorber for reducing industrial noise in the workshop, because it has the advantages of wide absorption band, fine fire resistance, high strength, excellent machinability, and a low manufacturing cost [24,25]. Therefore, the composite structures of a microperforated panel and porous metal were investigated and optimized in this study.
The research target of this study was to develop a novel acoustic absorber for the industrial noise reduction in a workshop, and the corresponding frequency range was (2000 Hz, 6000 Hz). Taking this practical demand into account, three kinds of composite structures were proposed and investigated, which included the porous metal + cavity + microperforated panel + cavity (here-after labeled as PCMC), microperforated panel + cavity + porous metal + cavity (here-after labeled as MCPC), and porous metal + cavity + microperforated panel + cavity + porous metal + cavity (here-after labeled as PCMCPC). Meanwhile, porous metal + cavity (here-after labeled as PC) and microperforated panel + cavity (here-after labeled as MC) were studied for contrast. In practical applications, the total thickness of the sound absorber is a critical factor, because the available space to install the sound absorber is limited. Therefore, sound absorption performances of these five kinds of acoustic absorbers with the limited total thickness of 30 mm, 50 mm, and 100 mm were investigated respectively in this study. A theoretical model was constructed for the composite structure of a microperforated panel and porous metal by the transfer matrix method based on the Maa’s theory [26] and the Johnson–Champoux–Allard model [27]. According to this model, the dimensional optimization of structural parameters of the proposed composite structure was conducted by the cuckoo search algorithm [28,29]. The achieved optimal structural parameters were introduced in the simulation model based on the finite element method for the preliminary verification [30,31]. In accordance with the achieved optimal structural parameters, the required microperforated panels were fabricated by precision laser beam machining [32], and the porous metals were prepared by electrodeposition [33]. According to the standing wave tube method [34,35,36,37], sound absorption coefficients of the prepared composite structure were measured by the AWA6128A detector for the experimental validation of the theoretical model and optimization algorithm. Through comparison of theoretical data, simulation data, and experimental data, a novel method to investigate and optimize sound absorption performance of the composite structure of microperforated panel and porous metal was proposed and validated.
2. Materials and Methods
2.1. Modeling of the Composite Structure
Schematic diagrams of the proposed composite structures are shown in Figure 1a,c,e, which corresponded to the composite structures of PCMC, MCPC, and PCMCPC, respectively. The PC and MC were investigated as the contrast, as shown in the Figure 1b,d respectively. The parameters for the microperforated panel and its corresponding cavity included diameter of the hole , distance between the neighboring holes , thickness of the panel , and length of the cavity , and those for the porous metal and its corresponding cavity consisted of thickness of the material and length of the cavity . For clarity in the Figure 1e, parameters for the preposition porous metal and its corresponding cavity were labeled as and respectively, and those for the postposition porous metal and its corresponding cavity were labeled as and respectively. The sound absorption mechanism of the microperforated panel could be obtained based on Maa’s theory [5,6,26] and that of the porous metal could be achieved according to the Johnson–Champoux–Allard model [8,9,27], and theoretical models for the proposed composite structures could be calculated through the transfer matrix method [38,39]. The transfer matrixes for relevant structures were as follows.
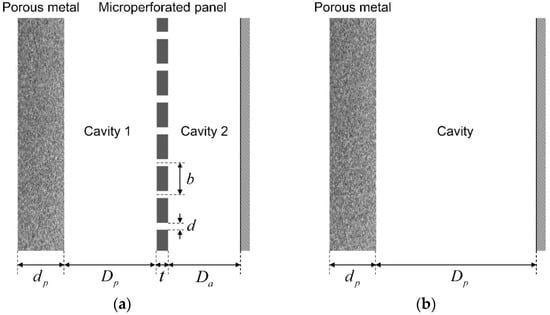
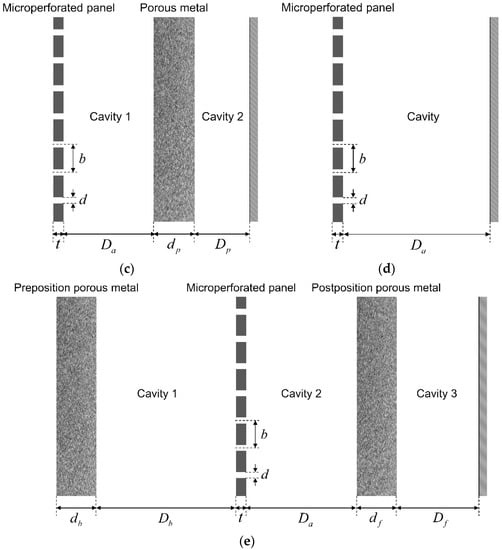
Figure 1.
Schematic diagrams of the investigated composite structures and corresponding labels of their structural parameters. (a) porous metal + cavity + microperforated panel + cavity (PCMC); (b) porous metal + cavity (PC); (c) microperforated panel + cavity + porous metal + cavity (MCPC); (d) microperforated panel + cavity (MC); (e) porous metal + cavity + microperforated panel + cavity + porous metal + cavity (PCMCPC).
2.1.1. Transfer Matrix for the Porous Metal
Transfer matrix for the porous metal can be calculated using Equation (1). Here is the wave number in the porous material, which is obtained using Equation (2); is characteristic impedance of the porous metal, which can be achieved using Equation (3); is the thickness of the porous metal [8,9,27,36,37]. Transfer matrix of the preposition porous metal and that of the postposition porous metal in Figure 1e are symbolized as and respectively.
In the Equations (2) and (3), the symbol is the angular frequency, which can be calculated using Equation (4); is the complex effective bulk modulus, which can be calculated using Equation (5); is complex effective density, which is derived by Equation (6) [8,9,27,36,37].
In the Equation (4), is sound frequency, and its range is (2000 Hz, 6000 Hz) in this study. In the Equations (5) and (6), is specific heat ratio of the air, 1.40; is static pressure of the air, ; is the Nusselt number, 4.36; is symbol of the imaginary number, ; is density of the air, is the Prandtl number, 0.71 [8,9,40]. Meanwhile, static flow resistivity and porosity of the selected porous metal in the proposed composite structures for this study can be measured and identified as and 0.9, respectively.
2.1.2. Transfer Matrix for the Microperforated Panel
Transfer matrix for the microperforated panel can be calculated using Equation (7). Here is acoustic impedance rate of the microperforated panel, which consists of the real part and the imaginary part , as shown in Equation (8). and are calculated by the Equations (9) and (10) respectively.
In the Equations (9) and (10), is viscosity coefficient of the air, ; is the temperature conduction coefficient of the metal panel, ; is density of the air, ; is the perforating rate, which can be calculated using Equation (11); is the acoustic resistance constant, which can be obtained using Equation (12); is still the angular frequency; is the acoustic mass constant, which can be derived using Equation (13) [26,38]. In the Equations (12) and (13), is the perforated panel constant, which can be calculated using Equation (14). , , and represent the diameter of the hole, distance between the neighboring holes, and thickness of the panel, respectively, which are consistent with definitions of structural parameters of the microperforated panel in the Figure 1.
2.1.3. Transfer Matrix for the Cavity
Transfer matrix for the cavity can be calculated using Equation (15). Here is still the angular frequency; is the acoustic velocity in air, ; is length of the cavity.
In order to make a distinction among the different cavities, transfer matrixes for the cavities behind the microperforated panels in the Figure 1a,c–e are symbolized as ; those behind the porous metal samples in the Figure 1a–c are symbolized as ; those behind the preposition porous metal and those behind the postposition porous metal in the Figure 1e are symbolized as and respectively.
2.1.4. Sound Absorption Coefficient of the Composite Structure
Based on the obtained transfer matrixes for the porous metal, microperforated panel, and the cavity, total transfer matrixes for the investigated five composite structures can be derived by the Equations (16)–(20), respectively, which correspond to the sound absorbers in the Figure 1a–e. By this method, sound absorption coefficient of the investigated composite structures can be calculated, as shown in Equation (21).
2.2. Parameter Optimization by the Cuckoo Search Algorithm
Sound absorption performance of the composite structure is mainly determined by its structural parameters, which can be judged from the constructed theoretical model in the Section 2.1. For the given porous metal sample, the influencing factors were its thickness and length of the rear cavity. With regard to the microperforated panel absorber, the influencing factors were diameter of the hole, distance between the neighboring holes, thickness of the panel, and length of the rear cavity. A simple investigation on influence of the structural parameters to the sound absorption performance was conducted by selecting a series of varied parameters for the composite structure of PCMC in the Figure 1a with the same total thickness of 40 mm, as shown in the Figure 2, and the corresponding selected parameters are summarized in the Table 1. It can be observed that the changes of structural parameter led to notable variety of sound absorption coefficient, which indicated that optimization of structural parameters of the composite structure was not only an essential, but also an effective method to develop the desired sound absorber.
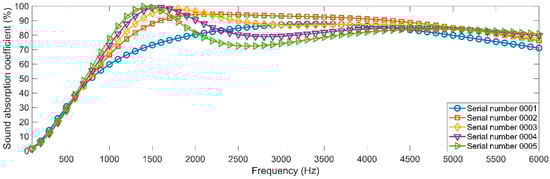
Figure 2.
Qualitative comparisons of sound absorption coefficient of the composite sound absorbing structures with the varied structural parameters.

Table 1.
The selected parameters for studying their influence on the sound absorption performance.
Total thickness of the composite sound absorbing structure is an important factor that affects its practical application, which consists of thickness of the porous metal, thickness of the panel, and length of each rear cavity. Total thickness of the five composite structures in the Figure 1 can be calculated using Equation (22).
Supposing the limit for total thickness of the sound absorber is , it is determined by the available space for installing the sound absorber. The normal range in a common workshop is 10–100 mm, so the selected constraint conditions of 30 mm, 50 mm, and 100 mm were investigated in this research. In addition to the total thickness, each structure parameter also has the constraint condition for the practical application. Thickness of the porous metal and that of the microperforated panel shall be not too small, otherwise strength and stiffness of the formed composite structure will be too low. Meanwhile, according to the definition of the microperforated panel and process capability of the used precise machine tool, the diameter of the hole and distance of the neighboring holes should be in a reasonable range. Therefore, constraint conditions for the parameter optimization of the composite structure are summarized in Equation (23).
Judging from the results in the Figure 2, it could also be observed that the sound absorption performance was not only decided by the structural parameters, but also be affected by the selected frequency range . For the varied frequency ranges, the optimal choice for structural parameters is different. Therefore, taking into account the normal frequency range of the major noise generated by the common large mechanical and electrical equipment in the workshop in this study, the investigated frequency range was set to be (2000 Hz, 6000 Hz). In fact, the optimization method proposed in this research was also applicable for the circumstances with other frequency ranges or other constraint conditions.
The cuckoo search algorithm is considered as an effective method in solving the continuous optimization problem [35,36,37,41,42], which was proposed by Yang and Deb in 2009 [28,29] based on the obligate brood parasitic behavior of some cuckoo species in combination with the Levy flight behavior of some birds and fruit flies. The cuckoo search algorithm can be expressed around the following ideal rules: (1) each cuckoo lays one egg at a time and selects a nest randomly; (2) the best nest with the highest quality egg can pass onto the new generations; (3) the number of host nests is fixed, and the egg laid by a cuckoo can be discovered by the host bird with the probability [28,29,35,36,37,41,42]. With respect to a certain cuckoo and a given generation , the new solution can be generated from the former solution according to the Levy flight mechanism, as shown in Equation (24) [28,29,35,36,37,41,42].
Here is the step size, which decides how far a random walker can go for a fixed number of iterations. In most common cases, can be used. The product means the entry-wise multiplications. represents the step length, as shown in the Equation (25), which follows the Levy distribution. in Equation (25) is the step size drawn from the Levy distribution [28,29,35,36,37,41,42].
Basic calculation process of the standard cuckoo search algorithm is summarized and shown in Table 2 [28,29]. Maximization of the average sound absorption coefficient of the investigated composite structures in the frequency range (2000 Hz, 6000 Hz) was treated as the optimization target. Moreover, the constructed theoretical sound absorbing models for the composite structures in the Section 2.1 was considered as the objective function. Furthermore, the constraint conditions listed in Equation (23) were taken into account during the optimization process.
Table 2.
Basic calculation process of the standard cuckoo search algorithm.
Through the cuckoo search algorithm, optimization of structural parameters of the proposed composite structures in Figure 1 could be obtained, which have been summarized in Table 3, Table 4 and Table 5 corresponding to the given limited total thickness of 30 mm, 50 mm, and 100 mm, respectively. Comparisons of the theoretical optimal average sound absorption coefficients with different limited total thickness of 30 mm, 50 mm, and 100 mm are shown in the Figure 3. It could be judged from the optimization results that the composite structure of PCMCPC exhibited the best sound absorption performance, and optimal average sound absorption coefficient in the frequency range (2000 Hz, 6000 Hz) exceeded 98% with the total thickness of 30 mm. Moreover, sound absorption performance of the composite structure of PCMC was close to that of the PCMCPC. It could be found that the optimal parameters for the composite structure of MC with the various limited total thicknesses were all same, as shown in Table 3, Table 4 and Table 5. This result indicates that sound absorption performance of the MC was insufficient, and it could not be improved by increasing the total thickness, which could also be judged from the result in Figure 3. Furthermore, sound absorption performance of the composite structure of MCPC was significantly improved by increasing the limited total thickness, as shown in Figure 3. It is interesting to note that the optimal length of the cavity for the composite structure of PC was 0, no matter what the limited total thickness was, as shown in Table 3, Table 4 and Table 5. It could also be observed that optimal average sound absorption coefficient of the porous metal rose along with increase of the thickness, which is consistent with the normal sound absorption principle of porous materials [8,9].
Table 3.
Summarized optimal parameter of composite structure with limited total thickness 30 mm.
Table 4.
Summarized optimal parameter of composite structure with limited total thickness 50 mm.
Table 5.
Summarized optimal parameter of composite structure with limited total thickness 100 mm.
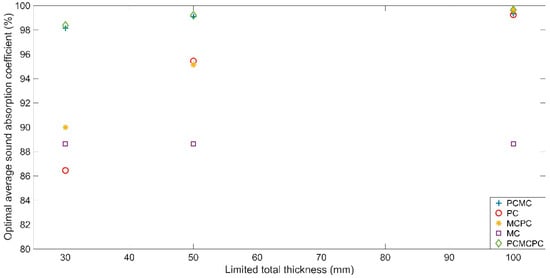
Figure 3.
Comparisons of theoretical optimal average sound absorption coefficients of the composite structures with the different limited total thickness of 30 mm, 50 mm, and 100 mm.
Detailed distributions of sound absorption coefficients of the five composite structures with the limited total thicknesses of 30 mm, 50 mm, and 100 mm are shown in the Figure 4a–c, respectively. It could be found that except the data for MC, the sound absorption performances of the other four composite structures were accordingly improved along with increase of the limited total thickness, which were consistent with the result shown in Figure 3. Meanwhile, it could be observed that undulation of the sound absorption coefficients was reduced along with increase of the limited total thickness. Especially when the limited total thickness reached 100 mm, minimum of the sound absorption coefficient in the (2000 Hz, 6000 Hz) for the investigated composite structures (except the MC) exceeded 98%, which almost realized unity absorption in the investigated frequency range. Moreover, it could be observed that along with increase of the limited total thickness, the composite structure of PC and that of MCPC achieve obvious improvement in sound absorption performance, the average sound absorption coefficients of which were improved from 86.45% to 99.24% and 89.99% to 99.64%, respectively.
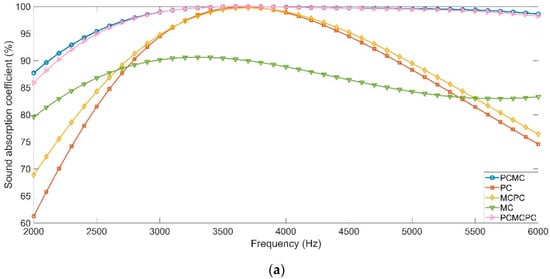
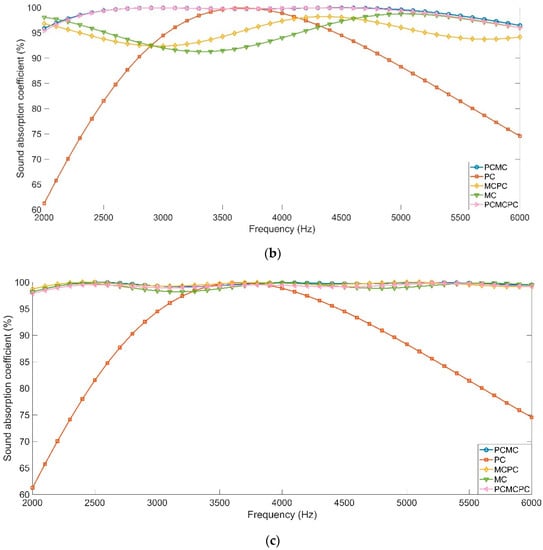
Figure 4.
Distributions of sound absorption coefficients of the optimal composite structures in theory. (a) Composite structures with limited total thickness 30 mm corresponding to parameters in Table 3; (b) composite structures with limited total thickness 50 mm corresponding to parameters in Table 4; (c) composite structures with limited total thickness 100 mm corresponding to parameters in Table 5.
3. Results and Discussions
3.1. Verification by Finite Element Simulation
Taking the most complex composite structure of PCMCPC for example, the simulation model for preliminary verification of the optimal dimensional parameters was constructed in the software of Virtual Lab Acoustics based on the finite element method [30,31], as shown in Figure 5. With respect to the other four composite structures, the simulation was realized by adjusting parameters of the porous metal 1, porous metal 2, cavity 1, cavity 2, cavity 3, and the microperforated panel in the constructed model according to the optimal parameters in the Table 3, Table 4 and Table 5 respectively. Size of each element in this simulation model was 5 mm, and it was a triangular mesh in the thickness direction, which indicated that it utilized 897 points in the calculation process. The plane wave was loaded in the acoustic source inlet and used as the sound source input. Effect of the microperforated panel was represented by the transfer relation admittance between two surfaces, which was calculated according to the structural parameters in the Table 3, Table 4 and Table 5. Through testing peak sound level and valley sound level at the microphone 1 and microphone 2 respectively, sound absorption coefficient of the detected sound absorber at a certain frequency could be calculated. By this method, sound absorption coefficients of the investigated composite structures were simulated.
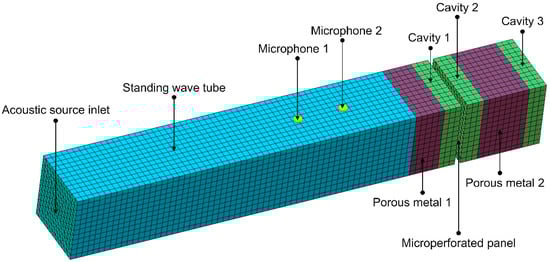
Figure 5.
Simulation model for the sound absorption coefficient of the composite sound absorbing structure.
Comparisons of the sound absorption coefficient of the theoretical result and that of the simulation result are shown in Figure 6. It can be observed that the distributions of sound absorption coefficients of the composite structures in the simulation results were in accordance with those in the theoretical results. Especially for the composite structure of MC, the simulation result was almost same with the theoretical result, which indicated that the constructed model for the microperforated panel based on Maa’s theory was accurate. With respect to the other four composite structures, the differences between the simulation result and the theoretical result were generated in constructing model of the porous material according to the Johnson—Champoux–Allard model, which has been used in studying the relationship between sound absorption performance of the porous material and its structural parameters [8,9]. With an increase of the limited total thickness, deviations between the simulation results and the theoretical results were reduced, because sound absorption coefficients in the frequency range (2000 Hz, 6000 Hz) were close to 100% both in the theoretical result and in the simulation result. Meanwhile, the absolute deviation of corresponding average sound absorption coefficient was smaller than 1% between the simulation results and the theoretical results. Therefore, it was preliminarily concluded that the optimal structural parameters obtained by the cuckoo search algorithm were reasonable and accurate.
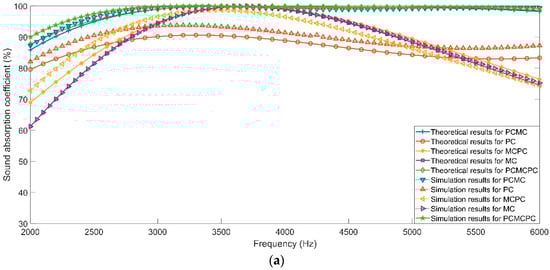
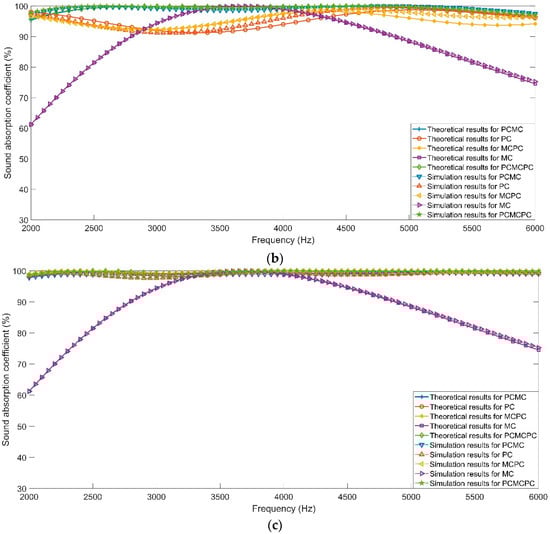
Figure 6.
Comparison of the sound absorption coefficient in theory and that obtained by simulation. (a) Composite structures with limited total thickness 30 mm corresponding to parameters in Table 3; (b) composite structures with limited total thickness 50 mm corresponding to parameters in Table 4; (c) composite structures with limited total thickness 100 mm corresponding to parameters in Table 5.
3.2. Validation of the Optimal Composite Structures
Detections of sound absorption coefficients of the composite sound absorbing structures were obtained by the AWA6128A detector (Hangzhou Aihong instruments Co., Ltd., China), as shown in Figure 7 [40,41,42]. The diameter of cross-section of the AWA6128A detector is 96 mm, and its measurable frequency range is (1500 Hz, 6640 Hz). Length of the slideway is 1000 mm, which supports motion of the pulley to detect peak value and valley value of the reflected wave. Measurable thickness of the detected acoustic absorber (including the cavity) was 0–60 mm, which indicated that the proposed composite structures with the limited total thickness of 100 mm go beyond the measuring range of the equipment. In fact, the sound absorber with total thickness of 100 mm has few application prospects in the industrial noise reduction, because it takes too much space. It can be found that composite structure of PCMC and that of PCMCPC can obtain relative better sound absorption performances among the proposed composite structures. Thus, these two composite sound absorbing structures with limited total thickness of 30 mm and 50 mm were prepared and assembled according to the optimal structural parameters in Table 3 and Table 4, and the samples are shown in Figure 8. The utilized porous copper sample in this research was purchased from YiYang Foam Metal New Material Co., Ltd., Yiyang, Hunan, China, and thicknesses of the common samples provided by the supplier were 2 mm and 5 mm. Therefore, in order to reduce fabrication cost, each used porous metal sample included some standard blocks and one special block, as shown in Figure 8. Moreover, length of the rear cavity was adjusted by the sample holder in Figure 8a.
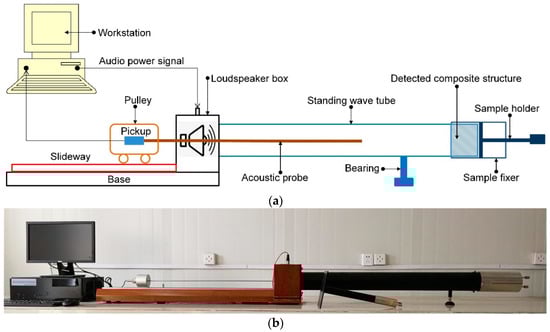
Figure 7.
Schematic diagram of AWA6128A detector for measuring the sound absorption coefficient. (a) Structure diagram; (b) physical picture.
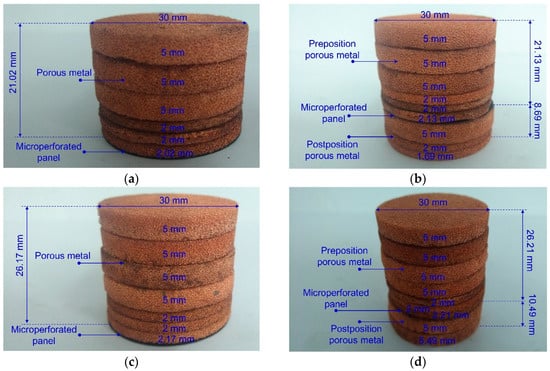
Figure 8.
The prepared optimal composite structures. (a) Optimal PCMC with limited total thickness of 30 mm; (b) optimal PCMCPC with limited total thickness of 30 mm; (c) optimal PCMC with limited total thickness of 50 mm; (d) optimal PCMCPC with limited total thickness of 50 mm.
Sound absorption coefficients were achieved according to the standing wave tube method [8,9,34,35,36,37,40,41,42], as shown in the Figure 9. It was found that distribution and tendency of the sound absorption coefficients in the experimental result were consistent with those in the theoretical result. The selected porous metal was porous copper, and its structural parameters were consistent with those in the theoretical modeling process. The desired microperforated panels were fabricated by laser beam drilling of the steel spring plates according to the corresponding structural parameters. Taking the machinability and optional parameters of the equipment into consideration, the diameter of the hole and distance of the neighboring holes of the optimal structural parameters for the microperforated panels were handled to keep two decimal places. Meanwhile, considering common dimension of the steel spring plate easy to buy, thickness of the panel was also kept two decimal places for the approximation. Lengths of the cavities , , and were adjusted by the additive manufacturing of blocks with the desired sizes.
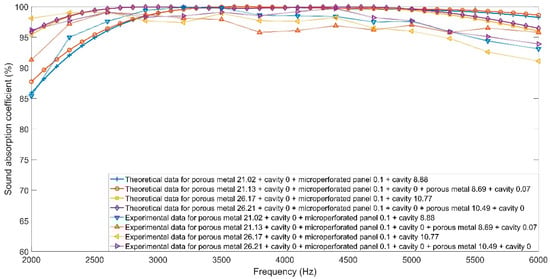
Figure 9.
Comparisons of the sound absorption coefficients in theory and those in experiment.
In addition, quantitative comparisons of average sound absorption coefficient in the theoretical result, simulation result, and experimental result are summarized in Table 6. It can be observed that the actual average sound absorption coefficient of four investigated composite structures exceeded 96%, though they are slightly smaller than those of the corresponding theoretical result. The major reason for this phenomenon is that there exists fabrication error in the preparation of porous metals and microperforated panels. Meanwhile, measuring error in the measuring process also affected the experimental result, although each sound absorber was measured by more than 10 times to reduce the accidental measuring error. By this method, feasibility and effectiveness of these optimal composite structures were validated.
Table 6.
Quantitative comparisons of average sound absorption coefficients in the frequency range (2000 Hz, 6000 Hz) in the theoretical result, the simulation result, and the experimental result.
Uncertainties exist in the validation process, one of which is about material design of the composite structure and the other is about characterization of the sound absorption coefficient. Thickness of the utilized porous metal samples has fabrication error, especially those special blocks, which was measured by a vernier caliper. It can be found that uncertainty of thickness of the used porous metal sample was ±0.01 mm and that of the microperforated panel was ±0.004 mm. Meanwhile, length of the rear cavity in the optimal sound absorber was controlled through the sample holder, and its control accuracy was ±0.01 mm. Thus, total uncertainty of the sound absorber was ±0.024 mm. It had been proved by Qian et al. [32,43] that the fabrication error within the submillimeter range had few influences to sound absorption performance of the sound absorber. Meanwhile, there is uncertainty in measuring the sound absorption coefficients, and each sound absorber was measured by more than 10 times. For example, when the limited thickness was 30 mm, evolutions of experimental data of sound absorption coefficients of the PCMC in 10 measurements are shown in Figure 10. It can be observed that undulation of the experimental data was within ±0.2%, which further showed that uncertainty in the measurement was tiny and it had little influence in the research results in this study.
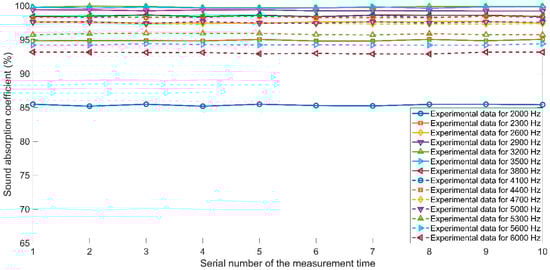
Figure 10.
Evolutions of the experimental data of sound absorption coefficients of the PCMC in the 10 standing wave tube measurements.
From the Table 3, Table 4 and Figure 9, it can be found that the actual total thickness of the optimal composite structure sometimes did not reach the presupposed limited total thickness, which indicated that the actual sound absorption efficiency of the investigated composite structure was even better. Therefore, comparisons of the actual total thickness with different presupposed limited total thickness are shown in the Table 7. When the presupposed limited total thickness was 50 mm, the actual total thickness for the composite structure of PCMCPC was 36.8 mm and lengths of all the 3 cavities were 0 mm, which indicated that this sandwich structure is a promising sound absorber with high absorption efficiency and low total thickness. Meanwhile, actual total thickness of the optimal composite structure of PCMC with the limited total thickness of 50 mm was 37.04 mm (including the cavity with length of 10.77 mm), and its average sound absorption coefficient of 96.76% was close to that 97.65% of corresponding optimal PCMCPC with thickness of 36.8 mm. Thus, taking complexity of the composite structure into account, the PCMC can also be treated as novel sound absorber with fewer utilized materials for reduction of the industrial noise.
Table 7.
Summarized actual total thickness with the different presupposed limited total thickness.
4. Conclusions
Sound absorption performance of the composite structure of microperforated panel and porous metal was modeled, optimized, simulated, measured, and analyzed in this study. A feasible method to develop the desired sound absorber for the effective reduction of industrial noise was proposed and the following conclusions were obtained from the research results.
- (1)
- Theoretical models of the sound absorption performance of the composite sound absorbing structures were derived by the transfer matrix method, and the sound absorption coefficients were calculated by a series of equations, which provided an objective function for the structural parameter optimization process and the contrast accordance for the further finite element simulation and the following experimental validation.
- (2)
- Structural parameters of the composite structure were optimized through the cuckoo search algorithm when the desired frequency range was (2000 Hz, 6000 Hz) and the limited total thickness was 30 mm, 50 mm, and 100 mm, respectively. The distributions and optimal averages of the sound absorption coefficients indicated that the proposed composite structures with the optimal structural parameters were excellent sound absorbers.
- (3)
- Simulation models of the composite structure with optimal structural parameters were built based on the finite element method. Detailed comparative analysis of the theoretical result and the simulation result was conducted, and the calculated absolute deviation of corresponding optimal average sound absorption coefficient was smaller than 1%, which gave a preliminarily verification to the optimization results.
- (4)
- Experimental validations of the optimal composite structures were conducted through the AWA6128A detector based on the standing wave tube method. The sandwich structure of porous metal 26.21 + cavity 0 + microperforated panel 0.1 + cavity 0 + porous metal 10.49 + cavity 0 with an actual total thickness 36.8 mm obtained the average sound absorption coefficient of 97.65% in the frequency range (2000 Hz, 6000 Hz), which indicated that the optimization of structural parameters was an effective way to develop the desired acoustic absorber and would be favorable to promote the application of the composite structures in the field of industrial noise reduction.
Author Contributions
conceptualization, X.S. and P.B.; software, X.L.; validation, H.D., X.S., and F.Y.; formal analysis, F.Y. and X.S.; investigation, Z.L.; data curation, H.D.; writing—original draft preparation, H.D. and P.B.; writing—review and editing, X.S. and Z.L.; supervision, X.S.; funding acquisition, X.S. and Z.L.
Funding
This research was funded by the National Natural Science Foundation of China, grant number 51505498; Natural Science Foundation of Jiangsu Province, grant number BK20150714; National Key R&D Program of China, grant number 2016YFC0802900; Hong Kong Scholars Program, grant number XJ2017025.
Acknowledgments
The authors wish to express their sincere thanks to Hangzhou Aihong Instruments Co., Ltd., China for the support of the AWA6128A detector.
Conflicts of Interest
The authors declare no conflict of interest.
References
- Li, J.H.; Liu, W.H. Characteristics Analysis and Modeling of Fault Sound and Background Noise of Large Central Air Conditioner. J. Electr. Eng. Technol. 2018, 6, 20–25. [Google Scholar]
- Vogiatzis, K.; Vanhonacker, P. Noise reduction in urban LRT networks by combining track based solutions. Sci. Total Environ. 2016, 568, 1344–1354. [Google Scholar] [CrossRef] [PubMed]
- Xie, H.; Li, H.; Liu, C.; Li, M.Y. Noise exposure of residential areas along LRT lines in a mountainous city. Sci. Total Environ. 2016, 568, 1283–1294. [Google Scholar] [CrossRef] [PubMed]
- Sheng, X.; Zhong, T.; Li, Y. Vibration and sound radiation of slab high-speed railway tracks subject to a moving harmonic load. J. Sound Vib. 2017, 395, 160–186. [Google Scholar] [CrossRef]
- Maa, D.Y. Potential of microperforated panel absorber. J. Acoust. Soc. Am. 1998, 104, 2861–2866. [Google Scholar] [CrossRef]
- Maa, D.Y. Design of microperforated panel constructions. Acta Acustica 1988, 13, 174–180. [Google Scholar]
- Ning, J.F.; Ren, S.W.; Zhao, G.P. Acoustic properties of micro-perforated panel absorber having arbitrary cross-sectional perforations. Appl. Acoust. 2016, 111, 135–142. [Google Scholar] [CrossRef]
- Yang, X.C.; Peng, K.; Shen, X.M.; Zhang, X.N.; Bai, P.F.; Xu, P.J. Geometrical and dimensional optimization of sound absorbing porous copper with cavity. Mater. Des. 2017, 131, 297–306. [Google Scholar] [CrossRef]
- Bai, P.F.; Shen, X.M.; Zhang, X.N.; Yang, X.C.; Yin, Q.; Liu, A.X. Influences of compression ratio on sound absorption performance of porous nickel-iron alloy. Metals 2018, 8, 539. [Google Scholar] [CrossRef]
- Cheng, Y.C.; Zhou, C.; Yuan, B.G.; Wu, D.J.; Wei, Q.; Liu, X.J. Ultra-sparse metasurface for high reflection of low-frequency sound based on artificial Mie resonances. Nat. Mater. 2015, 14, 1013–1019. [Google Scholar] [CrossRef] [PubMed]
- Li, Y.; Assouar, B.M. Acoustic metasurface-based perfect absorber with deep subwavelength thickness. Appl. Phys. Lett. 2016, 108, 063502. [Google Scholar] [CrossRef]
- Li, Y.; Jiang, X.; Li, R.Q.; Liang, B.; Zou, X.Y.; Yin, L.L.; Cheng, J.C. Experimental Realization of Full Control of Reflected Waves with Subwavelength Acoustic Metasurfaces. Phys. Rev. Appl. 2014, 2, 064002. [Google Scholar] [CrossRef]
- Chen, M.; Jiang, H.; Zhang, H.; Li, D.; Wang, Y. Design of an acoustic superlens using single-phase metamaterials with a star-shaped lattice structure. Sci. Rep. 2018, 8, 1861. [Google Scholar] [CrossRef] [PubMed]
- Chen, M.; Xu, W.S.; Liu, Y.; Yan, K.; Jiang, H.; Wang, Y.R. Band gap and double-negative properties of a star-structured sonic metamaterial. Appl. Acoust. 2018, 139, 235–242. [Google Scholar] [CrossRef]
- Zhang, J.C.; Shen, Y.O.; Jiang, B.; Li, Y. Sound Absorption Characterization of Natural Materials and Sandwich Structure Composites. Aerospace 2018, 5, 75. [Google Scholar] [CrossRef]
- Zheng, Z.Y.; Li, Y.; Yang, W.D. Absorption properties of natural fiber-reinforced sandwich structures based on the fabric structures. J. Reinf. Plast. Comp. 2013, 32, 1561–1568. [Google Scholar] [CrossRef]
- Kim, B.S.; Cho, S.J.; Min, D.K.; Park, J. Experimental study for improving sound absorption of a composite helical-shaped porous structure using carbon fiber. Compos. Struct. 2016, 145, 242–247. [Google Scholar] [CrossRef]
- Kim, B.S.; Park, J.H. Double resonant porous structure backed by air cavity for low frequency sound absorption improvement. Compos. Struct. 2018, 183, 545–549. [Google Scholar] [CrossRef]
- Jiang, X.L.; Yang, Z.; Wang, Z.J.; Zhang, F.Q.; You, F.; Yao, C. Preparation and Sound Absorption Properties of a Barium Titanate/Nitrile Butadiene Rubber–Polyurethane Foam Composite with Multilayered Structure. Materials 2018, 11, 474–480. [Google Scholar] [CrossRef] [PubMed]
- Jiang, X.L.; Wang, Z.J.; Yang, Z.; Zhang, F.Q.; You, F.; Yao, C. Structural Design and Sound Absorption Properties of Nitrile Butadiene Rubber-Polyurethane Foam Composites with Stratified Structure. Polymers 2018, 10, 946. [Google Scholar] [CrossRef] [PubMed]
- Jiang, X.L.; Wang, Z.J.; Yang, Z.; Zhang, F.Q.; You, F.; Yao, C. Preparation and sound absorption properties of barium titanate/nitrile butadiene rubber-polyurethane foam composites with stratified structure. RSC Adv. 2018, 8, 20968–20975. [Google Scholar] [CrossRef]
- Lv, L.H.; Li, C.W.; Guo, J.; Qian, Y.F.; Gong, Y.M.; Yu, X. Sound Absorption Properties of Three-Layer Structural Composites Based on Discarded Polyester Fibers and Fabrics. J. Fiber Sci. Technol. 2018, 74, 67–72. [Google Scholar] [CrossRef]
- Lv, L.H.; Bi, J.H.; Wei, C.Y.; Wang, X.; Cui, Y.Z.; Liu, H.B. Effect of Micro-slit Plate Structure on the Sound Absorption Properties of Discarded Corn Cob Husk Fiber. Fiber. Polum. 2015, 16, 1562–1567. [Google Scholar] [CrossRef]
- Liu, J.; Hua, X.; Herrin, D.W. Estimation of effective parameters for microperforated panel absorbers and applications. Appl. Acoust. 2014, 75, 86–93. [Google Scholar] [CrossRef]
- Guan, D.; Wu, J.H.; Jing, L. A statistical method for predicting sound absorbing property of porous metal materials by using quartet structure generation set. J. Allo. Com. 2015, 626, 29–34. [Google Scholar] [CrossRef]
- Maa, D.Y. Theory and design of microperforated panel sound-absorbing constructions. Sci. Sin. 1975, 18, 55–71. [Google Scholar]
- Allard, J.F.; Champoux, Y. New empirical equations for sound propagation in rigid frame fibrous materials. J. Acoust. Soc. Am. 1992, 91, 3346–3353. [Google Scholar] [CrossRef]
- Yang, X.S.; Deb, S. Cuckoo search: Recent advances and applications. Neural Comput. Appl. 2014, 24, 169–174. [Google Scholar] [CrossRef]
- Yang, X.C.; Bai, P.F.; Shen, X.M.; To, S.; Chen, L.; Zhang, X.N.; Yin, Q. Optimal design and experimental validation of sound absorbing multilayer microperforated panel with constraint conditions. Appl. Acoust. 2019, 146, 334–344. [Google Scholar] [CrossRef]
- Li, S.Q.; Li, X.; Wang, Z.H.; Wu, G.Y.; Lu, G.X.; Zhao, L.M. Finite element analysis of sandwich panels with stepwise graded aluminum honeycomb cores under blast loading. Compos. Part A Appl. S 2016, 80, 1–12. [Google Scholar] [CrossRef]
- Yan, Y.J.; Li, P.B.; Lin, H.G. Analysis and experimental validation of the middle-frequency vibro-acoustic coupling property for aircraft structural model based on the wave coupling hybrid FE-SEA method. J. Sound Vib. 2016, 371, 227–236. [Google Scholar] [CrossRef]
- Qian, Y.J.; Kong, D.Y.; Fei, J.T. A note on the fabrication methods of flexible ultra micro-perforated panels. Appl. Acoust. 2015, 90, 138–142. [Google Scholar] [CrossRef]
- Yu, X.T.; Wang, M.Y.; Wang, Z.; Gong, X.Z.; Guo, Z.C. The structure evolution mechanism of electrodeposited porous Ni films on NH4Cl concentration. Appl. Surf. Sci. 2016, 360, 502–509. [Google Scholar] [CrossRef]
- Bai, P.F.; Yang, X.C.; Shen, X.M.; Zhang, X.N.; Li, Z.Z.; Yin, Q.; Jiang, G.L.; Yang, F. Sound absorption performance of the acoustic absorber fabricated by compression and microperforation of the porous metal. Mater. Des. 2019, 167, 107637. [Google Scholar] [CrossRef]
- Shen, X.M.; Bai, P.F.; Chen, L.; To, S.; Yang, F.; Zhang, X.N.; Yin, Q. Development of thin sound absorber by parameter optimization of multilayer compressed porous metal with rear cavity. Appl. Acoust. 2020, 159, 107071. [Google Scholar] [CrossRef]
- Yang, F.; Shen, X.M.; Bai, P.F.; Zhang, X.N.; Li, Z.Z.; Yin, Q. Optimization and Validation of Sound Absorption Performance of 10-Layer Gradient Compressed Porous Metal. Metals 2019, 9, 588. [Google Scholar] [CrossRef]
- Yang, X.C.; Shen, X.M.; Bai, P.F.; He, X.H.; Zhang, X.N.; Li, Z.Z.; Chen, L.; Yin, Q. Preparation and Characterization of Gradient Compressed Porous Metal for High-Efficiency and Thin-Thickness Acoustic Absorber. Materials 2019, 12, 1413. [Google Scholar] [CrossRef] [PubMed]
- Verdière, K.; Panneton, R.; Elkoun, S.; Dupont, T.; Leclaire, P. Transfer matrix method applied to the parallel assembly of sound absorbing materials. J. Acoust. Soc. Am. 2013, 134, 4648–4658. [Google Scholar] [CrossRef] [PubMed]
- Zhao, X.D.; Hu, P.; Sun, P. The comparative analyses of the calculation methods for absorptivity of multilayer micro-perforated panel absorbers. J. Appl. Acoust. 2012, 31, 196–201. [Google Scholar]
- Yang, X.C.; Bai, P.F.; Shen, X.M.; Zhang, X.N.; Zhu, J.W.; Yin, Q.; Peng, K. Theoretical modeling and experimental validation of sound absorbing coefficient of porous iron. J. Porous Media 2019, 22, 225–241. [Google Scholar] [CrossRef]
- Shen, X.M.; Bai, P.F.; Yang, X.C.; Zhang, X.N.; To, S. Low-frequency sound absorption by optimal combination structure of porous metal and microperforated panel. Appl. Sci. 2019, 9, 1507. [Google Scholar] [CrossRef]
- Yang, X.C.; Chen, L.; Shen, X.M.; Bai, P.F.; To, S.; Zhang, X.N.; Li, Z.Z. Optimization of geometric parameters of the standardized multilayer microperforated panel with finite dimension. Noise Control Eng. J. 2019, 67, 197–209. [Google Scholar] [CrossRef]
- Qian, Y.J.; Kong, D.Y.; Liu, S.M.; Zhao, Z.; Sun, S.M. Investigation on micro-perforated panel absorber with ultra-micro perforations. Appl. Acoust. 2013, 74, 931–935. [Google Scholar] [CrossRef]
© 2019 by the authors. Licensee MDPI, Basel, Switzerland. This article is an open access article distributed under the terms and conditions of the Creative Commons Attribution (CC BY) license (http://creativecommons.org/licenses/by/4.0/).