Abstract
The current research has been conducted to investigate the capacity of an indigenously developed thermal oil based continuous solar roaster (CSR) for groundnuts roasting. A 10 m2 standing Scheffler fixed focus concentrator is used to target the incoming direct normal irradiance at casted aluminum surface of a heat receiver which transfers this heat energy to the roasting unit by means of thermal oil circulation. The roasting unit comprises a cylindrical shell (2000 mm in length and 450 mm in diameter) attached beneath a semi-circular oil flow jacket and equipped with a ribbon type screw conveyer with 6 mm thick paddles. Optimizing for maximum energy utilization and feeding capacity using response surface methodology, roasting time for light, medium and dark quality was found to be 14 + 0.1, 20 + 0.1 and 29 + 0.1 min respectively. In terms of roasting quality, CSR has shown quite satisfactory results. The study revealed that continuous solar roaster has the capability to roast 140 to 288 kg groundnuts per day subjected to dark to light roasting quality with average direct normal irradiance ranging from 650–800 Wm−2. The overall thermal efficiency of the system was found to be 37.8%. The payback period of CSR was estimated to be 2450–5250 useful working hours.
1. Introduction
Tropical regions are famous for producing different kinds of nuts and beans, but the majority of these produces are exported to industrialized countries in perishable form without any subsequent post-harvest processing [1,2]. The growers of developing countries are facing a challenging scenario for adding value to their agricultural products due to insufficient on-farm processing facilities and inaccessibility to the centralized electricity grid, particularly in rural and far-flung areas. According to Renewable Energy Policy Network for 21st Century (REN21), about 16% of the global population (1.2 billion) lack access to electricity while 38% (2.7 billion) are living without clean heating facilities [3]. In the past few decades, increased annual usage of fossil fuels in agriculture sector has been trended in Asia, South and Central America, and Africa. This energy deficient scenario uplifts the overall consumption of carbon-based fuels to meet the energy needs and ultimately contribute towards environmental degradation.
The importance of agricultural processing cannot be deprived in developing countries as it has set a rising association from the farm gate to the supermarket shelf nowadays. From the past decades, the restructuring of agricultural processing played an essential role in the transformation of agricultural products from perishables to value added categories [4]. Energy is very essential for every step involved in value-addition to agricultural products. Various value adding processes such as drying, roasting, pasteurizing, distillation, chemical extraction operations, curing of food products, lie in the main low to medium temperature range (60–260 °C) [5]. In total, one third of final global energy demand is consumed in agri-food sector, making it responsible for contributing a 35% share in global greenhouse gas (GHG) emissions [6].
Roasting is a noteworthy value adding phenomenon to various nuts and beans in agricultural processing and defined as the process of acquiring characteristics like aroma, flavor, color, and texture at a relatively high temperature [7]. Among the nuts, groundnuts (Arachis hypogaea L.) offer a potent source of high-quality edible oil and dietary protein and nearly one-third of its global production is utilized in the confectionery products. As a first step, the kernels of groundnut are processed thermally (roasted) in a range between 110–180 °C to attain desired crunchy characteristics and crispy texture, either for oil extraction or manufacturing of other value-added products [8,9]. Traditionally, groundnuts are roasted in large iron pans or clay pots at farm and vendor scale which are being exposed to heat from bottom by burning of wood, kerosene, charcoal or gas. The kernels are placed (directly or with sand-bath) and stirred manually in the heated pans. These conventional methods of roasting are uncontrolled, inefficient, energy and time consuming and provide a very un-hygienic environment to the operators such as direct exposure to heat radiations and smoke. On an industrial scale, groundnuts are roasted either using gas-fired revolving oven or continuous or batch type roasters which offer more flexible options for precisely controlling the process conditions like temperature, time and product flow rate, ensuring a uniformly processed product [10]. However, these large scale units are economically out-of-reach for small to medium scale farming communities accompanied by the additional burden of escalating fossil fuel prices that upsurges the processing cost. Although many technological efforts have been made to facilitate the rural communities by mechanizing the roasting process [11,12,13], all were fossil fuels or electricity dependent.
In a nutshell, there is a strong need of devising self-sufficient, economically viable, and environment friendly off-grid solutions for medium to high range temperature agricultural processing particularly in remote areas of tropical regions, i.e., solar power. Tropical regions receive daily normal irradiance (DNI) between 5.5–7.5 kWh/m2 with more than 300 sunny days per year [14]. This massive solar potential can be utilized to meet the above stated challenging and need based assignment in a decentralized manner. Roasting of perishables using concentrating solar power is a novel and promising field. A variety of solar collectors are available to concentrate the incoming DNI to produce medium to high temperature range heat energy which can be employed in the subsequent process by coupling suitable technologies [15]. The promotion of innovative solar based technologies for switching the agricultural processing from non-renewable to renewable energy resources can not only upsurge the on-farm value-addition facilities but also contribute towards a sustainable environment and rural development.
This scientific research has been carried out for the assessment of the capacity of an indigenously developed thermal oil based continuous solar roaster (CSR) for groundnut roasting using solar power. Fabrication of CSR was accomplished in the engineering workshop of the Faculty of Agricultural Engineering and Technology, at the University of Agriculture Faisalabad with locally procured material and a 10 m2 standing Scheffler fixed focus concentrator was coupled with the developed system to produce heat energy. The versatility of standing Scheffler concentrator is to keep the focus fix throughout the day at just above the ground level away from the path of incoming DNI regardless the position of energy utilization source [15], thus making it most appropriate selection for a weighty machine such as CSR. Response surface methodology (RSM) is a widely used tool for optimizing food processing operations [16] and it has been employed in the study to investigate the optimum operational machine parameters viz. feeding capacity, conveyor speed and thermal oil flow rate for achieving light, medium and dark quality roasting of groundnuts in comparison with industrial quality. By performing thermal analysis of CSR, solar power utilization during roasting process was determined and, based on the solar power utilization, economic feasibility of CSR for commercialization was also estimated.
2. Materials and Methods
2.1. Experimental Setup and Data Acquisition
CSR has provision to roast a variety of nuts and beans depending upon their size and geometry. Locally grown groundnuts (BARI-2000 variety) were selected and procured from the grain market and manually shelled for conducting roasting experiments. The dimensions of shelled kernels were randomly measured with a digital micrometer screw gauge. The average size of the kernels with length, width, and thickness of 14 ± 1, 9 ± 1, and 8 ± 1 mm respectively was maintained and the kernels having dimensions lesser than that were removed by visual sorting to insure the maximum homogeneity of the product. The operational parameters for CSR and the quality characteristics of groundnuts were initially formulated and experiments were designed using Design Expert® (Version: 11.0.5.0 64-bit) software. In order to evaluate and control the CSR during roasting experiments, a pyranometer and thermocouples (K-type) were equipped with the system. The intensity of incoming DNI was measured with the pyranometer which was fixed at the surface of Scheffler concentrator in such a manner that it faced directly towards the sun and a black pipe (100 mm in length) was mounted on it to record only beam radiation. Thermocouples were connected with the surface to heat receiver, thermal oil flow inlets, and outlets of heat receiver and roasting cylinder to measure the operating temperatures at these points. All the above instruments were connected to a computer via a digital data logger for complete data recording during the experiments. The coordinates of the experimental site were 31°26′ N (latitude), 73°04′ E (longitude) with a 185 m elevation from mean sea level. Seasonal and daily adjustments of a 10 m2 standing Scheffler fixed focus concentrator were precisely checked and CSR was placed in front of the concentrator in such a way that the Scheffler concentrator concisely focuses the incoming DNI at the heat receiver of CSR for process heat generation. Thermal images were taken with the help of an infrared camera during the experiments.
2.2. Optimum Operational Parameters for Groundnut Roasting in Continuous Solar Roaster (CSR)
The selected operating parameters viz. feeding capacity, conveyor speed and thermal oil flow rate responsible for controlling feeding rate, roasting time and roasting temperature respectively, had a significant effect on the roasting process. After starting the Design Expert® software, central composite rotatable design (CCRD) technique was selected to design the experiments which were originally established by [17] and modified by [18]. At the next step, the experimental ranges for the feeding capacity, conveyor speed, and thermal oil flow rate were set to 5–15 kg, 0.5–1.5 rpm and 0.01–0.05 Ls−1, respectively in the Design Expert® software which finally predicted the optimum values for performing the experiments. Roasting experiments were performed to study the effect operating parameters on moisture contents (MC) and Hunter Labs colorimeter color value (L*) at the predicted values in triple replications and the average for each response was determined. The experimental results were evaluated using CCRD and fitted in a second order quadratic equation for MC and L* by applying second-order multiple regression analysis. The predicted and obtained results were compared and ANOVA for each response was tabulated for examining the validity of the designed model. The generalized model for each predicted response is given in Equation (1).
where βo, βi, βii and βij are intercept, linear, quadratic and interaction regression coefficient terms, respectively, xi and xj are independent variables and e is the random error.
The model was considered acceptable if the p-value that defines the significance of coefficients was less than 0.05 at 95% confidence interval (CI), the lack of fit for the model was not significant and the coefficient of variation (CV) was less than 10%.
In the ANOVA tables, the p-value shows the probability to consider the observed F-value which, if lesser than 0.05 at 95% C.I, implies that the respective parameter is statistically significant and has a strong influence on the response.
Optimization of CSR
The optimization of CSR was done with the objective to roast maximum quantity of groundnuts by utilizing maximum available solar thermal energy, therefore, the conveyor speed was optimized to investigate the optimum roasting time to achieve the standardized L* values of 53 ± 1, 48.5 ± 1, and 43 ± 1 for light, medium and dark roasted groundnuts respectively [19,20]. The optimization process was carried out using optimization function in Design Expert® software with the goals for each operating parameter and response explained in Table 1. There were 16, 18, and 16 solutions available by the software for response parameters L* (light), L* (medium), and L* (dark) with their corresponding MC respectively. However, the solutions at the highest desirability were considered.

Table 1.
Optimization criteria for Continuous Solar Roaster (CSR).
2.3. Description and Working Mechanism of CSR
Scheffler concentrator (10 m2) focuses the incoming direct normal irradiance (DNI) at a 360 mm diameter and 10 mm thick casted aluminum surface of a heat receiver. With the design configuration of the lateral part of a paraboloid, the frame of Scheffler concentrator is inclined at an angle of (43.23 ± α/2) degrees, therefore, the effective aperture area (Ac) of the concentrator is taken as Ac × cos (43.23 ± α/2). The total input energy available (Qa) at the face of the concentrator is the DNI measured by pyranometer (EDNI) times this fraction of the effective aperture area and is calculated from Equation (2) [21]:
α is the solar declination angle and equated according to [22] for any day of the year.
The energy is distributed as absorbed radiation (Qap) and reflected radiation (Qpr). The absorbed radiation component of energy (Qap) depends upon the reflectivity of the material used (Highly reflected mirrors >90%). Therefore, the energy available after primary concentrator (Qpr) is given as [21]:
where Rp is the reflectivity of the material used for the Scheffler concentrator.
Some of the radiations are reflected from the primary concentrator out of the focus. This deviation is due to the improper concentrator profiles and inadequacy in daily and seasonal tracking. The fraction available at the targeted focus (Ff) in general calculation is taken as 0.90. The energy available at the solar receiver (Qrcv) is given as [15]:
The energy available on the surface of the heat receiver (Qrcv) is transferred to the roasting cylinder by the circulation of Shell S2 heat transfer oil [23]. Inside the heat receiver, 16 mm thick ribs are casted on the back side of the receiver’s surface to shape oil galleries in such a way that thermal oil flows in a zigzag pattern which increases the retention time for effective heat transfer. An iron cover attached with a gasket is installed on the backside of the receiver and sealed with high temperature silicon paste to prevent any leakage. The heat receiver is packed with 50 mm rockwool insulation from back and sides and entire unit is fixed in a stainless-steel (S.S) case which is mounted on an iron stand. Thermal oil absorbs heat energy in the heat receiver and desorbs it to the bottom of a 2 m long and 0.45 m in diameter food grade S.S roasting cylinder while flowing inside a semi-circular cavity which is fixed with the lower semi-circumference of the roasting cylinder having a 0.7 m perimeter. The flow rate of thermal oil is varied from 0.01 to 0.05 Ls−1 with a gear pump to regulate the temperature conditions inside the roasting cylinder while the excessive heat energy is stored in an insulated heat storage reservoir using sensible heat storage mechanism. Roasting temperature is adjusted according to the product from electric control panel. Two solenoid valves with thermocouple sensors are provided, one at the inlet of roasting cylinder and other at the inlet of heat storage reservoir, to control the flow path of thermal oil. During the heating phase up to set temperature, they allow the thermal oil to flow in the flowing path (Path-I).

As the required temperature is attained, solenoid valves direct the flow through the thermal oil reservoir instead of the roasting cylinder in the following path (Path-II).

As the temperature at the inlet of the roasting cylinder is decreased below the set temperature, thermal oil again starts to flow through Path-I. In this way, the temperature is maintained constant during the roasting. The product is fed through the feeding hopper to the roasting cylinder and slide towards the discharge chute in a counter current direction to thermal oil flow to allow effective heat absorbance from the bottom of roasting cylinder. The energy absorbed by the product during the roasting can be calculated by Equation (5) [13]:
where Qu is total energy absorbed in watts (W), m is the mass of product in kg, c is the specific heat capacity of the product in kJ/kg °C, ∆T is the change in product temperature during roasting in °C and t is the roasting time in seconds (s).
A variable rotational speed ribbon type screw conveyor attached by chain sprocket mechanism with a gear motor is used to slide the products in the roasting cylinder. Each blade of conveyor is hollowed through the center and fixed with 6 mm thick paddles to provide stirring action to the product. The variation in rotational speed of the conveyor is regulated from the electric control panel which allows for change in the travel time (roasting time) of products inside the roasting cylinder, lesser rotational speed results in longer roasting time and vice versa. Finally, after being roasted, products are collected in a food grade S.S tray placed under the discharge chute. All the electrical systems of CSR including oil pump, conveyor motor, valves, etc. are powered by a 1.5 kWp solar photovoltaic (PV) system. The schematic diagram of the entire system is shown in Figure 1.
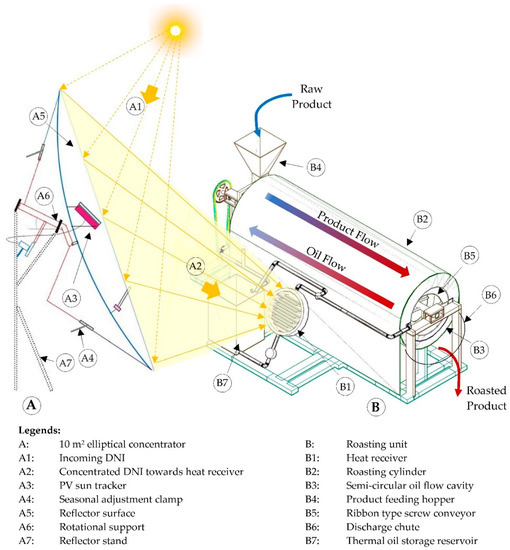
Figure 1.
Schematic of Continuous Solar Roaster (CSR).
Efficiency of CSR
Thermal efficiency (ηth) of a system can be defined as the ratio between total available energy to the energy utilized [13] and in the case of CSR, it can be calculated by dividing Equation (6) with total DNI energy.
The roasting efficiency is the ratio between the total mass of raw product to the total mass of undamaged roasted product and can be determined for CSR by the following Equation (7) [13].
where ηpr is the performance efficiency of CSR, mraw is the mass of raw product in kg and mroast is the mass of undamaged product after roasting in kg.
2.4. Quality Analysis of the Solar Roasted Groundnuts
Several samples (100 g each) were collected from light, medium and dark roasted groundnut kernels and each sample were finely grinded and sieved. The powder of each sample was kept in air-tight containers to avoid moisture and foreign material contamination. The moisture content was determined according to the method (925.09) given by the Analytical Association of Official Analytical Chemists (AOAC). The color characteristics were measured using an UltrascanPRO Spectro colorimeter (A60-1012-402 Model Colorimeter, Hunter Lab, Reston, VA, USA) according to the procedure given by [24]. The moisture, crude fiber, ash and protein contents were determined according to the method described by [25]. Fat extraction was performed using Soxhlet extraction technique by [26]. The carbohydrate content was calculated by difference, subtracting the sum of moisture, protein, ash, crude fiber and fat percentages from hundred. Minerals analyses were performed using an Atomic Absorption Spectrometry [27,28] to determine the minerals including sodium (Na), potassium (K), calcium (Ca), magnesium (Mg), iron (Fe), zinc (Zn), and phosphorus (P).
All the above quality attributes were analyzed in the labs of the National Institute of Food Science and Technology, UAF and results were compared with the findings of other researchers to make a comprehensive quality comparison. The experiments were replicated thrice in order to enhance the experimental reliability of results and all the calculations were made on dry weight basis.
3. Results and Discussion
3.1. Effect of Operating Parameters on Responses
The predicted experimental design and actual results for both the responses (MC and L*) are given in Table 2. The experimental findings revealed that MC and L* were found in a range of 0.63 to 2.97% and 31.81 to 62.03, respectively. The final equations in terms of coded factors for MC and L* are as under:
where A, B, and C are coded values of feeding capacity, conveyor speed, and thermal oil flow rate, respectively, whereas the statistical significance of Equations (8) and (9) are given in ANOVA Table 3 and Table 4 respectively.
Table 2.
Central composite response design (CCRD) of experiment for quadratic response surface analysis on MC and L*.
Table 3.
ANOVA for response surface quadratic model on MC.
Table 4.
ANOVA for response surface quadratic model on L*.
In Table 3 and Table 4, the F-values of the models infers that the models are statistically significant and there is only a 0.01% chance that a “Model F-Value” this large could occur due to noise. A p-value less than 0.05 shows the statistical significance of the model terms (A, B, C, AB, AC, BC, A2, B2, and C2) in both the models. Whilist, the F-values for lack of fit in Table 3 and Table 4 imply that the lack of fit is not significant relative to the pure error which indicates that the models are well fitted with the experimental data. The coefficient of variation for both the models shows the reliability of the model results with the experimental data because generally, a model with less than 10% CV is considered reasonably reproducible. It is also observed that the R2predicted is in reasonable agreement with the R2adjusted in both models and justifies the validity of the model.
It is depicted from the ANOVA results that the models, which associate with MC and L*, showed 99.1 and 99.7% of the total variations in each system, respectively. Therefore, both the models are appropriate to signify the correlation between the operating parameters and responses. These results were also confirmed from the graphs of the predicted versus observed values as presented in Figure 2.
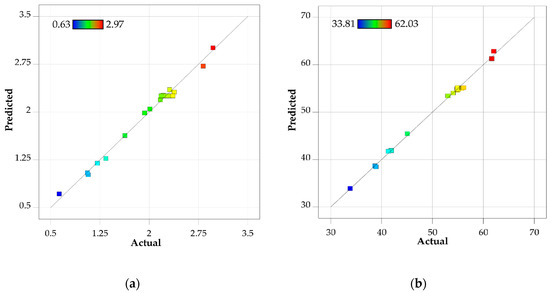
Figure 2.
Relationship between predicted and observed values of (a) moisture contents (MC) and (b) Hunter Labs colorimeter color value (L*).
3.1.1. Effect of Single Parameters
For both responses, p-values (<0.05) for all single factors (A, B and C) confirmed the significant effect of feeding capacity, conveyor speed, and thermal oil flow rate. Moreover, the value of each corresponding coefficient in the Equation (4.1) and (4.2) is positive which clearly indicates the positive effects of all individual factors on MC and L*. Therefore, it is concluded that MC was increased with an increase in the value of each operating parameter and vice versa.
It is evident from Table 3 that the thermal oil flow rate, with the highest F-value (708.78), has the most significant effect on MC, followed by conveyor speed and feeding capacity. These findings reveal that the change in MC is more sensitive to temperature rather than travel time and quantity of groundnut in the roasting cylinder within the given experimental ranges of operating parameters. The inside temperature of the roasting cylinder was controlled by varying the thermal oil flow rate in the system. At higher flow rate, lesser heat was absorbed and transferred from the heat receiver to the bottom of the roasting cylinder, therefore, a lower temperature was obtained for the roasting of groundnut kernels and vice versa. It was due to the fact that heat absorption and desorption rates depend upon the specific heat capacity of HTF, which increases at lower flow rates and decreases at higher flow rates [29]. Therefore, lowest final MC was observed with minimum flow rate of thermal oil. Furthermore, MC was also influenced by the roasting time that was dependent on the conveyor speed. The greater conveyor speed reduced the time of travel inside the roasting cylinder that resulted in less heat transfer to the groundnut kernels. Thus, slightly higher percentage of MC and little quantity of unroasted kernels were recorded as also confirmed by the other researchers [13]. A lesser impact of feeding capacity was seen on MC in comparison with other operating parameters because even though at maximum feeding capacity, adequate heat is available for effective roasting [30].
For L* response (Table 4), it was determined that the thermal oil flow rate has the most significant effect on the color change of groundnuts. Due to increase in temperature inside the roasting cylinder, MC started to reduce that led to modifications in the microstructure of the groundnut kernels followed by several chemical changes. The browning of kernels by heat application occurred due to Maillard reactions and somewhat from caramelization [19]. Lowest thermal oil flow rate and conveyor speed yielded in a higher temperature and longer time for roasting, respectively that produced a darker color of the final product and exhibited lower values of L* whereas lighter color presented a light roast condition with higher values of L* [20,31]. Beside the thermal oil flow rate and conveyor speed, feeding capacity impacted the L* to a lesser extent as the heat was well distributed in the roasting cylinder even at maximum feeding capacity [30].
3.1.2. Interactive Effect of Parameters on Moisture Contents (MC)
Figure 3a shows the interactive effect of feeding capacity and conveyor speed on MC at the center level of the thermal oil flow rate, 0.03 Ls−1. A positive effect on MC is observed both by the feeding capacity and conveyor speed, in which conveyor speed has a more significant effect than feeding capacity because it regulates the time of roasting. It is clear from the 3D surface plot that increasing the feeding capacity and conveyor speed to maximum levels, resulted in higher percentage of MC (2.41%). On the other hand, MC decreased to 1.59% after decreasing the feeding capacity and conveyor speed to minimum levels. It is because a lower conveyor speed gives longer roasting time, which offers adequate heat transfer to groundnuts even at maximum feeding capacity. This result infers that at prolonged roasting time, more moisture can be removed from groundnut kernels. The experimentation of many authors also revealed that the roasting time is an essential parameter for moisture variations during roasting and MC can be lowered with longer roasting time keeping the temperature constant [32,33].
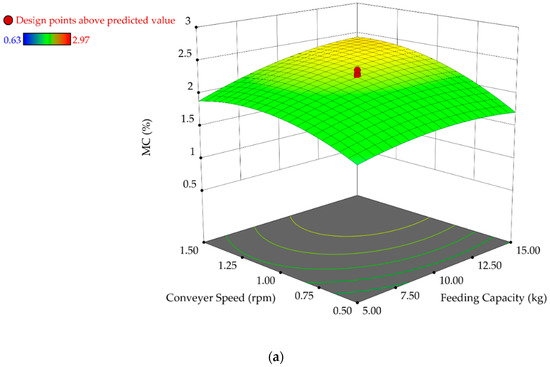
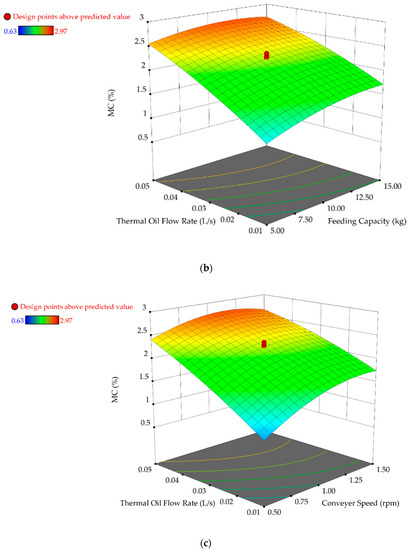
Figure 3.
(a) Interactive effect of conveyor speed and feeding capacity on MC. (b) Interactive effect of thermal oil flow rate and feeding capacity on MC. (c). Interactive effect of thermal oil flow rate and conveyor speed on MC.
The interactive effect of feeding capacity and thermal oil flow rate on the MC of groundnuts is shown in the 3D surface plot (Figure 3b), while the conveyor speed was maintained at 1.0 rpm. The percentage of MC decreased almost linearly with decreasing the feeding capacity and thermal oil flow rate. The obtained MC of roasted groundnuts was 2.62% at the maximum level of feeding capacity and thermal oil flow rate. A much lower value of MC (1.17%) resulted in minimum feeding capacity and thermal oil flow rate. According to [30], the roaster efficiency is defined on the basis of thermal heat utilization during the roasting, therefore, it can be concluded that heat energy is sufficiently available for roasting up to the designed product capacity of the machine. It is also evident that the thermal oil flow rate more significantly affected the groundnut MC than feeding capacity and even at maximum feeding capacity (15 kg), MC was lowered to 1.54% by changing the thermal oil flow rate minimum level (0.01 Ls−1). These results are within the range for MC of roasted groundnuts as stated by many authors [8,19,32].
Like Figure 3b, the positive and almost linear interactive effect of conveyor speed and thermal oil flow rate is observed on MC (Figure 3c) when the feeding capacity was kept constant at 10 kg. It is evident that at the lowest thermal oil flow rate and conveyor speed MC decreased to 0.93% during roasting whereas it was found to be 2.71% on maximum levels. It is due to the reason that the low thermal oil flow rate yields in high roasting temperature due to higher heat transfer rate to the groundnuts whereas low conveyor speed gives longer roasting time and MC dropping is mainly dependent on both the roasting temperature and time. [31,34] investigated the similar effect of time and temperature on groundnut roasting and their findings also support the obtained results. However, MC is influenced more significantly by thermal oil flow rate than conveyor speed because the moisture is released more quickly from groundnut kernels at high roasting temperatures [20]. It can be concluded that at any specific conveyor speed, lowering the thermal oil flow rate decreases MC more rapidly.
3.1.3. Interactive Effect of Parameters on Hunter Labs Colorimeter Color Value (L*)
The interactive effect of feeding capacity and conveyor speed on the L* value of groundnuts was determined at the center level of the thermal oil flow rate (0.03 Ls−1) as shown in Figure 4a. A positive effect on L* is observed both by the conveyor speed and feeding capacity but the conveyor speed affects more significantly in comparison with feeding capacity. It is clear from the 3D surface plot that increasing the feeding capacity and conveyor speed to maximum levels resulted in brighter color value (L*) of groundnut kernels i.e., 58.34. The longer roasting time with minimum feeding capacity lowers the L* value to 45.51, thus producing a medium roast quality kernel. It is because a lower conveyor speed gives longer roasting time, which offers an opportunity for adequate heat transfer to groundnuts even at maximum feeding capacity. This result infers that prolonged roasting time produces dark roasted groundnuts, and vice versa, and in agreement with the findings of [35]. The investigations from [32] also revealed that the roasting time is the most effective parameter for promoting color changes in groundnuts during roasting at constant temperature and dark roast conditions can be attained with longer roasting time.
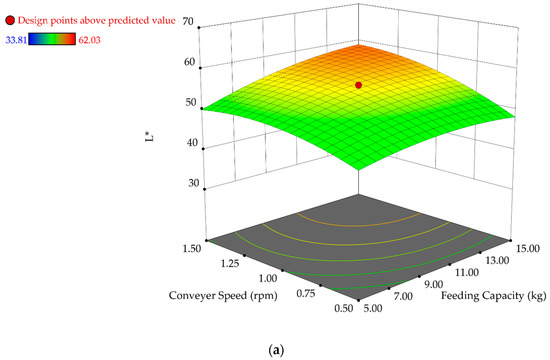
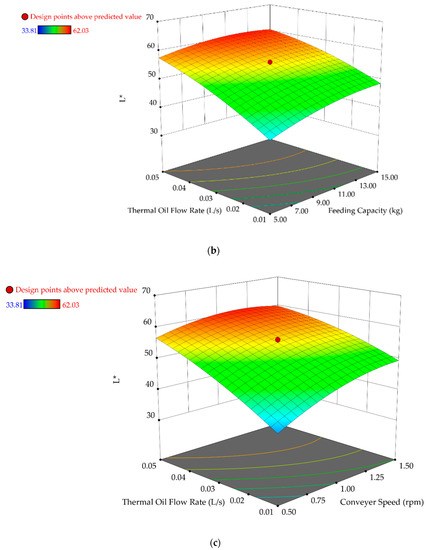
Figure 4.
(a) Interactive effect of conveyor speed and feeding capacity on L. (b) Interactive effect of thermal oil flow rate and feeding capacity on L*. (c) Interactive effect of thermal oil flow rate and conveyor speed on L*.
At a constant conveyor speed of 1.0 rpm, the interactive effect of feeding capacity and thermal oil flow rate on the L* is represented in a 3D surface plot (Figure 4b). The L* value of groundnuts was decreased with decreasing the feeding capacity and thermal oil flow rate. The observed value of L* was 39.77 at minimum levels of feeding capacity and thermal oil flow rate and raised up to 59.72 with maximum feeding capacity and thermal oil flow rate. These low (39.77) and high (59.72) values of L* corresponds to dark and light roast conditions respectively, and consistent with the results of other authors [8,19,20,32].
At constant feeding capacity i.e., 10 kg, it is observed from the 3D surface plot (Figure 4c) that the lowest conveyor speed and thermal oil flow rate decreased L* to 37.68 during roasting whereas on maximum levels, L* was found to be 60.59. However, L* is influenced more significantly by the thermal oil flow rate than conveyor speed. The color of groundnut kernels was darkened rapidly at lowest thermal oil flow rate because the availability of higher activation energy for molecules to start the browning reaction [36,37,38] also supported the fact that in high temperature-short time roasting, color is developed at faster rates due to availability of suitable activation energy in earlier stages. The variations in L* is due to thermal modification in microstructure of groundnut kernels, which occurs differently at different temperature [39]. Different time and temperature combination can be used to obtain the desired values of L* [20,31,34] also investigated the effect of time and temperature on roasted groundnut color and their results also support the obtained value of L*.
3.2. Optimum Operational Parameters of CSR
Keeping optimization criteria in the view, there were 16, 18 and 16 solutions available for response parameters L* (light), L* (medium) and L* (dark) with their corresponding MC respectively. However, only the solutions at the highest desirability were considered. The response surface quadratic model suggested the optimum feeding capacity at 15 kg and thermal oil flow rate at 0.01 Ls−1 for all three responses whereas the optimum conveyor speed was predicted at 1.42, 0.99, and 0.69 rpm for light, medium and dark roast conditions respectively. The optimum percentages of MC were predicted 1.33, 1.72, and 1.98% respective to L* values of 53, 48.5, and 43 against the selected solutions.
3.2.1. Roasting of Groundnuts
The predictability of the models was validated by conducting several roasting experiments at optimum conditions. For each experiment, MC and L* were measured in triplicate and their average values are shown in Figure 5.
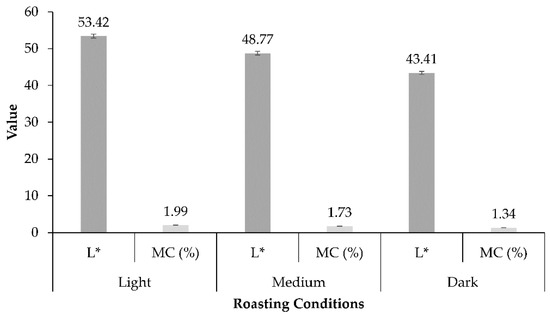
Figure 5.
Average experimental values of MC and L*.
The average values of MC were found 1.99, 1.73, and 1.34% at resulted L* values of 53.42, 48.77 and 43.41 for light, medium and dark roast conditions, respectively. There was only a slight difference between the average of experimental values and the predicted values for MC and L* as given in Table 5. The relative error of less than 1% for each response justifies that the models are acceptable with high predictability.
Table 5.
Predicted and observed responses.
Roasting time for each experiment at each conveyor speed was also noted with a stopwatch and found to be 14 ± 0.1, 20 ± 0.1, and 29 ± 0.1 min for light, medium and dark roasting conditions respectively. These results revealed that CSR was capable to continuously roast 64 ± 1, 45 ± 1, and 31 ± 1 kg groundnuts per hour subjected to light, medium and dark roasting quality.
3.2.2. Roasting Efficiency of CSR
The experimental results for damaged and roasted groundnut kernel at different roasting conditions are shown in Figure 6. It was found that the average roasting performance (Equation (2.7)) of CSR was 91.7 ± 1.0%, 90.1 ± 1.0%, and 88.6 ± 1.0% for light, medium, and dark roasting conditions respectively which implies that the percentage of damaged kernels (by weight) was increased as the roasting time was increased. It might be due to the fact that, as roasting time increases, more moisture was drawn from the kernels and they became more brittle and brittleness makes the kernels more susceptible to breakage during roasting and conveyance [13].
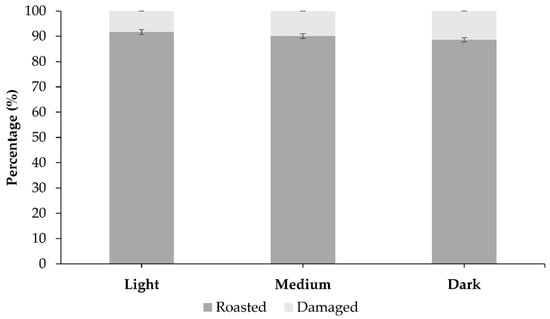
Figure 6.
Roasting performance of CSR.
3.3. Quality Analysis
The quality of groundnuts roasted at optimum roasting conditions in CSR was analyzed to make a comprehensive quality comparison with standardized ranges. The experimental results (average of three replications) are given in Table 6.
Table 6.
Ash analysis, proximate and mineral composition of raw and roasted (light, medium and dark) groundnuts.
It is evident from Table 6 that the total ash and MC in roasted groundnut were found to be lower than of raw groundnut samples. This trend showed consistency with the results given by other authors [40,41,42,43]. The results of the proximate analysis revealed that the crude protein content was higher in roasted groundnuts than the raw groundnuts and found to be well in the range (19.7–31.3%) as given by [38]. There was slight increase in the crude carbohydrate and crude fiber levels of roasted groundnuts which were similar to the findings of [43]. The fat content of roasted groundnuts was also found higher than raw ones [44]. The results of the energy determination also showed higher energy contents of roasted groundnut than of raw kernels. The experimental results also revealed that the overall mineral contents of roasted groundnut kernels were comparatively higher than raw groundnut kernels. Potassium, phosphorus, and magnesium were found to be higher in the roasted groundnuts whereas calcium was decreased in roasted groundnut. Zinc was found almost similar both in raw and roasted groundnuts. These results were found to be consistent with the previous investigations on the mineral and nutritional analysis [42,43,44,45,46]. Overall, CSR has shown quite satisfactory results for roasting of groundnuts as all the nutritional components were found within standardized limits.
3.4. Thermal Analysis of CSR
During the roasting experiments, an infrared camera was used for capturing the thermal images of the surface of the heat receiver to observe the temperature distribution. As one of the images taken on 24 March 2018 is shown in Figure 7.
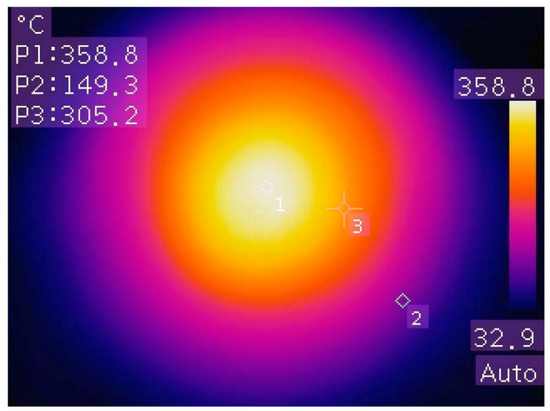
Figure 7.
Temperature distribution on the heat receiver surface of CSR.
The surface temperature of the heat receiver was found to be 358.8 °C at the center point of the targeted focus by Scheffler concentrator during peak hours as shown in Figure 7 (point 1). It can be observed that the temperature decreases gradually towards the outer ends of heat receiver. It is due to the fact that the Scheffler concentrator focuses maximum intensity of converged DNI at the centre of targeted focus due to overlapping of reflection of more mirror strips and the intensity of focused radiations reduces with moving away from the centre point. Overall, a good medium to high range temperature distribution can be seen at the surface of heat receiver which provides sufficient heat energy for heating HTF to produce reasonable roasting temperature in the roasting cylinder. These observations also justify the design configuration of circular thermal heat receiver (having diameter of 350 mm) with respect to solar concentrator (having surface area of 10 m2) in accordance with the geometric concentration ratio which is 100 in this case.
The surface temperature of the heat receiver and inlet temperature variations of the roasting cylinder corresponding to available DNI at each time interval (10 min) were also logged with thermocouples (K-type) and pyranometer, respectively. The recorded results for 24 March 2018 between 09:00 am to 03:00 pm are represented in Figure 8.
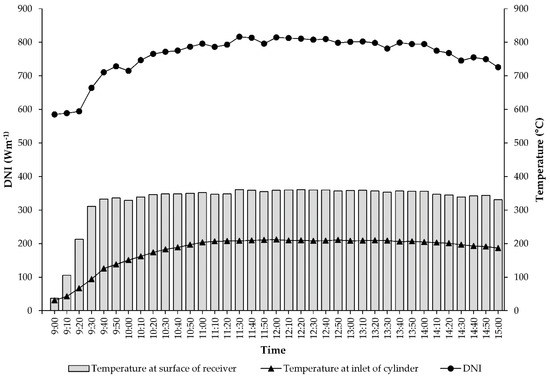
Figure 8.
Variation in inlet temperature of roasting cylinder vs DNI.
It is evident from the inlet temperature line in Figure 8 that the preheating of thermal oil was completed before 10:30 am and a temperature about 183 °C was available for roasting at the inlet of roasting cylinder. After 10:30 am, the inlet temperature of roasting cylinder was increased and remained almost constant at 211 °C ± 1 till 02:30 pm, when the DNI were available at their peak with slight fluctuations due to minor clouds. The excessive temperature (> 180 °C) at roasting cylinder inlet was automatically maintained by the solenoid valves during the experiment by directing the thermal oil flow path through thermal oil reservoir to the heat receiver. After 2:30 pm, temperature of thermal oil gradually decreased because lesser intensity of radiations reduced the input energy to the system. During the whole period, temperature at the surface of the heat receiver remained almost constant around 350 °C and there was only a minor decrease due to the variations in DNI. These observations revealed that the desired roasting temperature was available around 4.5 h on a sunny day with DNI ranging between 650 to 800 Wm−2, hence, establishing the fact that CSR was able to roast 288 kg, 202 kg and 140 kg groundnuts subjected to light, medium and dark roasting conditions.
Thermal Efficiency of CSR
The experiment conducted on one of the sunny days (24 March 2018) with average DNI recoded as 800 Wm−1 and the total energy available from sun for a concentrator surface area of 10 m2 was 8000 W. Unlike the other solar collectors, the optical losses of Scheffler concentrator are a little bit complicated and were calculated by adding the actual available aperture of the concentrator (7 m2), reflectivity of the reflecting surface (glass mirrors > 93%), precision and geometry of the reflector (9%), and the absorbance of the casted aluminium surface of the heat receiver (0.90). Under the available configurations of CSR, these losses were calculated to be 2370 W, 394 W, 524 W, and 471 W respectively, using Equations (2–5). It was determined that out of total DNI energy, the total optical and thermal losses were found to be 3759 W and 2120 W respectively. Out of total available energy from DNI (8000 W), about 2127 W power was utilized for groundnut roasting (Equation (5)) in CSR contributing 26.6% overall thermal efficacy of the system (Equation (6)). The complete energy distribution has been shown in Figure 9.
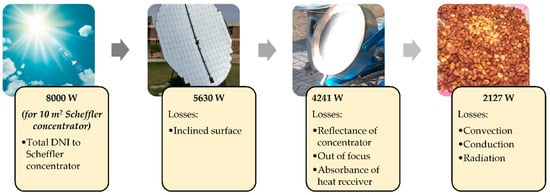
Figure 9.
Energy distribution and losses for groundnut roasting (dark condition) in CSR with average incoming DNI of 800 Wm−2.
Figure 10 shows the solar thermal energy utilization in kWh during the roasting of groundnuts in kg of light, medium and dark quality attributes. From these curves, one can assess the different weight of the groundnuts of desired qualities at different amounts of available energy and this research can be modeled to design various sizes of solar roasting machines on the basis of thermal energy available for processing/ roasting. It has been observed that 30 ± 1, 21 ± 1 and 15 ± 1 kg of groundnuts can be roasted in CSR by utilizing 1 kWh of solar thermal power subjected to light, medium and dark roasting quality respectively. Also considering the results under Section 3.4, CSR has the capacity to produce about 10 kW/day useful thermal energy for the roasting of groundnuts on a sunny day.
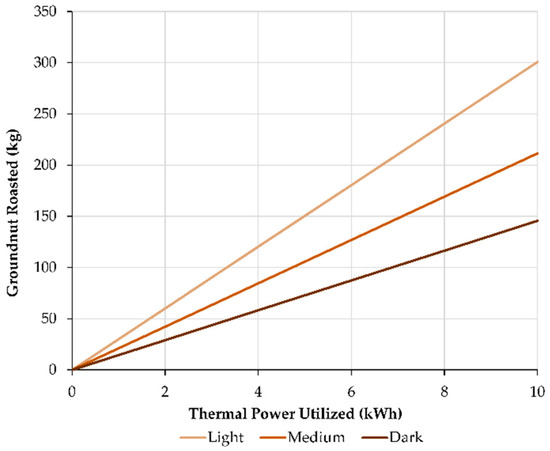
Figure 10.
Solar thermal power utilization for roasting of groundnuts.
Figure 10 shows the solar thermal energy utilization in kWh during the roasting of groundnuts in kg of light, medium and dark quality attributes. From these curves, one can assess the different weight of the groundnuts of desired qualities at different amounts of available energy and this research can be modeled to design various sizes of solar roasting machines on the basis of thermal energy available for processing/ roasting. It has been observed that 30 ± 1, 21 ± 1, and 15 ± 1 kg of groundnuts can be roasted in CSR by utilizing 1 kWh of solar thermal power subjected to light, medium and dark roasting quality respectively. Also considering the results under Section 3.4, CSR has the capacity to produce about 10 kW/day useful thermal energy for the roasting of groundnuts on a sunny day.
3.5. Economic Analysis
As useful working hours of CSR depend upon the weather conditions, therefore the economic evaluation of the system was carried out on hourly basis. The capital cost of the system along with fabrication of Scheffler concentrator was 2308 USD and life span of CSR was assumed to be 10 years (~22,000 useful working hours). The economic analysis was performed in terms of fuel saving in comparison with other fossil-fuel based resources i.e., electricity, diesel, and gasoline. The total cost per hour of CSR including fixed and variable costs was calculated to be 0.237 USDh−1. Based on the fuel and electricity prices in Pakistan, it was determined that a fuel costing 1.16, 0.83 and 0.58 USDh−1 has been saved when gasoline, diesel, and electricity were used as primary source for equivalent roasting energy generation. The payback period (break-even point) of CSR was calculated by plotting the useful working hours against the expenses to calculate the break-even point for each case.
Figure 11 shows the graphical representation of the break-even point analysis of CSR. The golden, green and red line cuts the blue line at 2450, 3450, and 5200 useful working hours respectively which are the payback periods when gasoline, diesel, and electricity were used for energy generation respectively.
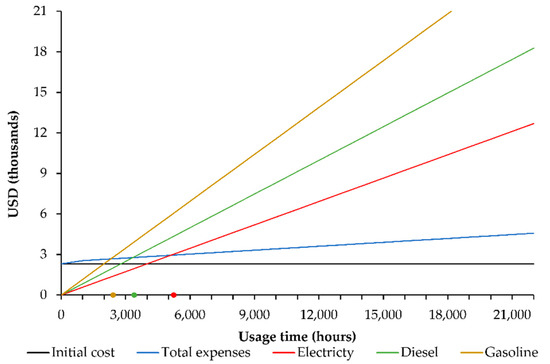
Figure 11.
Break-even analysis of CSR.
4. Conclusions
The present research was carried out to investigate the capacity of a continuous solar roaster (CSR) for groundnut roasting in a decentralized manner. A 10 m2 standing Scheffler fixed focus concentrator was used to converge the incoming DNI at a casted aluminum surface of a heat receiver. The energy produced was conveyed to the roasting unit by circulating thermal oil from heat receiver to roasting cylinder to heat receiver using conduction mechanism for the roasting of groundnuts. The system was completely independent of connections from the utility grid and all the thermal and electric powers were generated by utilizing solar energy. The experimental findings revealed that the optimum time for light, medium and dark roasting was found to be 14 ± 0.1, 20 ± 0.1, and 29 ± 0.1 min respectively with 180 °C temperature of thermal oil at the inlet of a roasting cylinder. On a sunny day with DNI ranging between 650 to 800 Wm−2, CSR was capable to continuously roast 288, 203, and 140 kg groundnuts with average roasting performance of 91.7 ± 1.0%, 90.1 ± 1.0%, and 88.6 ± 1.0% prior to light, medium and dark roasting quality respectively using 10 kW of thermal energy. Final moisture contents of groundnut kernels were found to be 1.99, 1.73, and 1.34% against the L* value of 53.42, 48.77, and 43.41 for light, medium and dark roasting respectively. Overall, CSR has shown quite satisfactory performance in terms of roasting quality. Thermal analysis revealed that out of 8000 W of total available DNI energy, about 3759 W and 2120 W were lost due to optical and thermal losses of the system and 2127 W was finally utilized by the groundnuts during roasting in CSR with an overall 26.6% thermal efficacy. The initial investment of CSR was estimated to be recovered after 2450, 3450 and 5200 useful working hours when gasoline, diesel, and electricity were used for equivalent roasting energy generation respectively.
Author Contributions
Conceptualization, A.R., F.M., A.M. and O.H.; methodology, A.R. and F.M.; software, A.R. and F.M.; validation, A.R. and A.M.; formal analysis, A.R. and F.M.; investigation, A.R. and F.M.; resources, A.M. and O.H.; data curation, A.R. and F.M.; writing—original draft preparation, A.R. and F.M.; writing—review and editing, A.R., A.M. and O.H.; visualization, A.R. and F.M.; supervision, A.M. and O.H.; project administration, A.M. and O.H.; funding acquisition, A.R., A.M. and O.H.
Funding
This research received no external funding.
Acknowledgments
The current research is a part of PhD research work. The financial support was provided by the Higher Education Commission of Pakistan (HEC) under Indigenous PhD Fellowship Program for 5000 scholars-Phase-II, technical and research facilities were supported by the International Center for Development and Decent Work (ICDD), German Academic Exchange Service (DAAD) and University of Agriculture Faisalabad (UAF).
Conflicts of Interest
The authors declare no conflict of interest.
References
- Krishnan, S. Sustainable Coffee Production. In Oxford Research Encyclopedia; Oxford University Press: Oxford, UK, 2017; pp. 1–34. [Google Scholar]
- NCA (National Coffee Association). Coffee Around the World. Available online: http://www.ncausa.org/About-Coffee/Coffee-Around-the-World (accessed on 29 May 2019).
- REN21. Renewables 2017 Global Status Report; REN21 Secretariat: Paris, France, 2017. [Google Scholar]
- Wilkinson, J.; Rocha, R. Agri-processing and developing countries. In The World Bank Development Repost 2008; World Bank: Washington, DC, USA, 2008. [Google Scholar]
- Mekhilef, S.; Saidur, R.; Safari, A. A review on solar energy use in industries. Renew. Sustain. Energy Rev. 2011, 15, 1777–1790. [Google Scholar] [CrossRef]
- FAO (Food and Agriculture Organization). Energy-Smart’ Food for People and Climate. Issue Paper: Food and Agriculture Organization of the United Nations (FAO). Available online: http://www.fao.org/docrep/014/i2454e/i2454e00.pdf (accessed on 11 June 2019).
- Pattee, H.E.; Gierbrecht, F.G.; Isleib, T.G. Roasted peanut flavor intensity variations among US genotypes. Peanut Sci. J. 1995, 22, 158–162. [Google Scholar] [CrossRef]
- Woodroof, J.G. Peanuts: Production, Processing, Products; AVI Publishing: Westport, CN, USA, 1983. [Google Scholar]
- Perren, R.; Escher, F.E. Impact of roasting on nut quality. In Improving the Safety and Quality of Nuts; Harris, L.J., Ed.; Woodhead Publishing: Philadelphia, PA, USA, 2013; pp. 173–197. [Google Scholar]
- Poirier, D.; Sanders, T.H.; Davis, J.P. Salmonella surrogate reduction using industrial peanut dry roasting parameters. Peanut Sci. 2014, 41, 72–84. [Google Scholar] [CrossRef]
- Raemy, A.; Lambelet, P. A calorimetric study of self-heating in coffee and chicory. Int. J. Food Sci. Technol. 1982, 17, 451–460. [Google Scholar] [CrossRef]
- Olatunde, O.B.; Ajav, E.A.; Fatukasi, S.O. Design and fabrication of groundnut (Arachis Hypogaea) roaster cum expeller. Int. J. Sci. Technol. 2014, 3, 177–184. [Google Scholar]
- Olaniyan, A.M.; Olayinka, R.K.; Eromosele, E.O. Design and development a small-scale peanut roaster. J. Assoc. Prof. Eng. Trinidad Tobago 2017, 45, 34–39. [Google Scholar]
- Solargis. World Map of DNI. Available online: http://solargis.info/doc/_pics/freemaps/1000px/dni/SolarGIS-Solar-map-DNI-World-map-en.png (accessed on 14 June 2019).
- Munir, A.; Hensel, O.; Scheffler, W. Design principal and calculations of a Scheffler fixed focus concentrator for medium temperature applications. Sol. Energy 2010, 84, 1490–1502. [Google Scholar] [CrossRef]
- Yolmeh, M.; Jafari, S.M. Applications of Response Surface Methodology in the Food Industry Processes. Food Bioprocess Technol. 2017, 10, 413–433. [Google Scholar] [CrossRef]
- Box, G.E.; Hunter, J.S. Multi-Factor Experimental Designs for Exploring Response Surfaces. Ann. Math. Stat. 1957, 28, 195–241. [Google Scholar] [CrossRef]
- Box, G.E.; Wilson, K.B. Breakthroughs in Statistics; Springer: New York, NY, USA, 1992; pp. 270–310. [Google Scholar]
- Pattee, H.E.; Giesbrecht, F.G.; Young, C.T. Comparison of peanut butter color determination by CIELAB L*a*b* and Hunter Color-Difference methods and the relationships of roasted peanut color to roasted peanut flavor response. J. Agric. Food Chem. 1991, 39, 519–523. [Google Scholar] [CrossRef]
- McDaniel, K.A.; White, B.L.; Dean, L.L.; Sanders, T.H.; Davis, J.P. Compositional and mechanical properties of peanuts roasted to equivalent colors using different time/temperature combinations. J. Food Sci. 2012, 77, 1293–1299. [Google Scholar] [CrossRef] [PubMed]
- Ayub, I.; Munir, A.; Ghafoor, A.; Amjad, W.; Nasir, M.S. Solar thermal application for decentralized food baking using Scheffler reflector technology. J. Sol. Energy Eng. 2018, 140, 1–9. [Google Scholar] [CrossRef]
- Duffie, J.; Beckman, W. Solar Engineering of Thermal Processes, 3rd ed.; John Wiley & Sons, Inc.: Hoboken, NJ, USA, 2006. [Google Scholar]
- Shell Australia Lubricants Product Data Guide. Available online: http://www.crlmsb.com/wp-content/uploads/2015/05/SHELL-HEAT-TRANSFER-OIL-S2.pdf (accessed on 22 August 2019).
- Kahyaoglu, T. Optimisation of the pistachio nut roasting process using response surface methodology and gene expression programming. LWT 2008, 41, 26–33. [Google Scholar] [CrossRef]
- Adeyeye, E.I. Effects of processing on the nutritional and anti-nutritional factors of Arachis hypogaea Linn. (groundnut) seed flour. Int. J. Chem. Sci. 2011, 4, 131–142. [Google Scholar]
- Pearson, D. The Chemical Analysis of Food; Churchill Livingstone: Edinburgh, UK, 1981; pp. 504–530. [Google Scholar]
- A.O.A.C. A.O.A.C. Official Method of Analysis, 16th ed.; Association of Official Analytical Chemists: Washington, DC, USA, 1996. [Google Scholar]
- Greenfield, H.; Southgate, D.A.T. Food Composition Data 2nd Edition: Production, Management and Use; Elsevier Science Publishers: Amsterdam, The Netherlands; FAO: Rome, Italy, 2003. [Google Scholar]
- Senthil, R.; Cheralathan, M. Effect of once-through and recirculated fluid flow on thermal performance of parabolic dish solar receiver. Indian J. Sci. Technol. 2016, 9, 1–5. [Google Scholar] [CrossRef]
- Chikelu, C.C.; Ude, M.U.; Onyekwere, D.C.; Ekwereike, G.C.; Okpanachi, A.I. Design of a groundnut kernel roastmaster. Int. Res. J. Eng. Technol. 2015, 2, 17–24. [Google Scholar]
- Shi, X. Effects of Different Roasting Conditions on Peanut Quality. Ph.D. Thesis, North Carolina State University, Raleigh, NC, USA, 2015. [Google Scholar]
- Smyth, D.A.; Macku, C.; Holloway, O.E.; Deming, D.M.; Slade, L.; Levine, H. Evaluation of analytical methods for optimizing peanut roasting for snack foods. Peanut Sci. 1998, 25, 70–76. [Google Scholar] [CrossRef]
- Tomlins, K.; Rukuni, T.; Mutungamiri, A.; Mandeya, S.; Swetman, A. Effect of roasting time and storage time on sensory attributes and consumer acceptability of peanut butters in Southern Africa. Trop. Sci. 2007, 47, 165–182. [Google Scholar] [CrossRef]
- Rozalli, N.H.M.; Chin, N.L.; Yusof, Y.A. Simultaneous multiple responses modelling, optimisation and correlation of asian type peanuts (arachis hypogaea l.) roasting using response surface methodology. Acta Aliment. 2012, 43, 142–157. [Google Scholar] [CrossRef]
- Willich, R.K. Peanut butter. II. Effect of roasting and blanching on the thiamin content of peanut butter. Food Technol. 1952, 6, 199–200. [Google Scholar]
- Goldblith, S.A. Introduction to Thermal Processing of Foods; AVI Publishing Company: Westport, CT, USA, 1961. [Google Scholar]
- Singh, R.P.; Heldman, D.R. Introduction to Food Engineering; Academic Press: Orlando, FL, USA, 1984. [Google Scholar]
- Demir, A.D.; Celayeta, J.M.F.; Cronin, K.; Abodayeh, K. Modelling of the kinetics of colour change in hazelnuts during air roasting. J. Food Eng. 2002, 55, 283–292. [Google Scholar] [CrossRef]
- Young, C.T.; Schadel, W.E.; Heertje, I. A comparison of the effects of oven roasting and oil cooking on the microstructure of peanut (arachis-hypogaea l cv florigiant) cotyledon. Food Struct. 1993, 12, 59–66. [Google Scholar]
- Jossyln, M.A. Methods in Food Analysis; Academic Press, Inc.: New York, NY, USA, 1973. [Google Scholar]
- Duke, J.A. Handbook of Legumes of World Economic Importance; Plenum Press: New York, NY, USA, 1981. [Google Scholar]
- Nelson, R.G.; Carlos, A.G. Chemical composition of aboriginal peanut (Arachis hypogaea L.) from Peru. J. Agric. Food Chem. 1995, 43, 102–105. [Google Scholar]
- Ayoola, P.B.; Adeyeye, A. Effect of heating on the chemical composition and physico-chemical properties of Arachis hypogea (groundnut) seed flour and oil. Pak. J. Nutr. 2010, 9, 751–754. [Google Scholar] [CrossRef]
- Musa, A.K.; Kalejaiye, D.M.; Ismaila, I.E.; Oyerinde, A.A. Proximate composition of selected groundnut varieties and their susceptibility to Trogodermagranarium everts attack. J. Stored Prod. Postharvest Res. 2010, 1, 13–17. [Google Scholar]
- Kumar, B.; Sadagopan, R.S. Comparative physico-chemical, proximate and mineral analysis on raw and roasted seeds of groundnut. Commun. Plant Sci. 2013, 3, 25–29. [Google Scholar]
- Atasie, V.N.; Akinhanmi, T.F.; Ojiodu, C.C. Proximate analysis and physico-chemical properties of ground nut (Arachis hypogaea L.). Pak. J. Nutr. 2009, 8, 194–197. [Google Scholar]
© 2019 by the authors. Licensee MDPI, Basel, Switzerland. This article is an open access article distributed under the terms and conditions of the Creative Commons Attribution (CC BY) license (http://creativecommons.org/licenses/by/4.0/).