1. Introduction
Seismic responses of the soil–structure interaction system are frequently demanded in engineering applications, particularly those involving large project construction. Due to the complexity of soil properties, the shaking table test is often used to investigate the seismic response of systems and to check the validity of the theory. The reliability of these model test results depends on the design of the dynamic similarity between the model system and the prototype system. To meet the requirement of similarity between the natural frequency of the original system and that of the test system, various materials are added to the soils used as the model soil for experiments. Materials may include iron powder or iron crystal sand [
1,
2], synthetic fibers [
3,
4,
5,
6], or rubber particles [
7,
8,
9,
10]. However, iron powder and synthetic fibers are expensive, and the rubber particles may introduce environmental problems. Sawdust, a light-weight, inexpensive, and environmentally friendly material, is frequently used in practical engineering. Applications include its use as an additive in concrete or in amended lateritic clay as a landfill liner to retain heavy metals [
11,
12,
13,
14,
15].
Researchers have conducted many studies on the engineering properties of soils or of soil mixtures with various additives. The factors affecting the dynamic properties of engineering soil have also been widely studied. Li [
16] studied standard sand and clay and indicated that the loading frequency had a significant influence on the dynamic properties of clay. Aggour [
17] presented equations for the determination of the shear modulus, Young’s modulus, and damping of sandy soils. Hashash et al. [
18] and Hardin et al. [
19] found that the dynamic shear modulus and damping ratio of soil were influenced by confining pressure, loading cycles, effective average principal stress, etc. Qi et al. [
20] and Wichtmann et al. [
21,
22] found that the cyclic and dynamic loading history markedly affected the dynamic properties of saturated clay and dry sand. Similar to real soil in practical engineering applications, it is necessary to investigate the dynamic characteristics of the soil-sawdust mixture. Shang et al. [
23] and Chen et al. [
24] studied clay-sawdust mixtures, and indicated that the consolidation stress and confining pressure were very significant factors influencing the shear modulus of the mixture. Yan et al. [
25] also showed that the shear modulus of the sand-sawdust mixture was notably affected by the sawdust content. As the soil-sawdust mixture can easily obtain different shear wave velocities by changing the sawdust content in the soil mixture, it has been widely used in shaking table tests [
26,
27,
28,
29,
30].
Extensive testing for the dynamic properties of the sand-sawdust mixture have not been conducted, therefore, it is inadequately understood how the content ratio of the sand and sawdust, as well as the confining pressure affect the shear modulus and damping ratio. In this paper, a series of consolidated drained dynamic triaxial tests were carried out on sand-sawdust mixtures to investigate how the shear modulus and damping ratio varied with shear strain. The strain behavior of the mixture was captured with tests covering a range of strain amplitude from approximately 10−4 to 10−2 and a confining pressure for the triaxle test () equal to 10 kPa, 20 kPa, 50 kPa, 100 kPa, 150 kPa, and 200 kPa. The samples were mixed with several different percentages of sawdust and sand. The variation of shear modulus and damping ratio with the percentage of sawdust and confining pressures are presented.
2. Experimental Program
2.1. Apparatus and Measurements
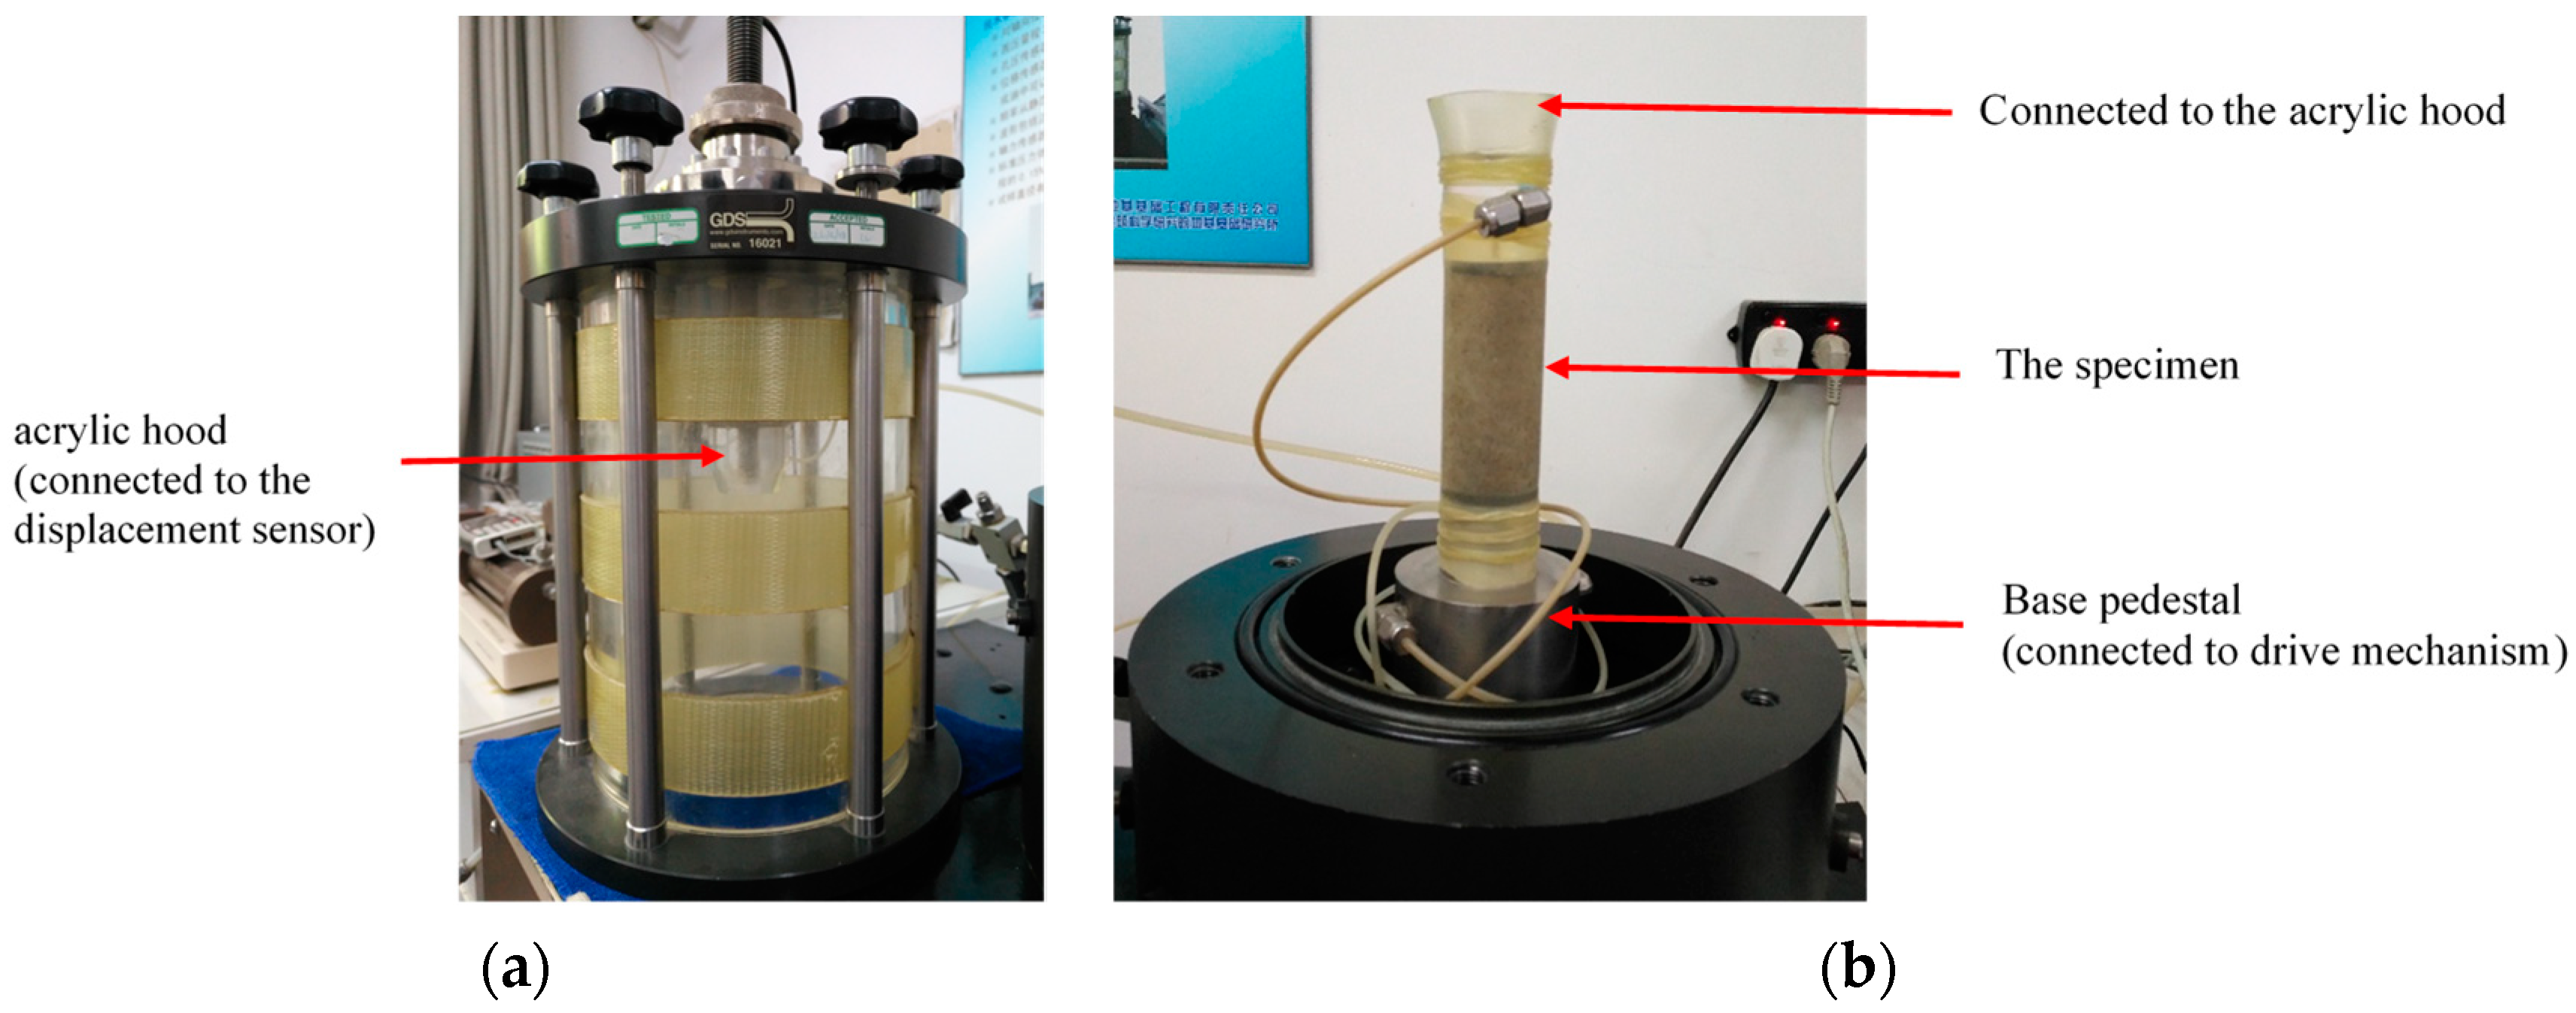
The cyclic triaxial tests were conducted on a global distribution system(GDS) triaxial apparatus as shown in
Figure 1. The main performance parameters of the apparatus are shown in
Table 1. In this apparatus, the vertical stress is applied by a servo loading system, and the confining pressure and back pressure are applied through a digital pressure controller. The bottom end of the sample is rigidly fixed on a base pedestal connected with a drive mechanism, and the top end of the sample is fixed with an acrylic hood on which a displacement sensor to record the axial displacement of sample is attached. The maximum shear stress (
) and shear strain (
) are obtained by:
where
is axial stress;
r is radial strain; and
ε is axial strain.
2.2. Material and Sample Preparation
In the sand-sawdust mixture, the sawdust was mixed with sand at percentages of sawdust equal to 20%, 25%, 33%, and 40% by weight and mixed to achieve a fairly uniform distribution of the sawdust within the soil mass. The density expresses the degree of compactness of the tested mixture [
31,
32]. In addition, according to the range of density and water content adopted in the usual shaking table tests, the content of sand and sawdust were determined. The water content and density of each mixture are presented in
Table 2. M5 was pure sand for comparison. The specimens for the dynamic triaxial test were shaped into solid cylinders that were 39.1 mm in diameter and 80 mm in height. The laboratory-created specimens were constructed in a metal split mold (
Figure 2) covering a rubber membrane. The samples of the sand-sawdust mixtures were prepared in five layers of precisely equal mass and sequentially compacted from the bottom to top of the mold. Each layer was compacted to a specified height to reach the required density. Finally, the split mold was removed, and the sample was placed in the triaxial cell as shown in
Figure 1b.
2.3. Testing Procedure
In total, 11 specimens were prepared and tested in the dynamic triaxial apparatus. The testing program is summarized in
Table 3, where the
f represents the loading frequency and
represents the confining pressure. A typical loading curve is shown in
Figure 3, which included 10 cycles for each stage and the stress increment for each load stage was 5 kPa until the specimen was broken. In each test, it took about 30 min for isotropic consolidation when the consolidation deformation curve was stable. Then, ten cyclic loadings with constant amplitude sine waves were applied to the specimens under stress-controlled conditions for each loading stage.
Tests No. 1 to 5 were conducted to study the effect of sawdust content. In the shaking table test, sand-sawdust is mainly used as the deposit soil, therefore the typical confining pressure was chosen as 100 kPa. Tests No. 6 to 11 were conducted to study the effect of confining pressure with a sawdust content equal to 33%, which is the typical content in a shaking table test.
3. Test Results and Discussion
3.1. Synopsis of Stress–Strain Hysteresis Loop
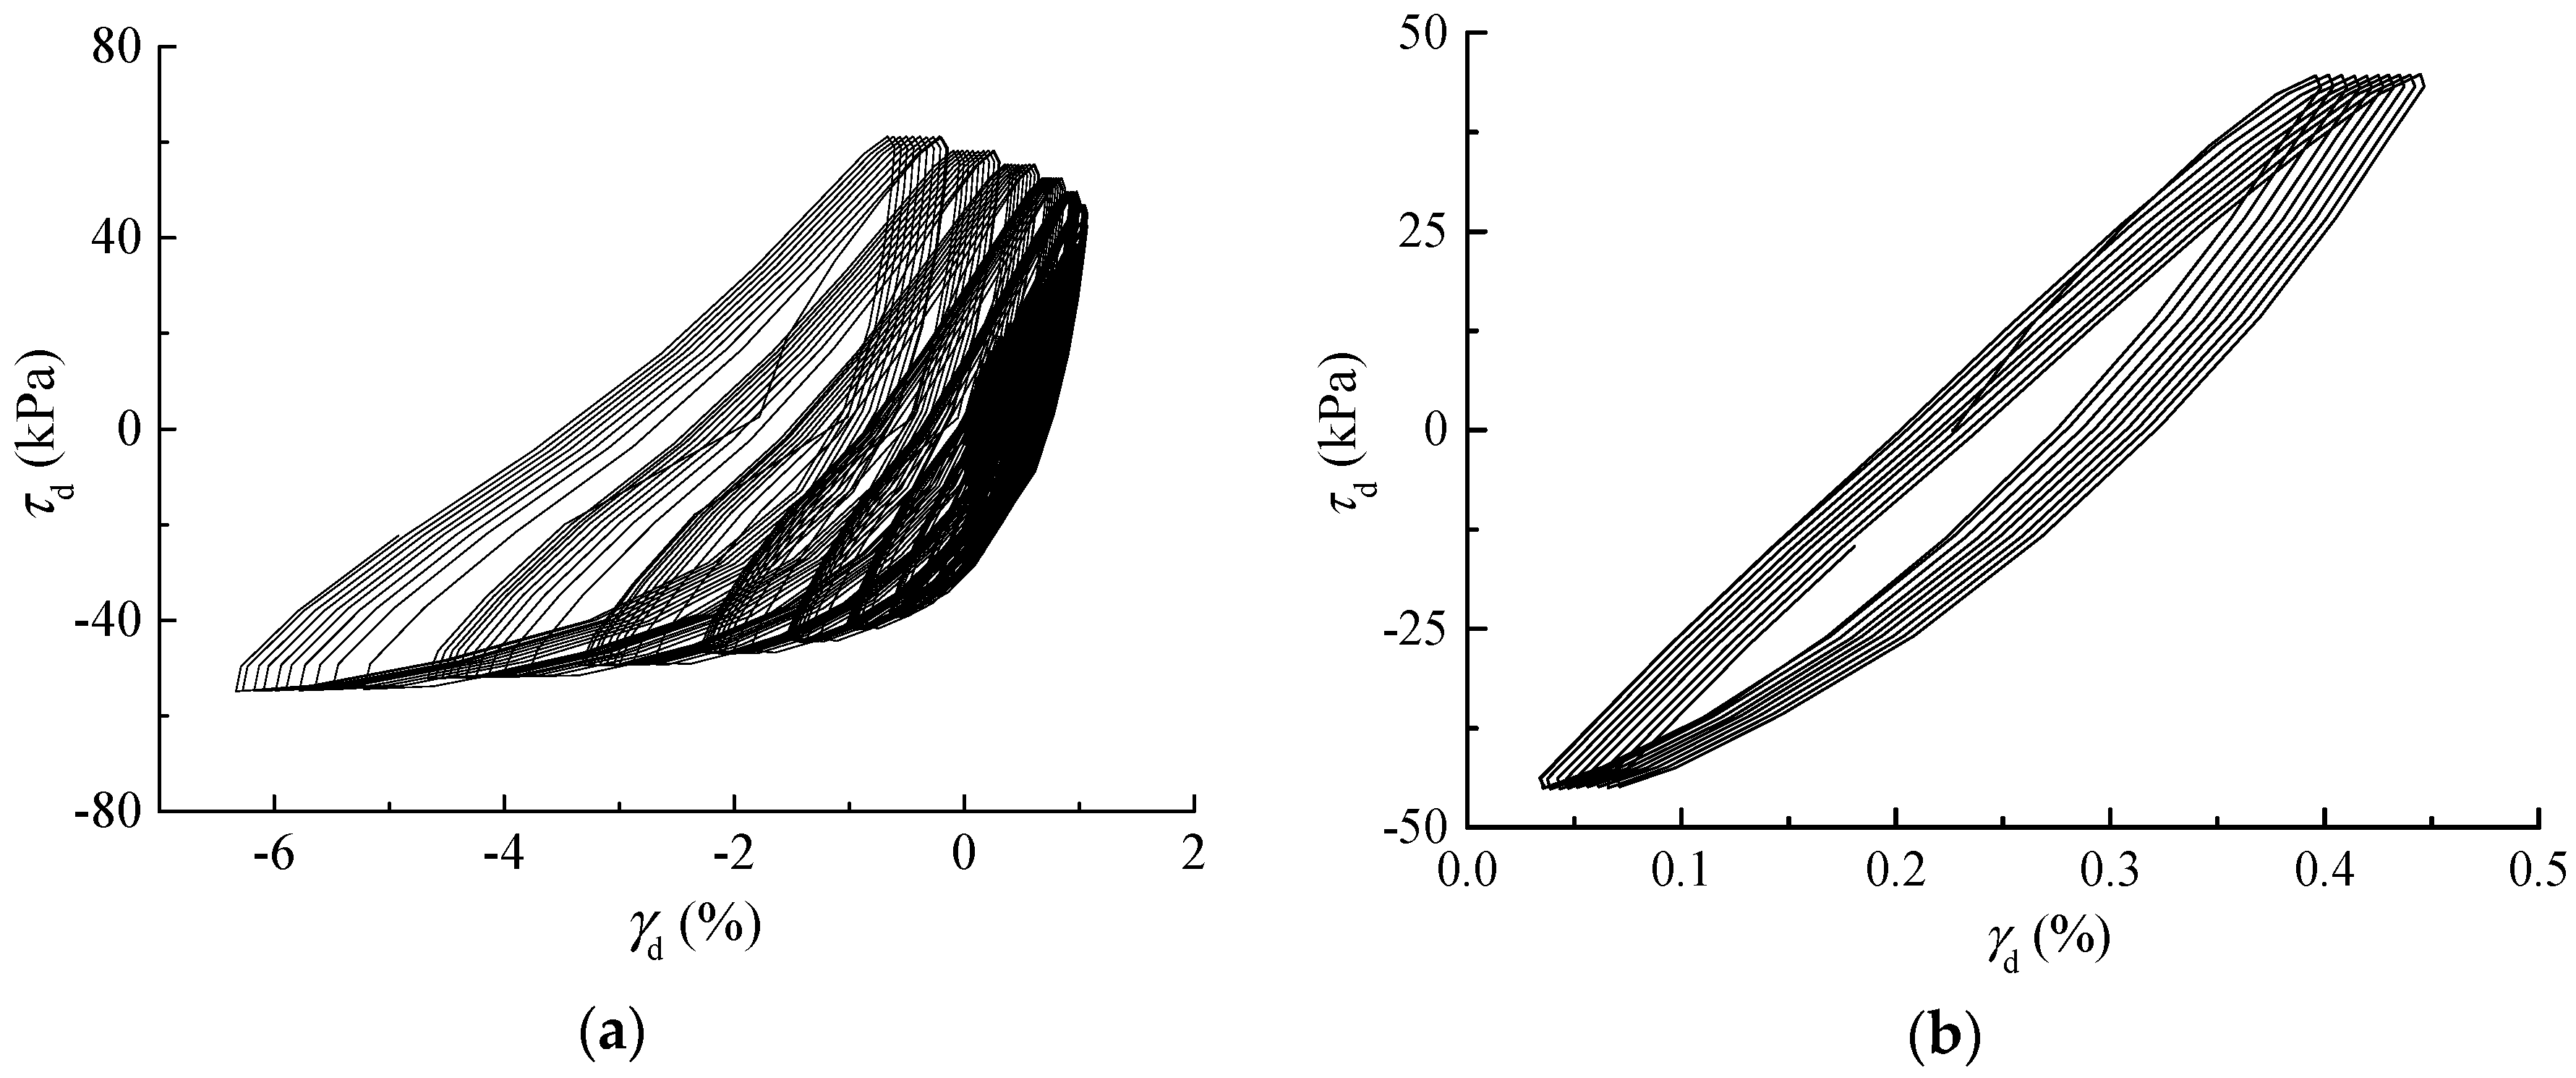
The typical shear stress versus shear strain of the sand-sawdust mixture is shown in
Figure 4a, and included 21 loading stages and 10 cycles for each loading stage for the specimen in test no. 2.
Figure 4b is the close and detailed observation of the tenth loading stage. As shown in
Figure 4b, if the loading was constant, the hysteretic loop gradually shifted to the right, which was a result of plastic strain accumulation. However, the shape of the hysteresis loops was kept unchanged. Therefore, for each of the loading stages, based on Specification of Soil Test [
31], the dynamic shear modulus (
Gd) and damping ratio (
λ) of each hysteretic cycle were calculated. Then, the average values of the dynamic shear modulus and damping ratio of the 10 hysteretic cycles were taken as the dynamic shear modulus and damping ratio of the loading stage.
Figure 5a shows the hysteresis loops of the fifth cycle under each loading stage for test no. 2. As the cyclic loading progressed, there was a progressive increase in the area of the hysteresis loops, indicating that the energy consumed increased under the cyclic loading. As a result, a corresponding change of the loop shape was also observed. The hysteresis loop was almost symmetrical, like a willow leaf at small strain, but showed more asymmetry with the increase in the shear strain, taking a shape more like a sharp leaf. In addition, the slope of the vertex line of the hysteretic loop decreased gradually as the loading stage increased, indicating that the dynamic shear modulus decreased. In the eleventh loading stage, the positive strain amplitude decreased gradually while the negative strain amplitude increased rapidly, and the hysteresis loop moved significantly to the left, as shown in
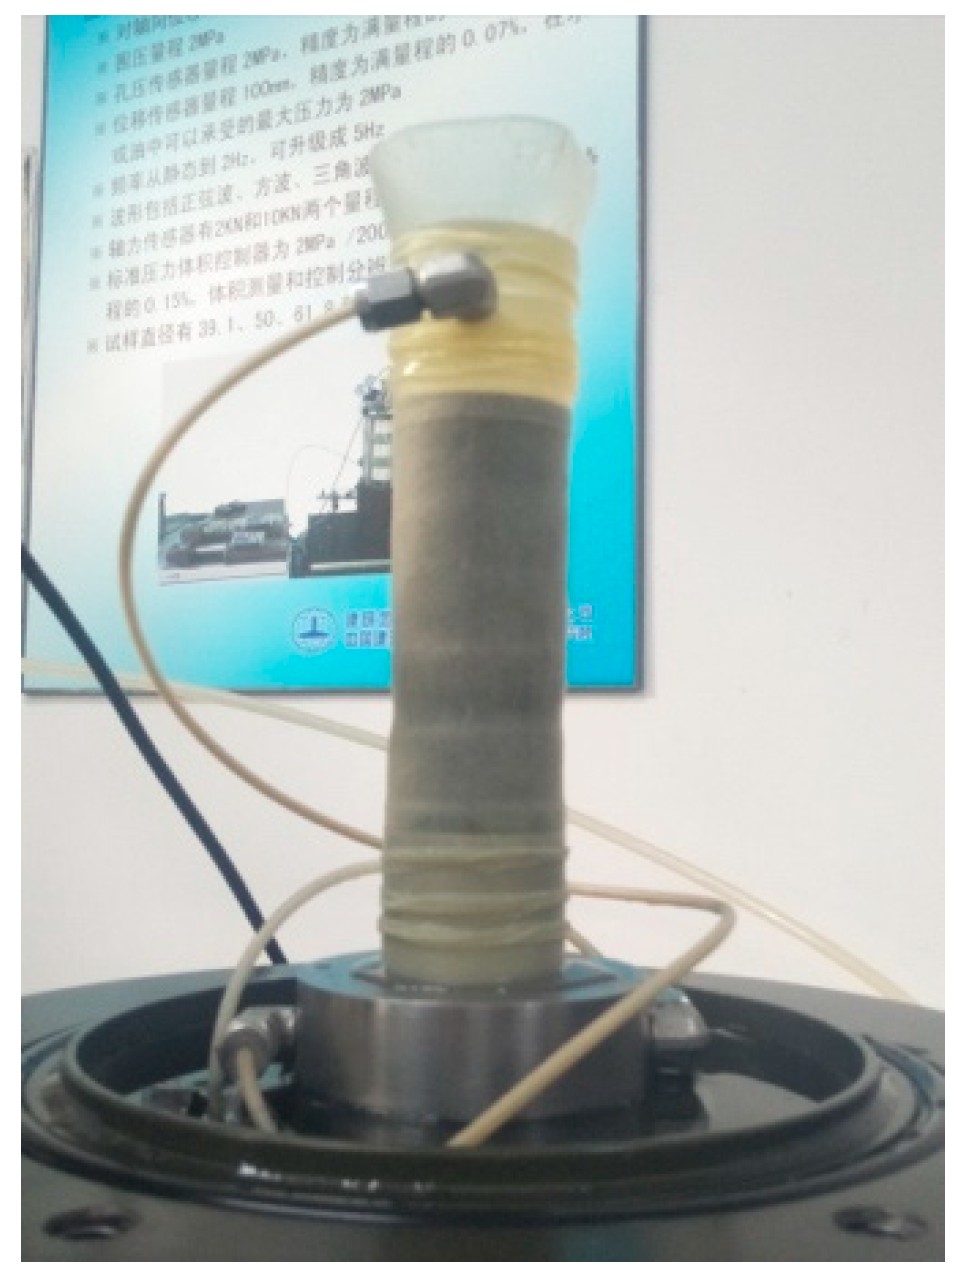
Figure 5b. Meanwhile, it was also observed that the sample showed an obvious necking phenomenon, as shown in
Figure 6, indicating that the specimen had been destroyed. Therefore, when sorting the experimental data, the data before the hysteresis loop moved to the left may be adopted.
3.2. Effect of Sawdust Content
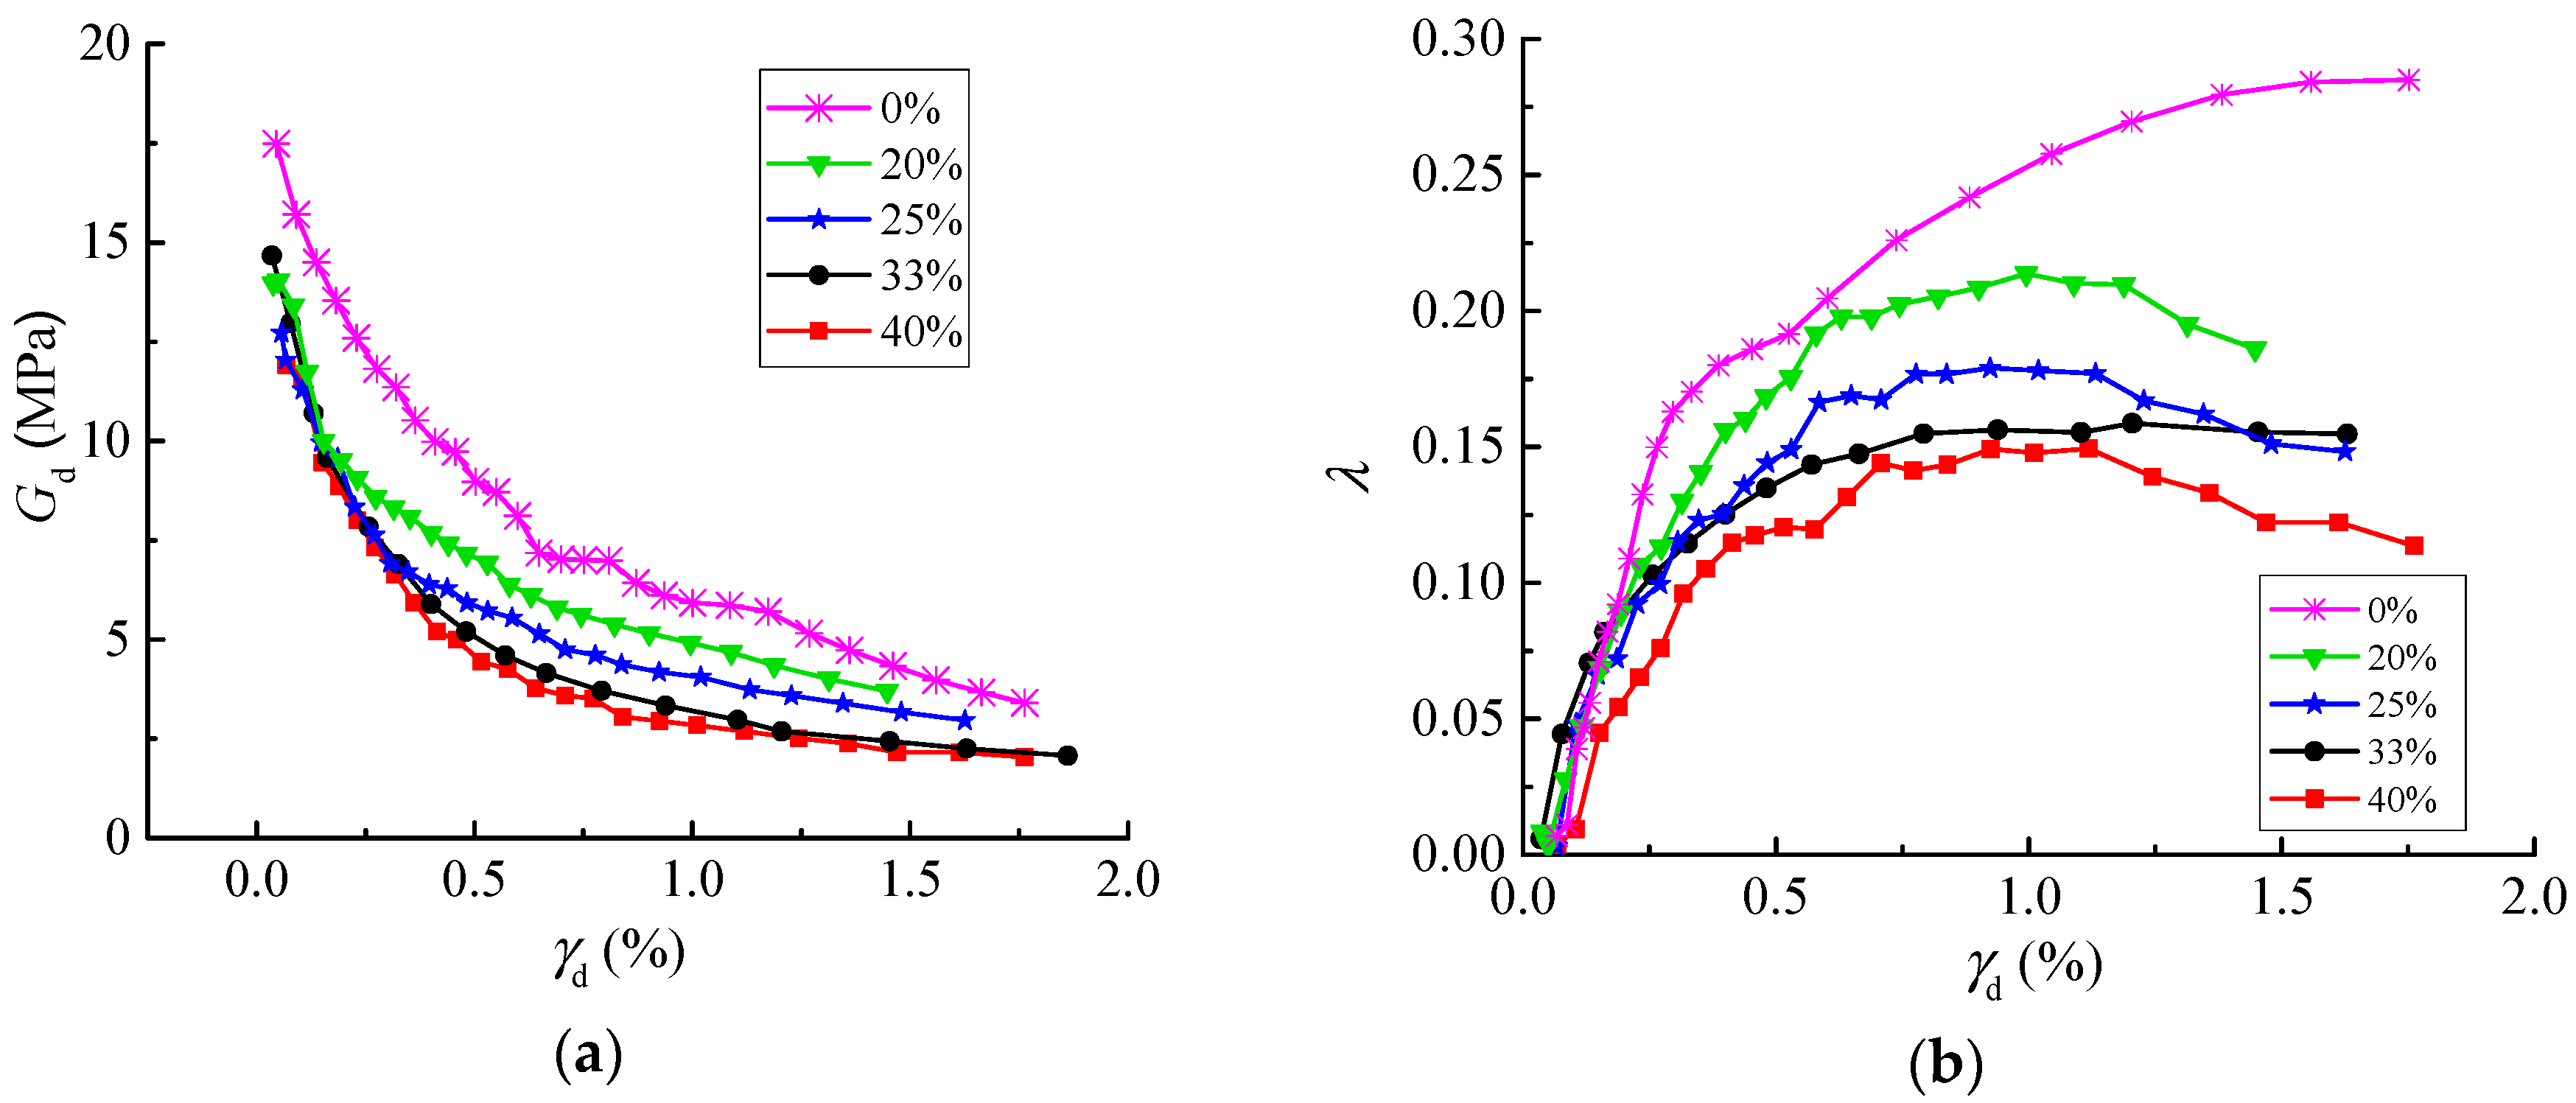
Figure 7 illustrates, in a straightforward way, the effect of sawdust content on the
and
curves of the sand-sawdust mixture. The mixture showed typical characteristics of conventional soil. With the increase of
, the
Gd decreased while the
λ increased, and the
and
curves showed the same trend at different ratios.
There was a marked decrease of
Gd at a given strain amplitude for an increase in sawdust content from 20% to 40%, which was exhibited as the
curve moved down, as shown in
Figure 7a. The shear modulus of the sawdust was far less than that of the sand, thus the increase in sawdust content reduced the decrease of
Gd.
Figure 7b shows that the increase in sawdust content led to a decrease of
λ. This is expected because sawdust is almost an elastic material, the damping of which is less than that of sand. With the increase in sawdust content, the damping ratio of the sand-sawdust mixture decreased.
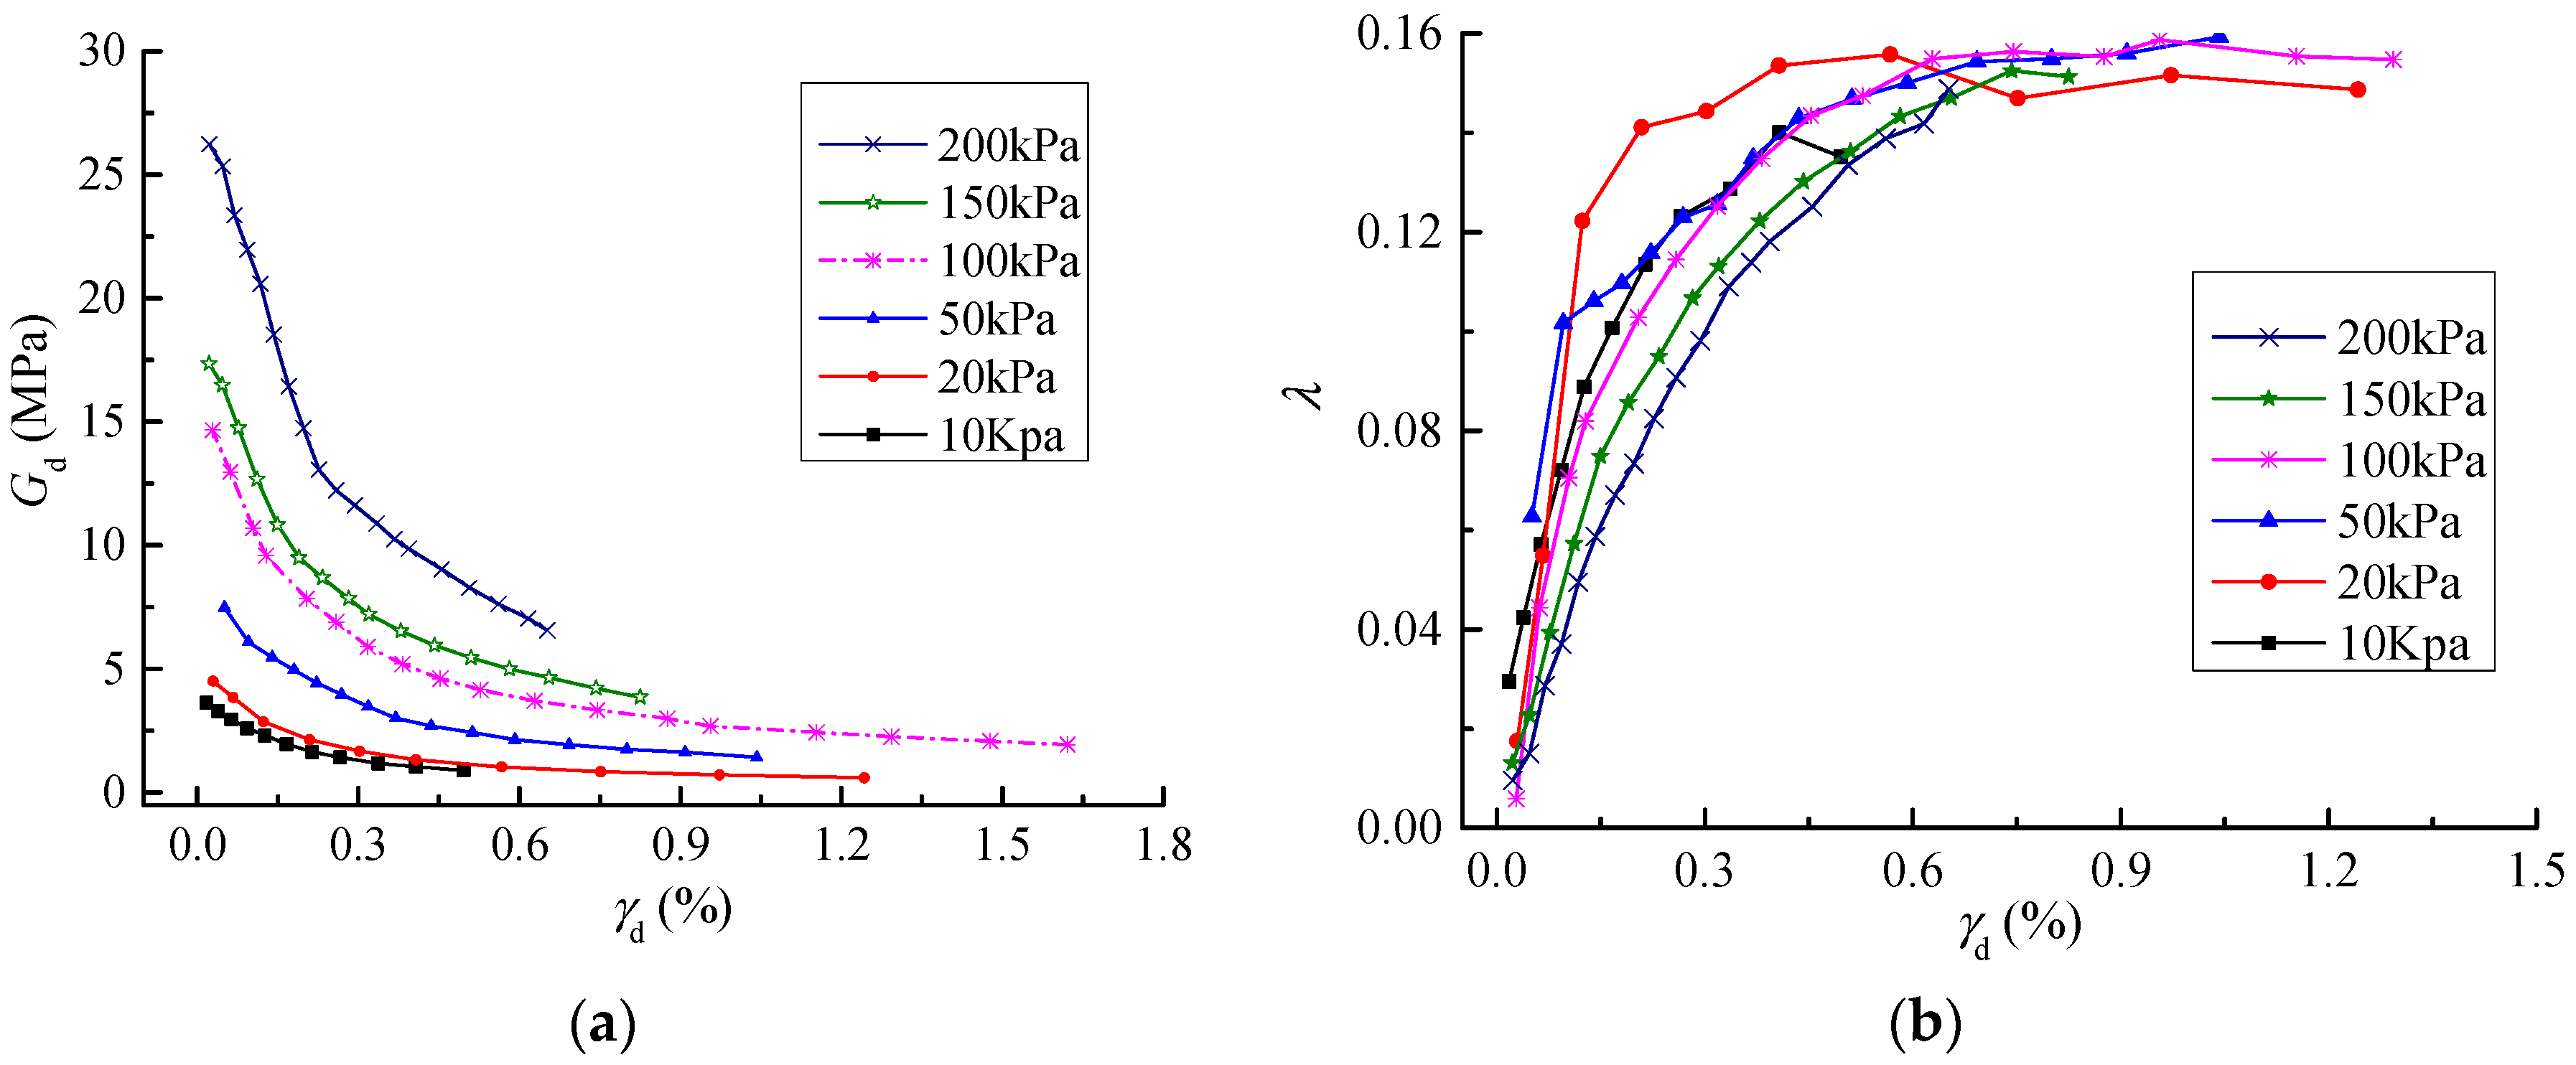
3.3. Effect of Confining Pressure
In
Figure 8, the effect of confining pressure was depicted for six specimens with sawdust contents equal to 33% by mixture weight. As expected, the increase in the shear strain amplitude reduced the shear modulus and increased the damping ratio. When
reached a certain value,
Gd and
λ tended to be a fixed value.
Figure 8a shows that the increase of confining pressure led to the overall upward movement of
curves, indicating that the dynamic shear modulus increased continuously. Due to the compaction effect of confining pressure on soil mass, the greater the confining pressure, the greater the degree of compactness of the soil sample, and the stronger its resistance to soil deformation. As shown in
Figure 8b, the
curves of different confining pressures were almost identical when the
fell outside the range of 0.1%~0.7%, and the
λ slightly decreased as
σ3 increased.
4. Normalized Shear Modulus and Damping
4.1. Maximum Dynamic Shear Modulus
According to the former results [
19], the variation of 1/
Gd with shear strain can be expressed as
where
a = 1/
Gmax and
b = 1/
τmax. Parameter
b expresses the slope of the
curve, and the inverse of the
y-intercept is
Gmax.
On making use of the results of the test, the maximum dynamic shear modulus
Gmax and reference shear strain
(where
) values were fitted for various sawdust content (
Figure 7a), as listed in
Table 4. Note that the increase in sawdust content led to a decrease in the
values and
Gmax values.
The fitting results of various confining pressure (
Figure 8a) are summarized in
Table 5. There was an increase of
Gmax for greater confining pressures.
The
Gmax-
curve was fitted by the Janbu empirical formula [
33] and expressed as:
where
Gmax is the maximum dynamic shear modulus; P
a is normal atmospheric pressure; and
K and
n are fitting parameters.
Figure 9 is the fitting curve for
Gmax and
with
K = 0.1603,
n = 0.8708, and
R2 = 0.9271.
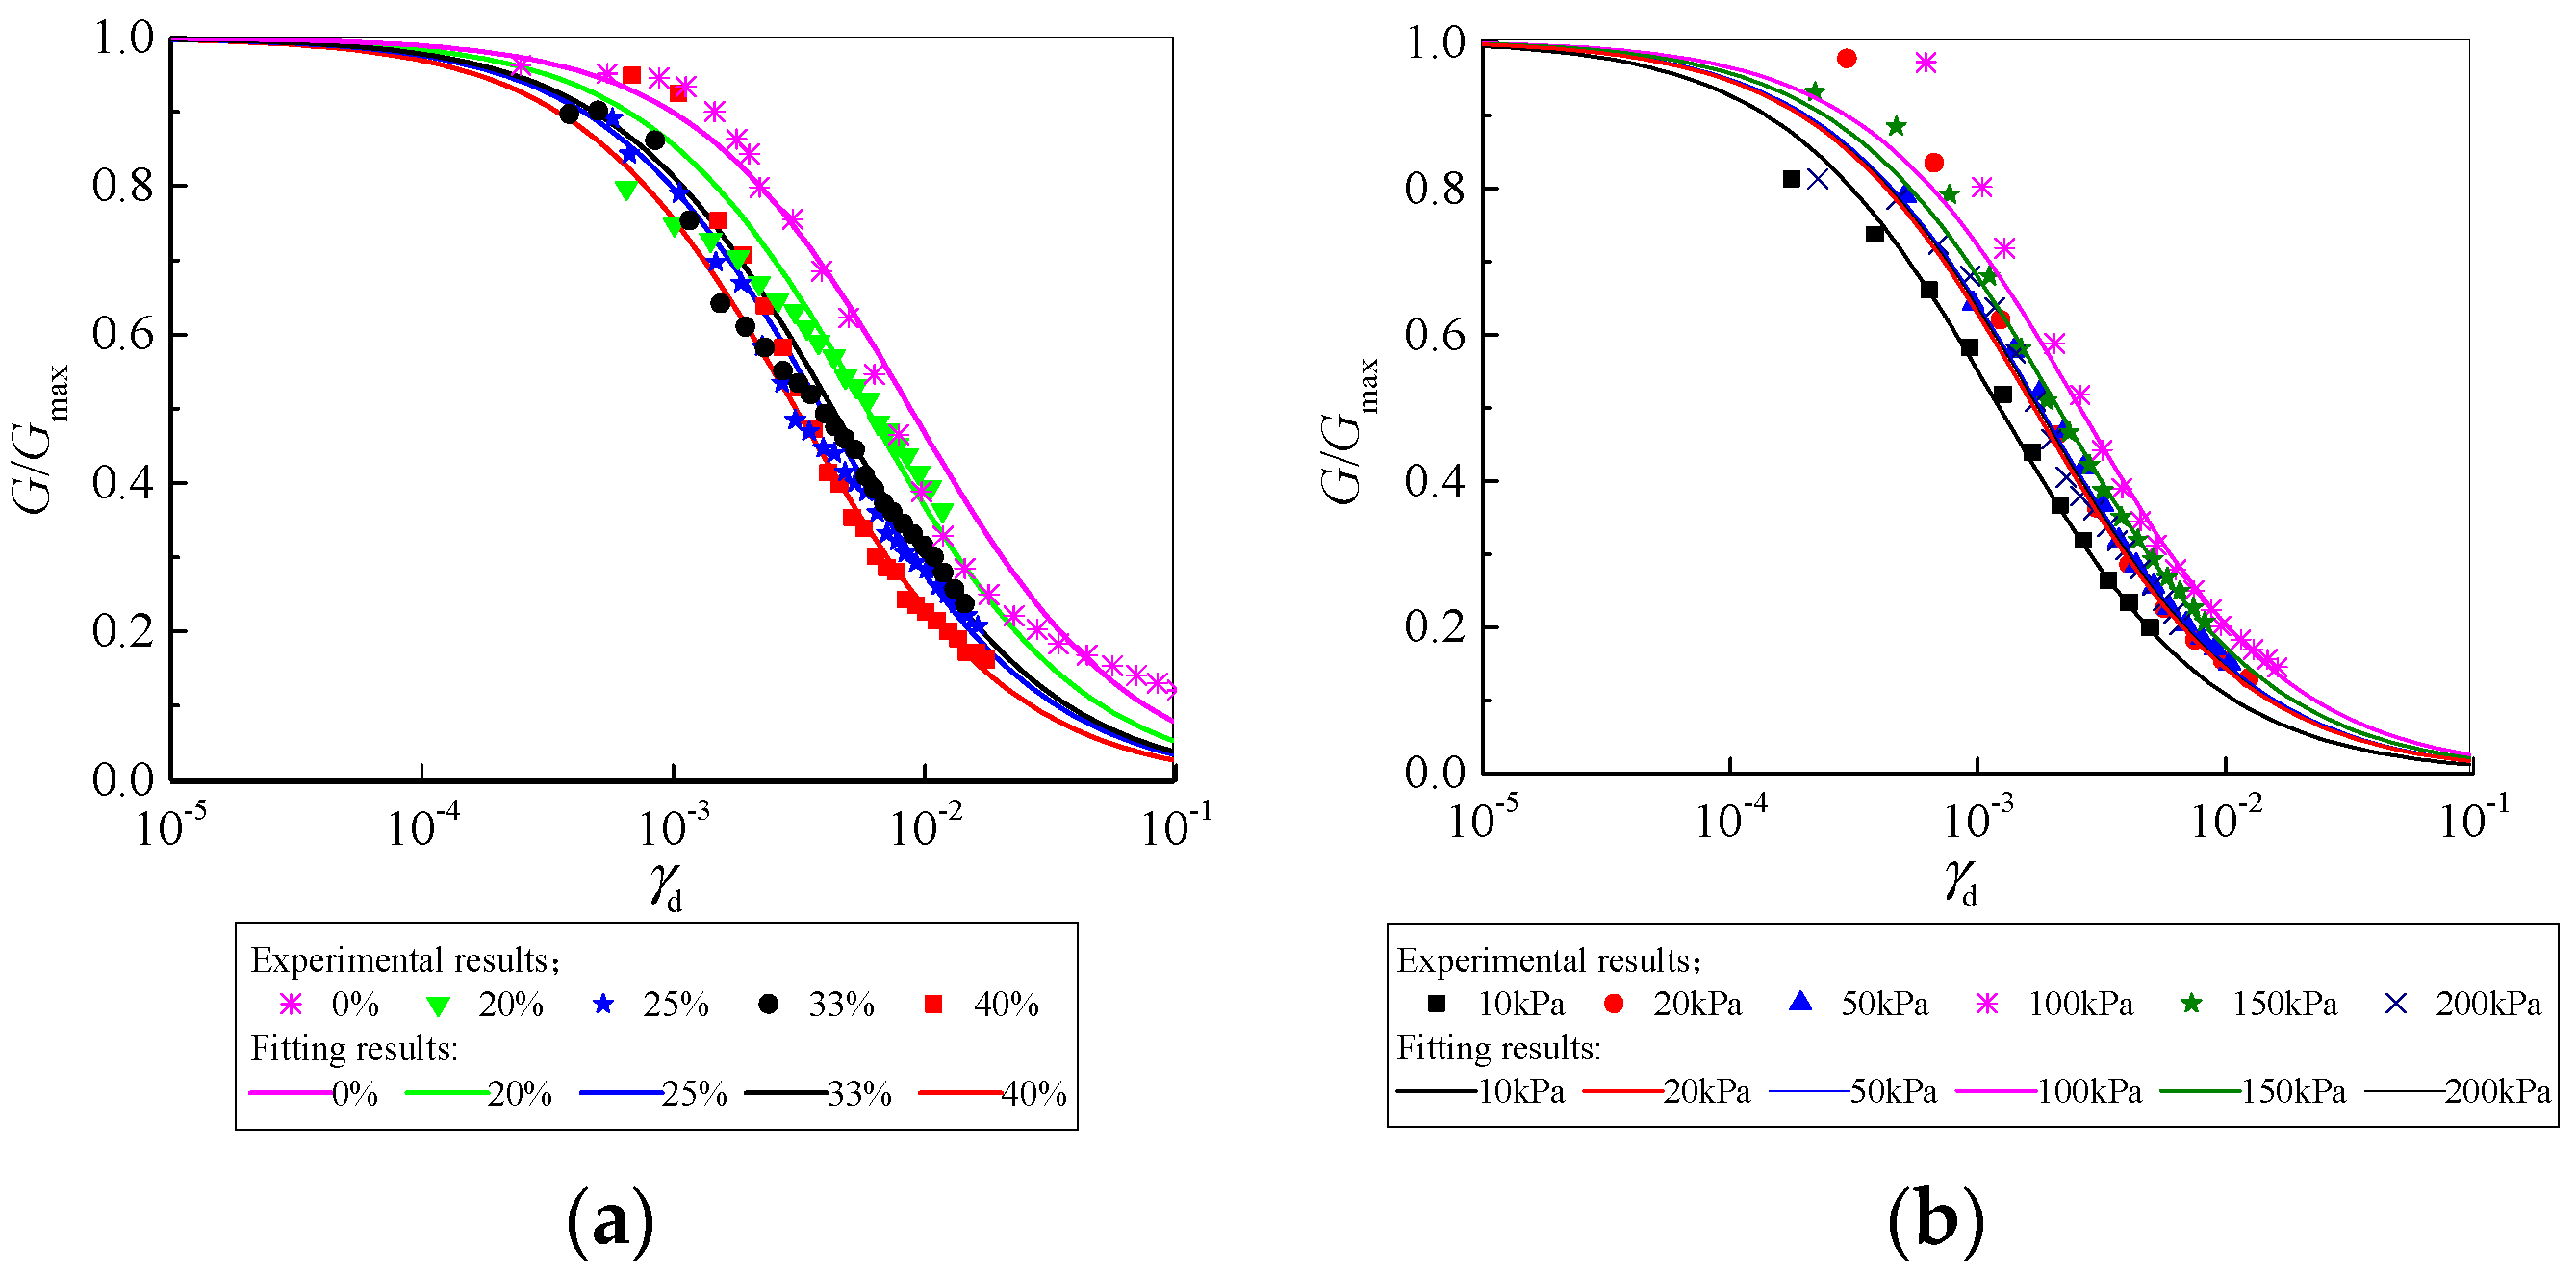
4.2. Normalized Shear Modulus
Figure 10 represents the effect of sawdust content and confining pressure on the
G/
Gmax-log
γ of the mixture. In the figure, the makers are the experimental data and the lines are associated with the fitting curves in the same color.
Figure 10a indicates that the
G/
Gmax values were reduced as the sawdust content increased and the
G/
Gmax values of the sand-sawdust mixture were significantly smaller than that of pure sand. However, at the same shear strain amplitude, as indicated by
Figure 10b, when the confining pressure was no greater than 100 kPa, the
G/
Gmax increased with the increase in the confining pressure. However, this trend was reversed when the confining pressure was greater than 100 kPa. The
G/
Gmax values were smaller for a confining pressure of 200 kPa when compared to 150 kPa at any shear strain amplitude level. The phenomenon was caused by the different changing speeds for
G and
Gmax with confining pressures.
4.3. Maximum Damping Ratio
According to the Hardin–Drnevich model [
19], the relationship between damping ratio
λ and shear strain amplitude
can be expressed as:
where
λmax is the maximum damping ratio and
α is a constant.
Equation (5) can also be expressed as
On the logarithmic coordinate, Equation (6) can be expressed as
When Gd = 0, the inverse of the y-intercept is λmax. The slope of the line is α.
According to Equation (5), the damping ratio varying with dynamic shear strain in
Figure 7b was fitted, and the maximum damping ratio
λmax and damping ratio parameter
α values are listed in
Table 6. Note that the increase in sawdust content led to a decrease of
α values and
λmax values. This represents that the maximum damping ratio
λmax decreased as the sawdust content increased.
According to Equation (5), the damping ratio varying with dynamic shear strain in
Figure 8b was also fitted, and the maximum damping ratio
λmax and damping ratio parameter
α values are listed in
Table 7. One can see from
Table 7 that the
α values increased with the increase in the confining pressure, but the maximum damping ratios fluctuated closely around 0.18 with the increase in confining pressure, which further indicated that the confining pressure had little influence on the maximum damping ratio.
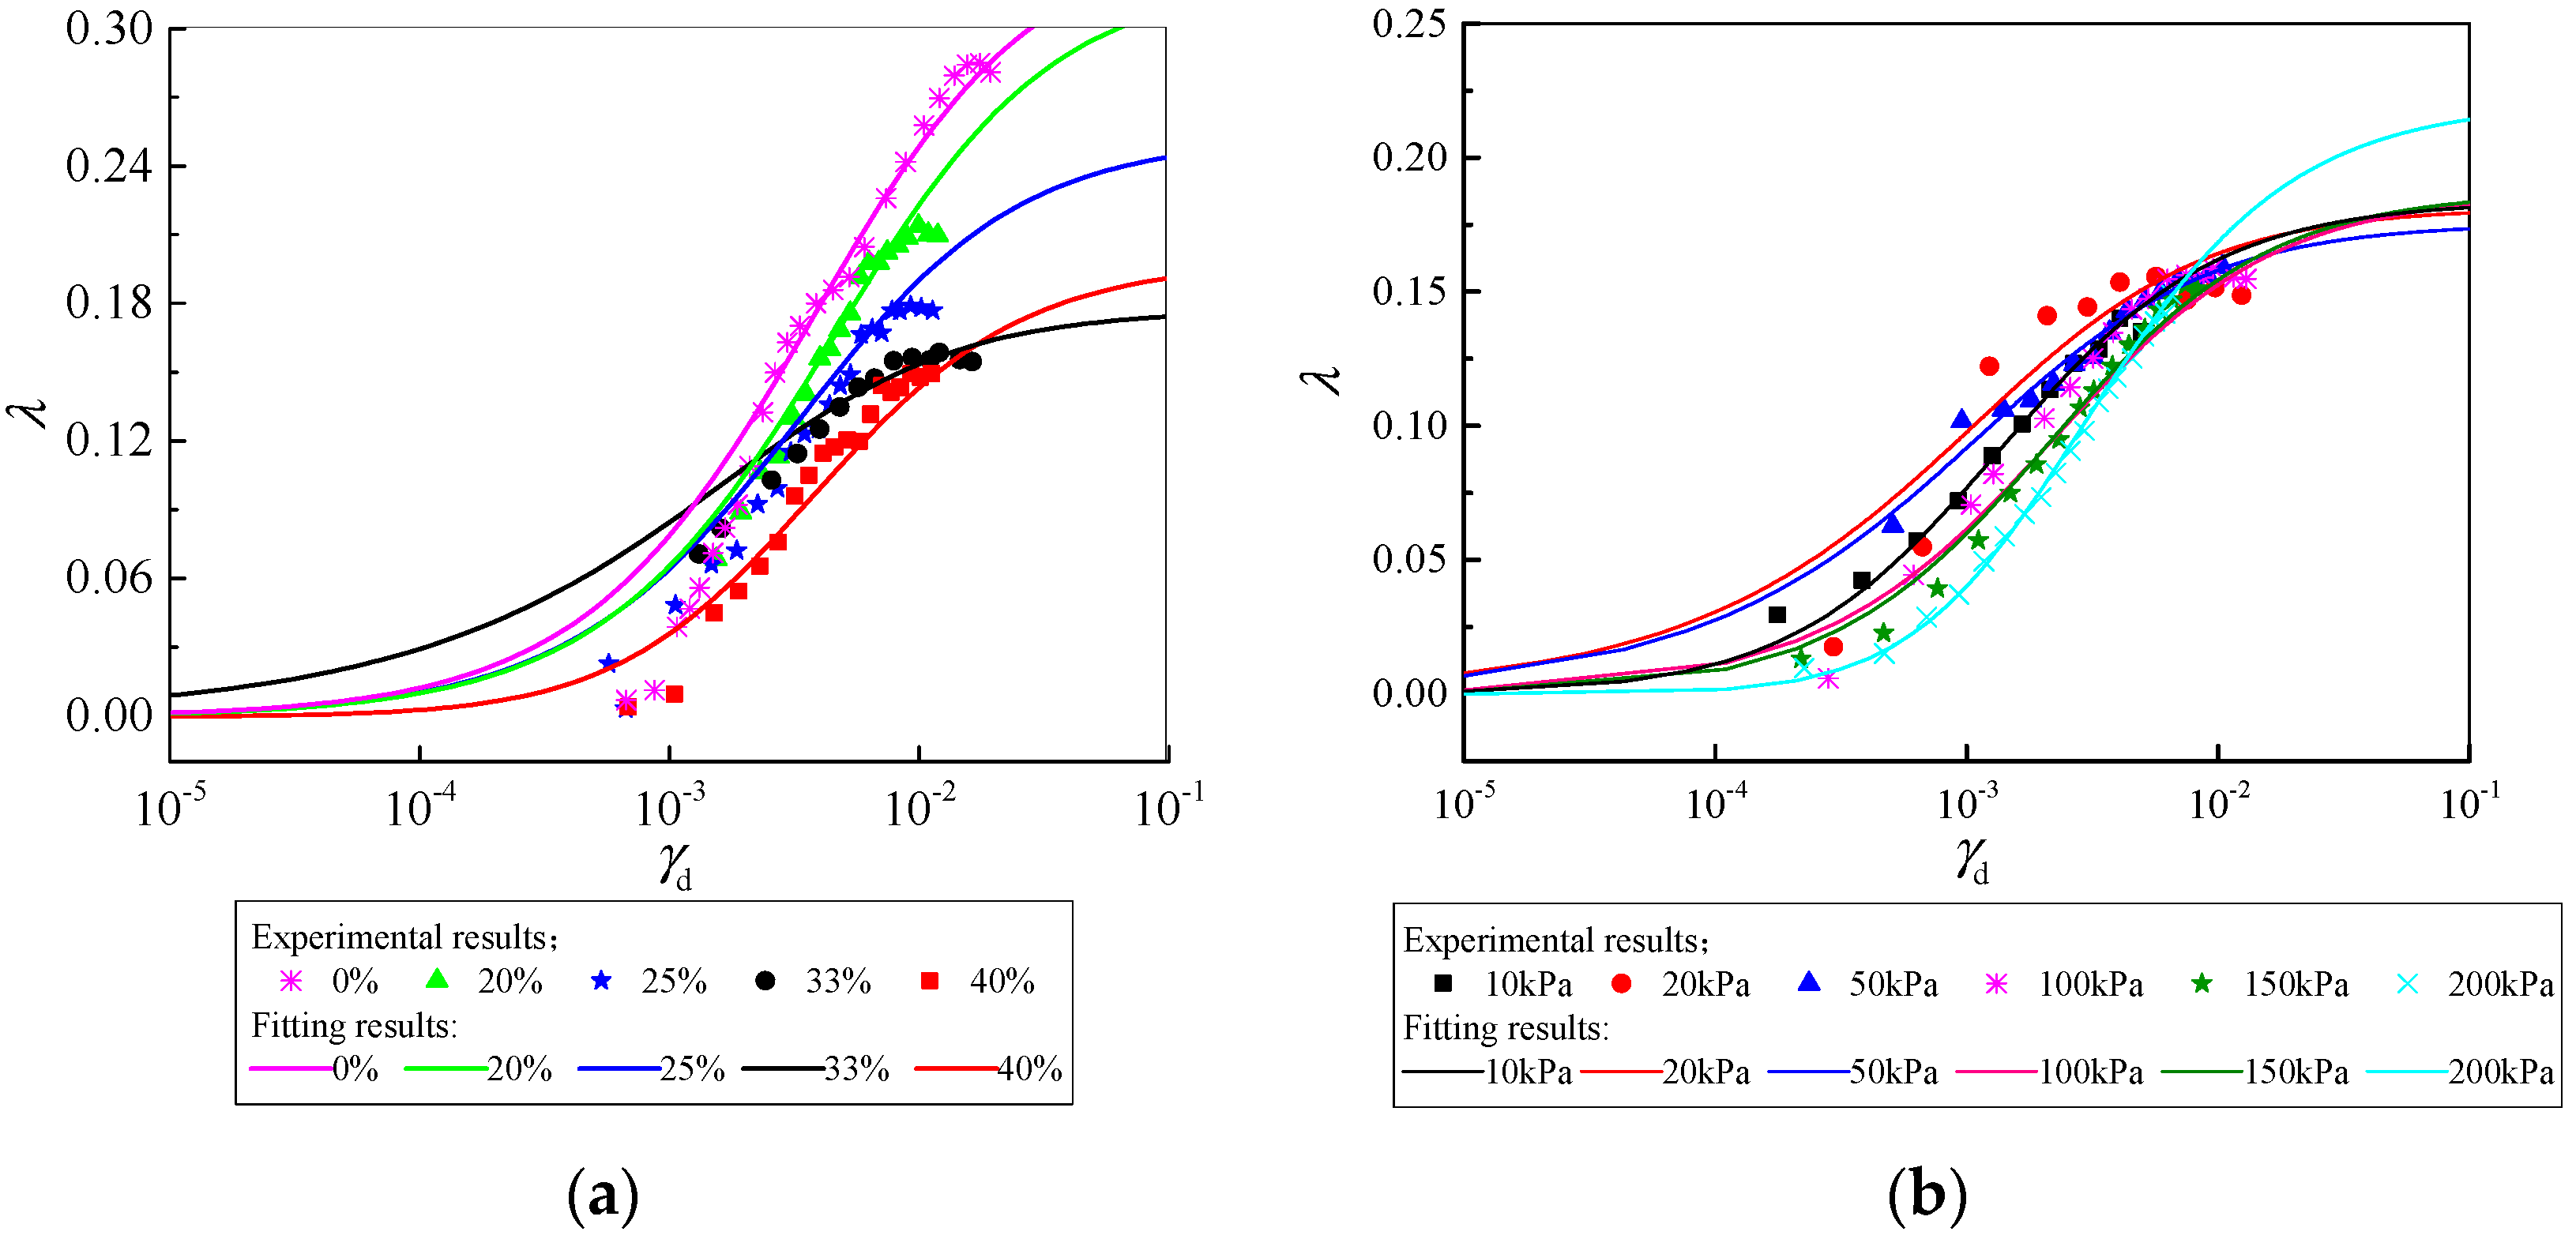
4.4. Normalized Damping Ratio
Figure 11 represents the effect of sawdust content and confining pressure on the
λ-log
of the mixture. In the figure, the makers are the experimental data and lines are associated with the fitting curves in the same color.
Figure 11a indicates that the sawdust content had a remarkable effect on the
λ-log
curves in the shear strain range of
> 5 × 10
−3. At the same shear strain amplitude, the damping ratio decreased as the sawdust inclusion increased. This phenomenon can be explained in a way that, when a higher percentage of sawdust is used, the mixture has more elastic deformation at the given confining pressures. Therefore, the
λ values decayed as the sawdust percentage increased.
Figure 11b shows that in the shear strain range of 10
−4 to 10
−2, with an increase in confining pressure at the same shear strain amplitude, the
λ values decreased for the confining pressures of 20, 50, 100, 150, and 200 kPa. It can also be observed that for
> 20 kPa, with the increase of
, the
λ values grew faster as the shear strain amplitude increased. For
σ3 > 20 kPa, the increase in the confining pressure caused the mixture to be compressed, and due to the elasticity of sawdust, the plastic strain decreased and caused the damping ratio to decrease.
5. Summary
In this paper, the dynamic properties of a sand-sawdust mixture and the effect of factors (sawdust content, confining pressure) were investigated by a series of dynamic triaxial tests. Based on the test results, the following conclusions were obtained:
(1) The shape of the hysteresis loops changed from a symmetrical willow-leaf to an asymmetrical sharp-leaf with the increase in the shear strain.
(2) Shear modulus, Gmax, and the values of G/Gmax decreased with an increase in sawdust inclusion for a given confining pressure. Shear modulus, Gmax, and the value of G/Gmax increased with an increase in the confining pressure for a given percentage of sawdust.
(3) Damping ratio and λmax decreased with an increase in sawdust inclusion for a given confining pressure. The damping ratio slightly increased in the shear strain range of 10−3 to 7 × 10⁻³, while the value of λmax fluctuated as the confining pressure increased for a given percentage of sawdust.
(4) The G/Gmax-log and λ-log relationships matched the Hardin–Drnevich model curve, and Gmax and λmax under various sawdust contents and confining pressures were fitted with the Hardin–Drnevich model curve, which can provide a reference for experimental research.
(5) Sawdust is a degradable material. For short-term experimental research, its degradation property has little effect, but for long-term projects, like using as concrete additives or filling materials, further study on the properties of sawdust is necessary.
Author Contributions
Methodology, D.P.; Formal analysis, D.P. and X.L. Writing—original draft preparation, X.L.; Writing—review and editing, P.L.; Funding acquisition, Q.C.
Funding
This study was supported by the Open Foundation of the State Key Laboratory for Disaster Reduction in Civil Engineering (SLDRCE15-01). The authors would also like to thank the support from the State Administration of Foreign Experts Affairs, P. R. China, through the Foreign Experts Inviting Scheme (T2018021).
Acknowledgments
The authors are very grateful for the support of the fund.
Conflicts of Interest
The authors declare no conflicts of interest.
References
- Ma, F.P.; Li, Z.K.; Luo, G.F. NIOS model material and its use in geo-mechanical similarity model test. J. Hydroelectric Eng. 2004, 33, 48–51. (In Chinese) [Google Scholar]
- Zhang, Q.Y.; Li, S.C.; Guo, X.H. Research and development of new typed cementitious geotechnical similar material for ironcrystal sand and its application. Rock Soil Mech. 2008, 29, 2126–2130. (In Chinese) [Google Scholar]
- Li, H.W.; Senetakis, K. Modulus reduction and damping increase of two sands reinforced with polypropylene fibers. Geotext. Geomembr. 2010, 28, 238–250. [Google Scholar] [CrossRef]
- Diambra, A.; Ibraim, E.; Muir Wood, D.; Russell, A.R. Fibre reinforced sands: Experiments and modelling. Geotext. Geomembr. 2010, 28, 238–250. [Google Scholar] [CrossRef]
- Li, H.; Senetakis, K. Dynamic properties of polypropylene fibre-reinforced silica quarry sand. Soil Dyn. Earthq. Eng. 2017, 100, 224–232. [Google Scholar] [CrossRef]
- Miranda, L.F.; Baudet, B.A. The effect of the particle size distribution on the mechanics of fibre-reinforced sands under one-dimensional compression. Geotext. Geomembr. 2015, 43, 250–258. [Google Scholar] [CrossRef]
- Nakhaei, A.; Marandi, S.M.; Kermani, S.S. Dynamic properties of granular soils mixed with granulated rubber. Soil Dyn. Earthq. Eng. 2012, 43, 124–132. [Google Scholar] [CrossRef]
- Senetakis, K.; Anastasiadis, A.; Pitilakis, K. Dynamic properties of dry sand/rubber(SRM) and gravel/rubber(GRM) mixtures in a wide range of shearing strain amplitudes. Soil Dyn. Earthq. Eng. 2012, 33, 38–53. [Google Scholar] [CrossRef]
- Anastasiadis, A.; Senetakis, K.; Pitilakis, K. Dynamic behavior of sand/rubber mixtures, Part I: Effect of rubber content and duration of confinement on small-strain shear modulus and damping ratio. J. ASTM Int. 2012, 9, 103680. [Google Scholar] [CrossRef]
- Senetakis, K.; Anastasiadis, A.; Pitilakis, K. Dynamic behavior of sand/rubber mixtures, Part II: Effect of rubber content on G/G0-γ-DT curves and volumetric threshold train. J. ASTM Int. 2012, 9, 103711. [Google Scholar] [CrossRef]
- Akinwumi, I.I.; Ojuri, O.O.; Edem, D. Sawdust stabilization of lateritic clay as a landfill Liner to retain heavy metals. In Proceedings of the Geo-Chicago 2016, Chicago, IL, USA, 14–18 August 2016; pp. 478–487. [Google Scholar]
- Udoeyo, F.F.; Dashibil, P.U. Sawdust ash as concrete material. J. Mater. Civ. Eng. 2002, 14, 173–176. [Google Scholar] [CrossRef]
- Udoeyo, F.F.; Inyang, H.; Young, D.T.; Oparadu, E.E. Potential of wood waste ash as an additive in concrete. J. Mater. Civ. Eng. 2006, 18, 605–611. [Google Scholar] [CrossRef]
- Joseph, E.E.; Isaac, O.A.; Audu, T. Evaluation of sawdust ash–stabilized lateritic soil as highway pavement material. J. Mater. Civ. Eng. 2014, 26, 367–373. [Google Scholar]
- Ahmed, W.; Khushnood, R.A.; Memon, S.A. Effective use of sawdust for the production of eco-friendly and thermal-energy efficient normal weight and lightweight concretes with tailored fracture properties. J. Clean. Prod. 2018, 184, 1016–1027. [Google Scholar] [CrossRef]
- Li, R.S.; Chen, L.W.; Yuan, X.M. Experimental study on influences of different loading frequencies on dynamic modulus and damping ratio. Chin. J. Geotech. Eng. 2017, 39, 71–80. (In Chinese) [Google Scholar]
- Aggour, M.; Zhang, J. Modulus and damping equations of sands subjected to combined dynamic loadings. Int. J. Geotech. Eng. 2008, 2, 369–380. [Google Scholar] [CrossRef]
- Hashash, Y.M.A.; Park, D. Non-linear one-dimensional seismic ground motion propagation in the Mississippi embayment. Eng. Geol. 2001, 62, 185–206. [Google Scholar] [CrossRef]
- Hardin, B.O.; Drnevich, V.P. Shear modulus and damping in soil: Measurement and parameter effects. J. Soil Mech. Found. Eng. Div. 1972, 98, 603–624. [Google Scholar]
- Qi, J.F.; Luan, M.T.; Yang, Q. Dynamic shear modulus and damping ratio of saturated clay. Chin. J. Geotech. Eng. 2008, 30, 518–523. (In Chinese) [Google Scholar]
- Wichtmann, T.; Triantafyllidis, T. Influence of a cyclic and dynamic loading history on dynamic properties of dry sand, part I: Cyclic and dynamic torsional prestraining. Soil Dyn. Earthq. Eng. 2004, 24, 127–147. [Google Scholar] [CrossRef]
- Wichtmann, T.; Triantafyllidis, T. Influence of a cyclic and dynamic loading history on dynamic properties of dry sand, part II: Cyclic axial preloading. Soil Dyn. Earthq. Eng. 2004, 24, 789–803. [Google Scholar] [CrossRef]
- Shang, S.P.; Liu, F.C.; Lu, H.X. Design and experimental study of a model soil used for shaking table test. Earthq. Eng. Eng. Vib. 2006, 26, 199–204. (In Chinese) [Google Scholar]
- Chen, H.J.; Li, X.J.; Mei, Z.H. Shaking table test of immersed tunnel considering the geological condition. Eng. Geol. 2017, 227, 93–107. (In Chinese) [Google Scholar] [CrossRef]
- Yan, X.; Yuan, J.Y.; Yuan, Y. Study on model soil of large-scale shaking table test. Struct. Eng. 2015, 31, 116–120. (In Chinese) [Google Scholar]
- Su, L.M.; Xie, W. Experimental studies on super long-span cable-stayed bridge by using multiple shake table testing. Eng. Mech. 2016, 33, 38–48. (In Chinese) [Google Scholar]
- Lou, M.L.; Zong, G.; Niu, W.X. Shaking table model test of soil pile steel structure interaction system. Earthq. Eng. Eng. Vib. 2006, 26, 226–230. (In Chinese) [Google Scholar]
- Chen, H.J.; Li, X.J.; Mei, Z.H. Dynamic performance analysis of sawdust mixed clay site model in Shaking table model test. In Proceedings of the International Conference on Geotechnical and Earthquake Engineering, Chongqing, China, 20–21 October 2018. [Google Scholar]
- Chen, Z.Y.; Chen, W.; Li, Y.Y. Shaking table test of a multi-story subway station under pulse-like ground motions. Soil Dyn. Earthq. Eng. 2016, 82, 111–122. [Google Scholar] [CrossRef]
- Xu, B.W. Shaking Table Test Studying Large-Scale Soil-Pile-Complex Structure Interaction. Ph.D. Thesis, Tianjin University, Tianjin, China, 2009. (In Chinese). [Google Scholar]
- SL 237-1999. Specification of Soil Test; China Planning Press: Beijing, China, 1999. (In Chinese) [Google Scholar]
- GB/T 50123-2019. Standard for Soil Test Method; China Planning Press: Beijing, China, 2019. (In Chinese) [Google Scholar]
- Janbu, N. Soil compressibility as determined by oedometer and triaxial tests. In Proceedings of the European Conference on Soil Mechanics & Foundation Engineering, Wiesbaden, Germany, 15–18 October 1963; pp. 19–25. [Google Scholar]
Figure 1.
The dynamic triaxial testing apparatus. (a) The glass cover of the triaxial apparatus. (b) The base portion of the triaxial apparatus.
Figure 1.
The dynamic triaxial testing apparatus. (a) The glass cover of the triaxial apparatus. (b) The base portion of the triaxial apparatus.
Figure 2.
The metal mold for the construction of the specimens.
Figure 2.
The metal mold for the construction of the specimens.
Figure 3.
Typical loading curves.
Figure 3.
Typical loading curves.
Figure 4.
The stress–strain curves. (a) For all cycles and all loadings. (b) The cycles for the eleventh loading stage.
Figure 4.
The stress–strain curves. (a) For all cycles and all loadings. (b) The cycles for the eleventh loading stage.
Figure 5.
Stress–strain hysteresis loops. (a) The fifth cycle of the first 10 loading stages. (b) The fifth cycle of 11 to 21 loading stages.
Figure 5.
Stress–strain hysteresis loops. (a) The fifth cycle of the first 10 loading stages. (b) The fifth cycle of 11 to 21 loading stages.
Figure 6.
Example of a damaged sample.
Figure 6.
Example of a damaged sample.
Figure 7.
Shear modulus and damping ratio versus shear strain amplitude for the sand-sawdust mixture with various sawdust contents with the confining pressure of 100 kPa. (a) Shear modulus versus shear strain amplitude; (b) damping ratio versus shear strain amplitude.
Figure 7.
Shear modulus and damping ratio versus shear strain amplitude for the sand-sawdust mixture with various sawdust contents with the confining pressure of 100 kPa. (a) Shear modulus versus shear strain amplitude; (b) damping ratio versus shear strain amplitude.
Figure 8.
Shear modulus and damping ratio versus shear strain amplitude for the various confining pressure with a sawdust content of 33%. (a) Shear modulus versus shear strain amplitude; (b) damping ratio versus shear strain amplitude.
Figure 8.
Shear modulus and damping ratio versus shear strain amplitude for the various confining pressure with a sawdust content of 33%. (a) Shear modulus versus shear strain amplitude; (b) damping ratio versus shear strain amplitude.
Figure 9.
Maximum shear modulus versus confining pressures.
Figure 9.
Maximum shear modulus versus confining pressures.
Figure 10.
Shear modulus ratio Gd/Gmax versus shear strain amplitude for various sawdust contents and confining pressures. (a) Shear modulus ratio Gd/Gmax versus shear strain amplitude for the various sawdust contents; (b) Shear modulus ratio Gd/Gmax versus shear strain amplitude for the various confining pressures.
Figure 11.
Damping ratio versus the shear strain amplitude for various sawdust contents and confining pressures. (a) Damping ratio versus shear strain amplitude for the various sawdust content. (b) Damping ratio versus shear strain amplitude the various confining pressure.
Figure 11.
Damping ratio versus the shear strain amplitude for various sawdust contents and confining pressures. (a) Damping ratio versus shear strain amplitude for the various sawdust content. (b) Damping ratio versus shear strain amplitude the various confining pressure.
Table 1.
Main performance parameters of the triaxial apparatus.
Table 1.
Main performance parameters of the triaxial apparatus.
| Axial Displacement | Axial Force | Frequency/
Hz | Confining Pressure Range/
MPa |
|---|
| range/mm | precision/mm | range/kN | precision/kN |
|---|
| 100 | 0.07 | 10 | 0.01 | ≤2 Hz | ≤2 |
Table 2.
The properties of the sand-sawdust mixtures.
Table 2.
The properties of the sand-sawdust mixtures.
| Mixture. | Sawdust Content (%) | Water Content (%) | Density (g/cm3) |
|---|
| M1 | 40 | 12.23 | 0.876 |
| M2 | 33 | 12.34 | 0.985 |
| M3 | 25 | 12.38 | 1.110 |
| M4 | 20 | 12.46 | 1.188 |
| M5 | 0 | 12.16 | 1.850 |
Table 3.
Test program for the effect of sawdust content and confining pressure.
Table 3.
Test program for the effect of sawdust content and confining pressure.
| Testing No. | f (Hz) | σ3 (kPa) | Sawdust Content (%) |
|---|
| 1 | 1.0 | 100 | 40 |
| 2 | 33 |
| 3 | 25 |
| 4 | 20 |
| 5 | 0 |
| 6 | 1.0 | 10 | 33 |
| 7 | 20 |
| 8 | 50 |
| 9 | 100 |
| 10 | 150 |
| 11 | 200 |
Table 4.
Fitted maximum shear modulus and reference shear strain for various sawdust contents.
Table 4.
Fitted maximum shear modulus and reference shear strain for various sawdust contents.
| Sawdust Content (%) | Gmax (MPa) | γr | R2 |
|---|
| 40 | 12.547 | 0.00313 | 0.8903 |
| 33 | 13.333 | 0.00330 | 0.8388 |
| 25 | 14.286 | 0.00397 | 0.7996 |
| 20 | 15.576 | 0.00439 | 0.7908 |
| 0 | 25.874 | 0.00622 | 0.8995 |
Table 5.
Fitted maximum shear modulus and reference shear strain for various confining pressures.
Table 5.
Fitted maximum shear modulus and reference shear strain for various confining pressures.
| σ3 (kPa) | Gmax (MPa) | γr | R2 |
|---|
| 10 | 4.4603 | 0.001239 | 0.9892 |
| 20 | 4.6083 | 0.001775 | 0.8963 |
| 50 | 9.4697 | 0.001816 | 0.8799 |
| 100 | 13.333 | 0.002619 | 0.8870 |
| 150 | 18.622 | 0.002136 | 0.7973 |
| 200 | 32.258 | 0.001711 | 0.7599 |
Table 6.
Fitted maximum damping ratio and parameter α for various sawdust contents.
Table 6.
Fitted maximum damping ratio and parameter α for various sawdust contents.
| Sawdust Content (%) | λmax | α | R2 |
|---|
| 40 | 0.17701 | 0.5076 | 0.8894 |
| 33 | 0.19788 | 1.2034 | 0.8762 |
| 25 | 0.25159 | 0.8527 | 0.8901 |
| 20 | 0.32114 | 0.8592 | 0.8899 |
| 0 | 0.36422 | 0.9874 | 0.8102 |
Table 7.
Fitted maximum damping ratio and parameter α for various confining pressures.
Table 7.
Fitted maximum damping ratio and parameter α for various confining pressures.
| σ3 (kPa) | λmax | α | R2 |
|---|
| 10 | 0.1839 | 1.0797 | 0.8959 |
| 20 | 0.1814 | 0.6060 | 0.7919 |
| 50 | 0.1755 | 0.6250 | 0.8197 |
| 100 | 0.1949 | 0.8599 | 0.7499 |
| 150 | 0.1874 | 0.9951 | 0. 7199 |
| 200 | 0.2206 | 1.7013 | 0.9792 |
© 2019 by the authors. Licensee MDPI, Basel, Switzerland. This article is an open access article distributed under the terms and conditions of the Creative Commons Attribution (CC BY) license (http://creativecommons.org/licenses/by/4.0/).


