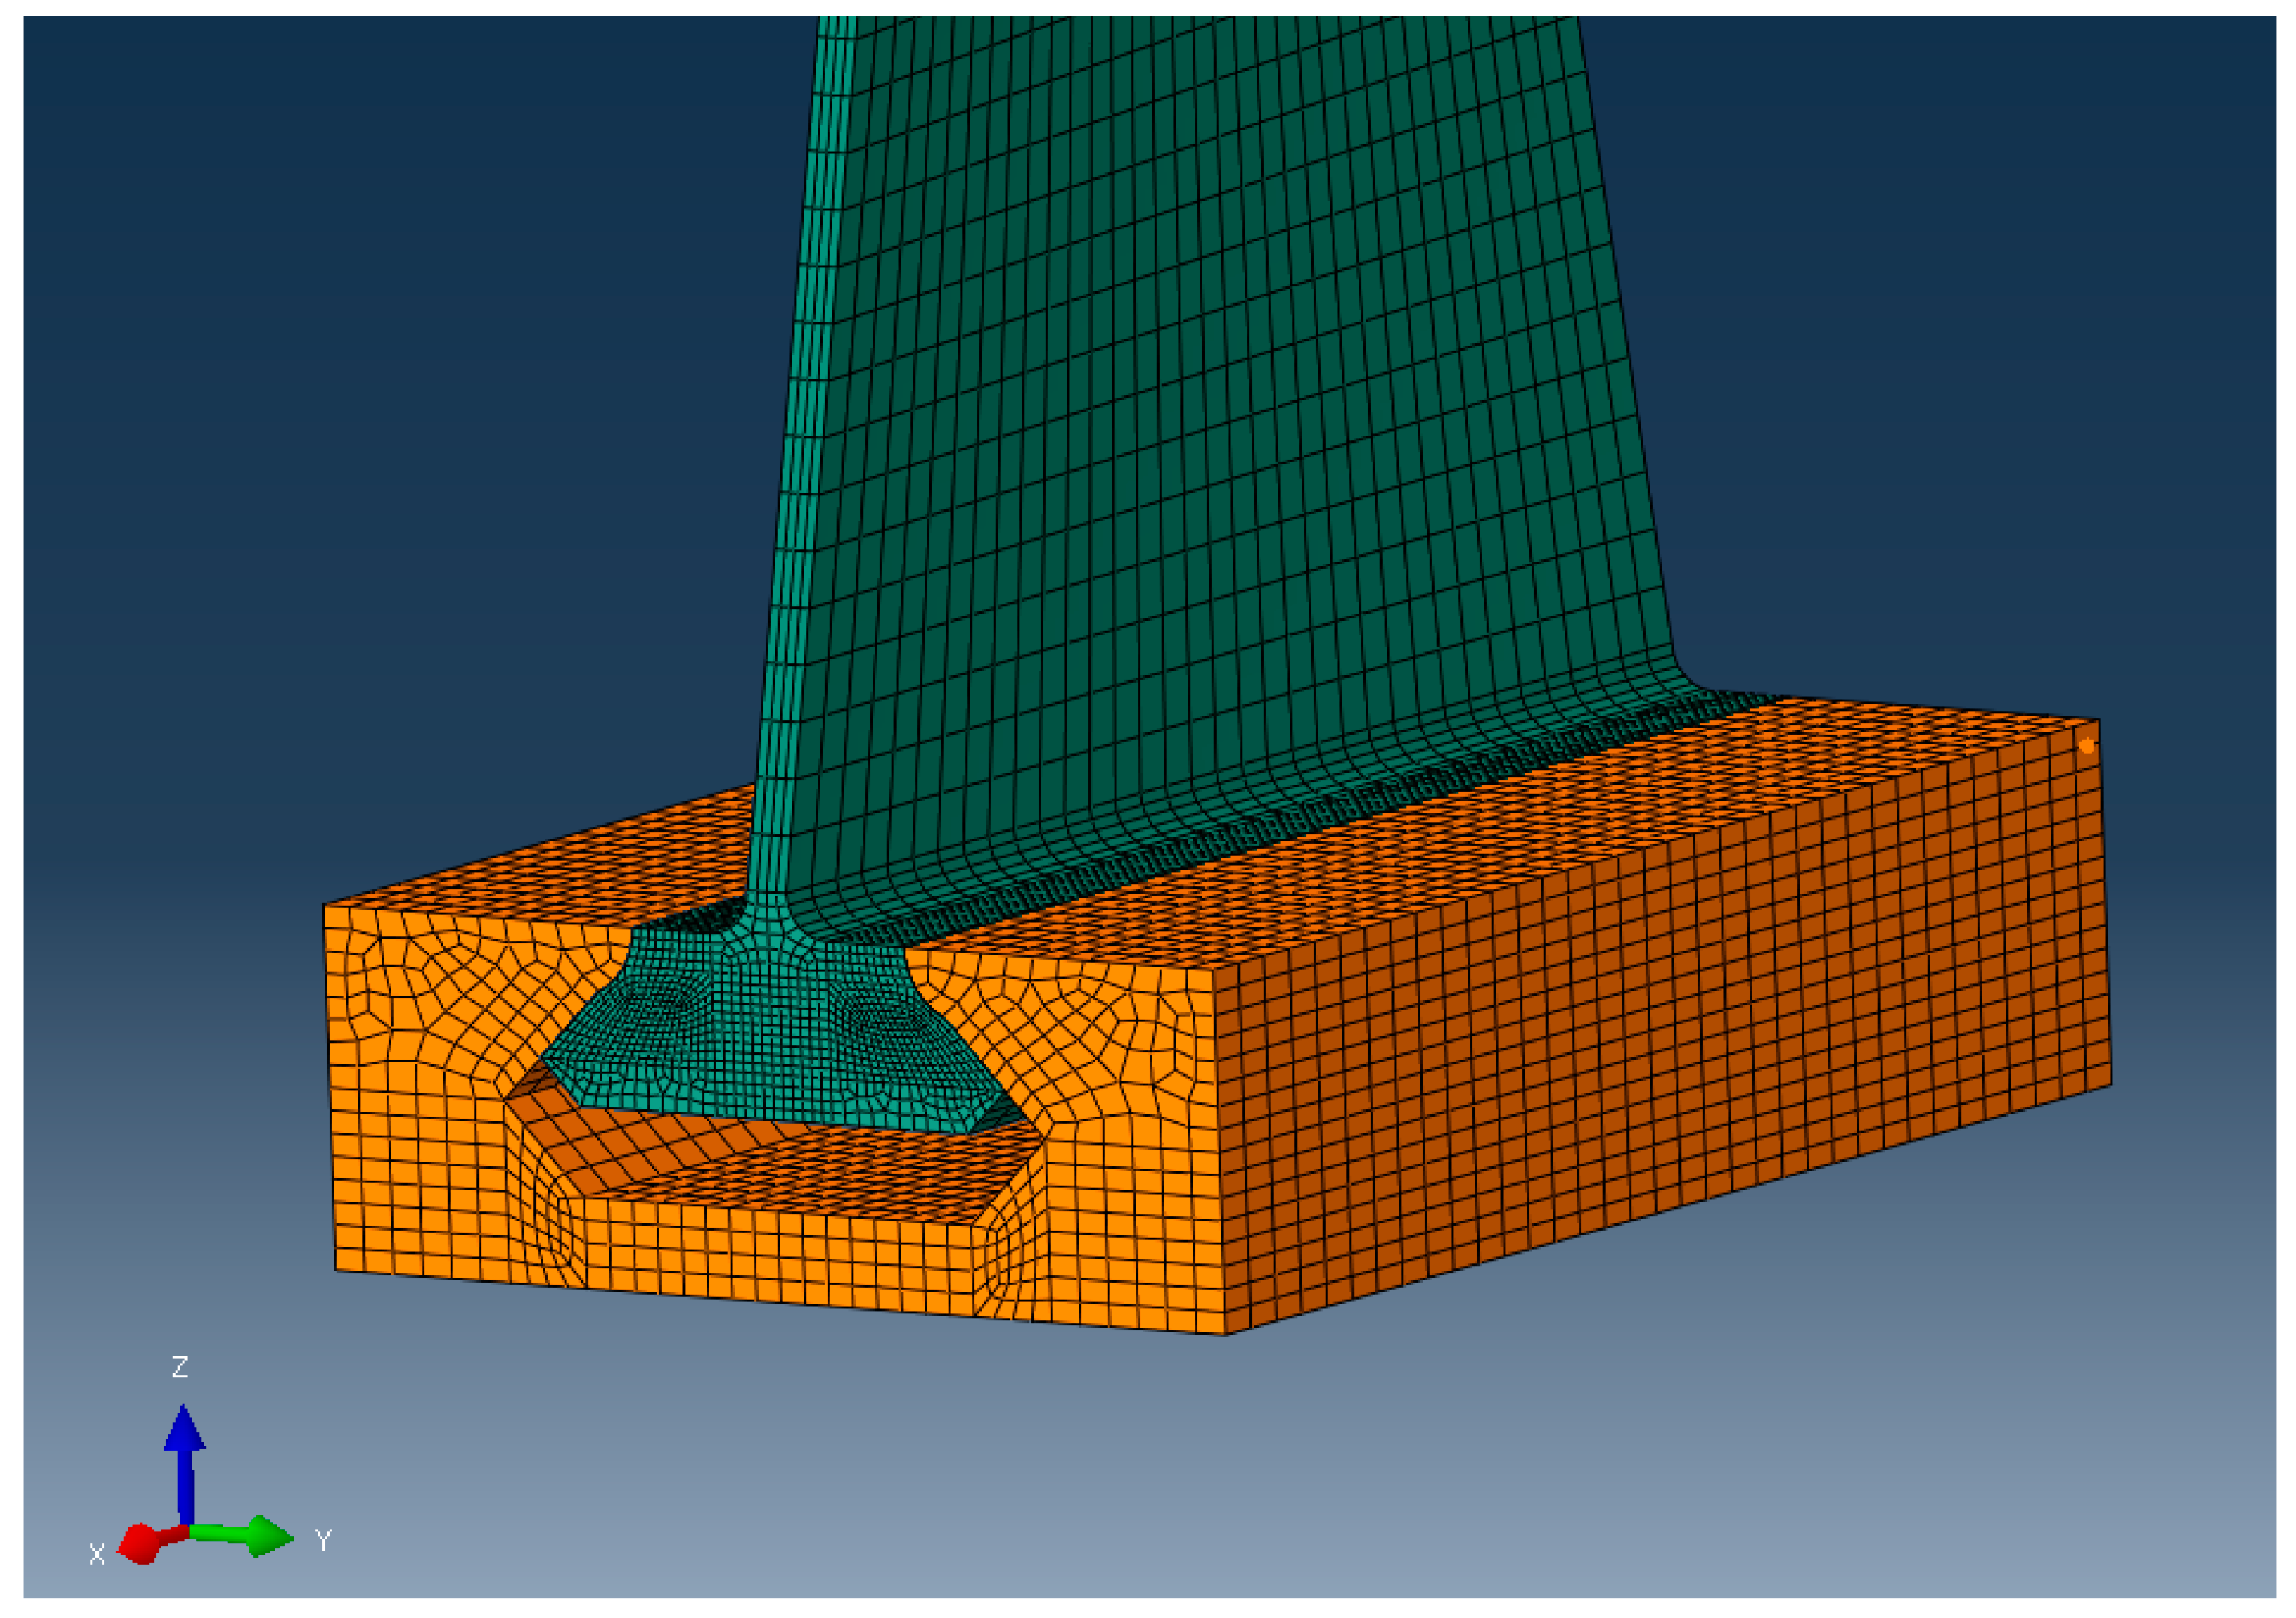
Figure 1.
A dovetail joint between the compressor-blade-like structure and the disc representative geometry.
Figure 1.
A dovetail joint between the compressor-blade-like structure and the disc representative geometry.
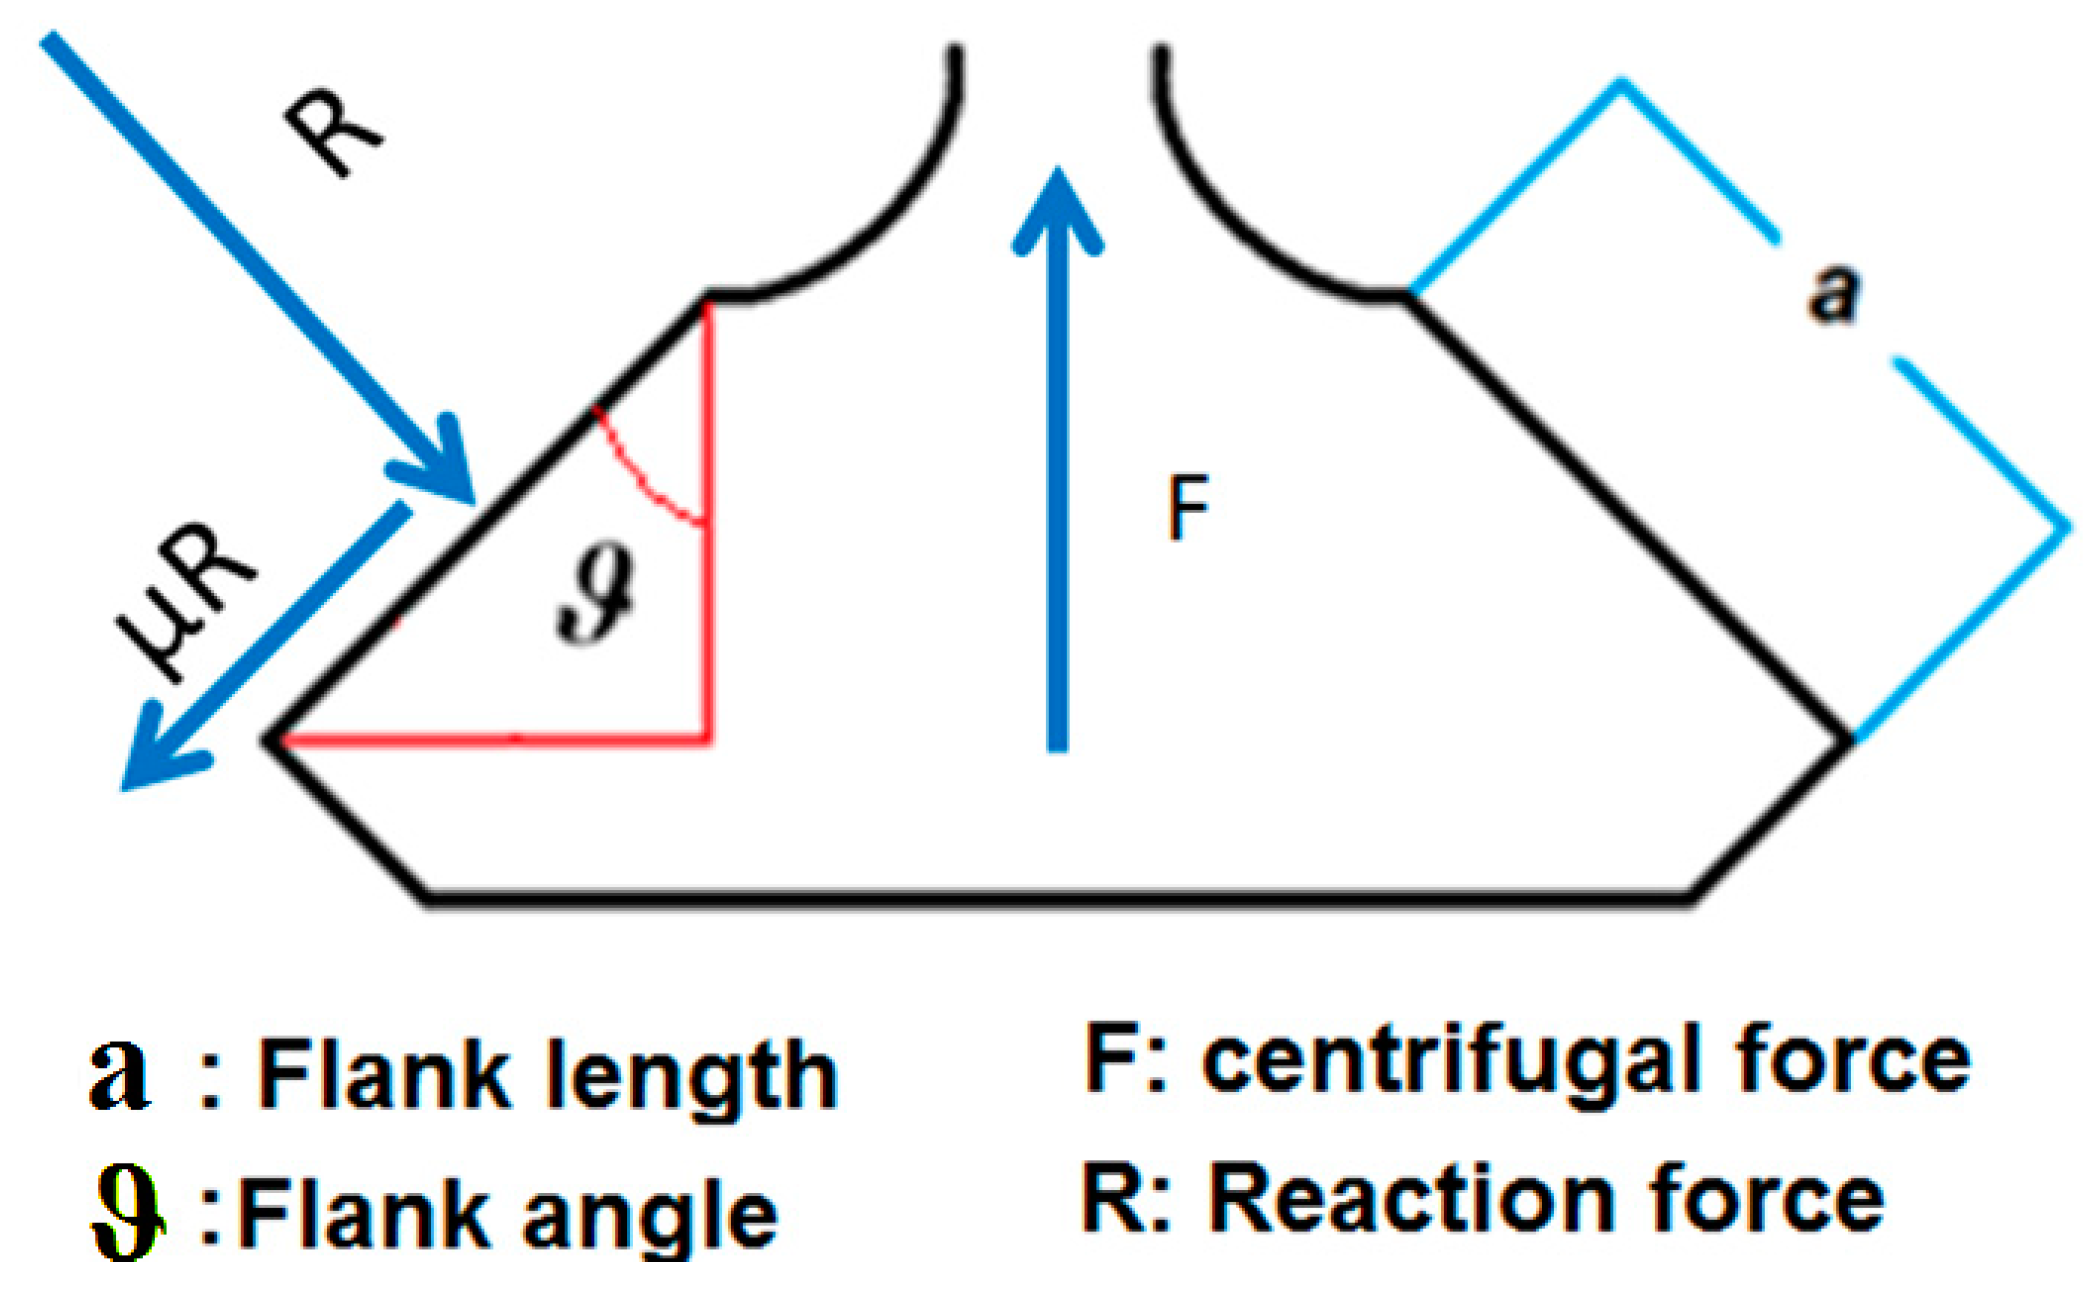
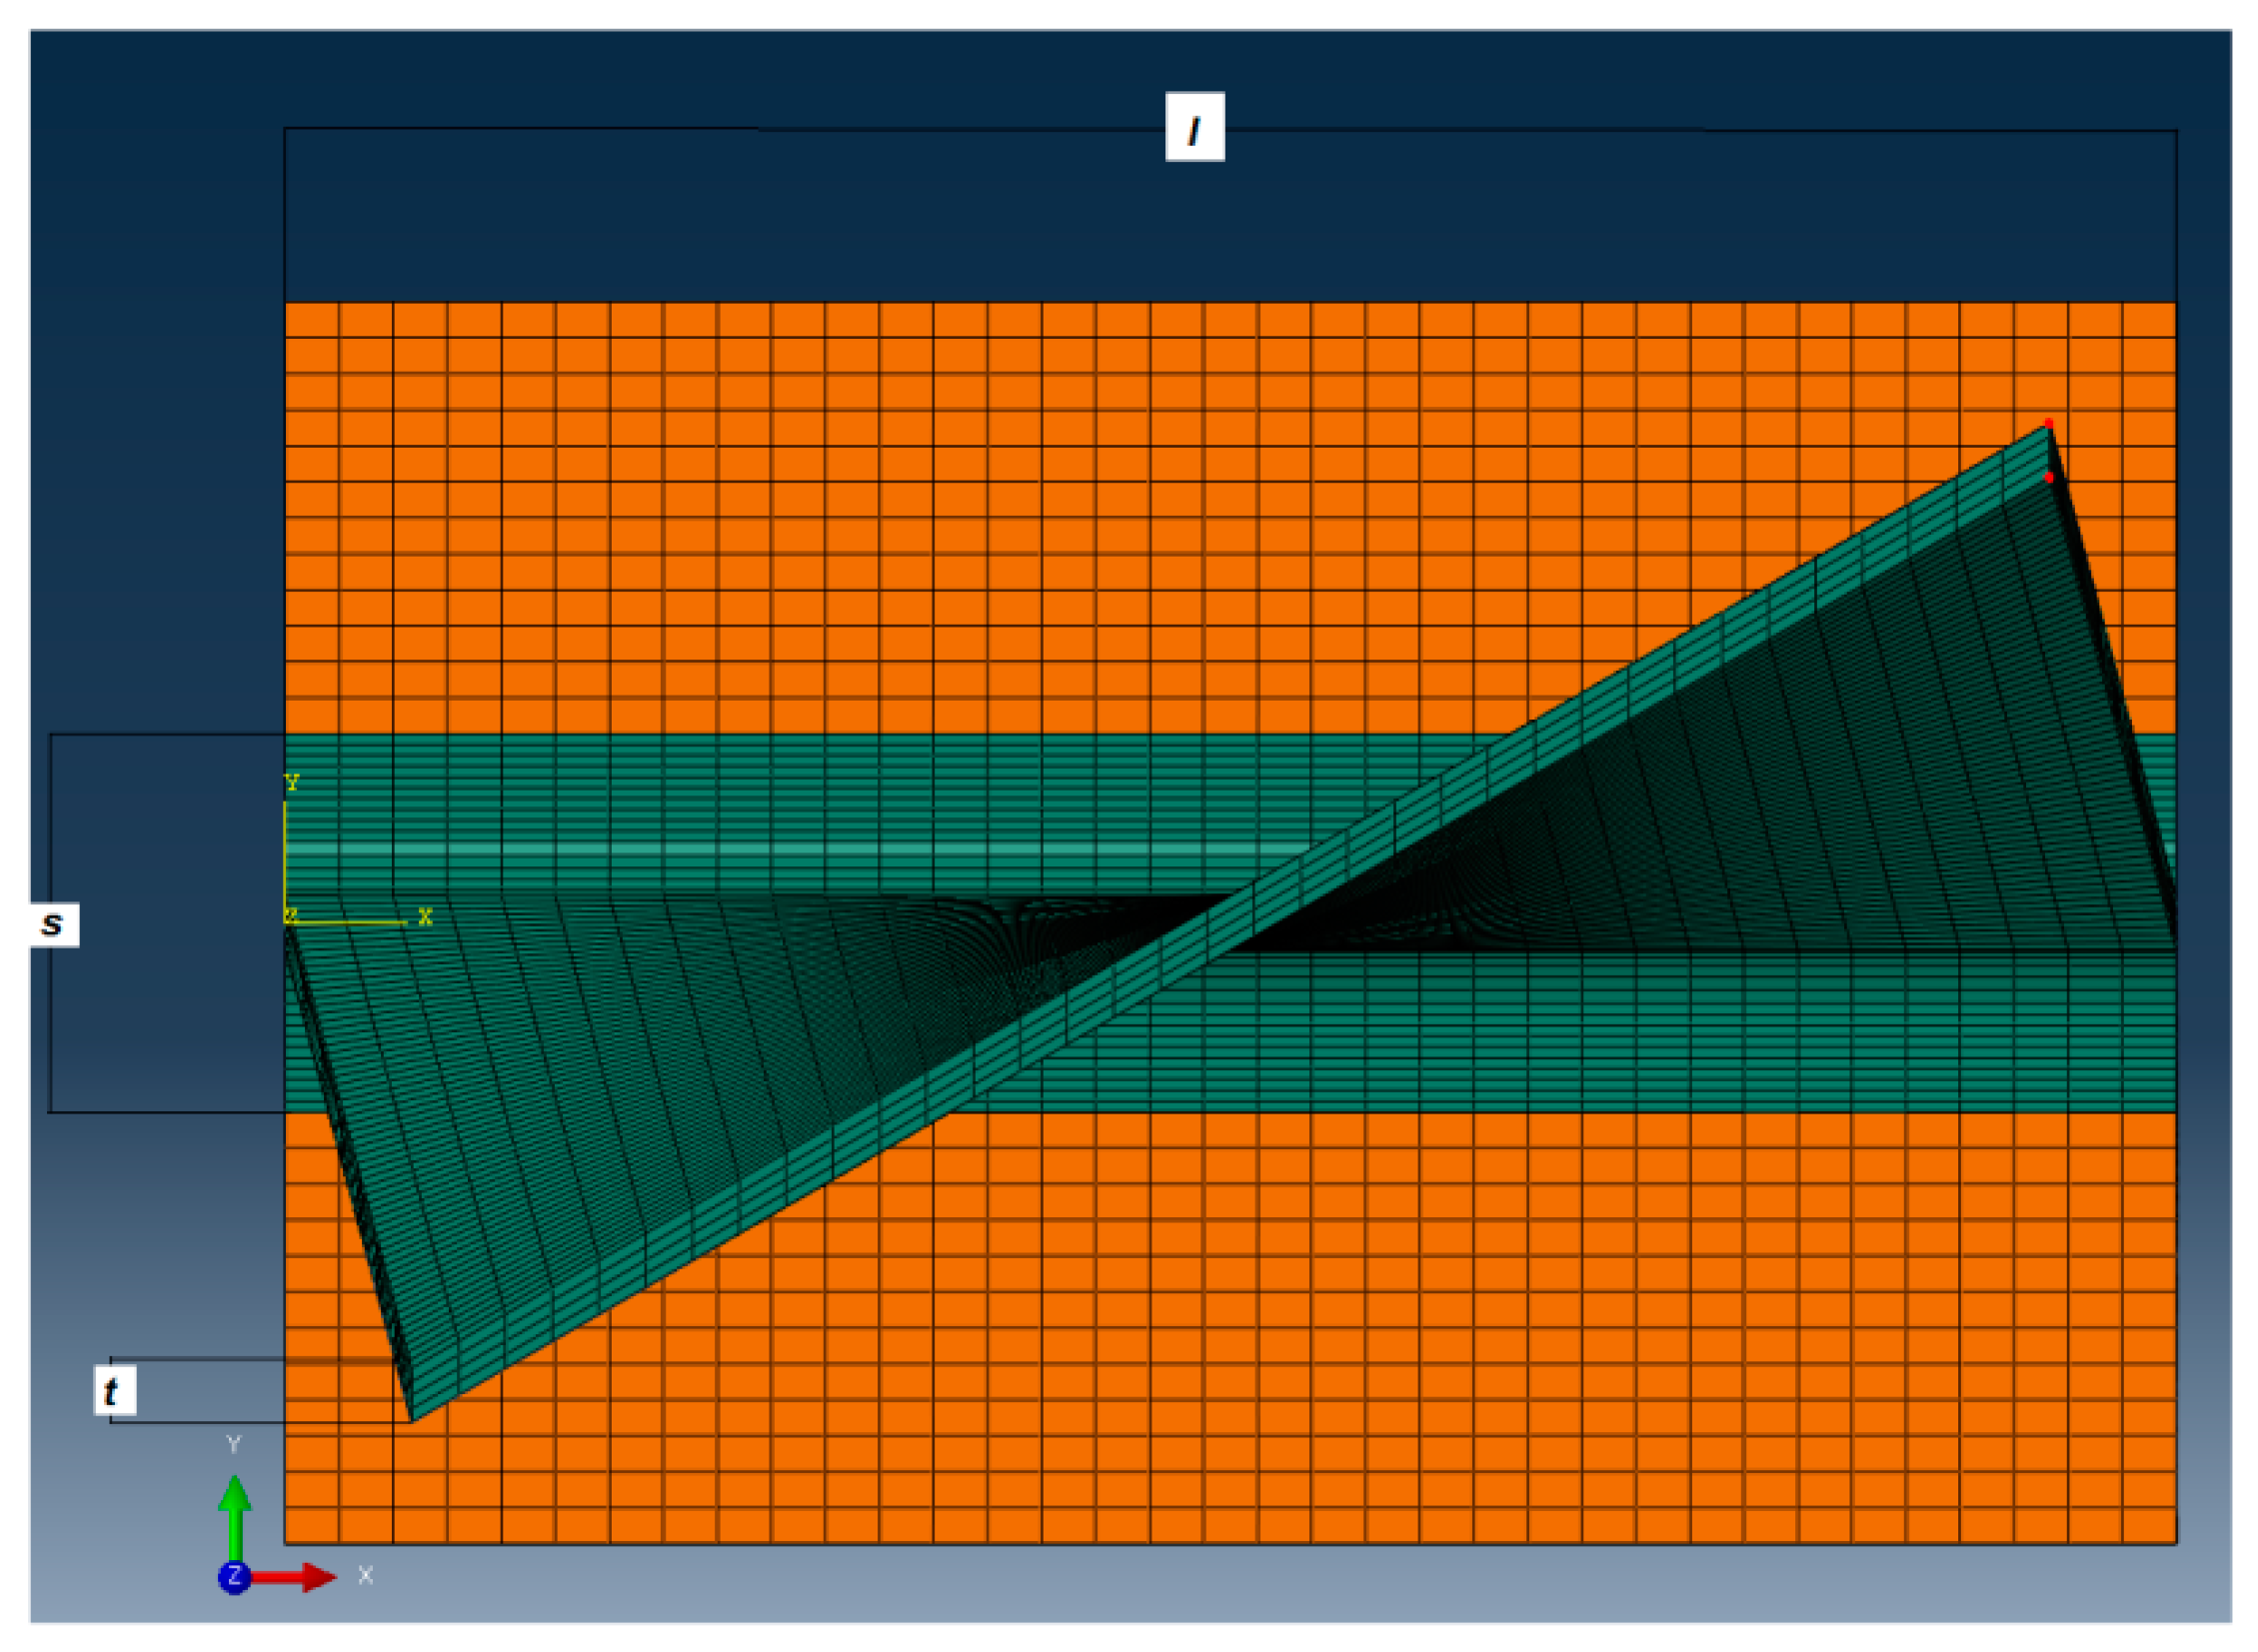
Figure 2.
The flank length and flank angle, the design variables in this study.
Figure 2.
The flank length and flank angle, the design variables in this study.
Figure 3.
Non-variable dimensions in each of the six FE models.
Figure 3.
Non-variable dimensions in each of the six FE models.
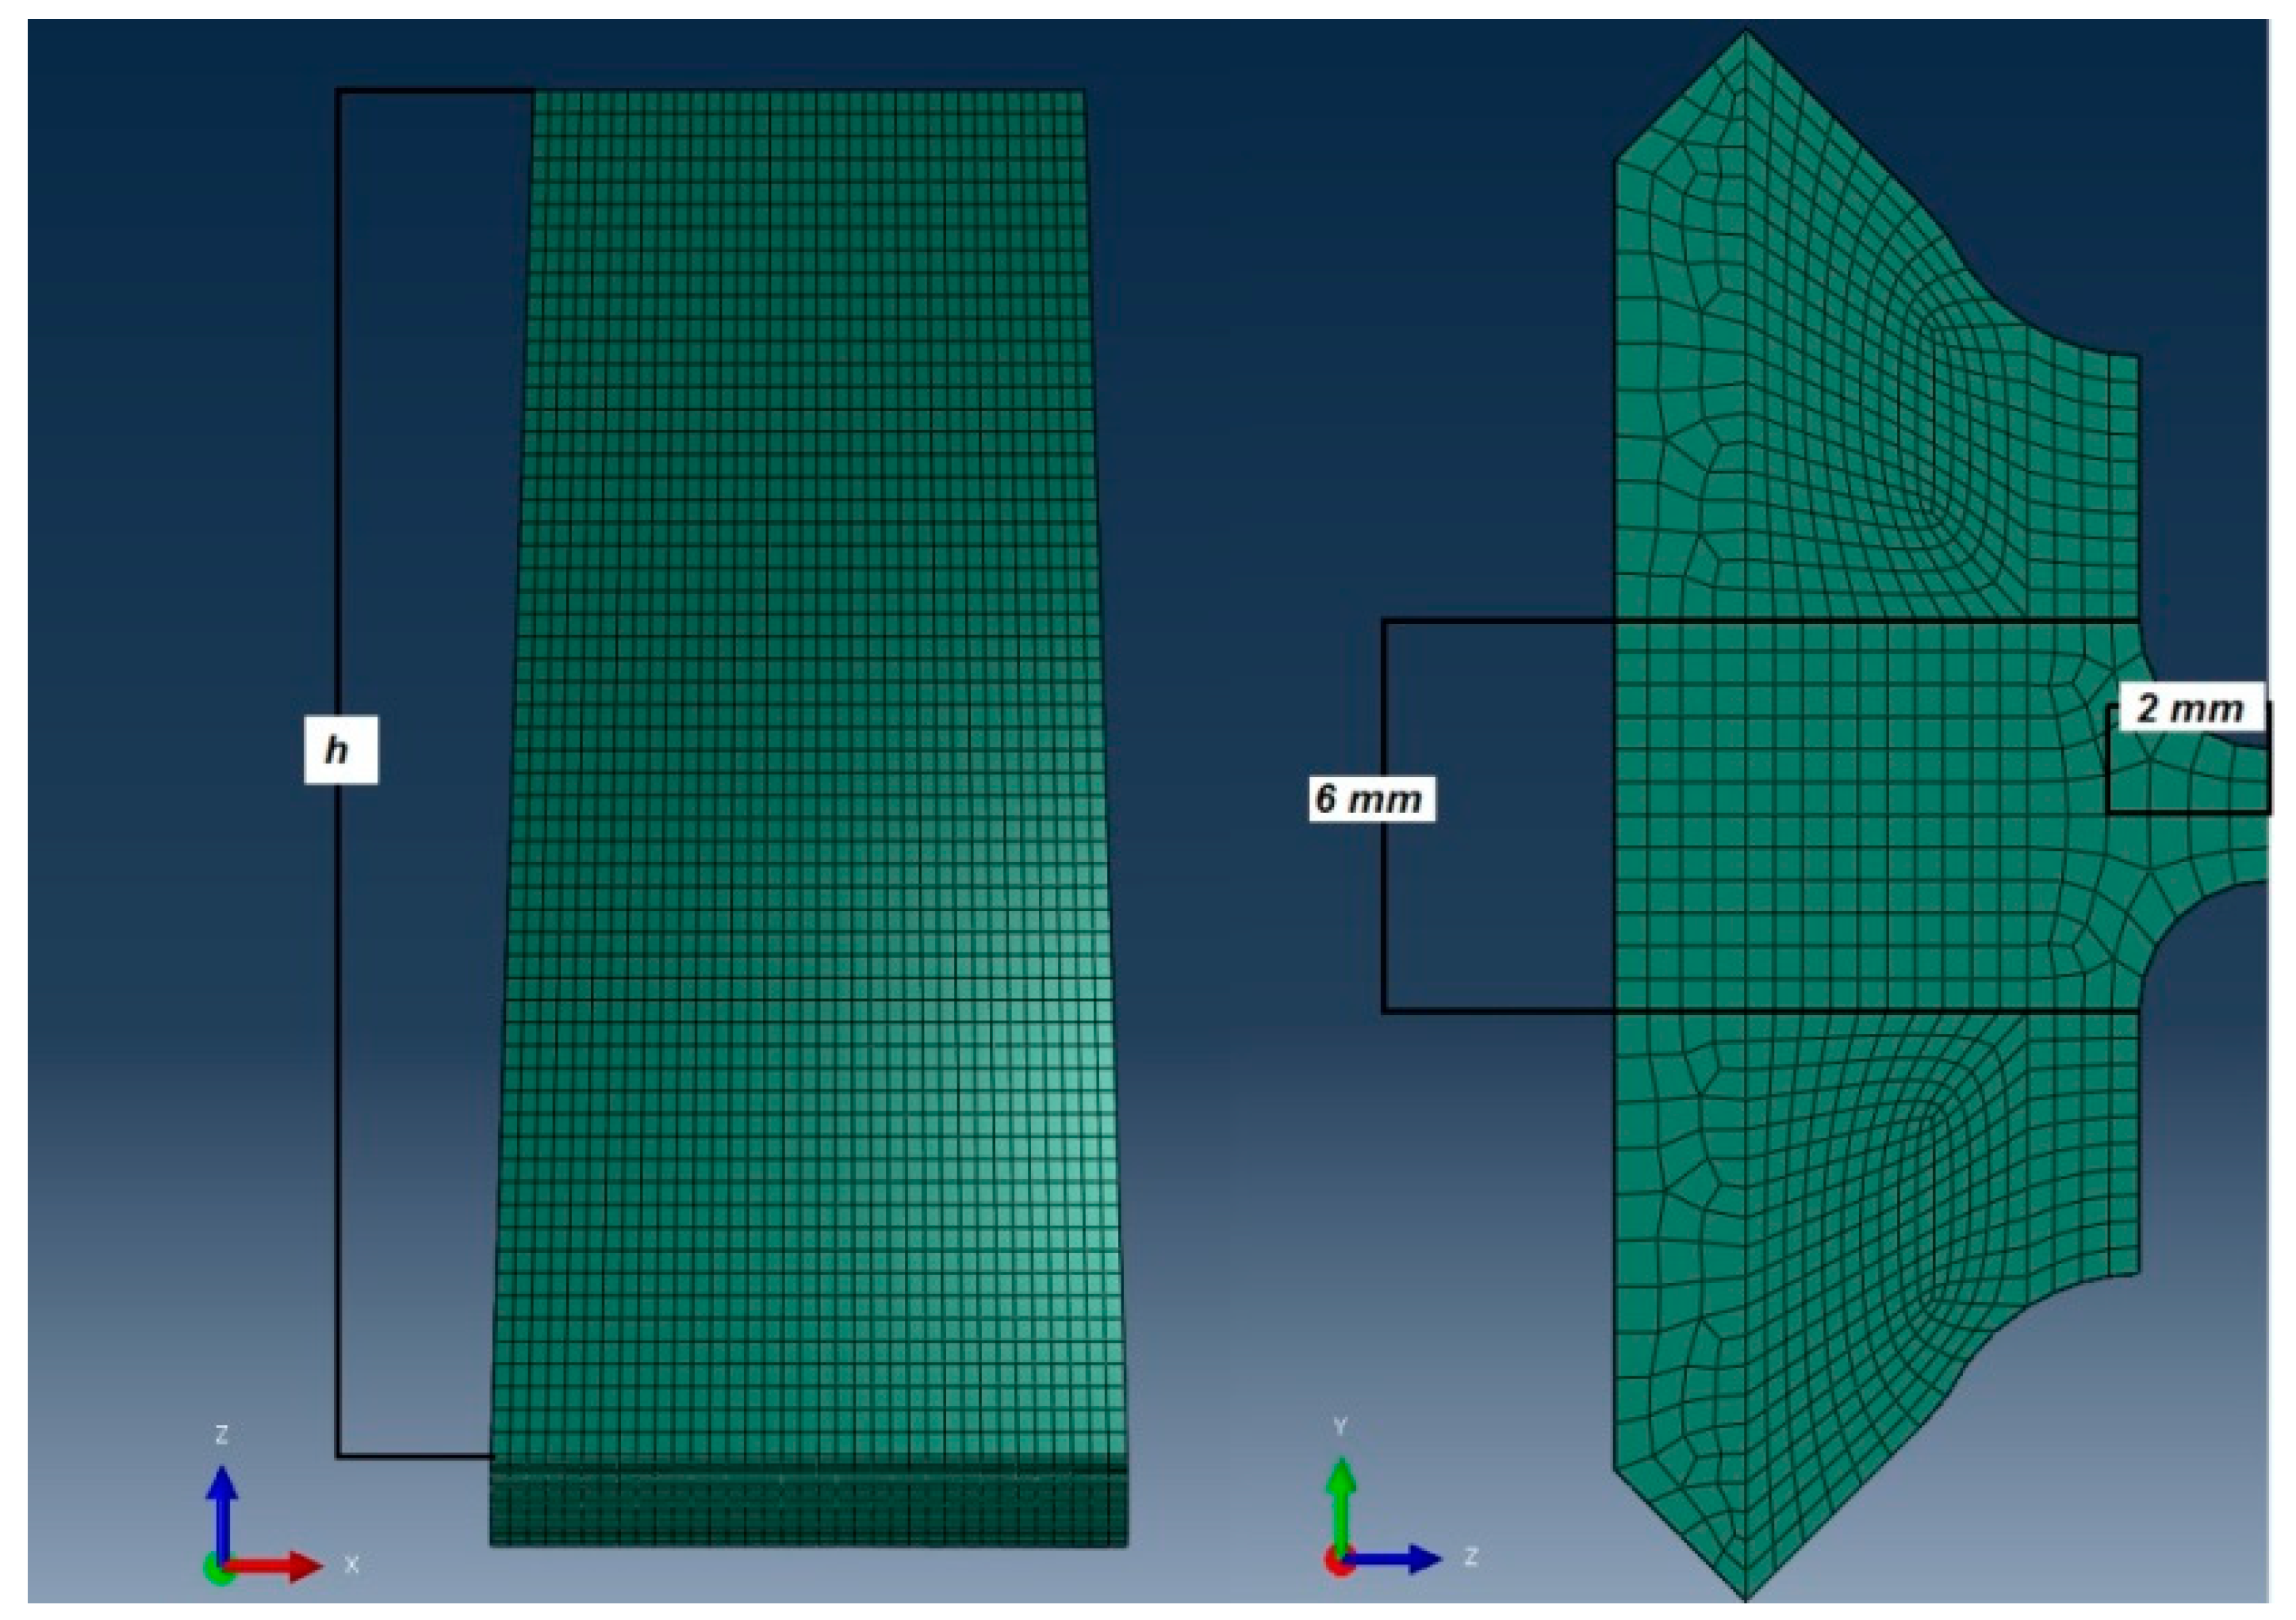
Figure 4.
Airfoil length and transition area details.
Figure 4.
Airfoil length and transition area details.
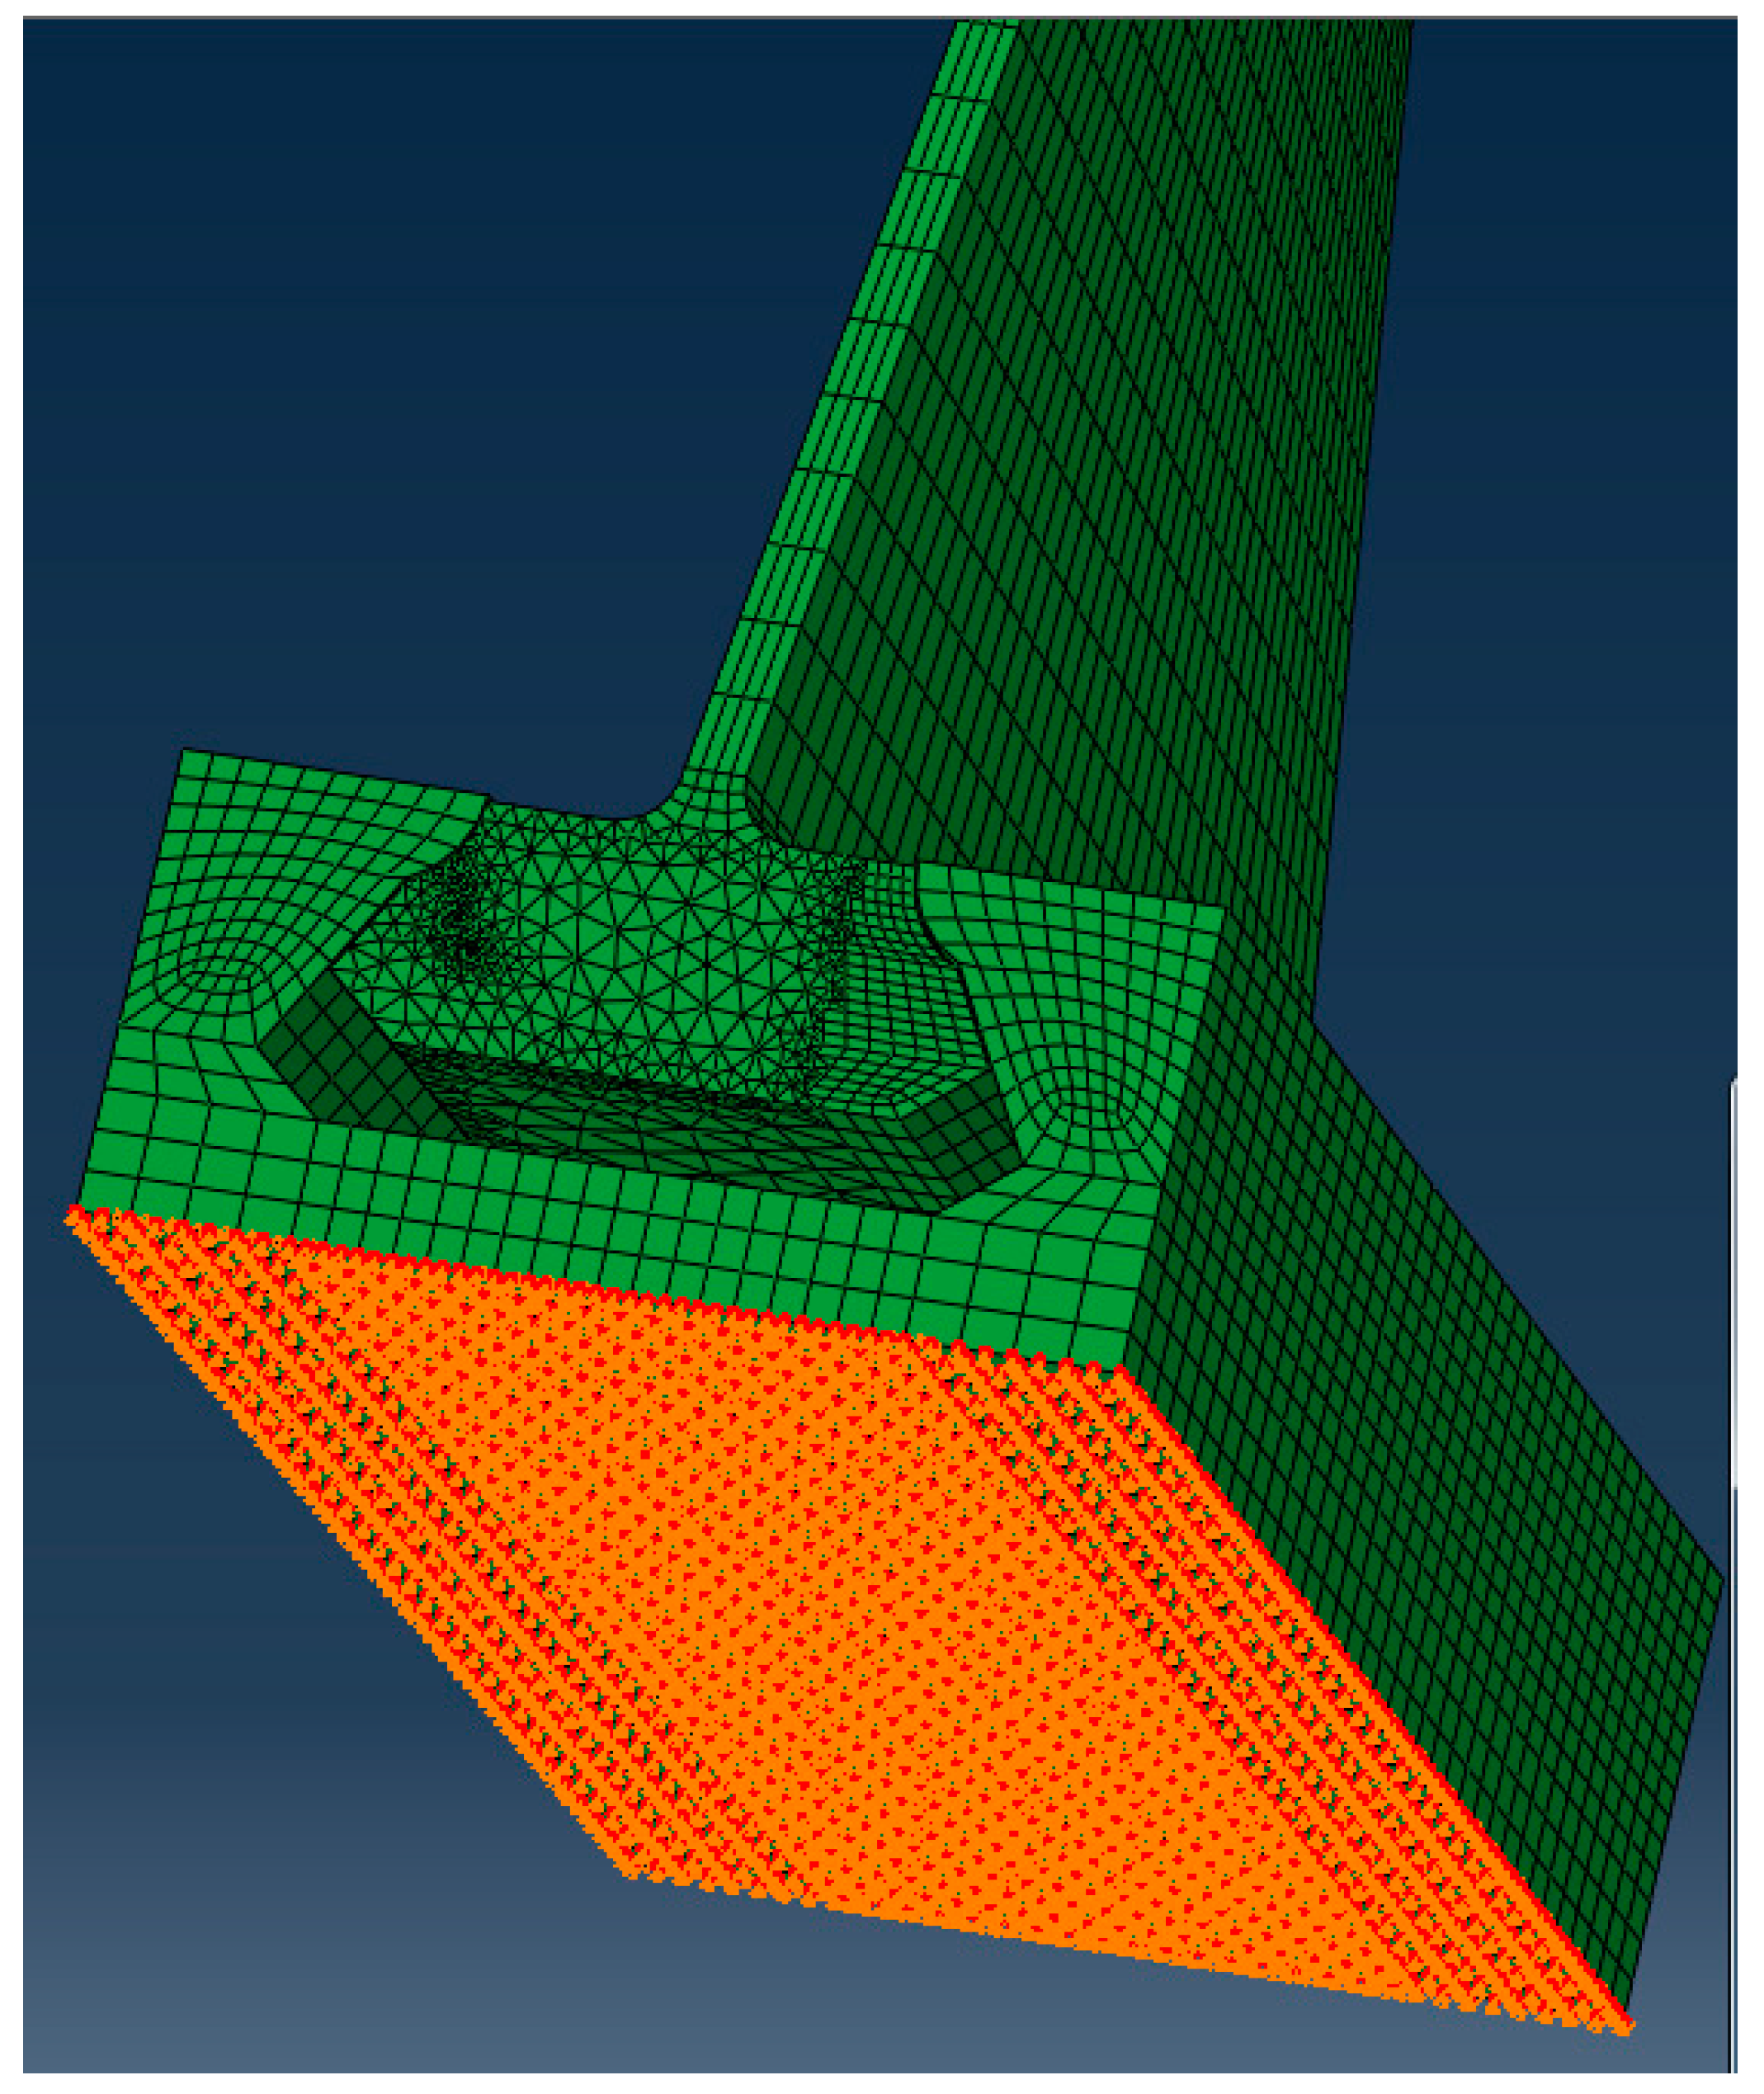
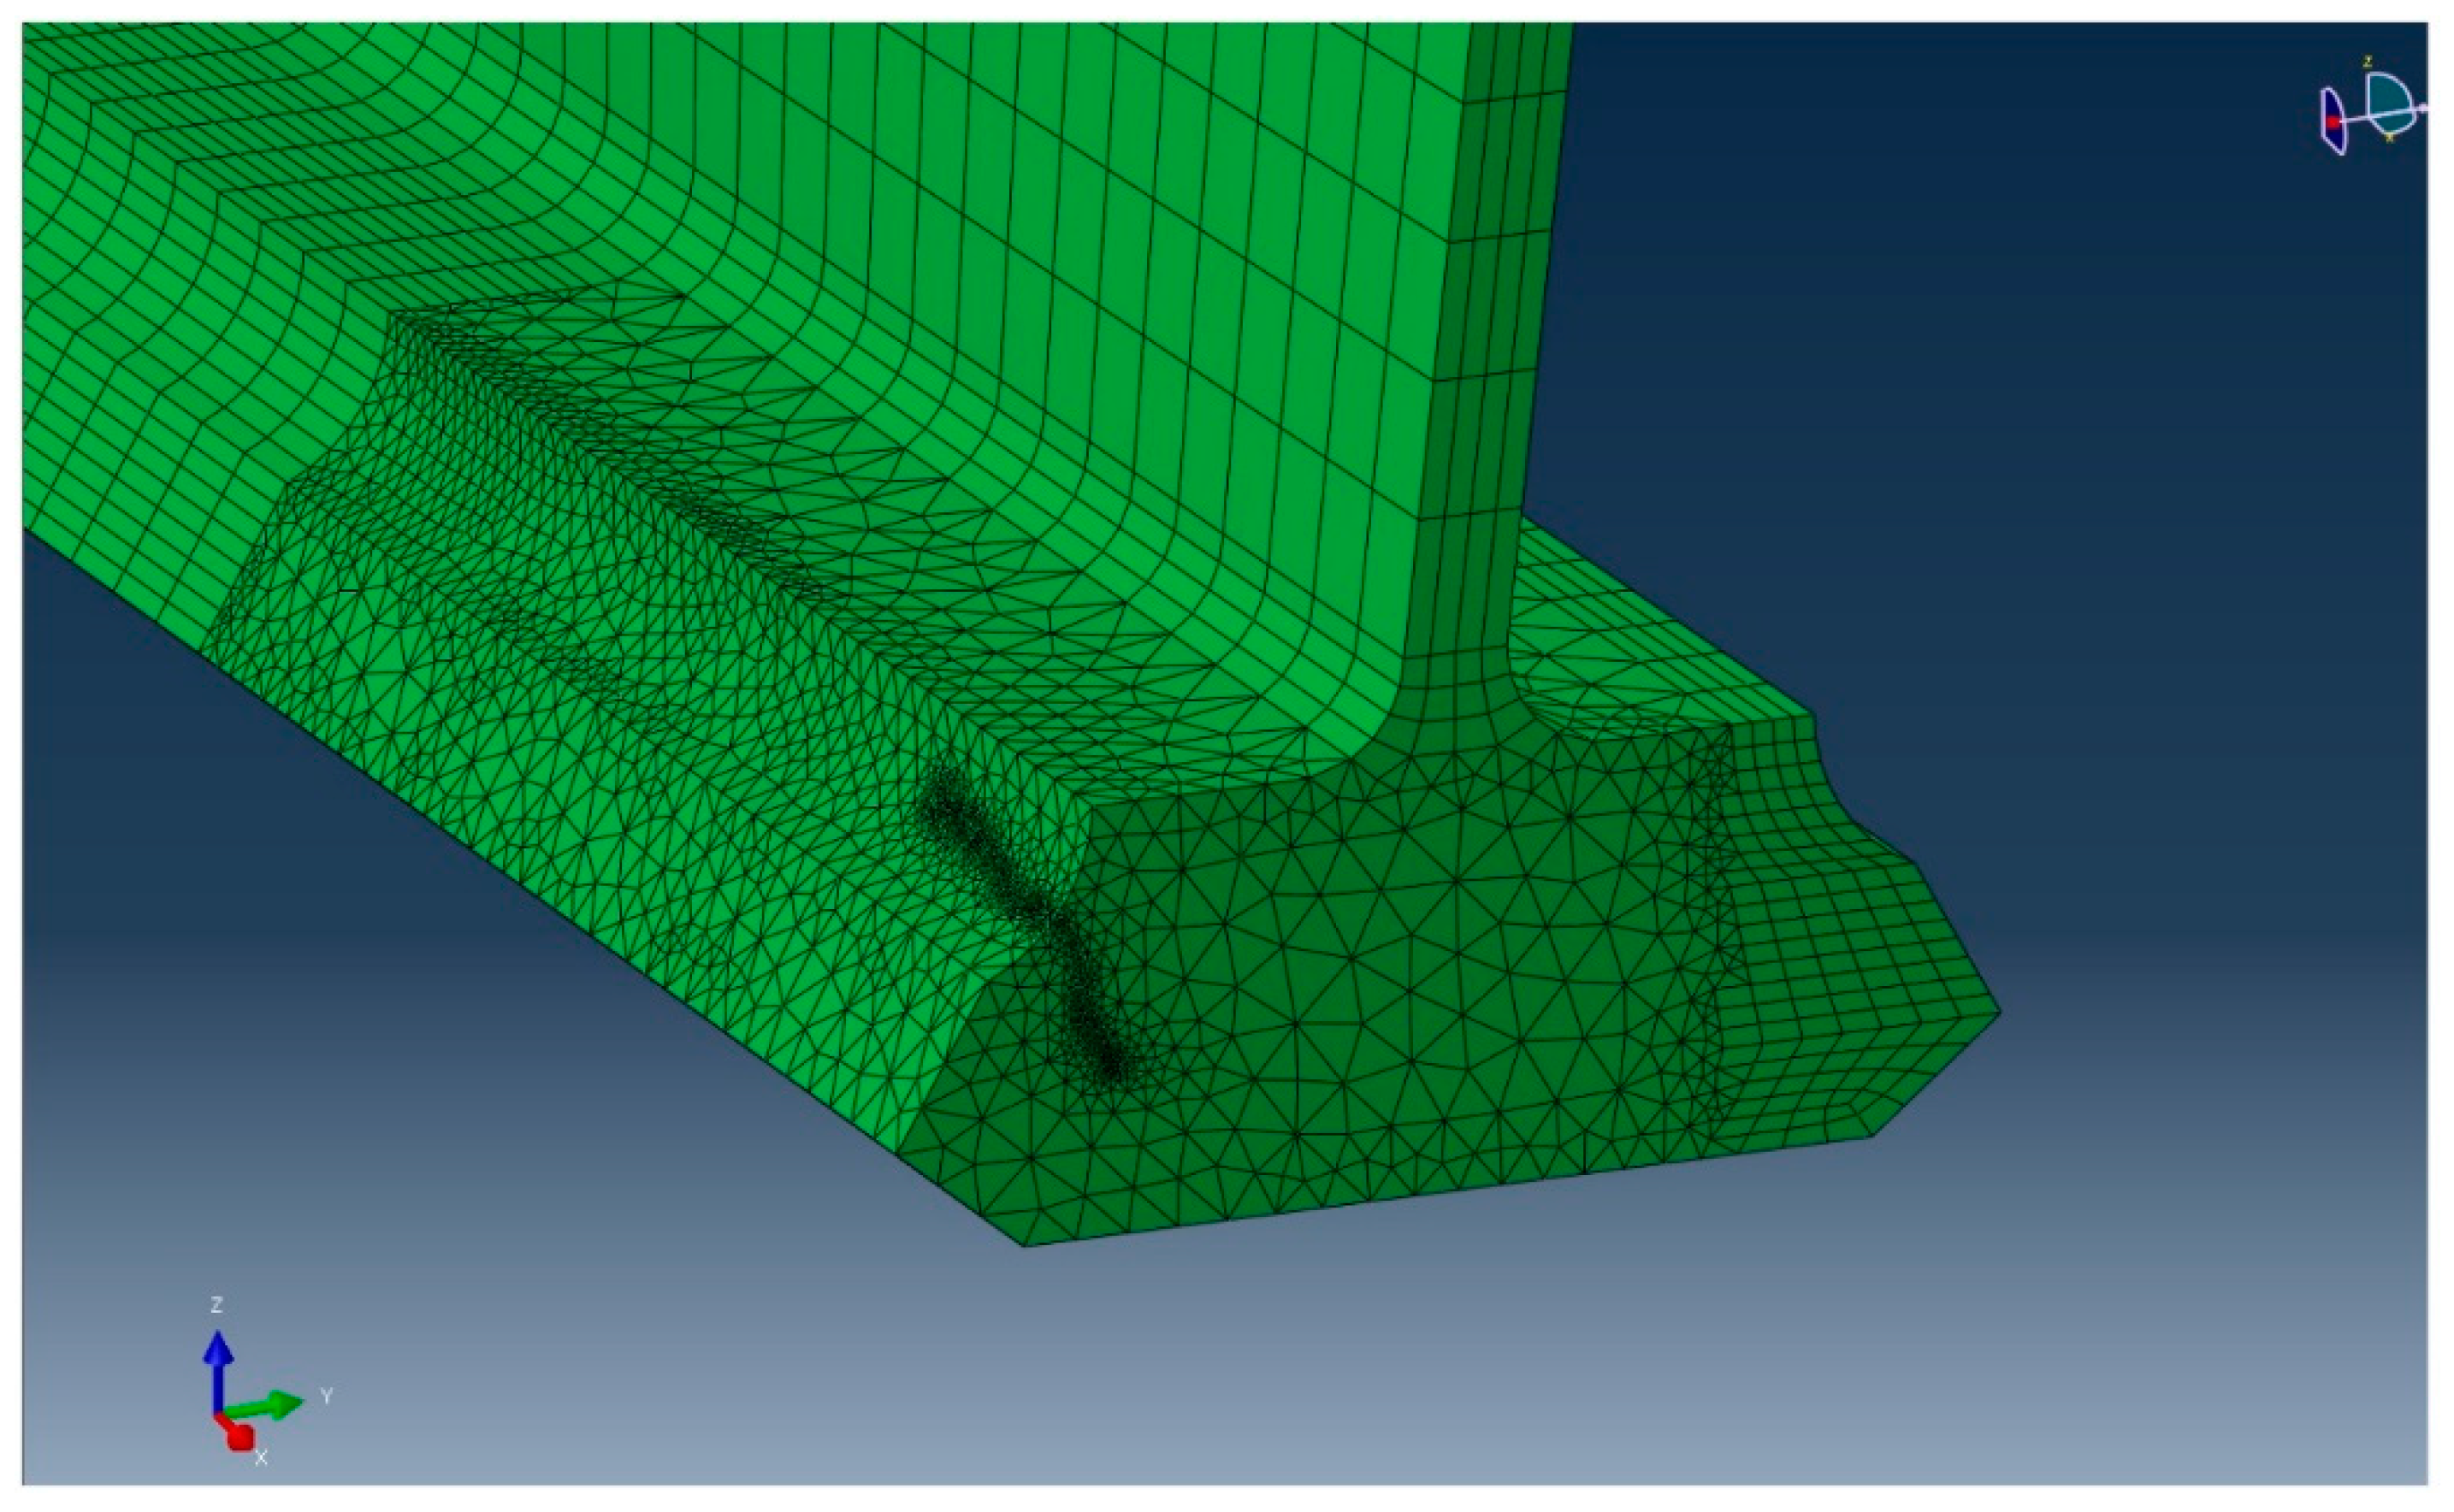
Figure 5.
Sub-model containing the crack. The mesh is automatically generated within Franc3D at each iteration.
Figure 5.
Sub-model containing the crack. The mesh is automatically generated within Franc3D at each iteration.
Figure 6.
Boundary conditions at the bottom surface of the disc block.
Figure 6.
Boundary conditions at the bottom surface of the disc block.
Figure 7.
Surface to surface contact definition at the root flanks.
Figure 7.
Surface to surface contact definition at the root flanks.
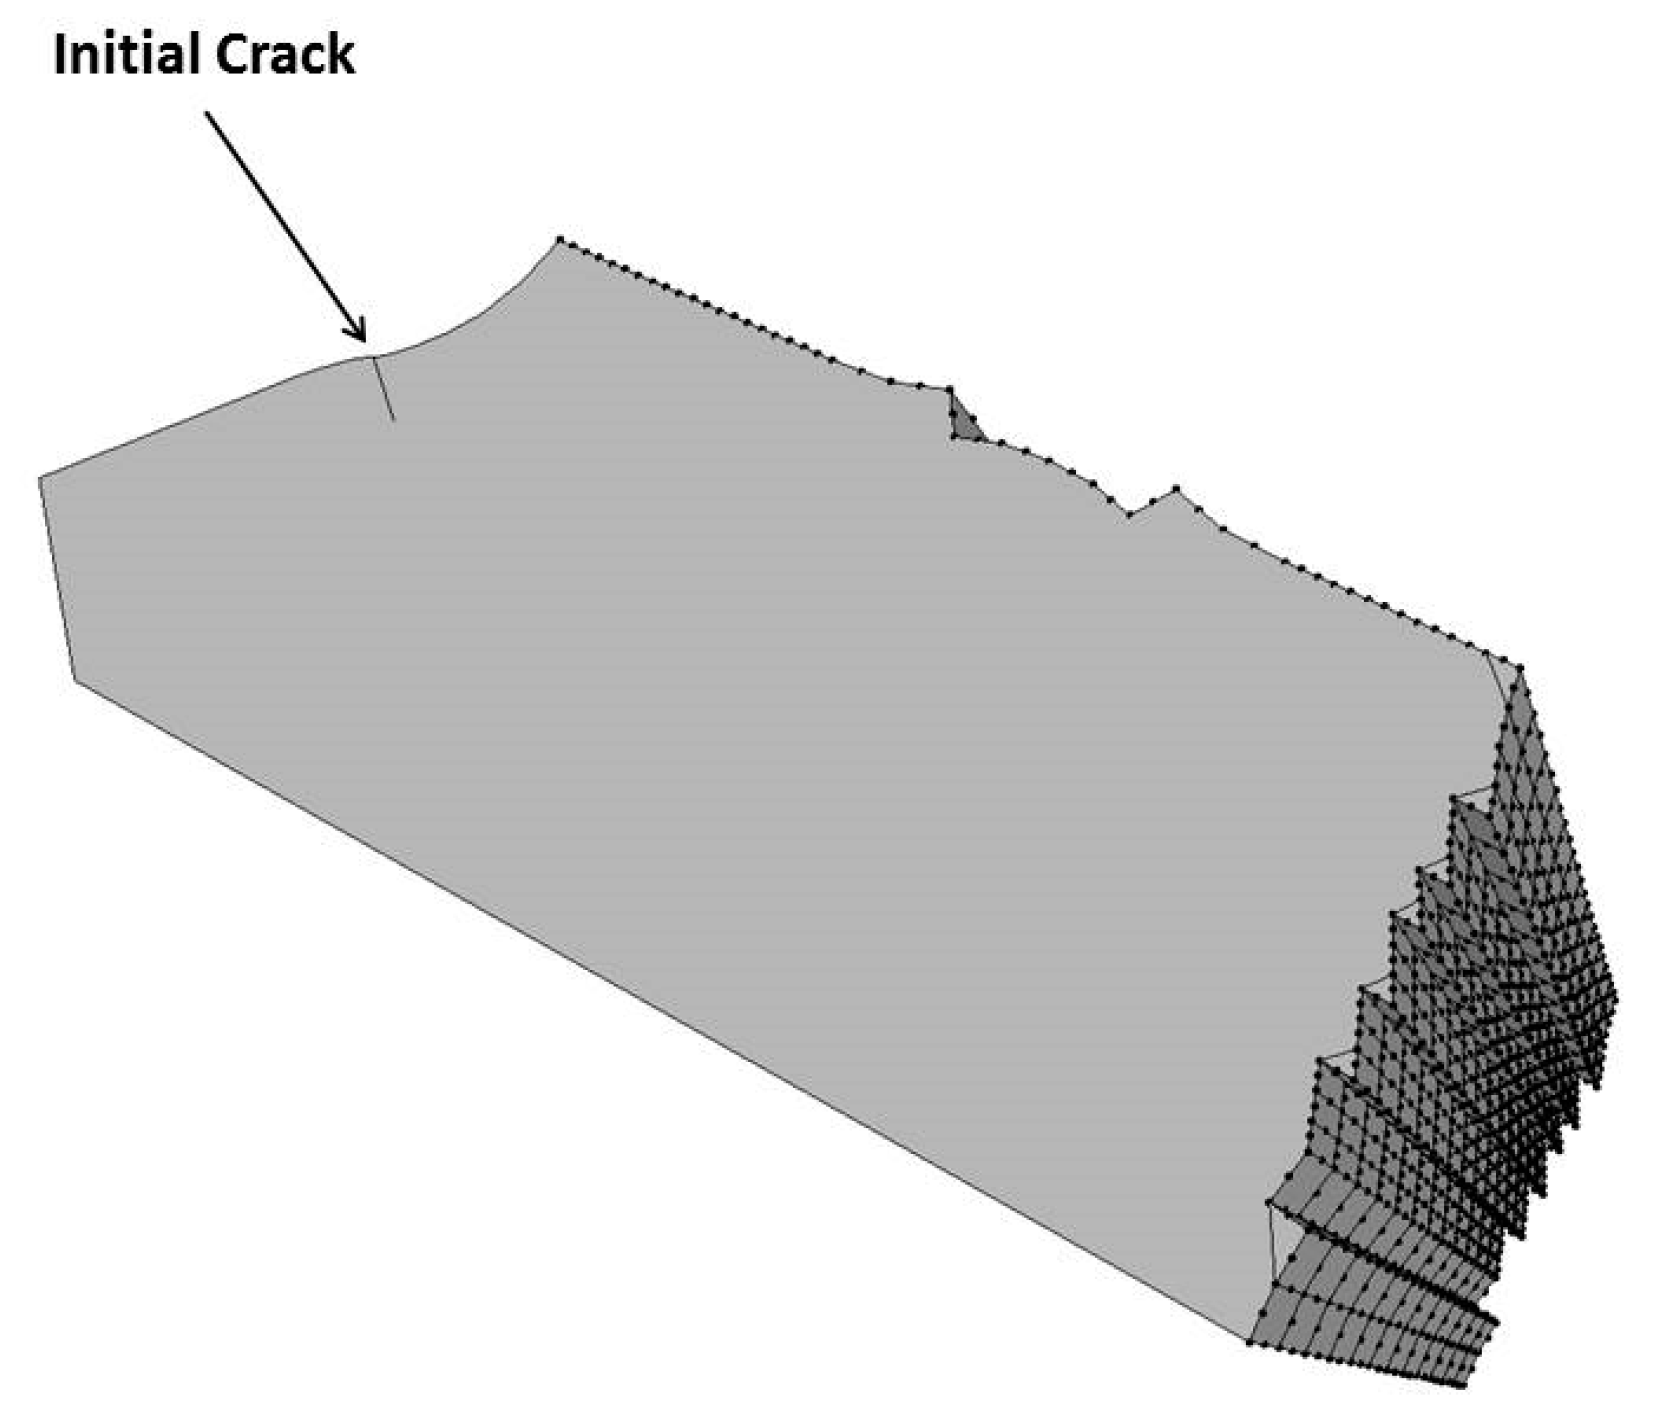
Figure 8.
Initial flaw position.
Figure 8.
Initial flaw position.
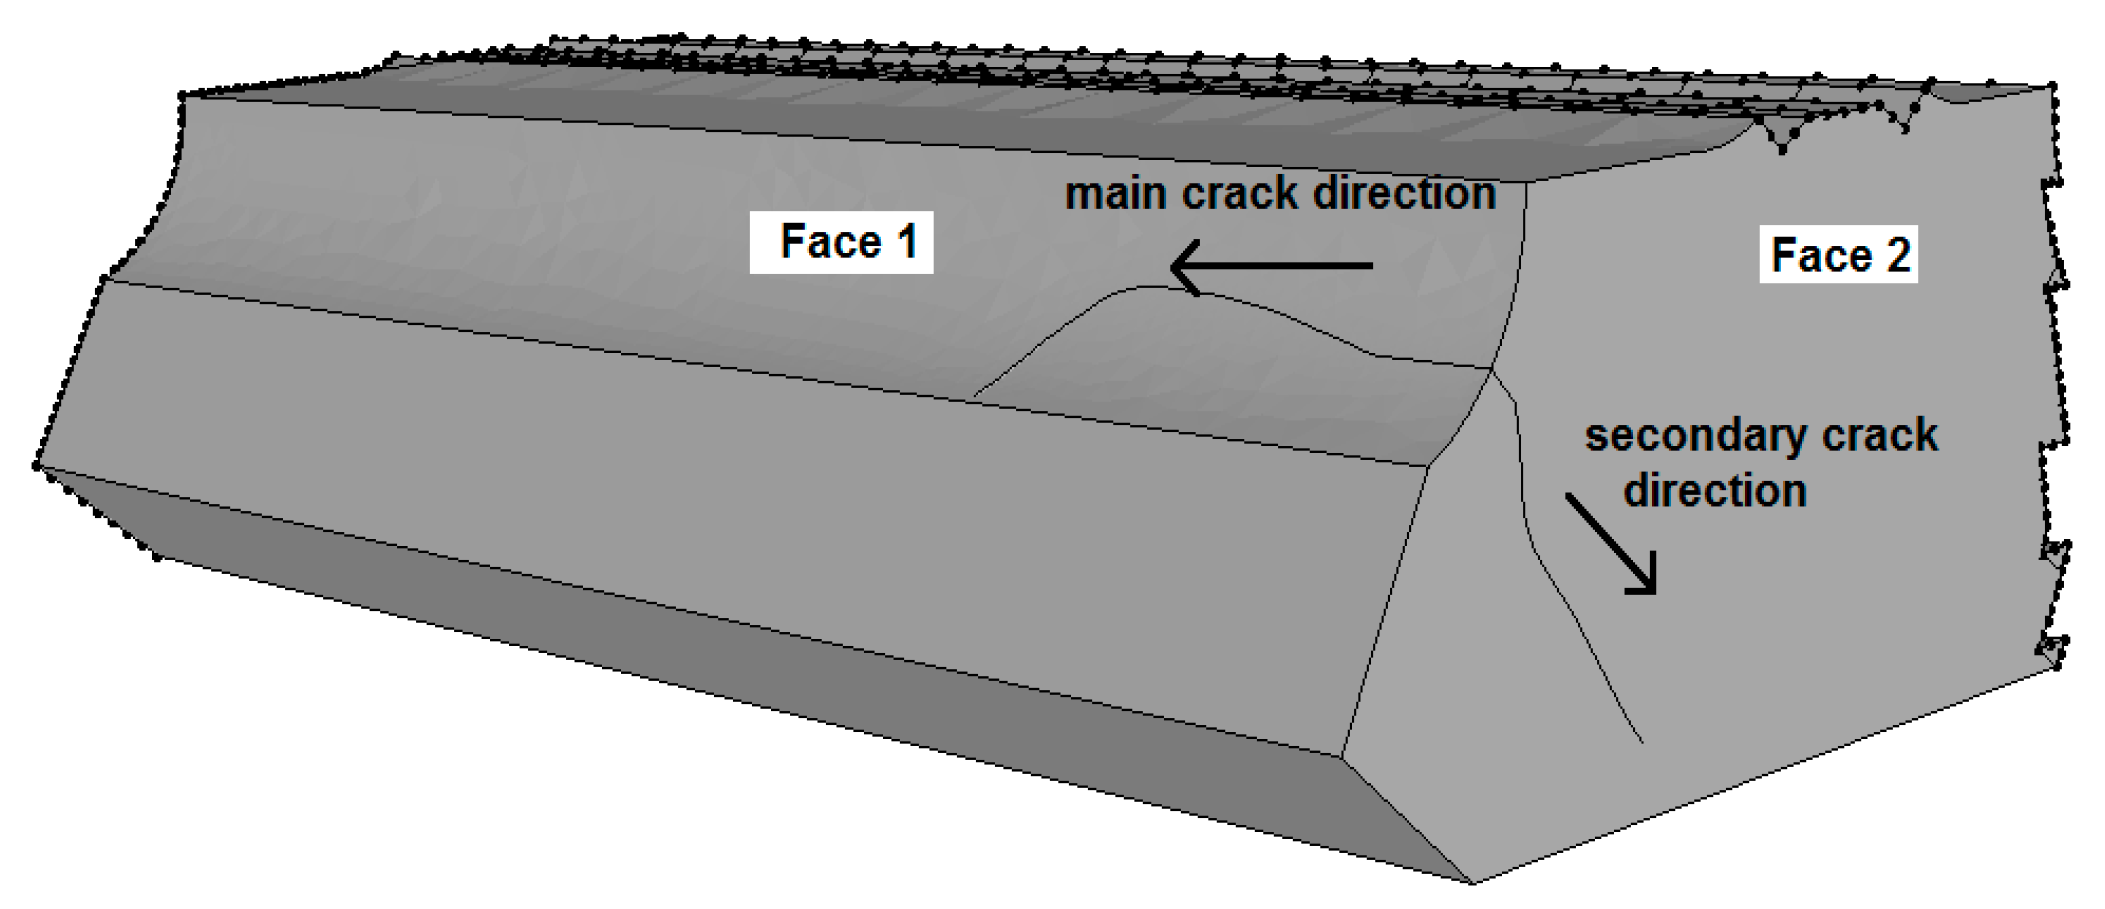
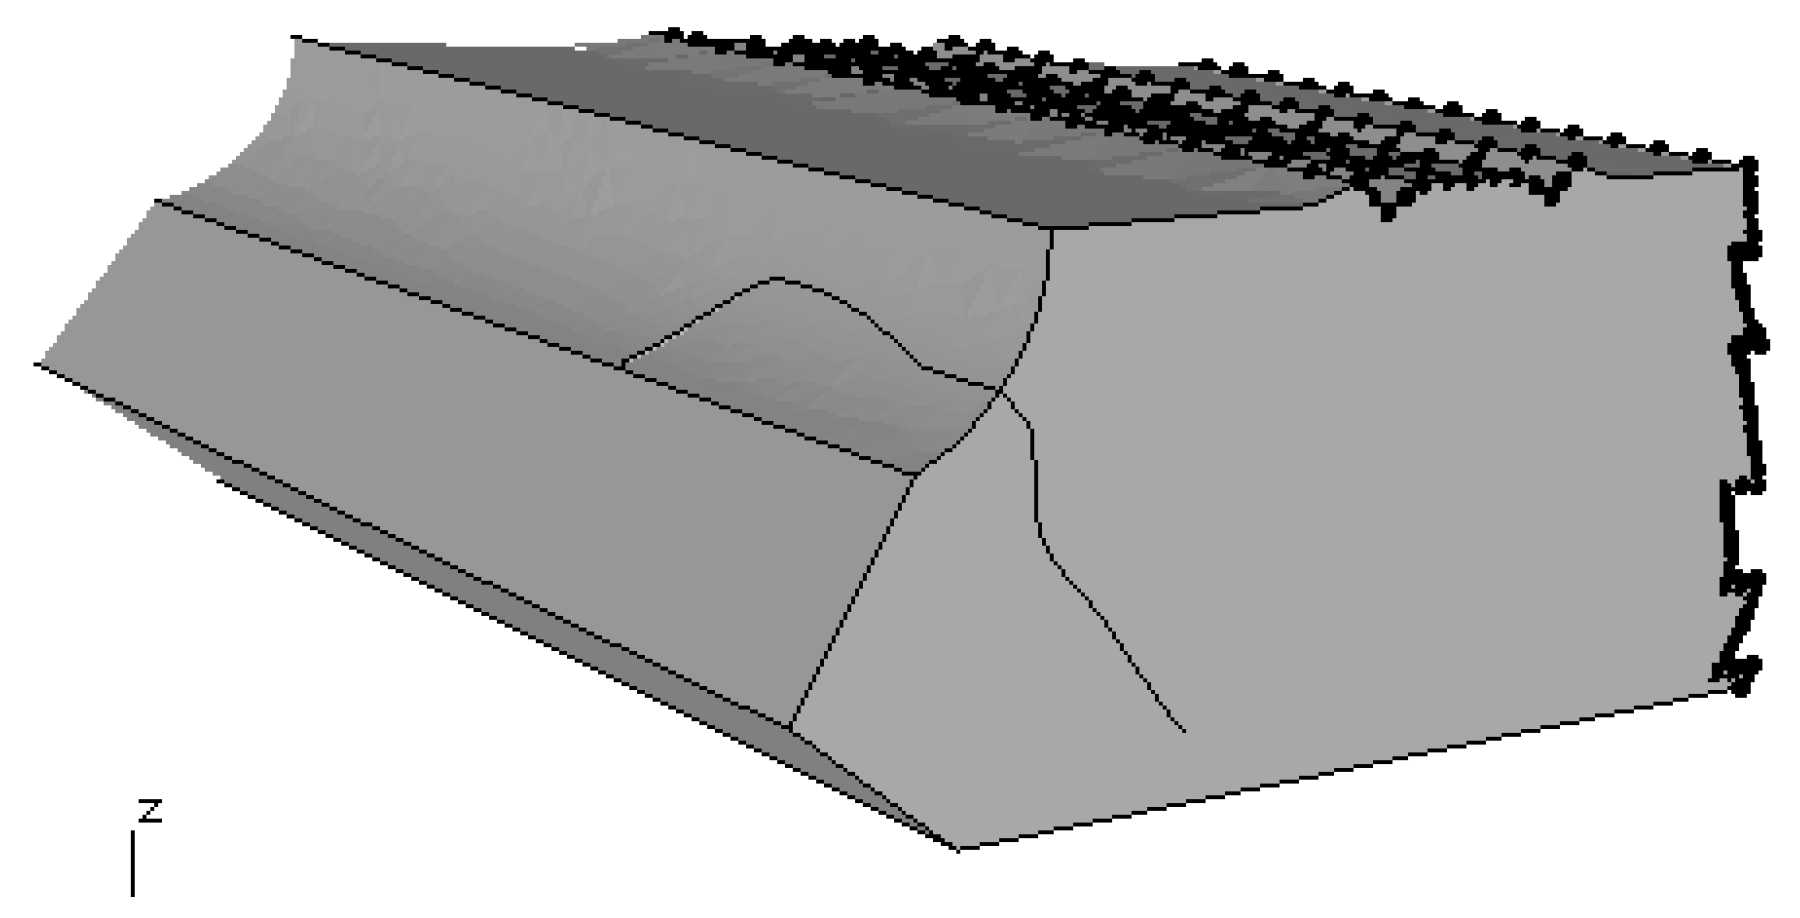
Figure 9.
Two leading crack front directions.
Figure 9.
Two leading crack front directions.
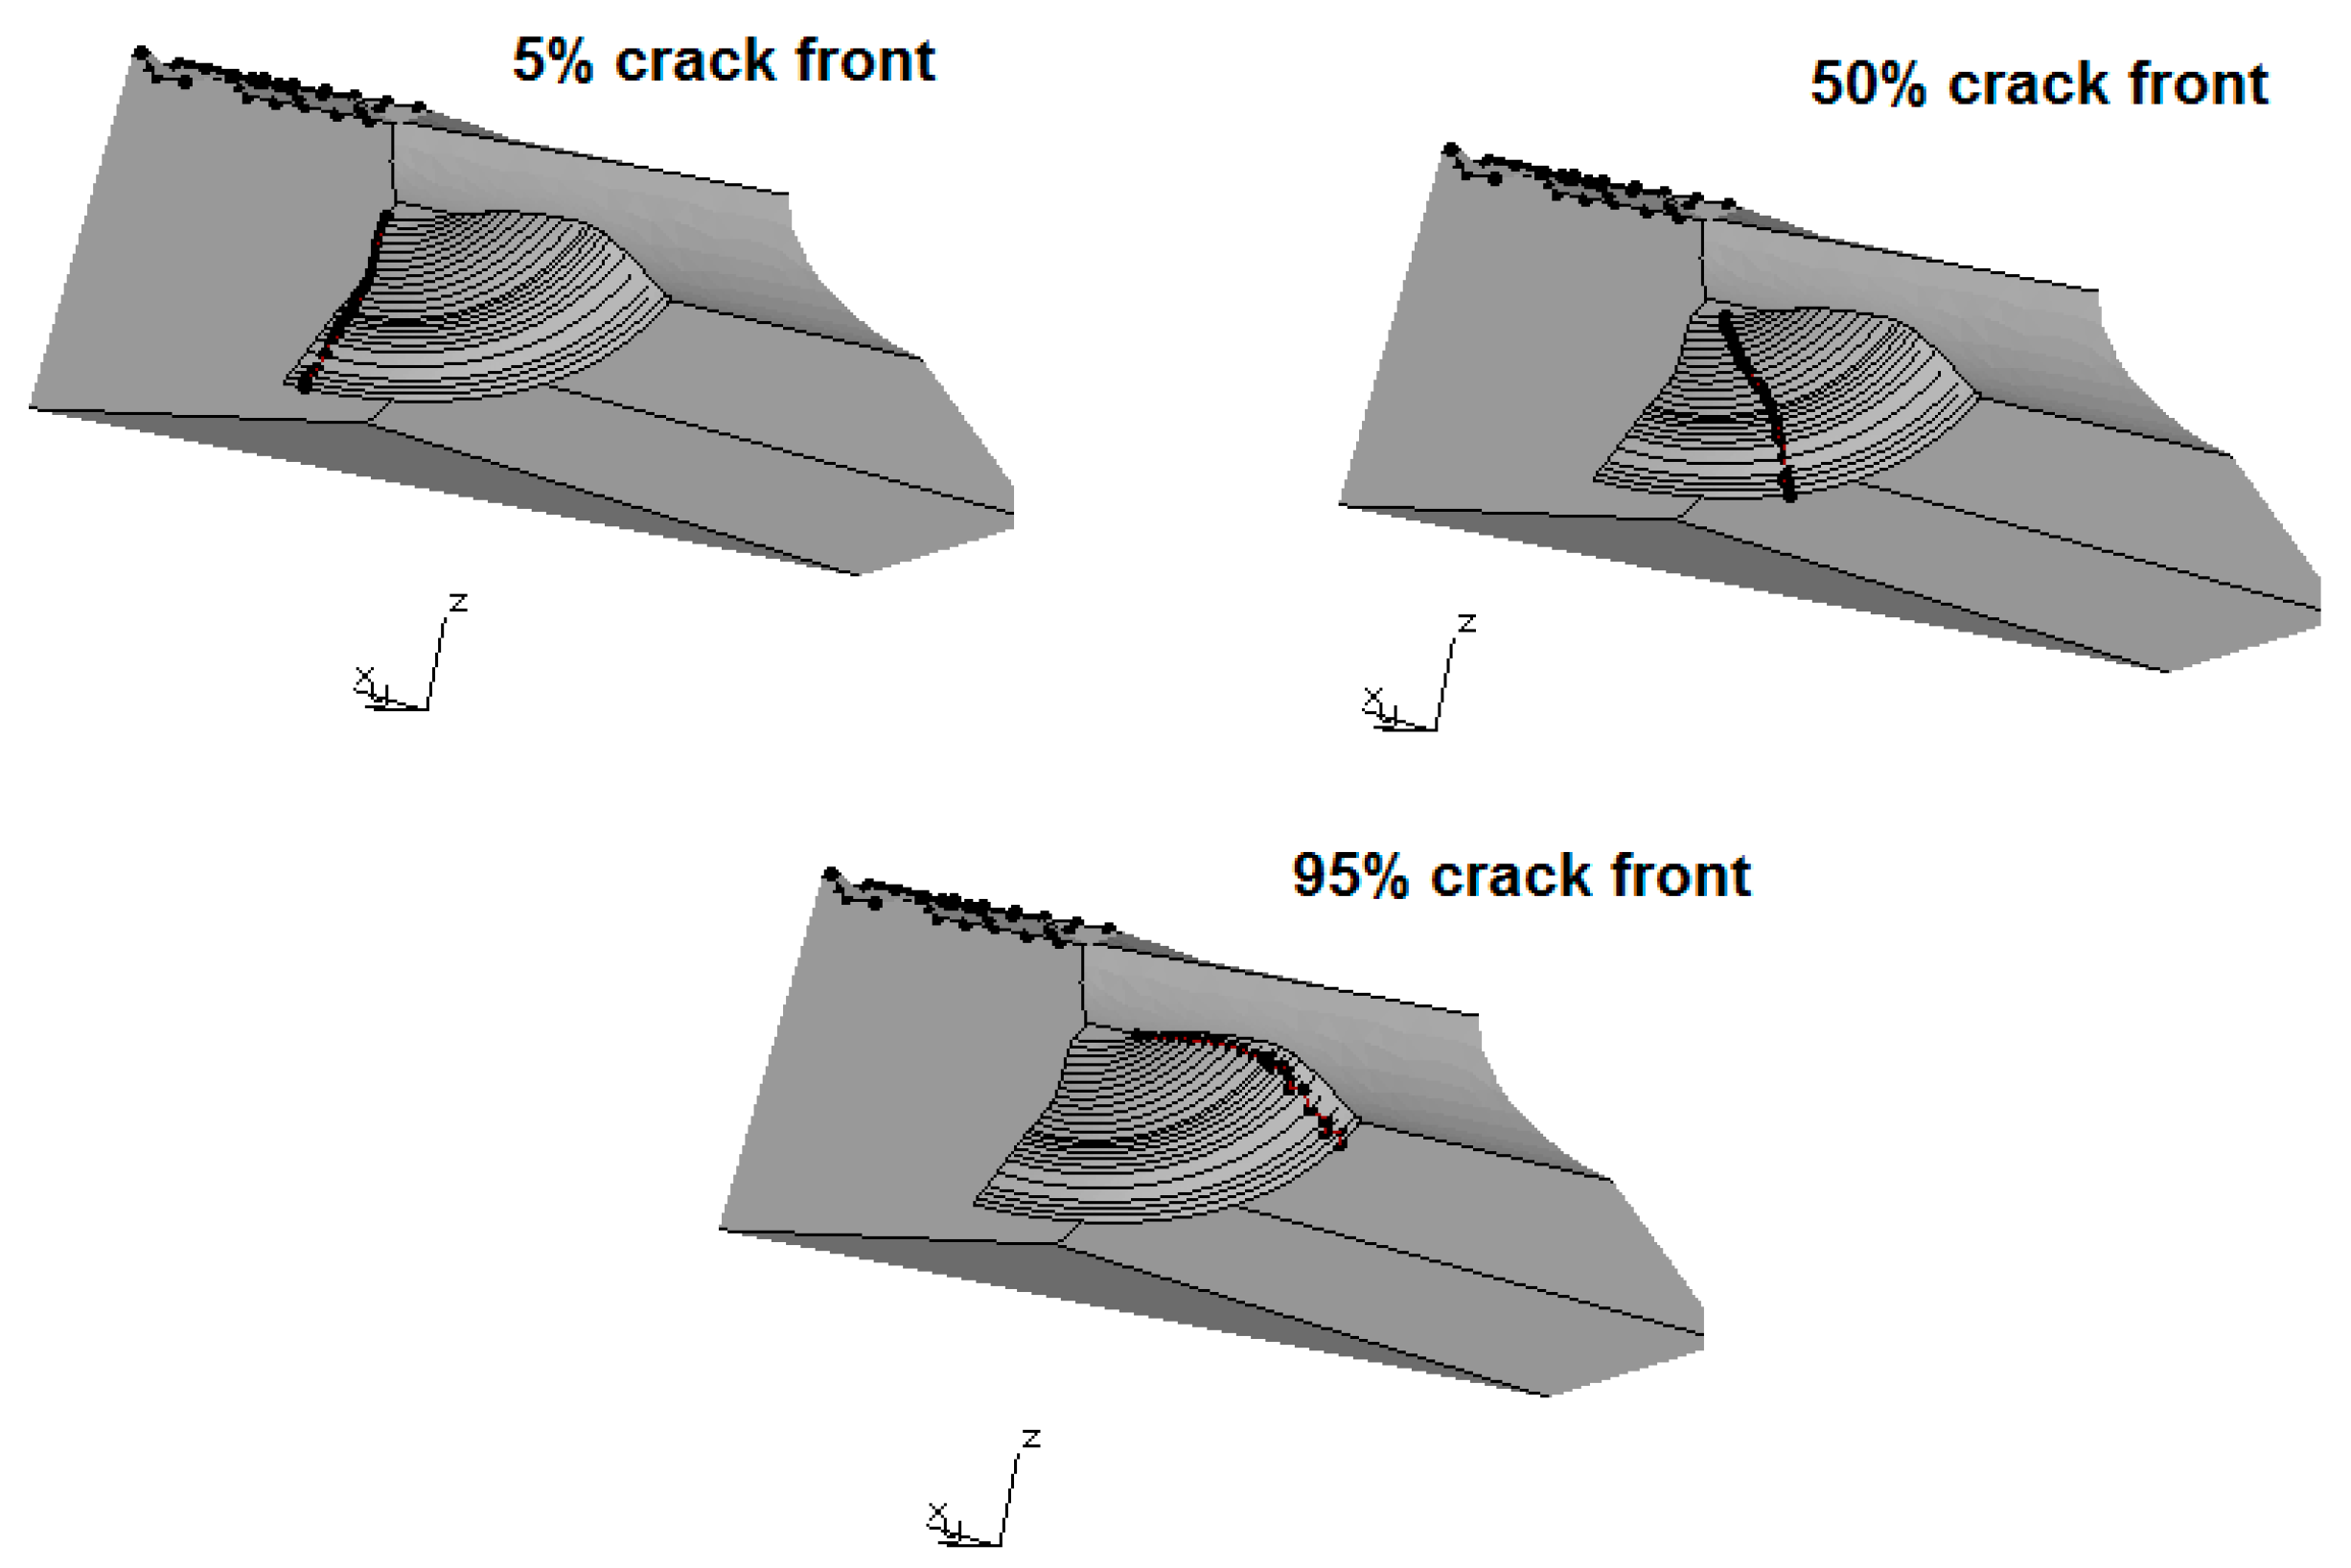
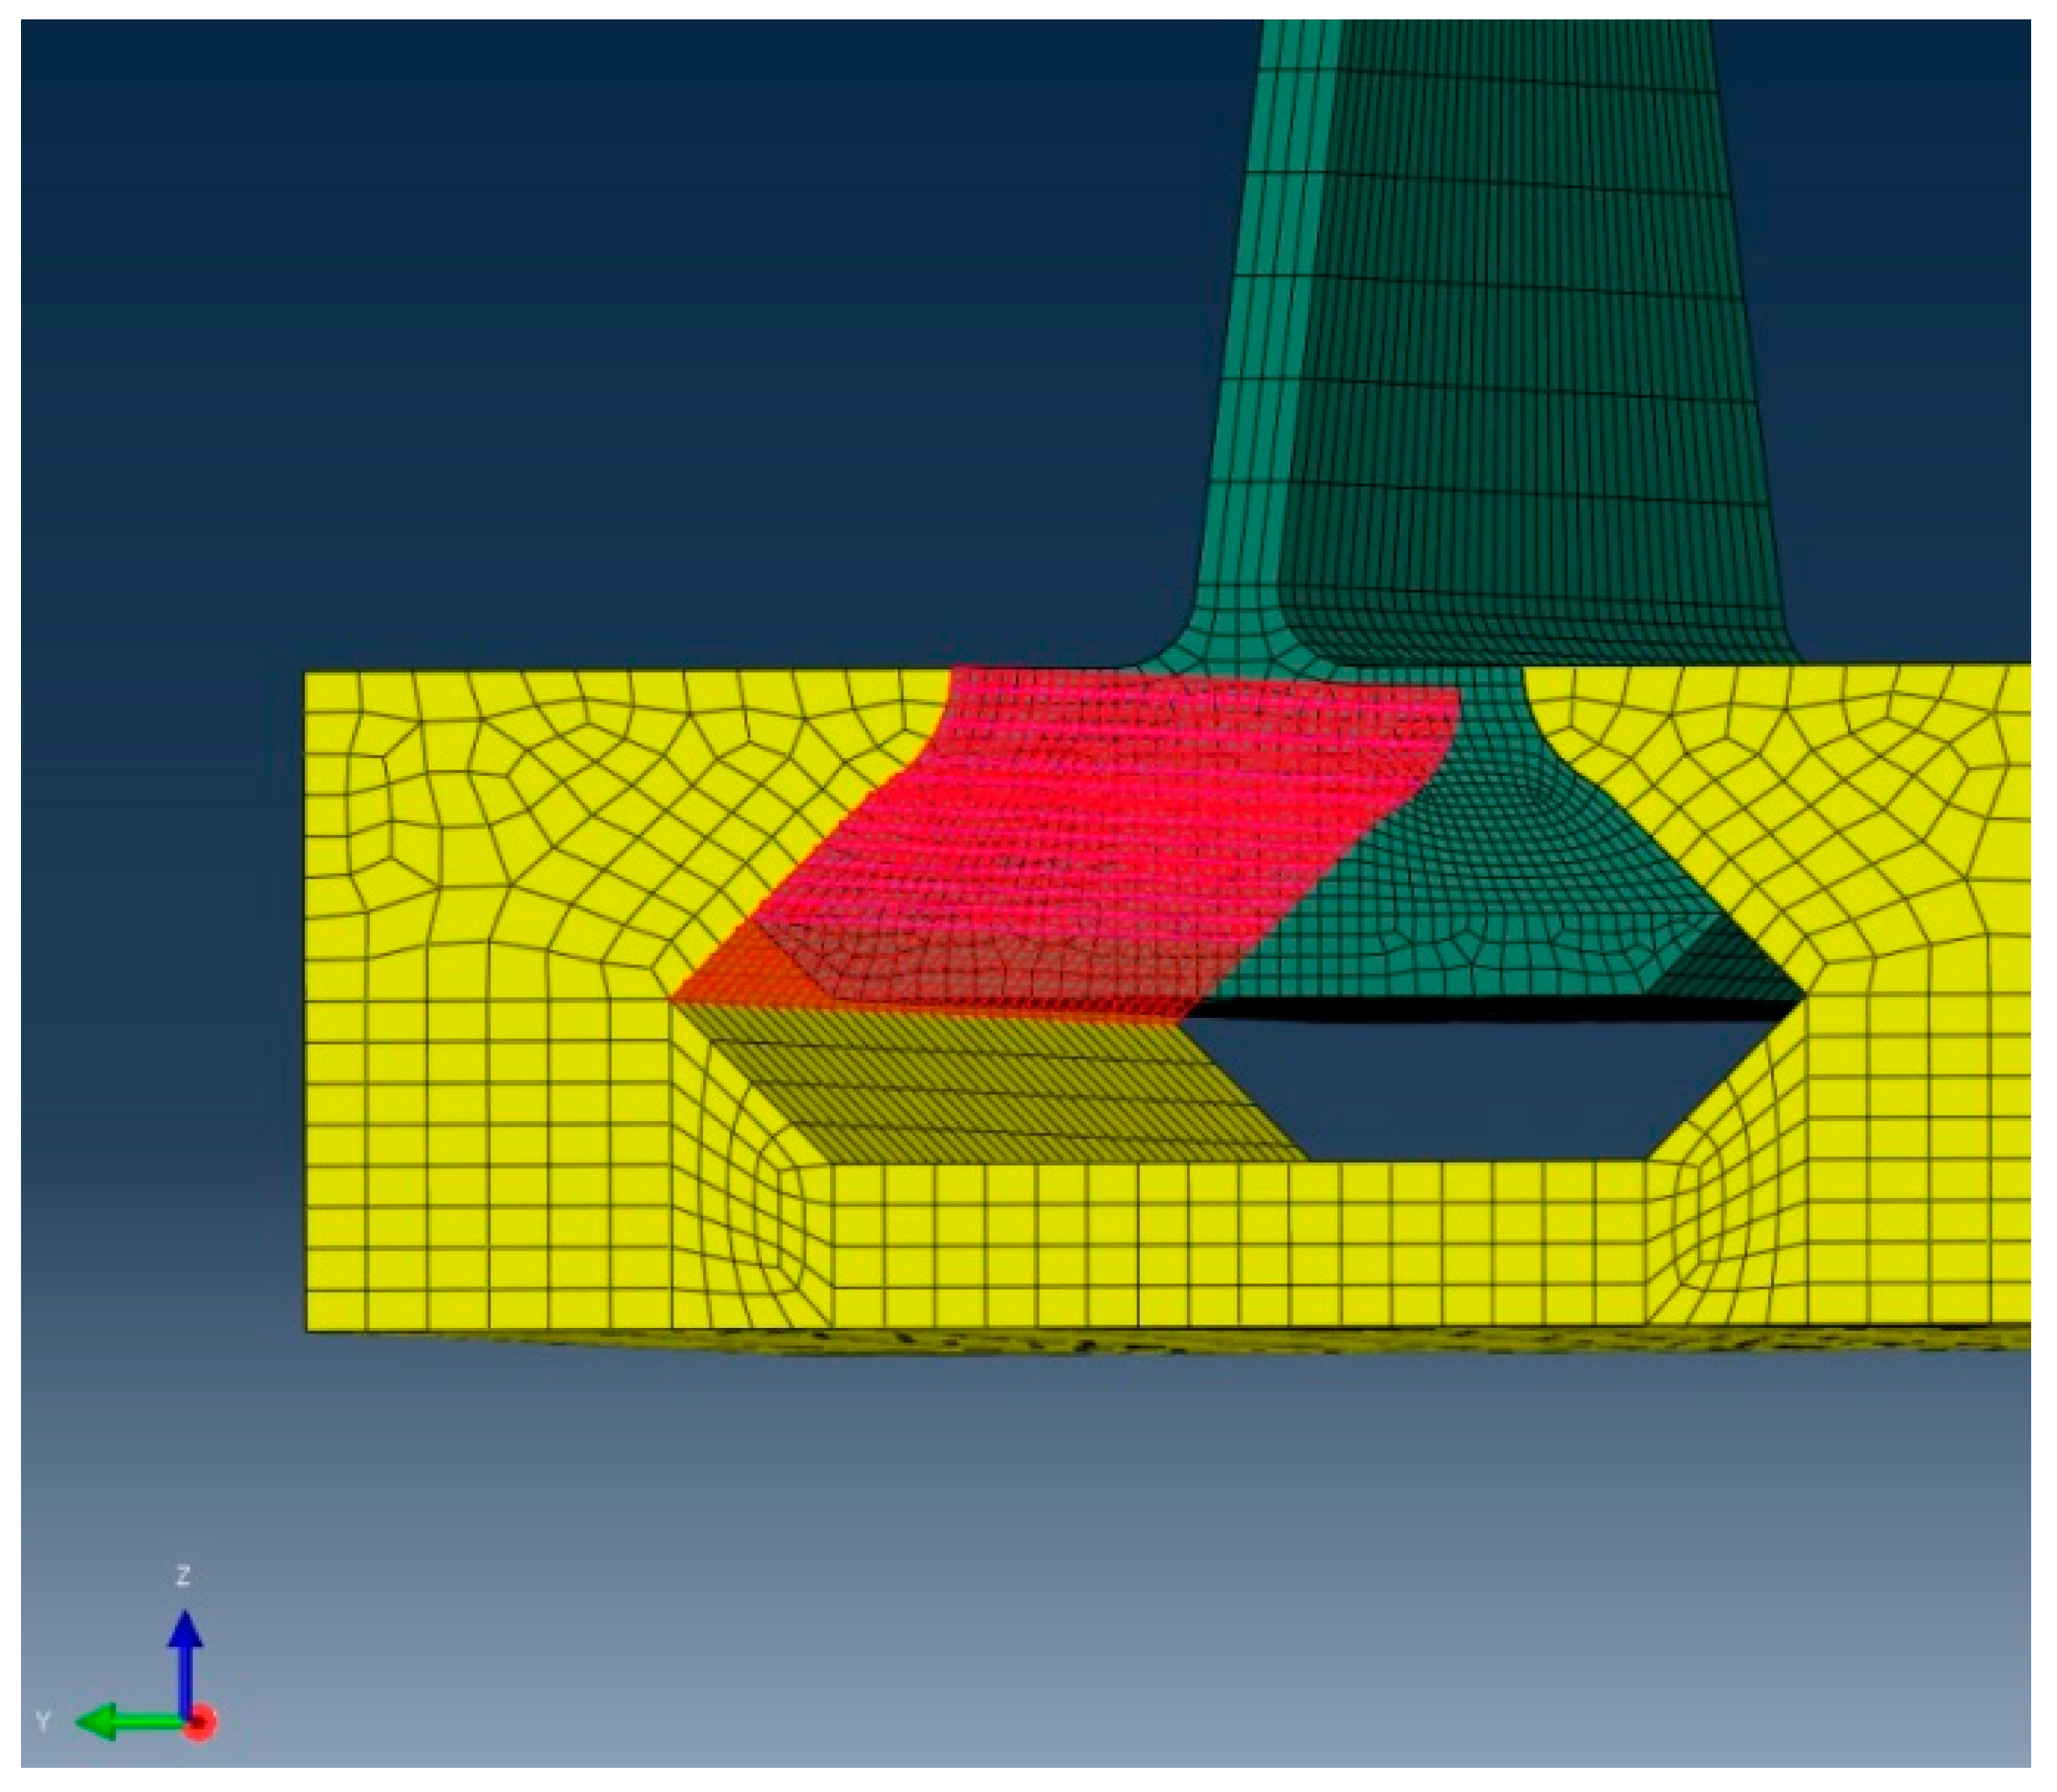
Figure 10.
Three crack paths where the stress intensity was computed.
Figure 10.
Three crack paths where the stress intensity was computed.
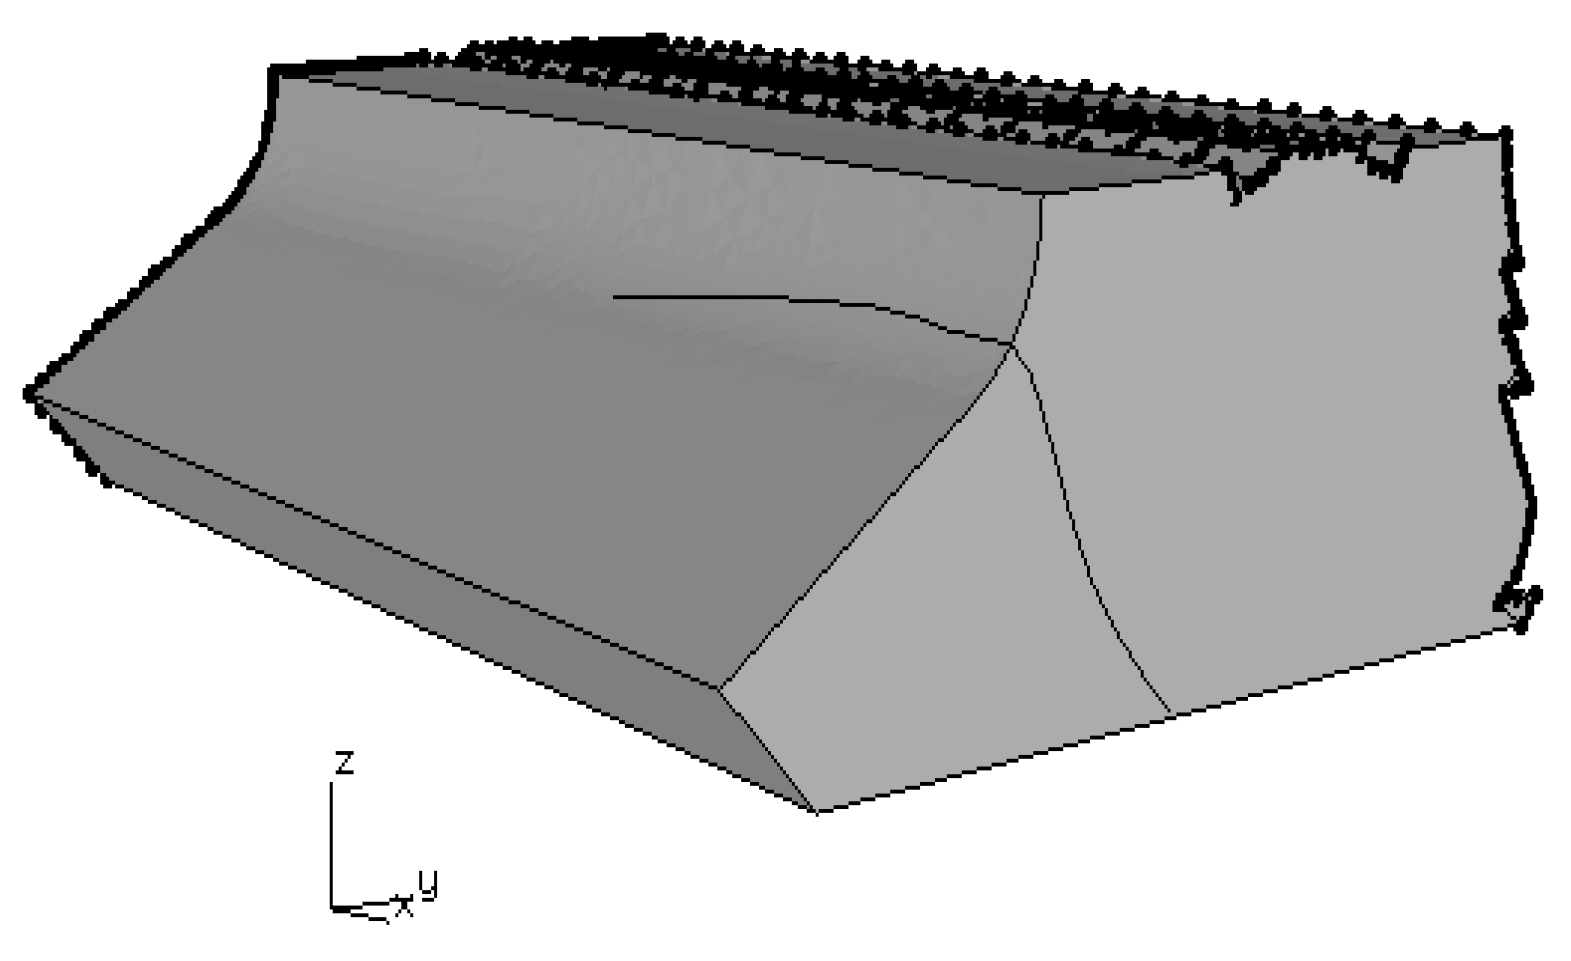
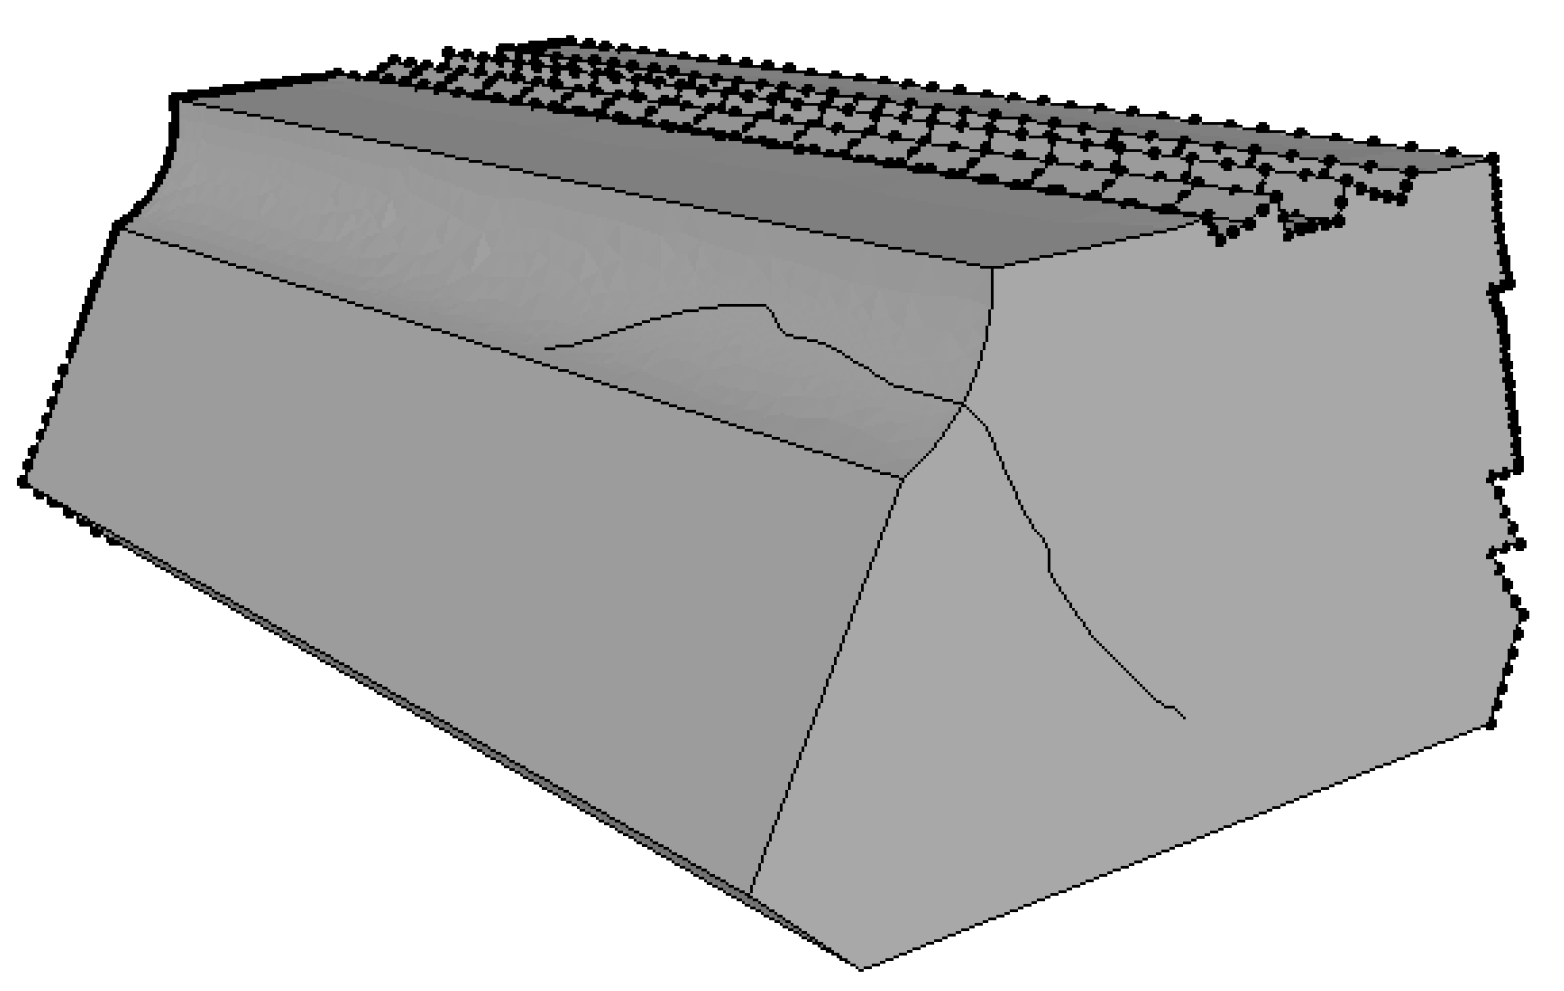
Figure 11.
The 30° angle, short flank crack shape.
Figure 11.
The 30° angle, short flank crack shape.
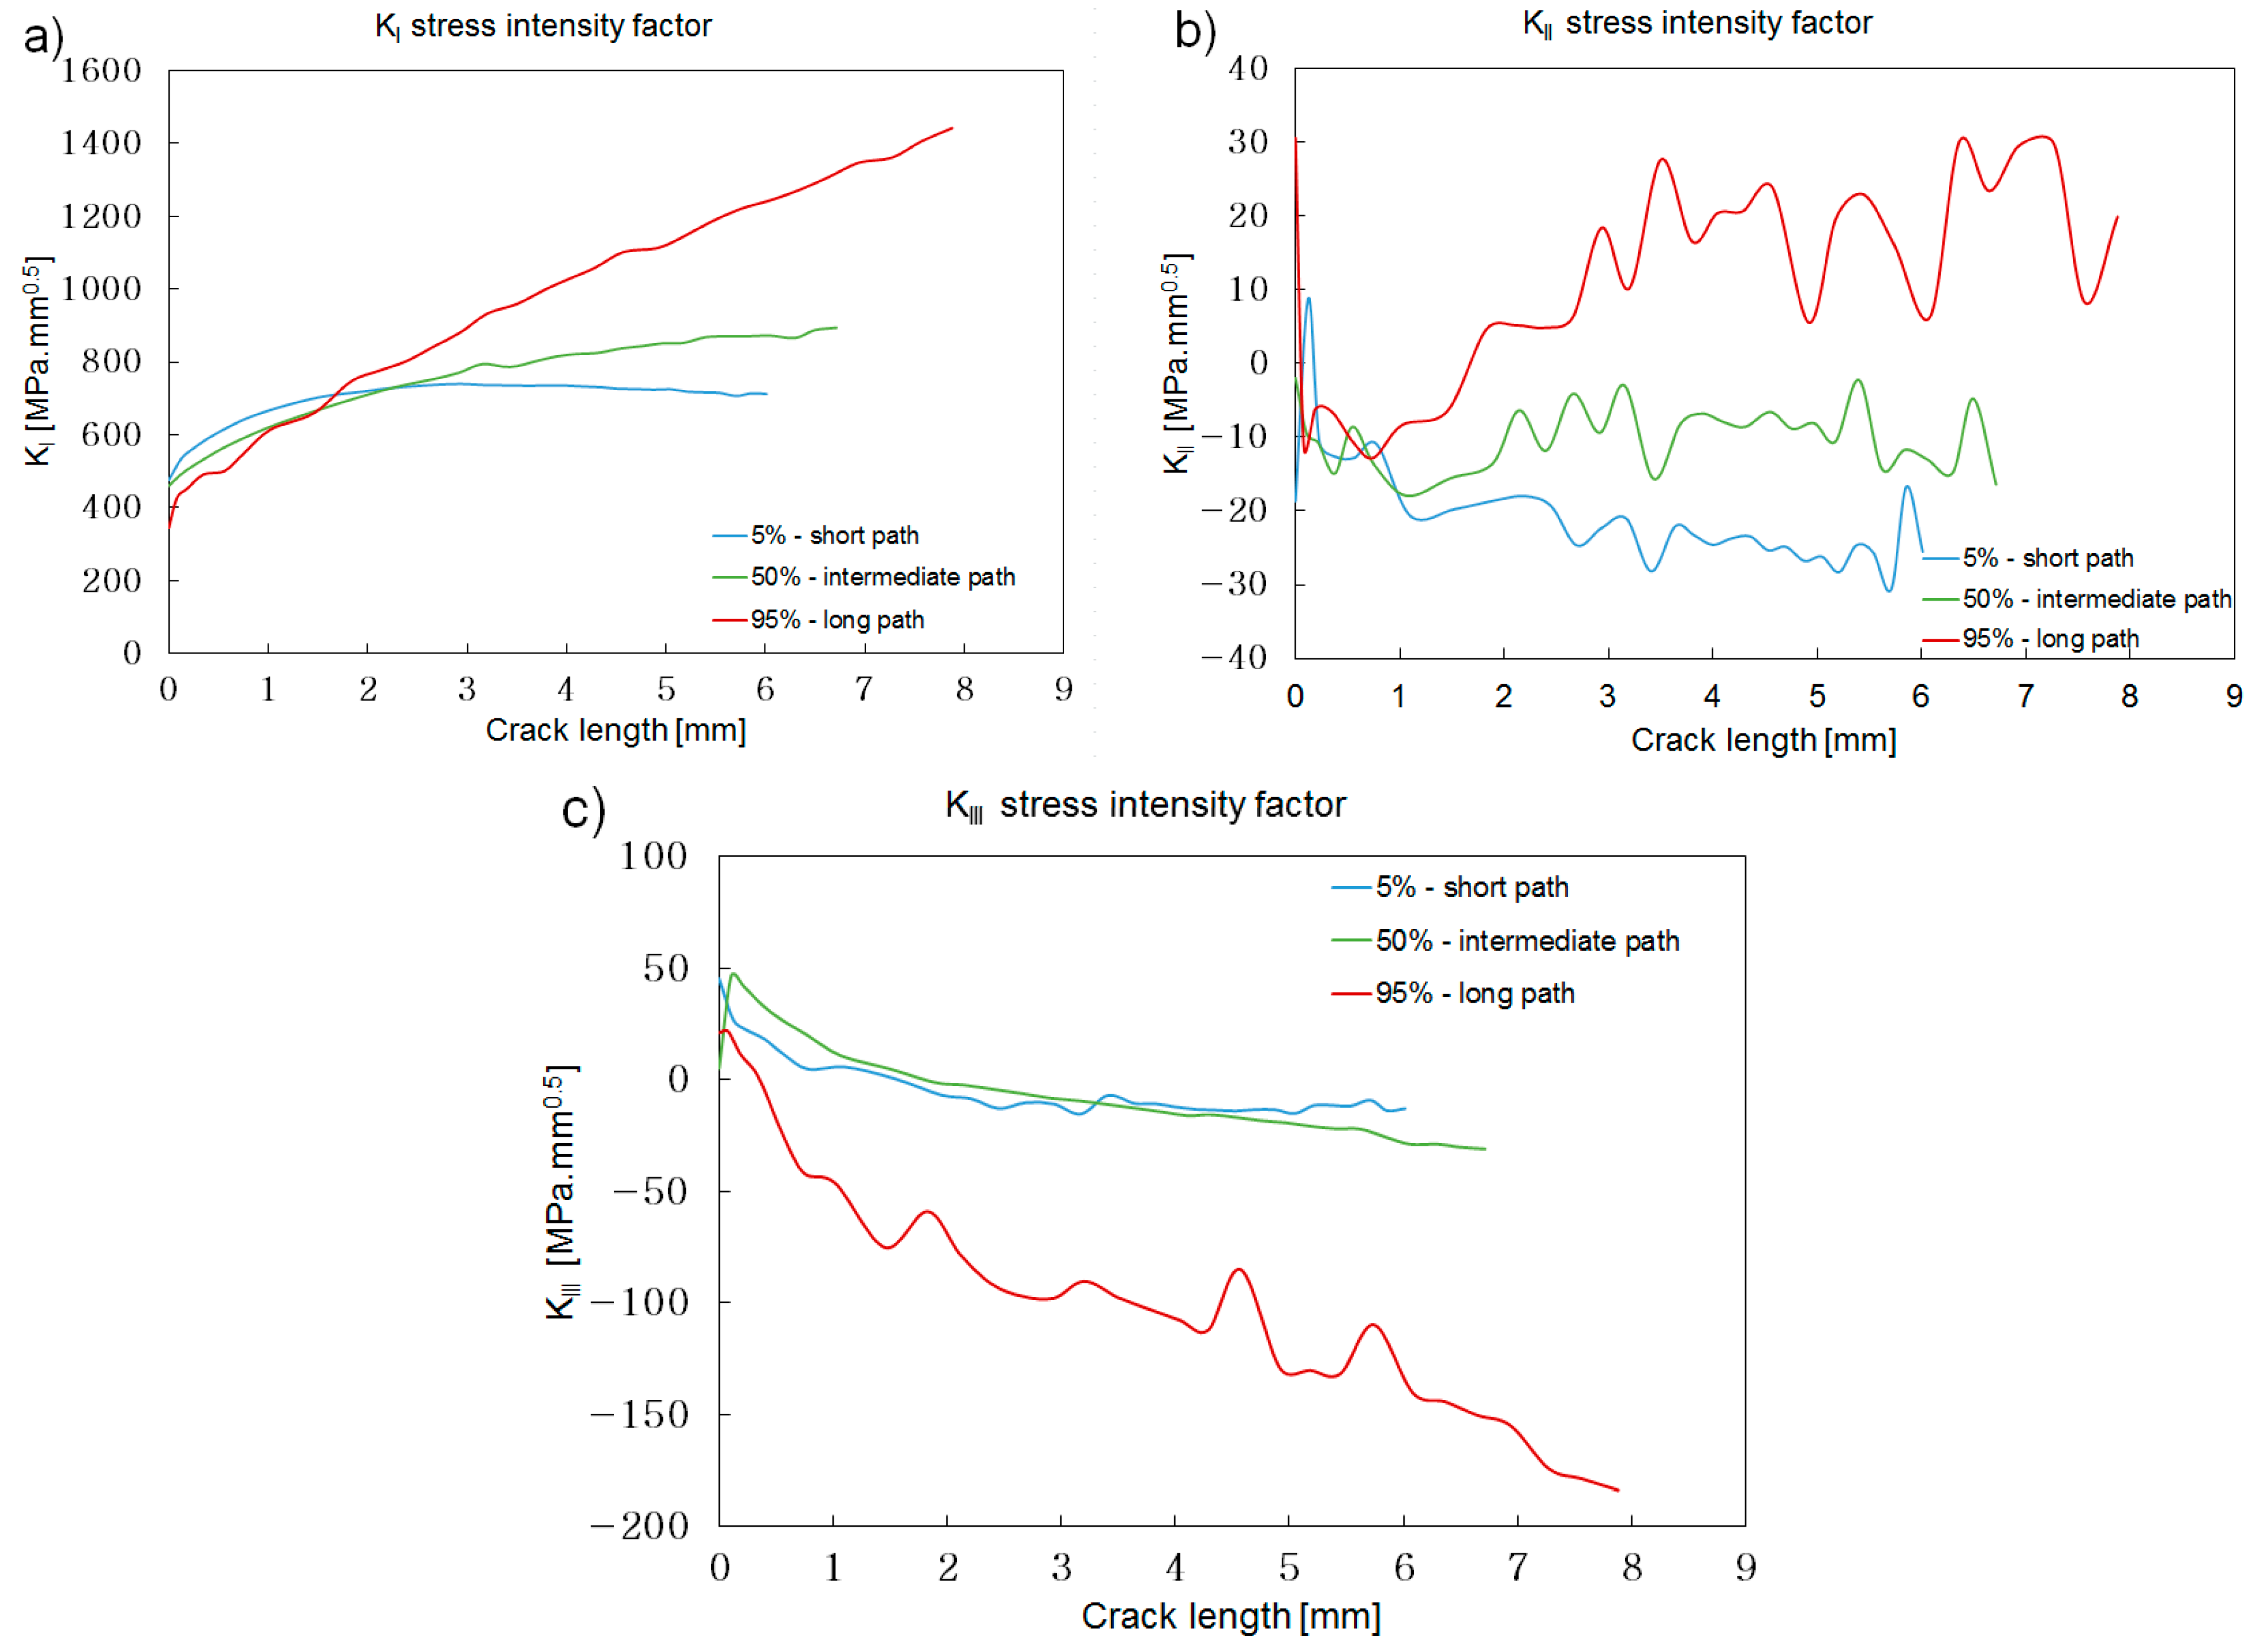
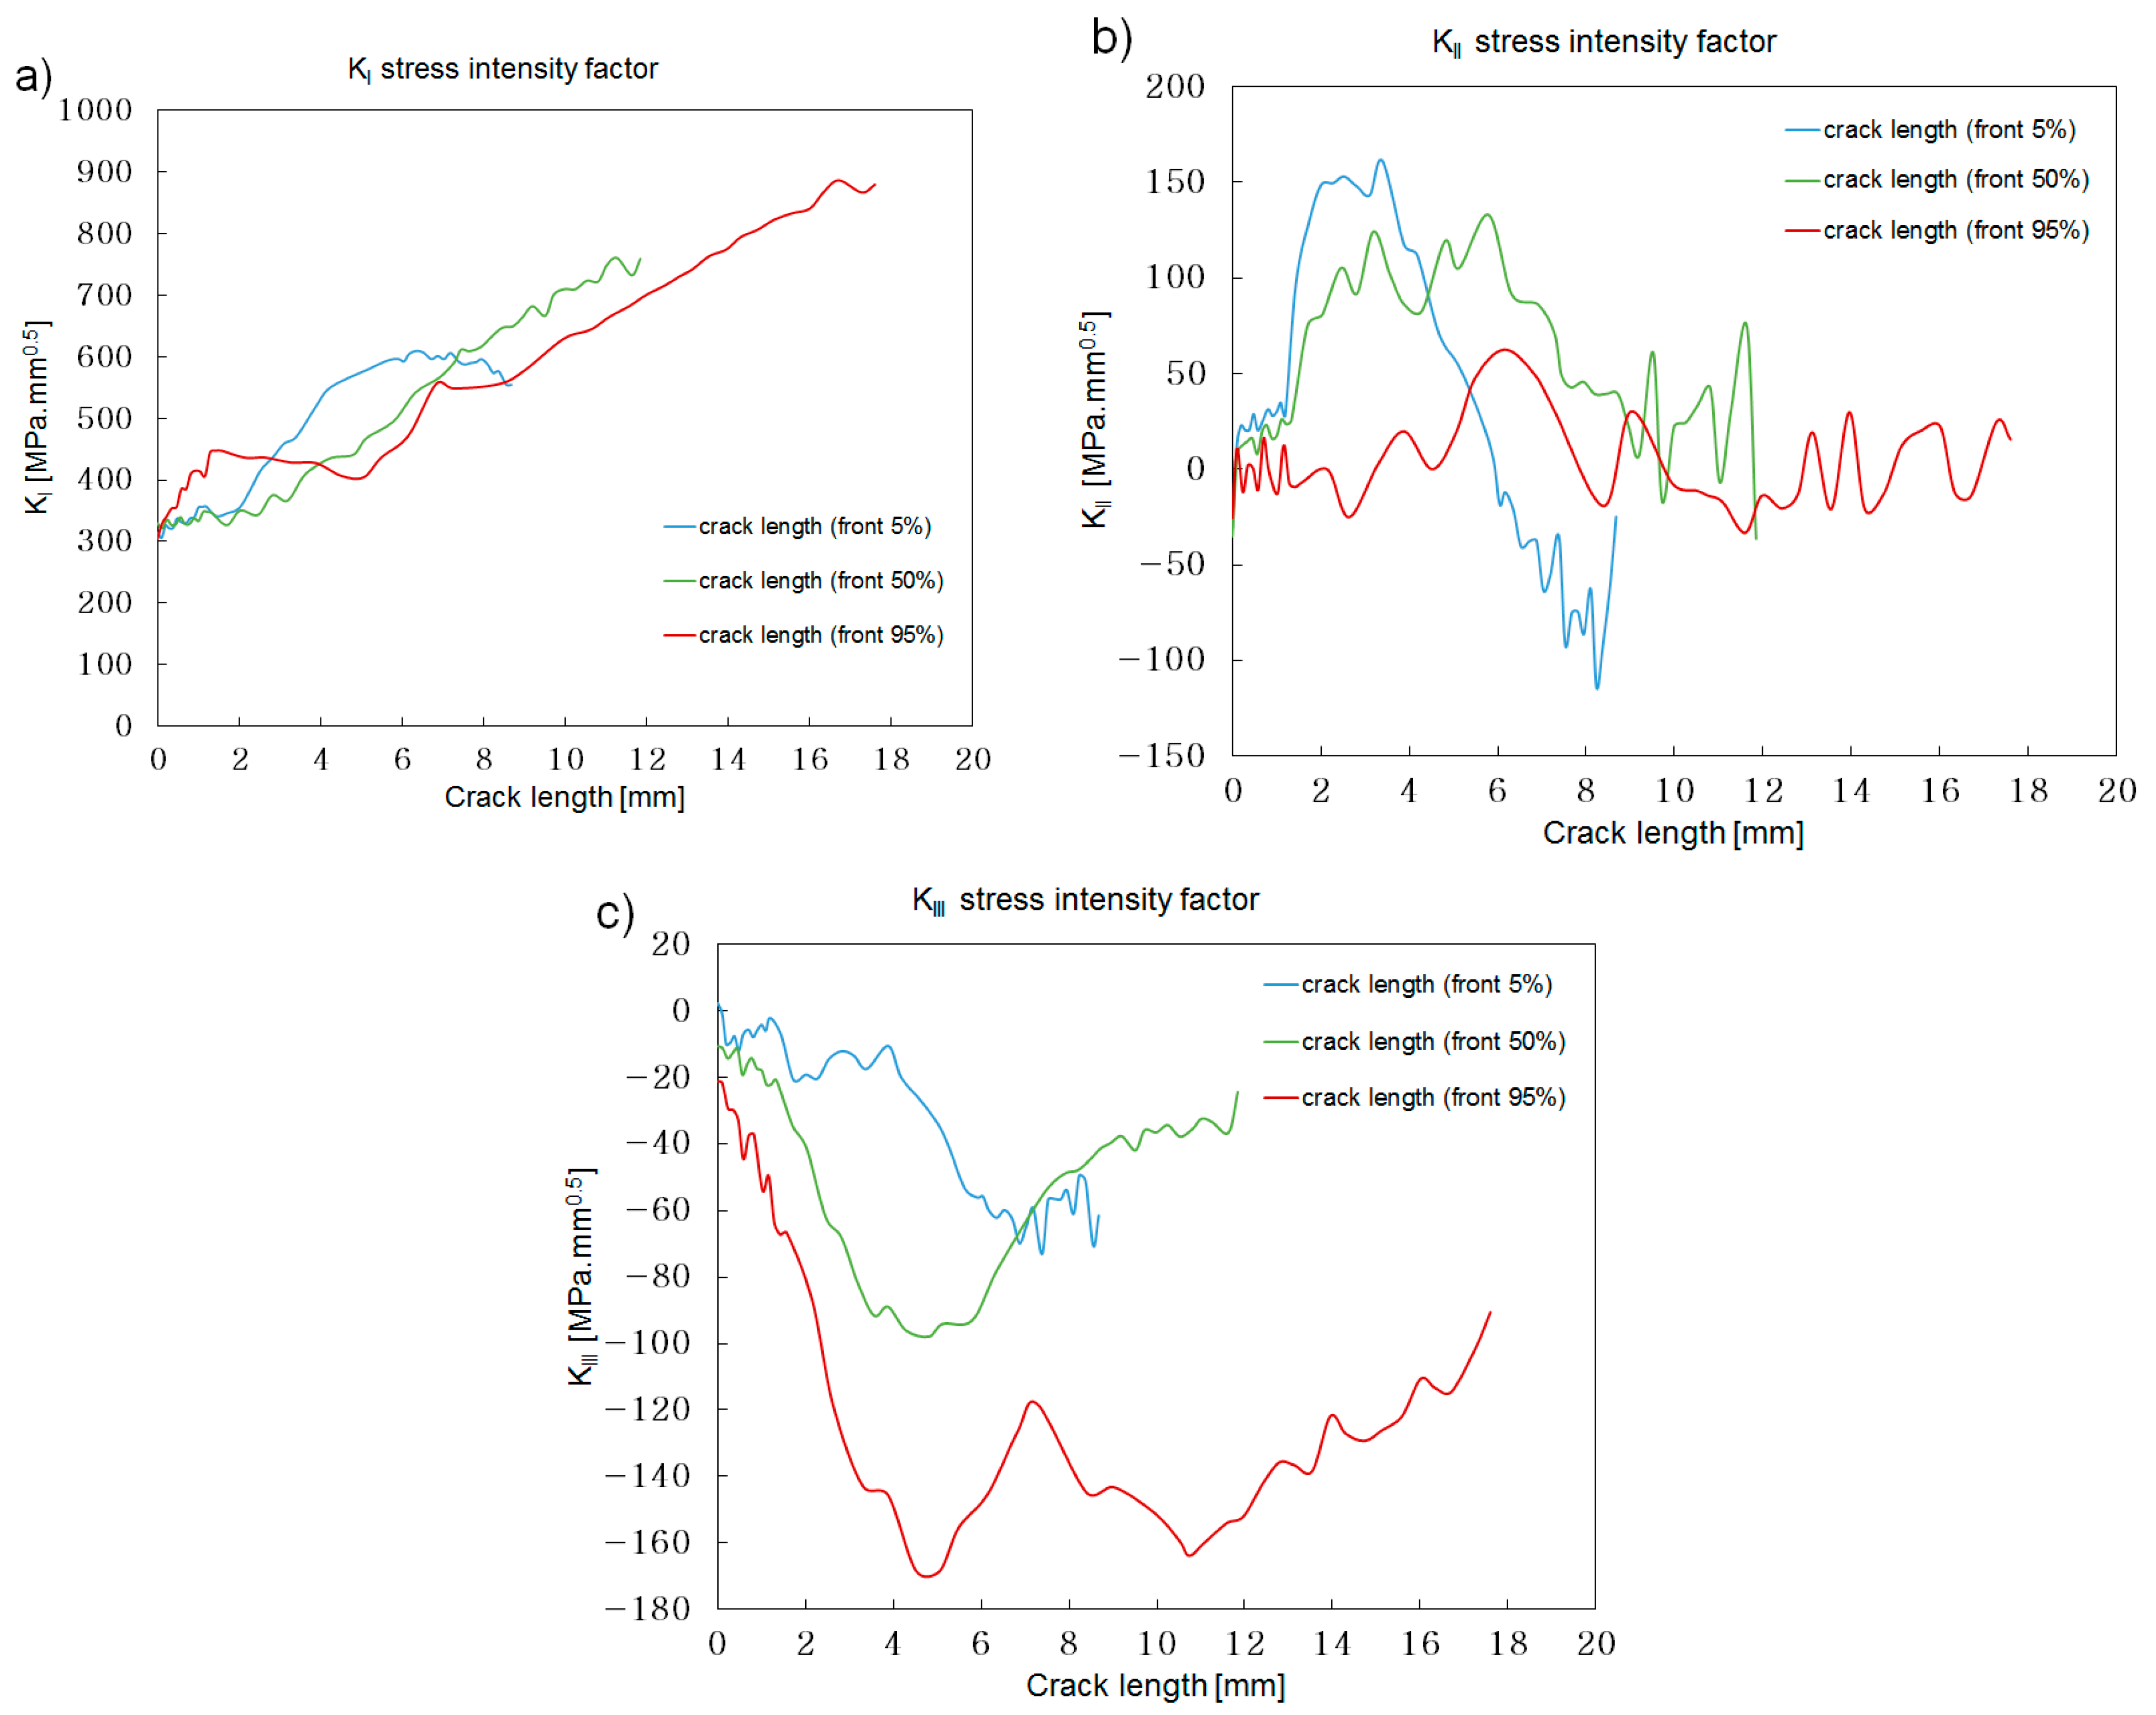
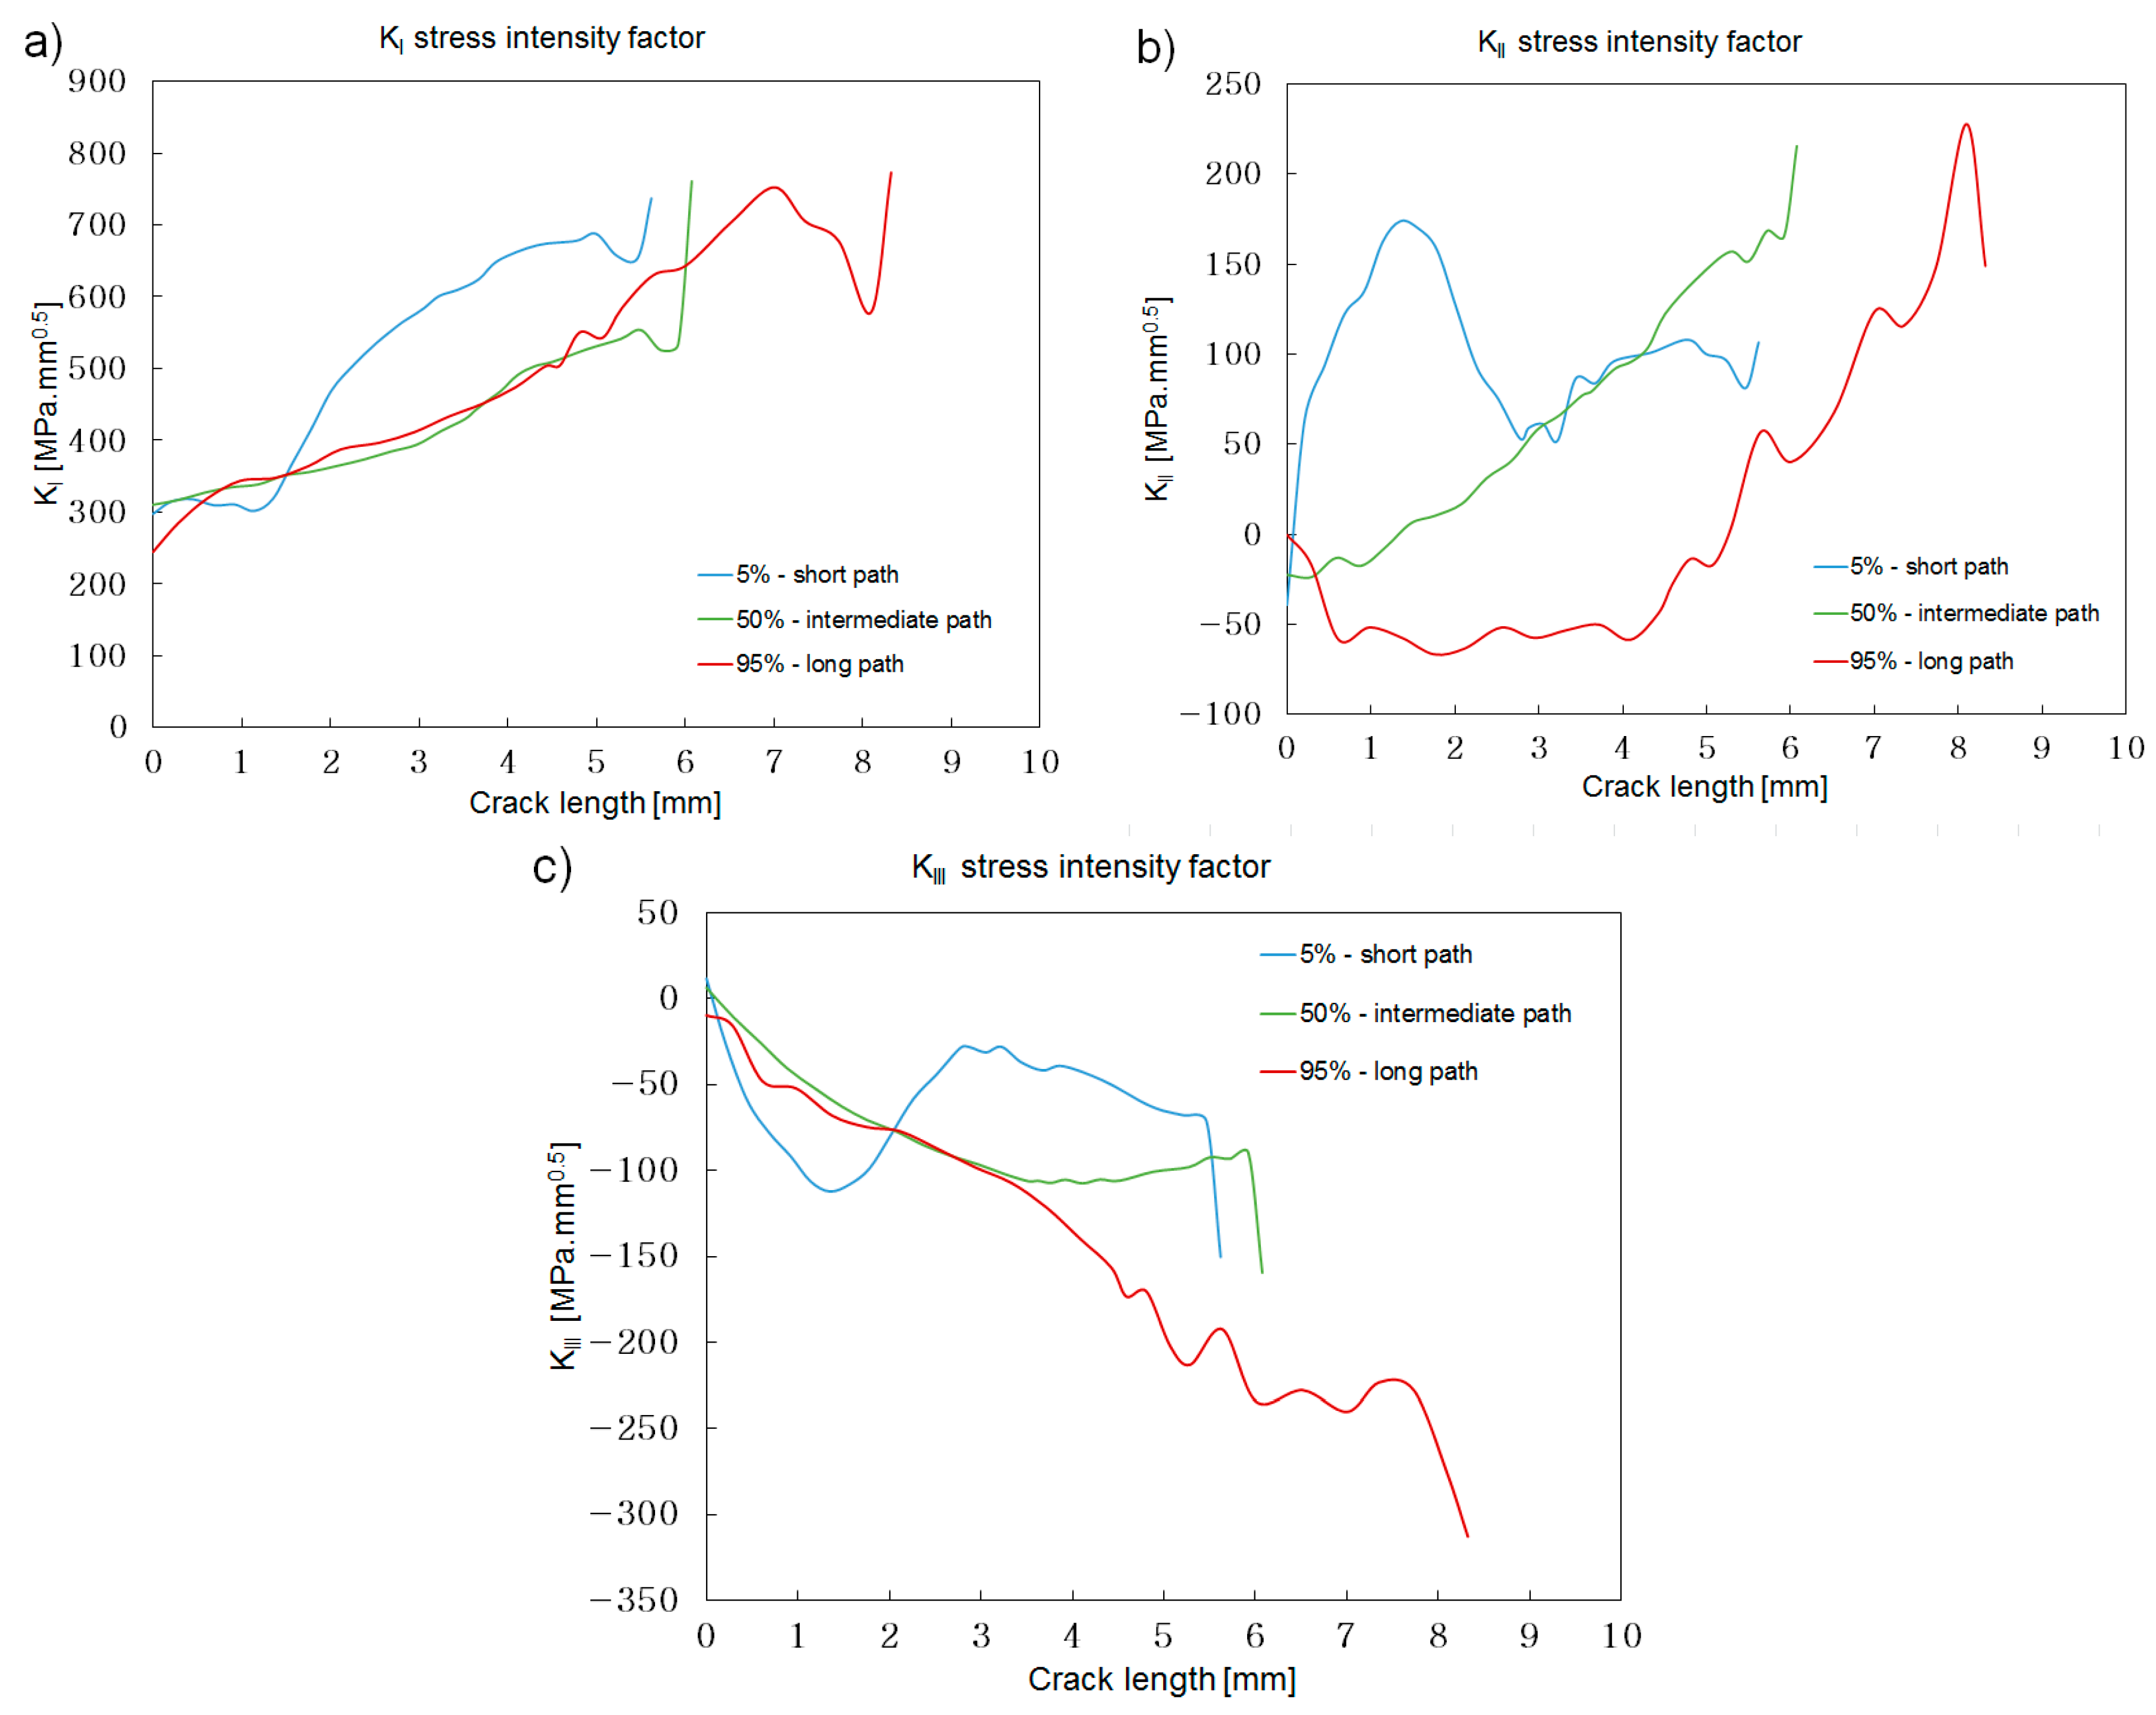
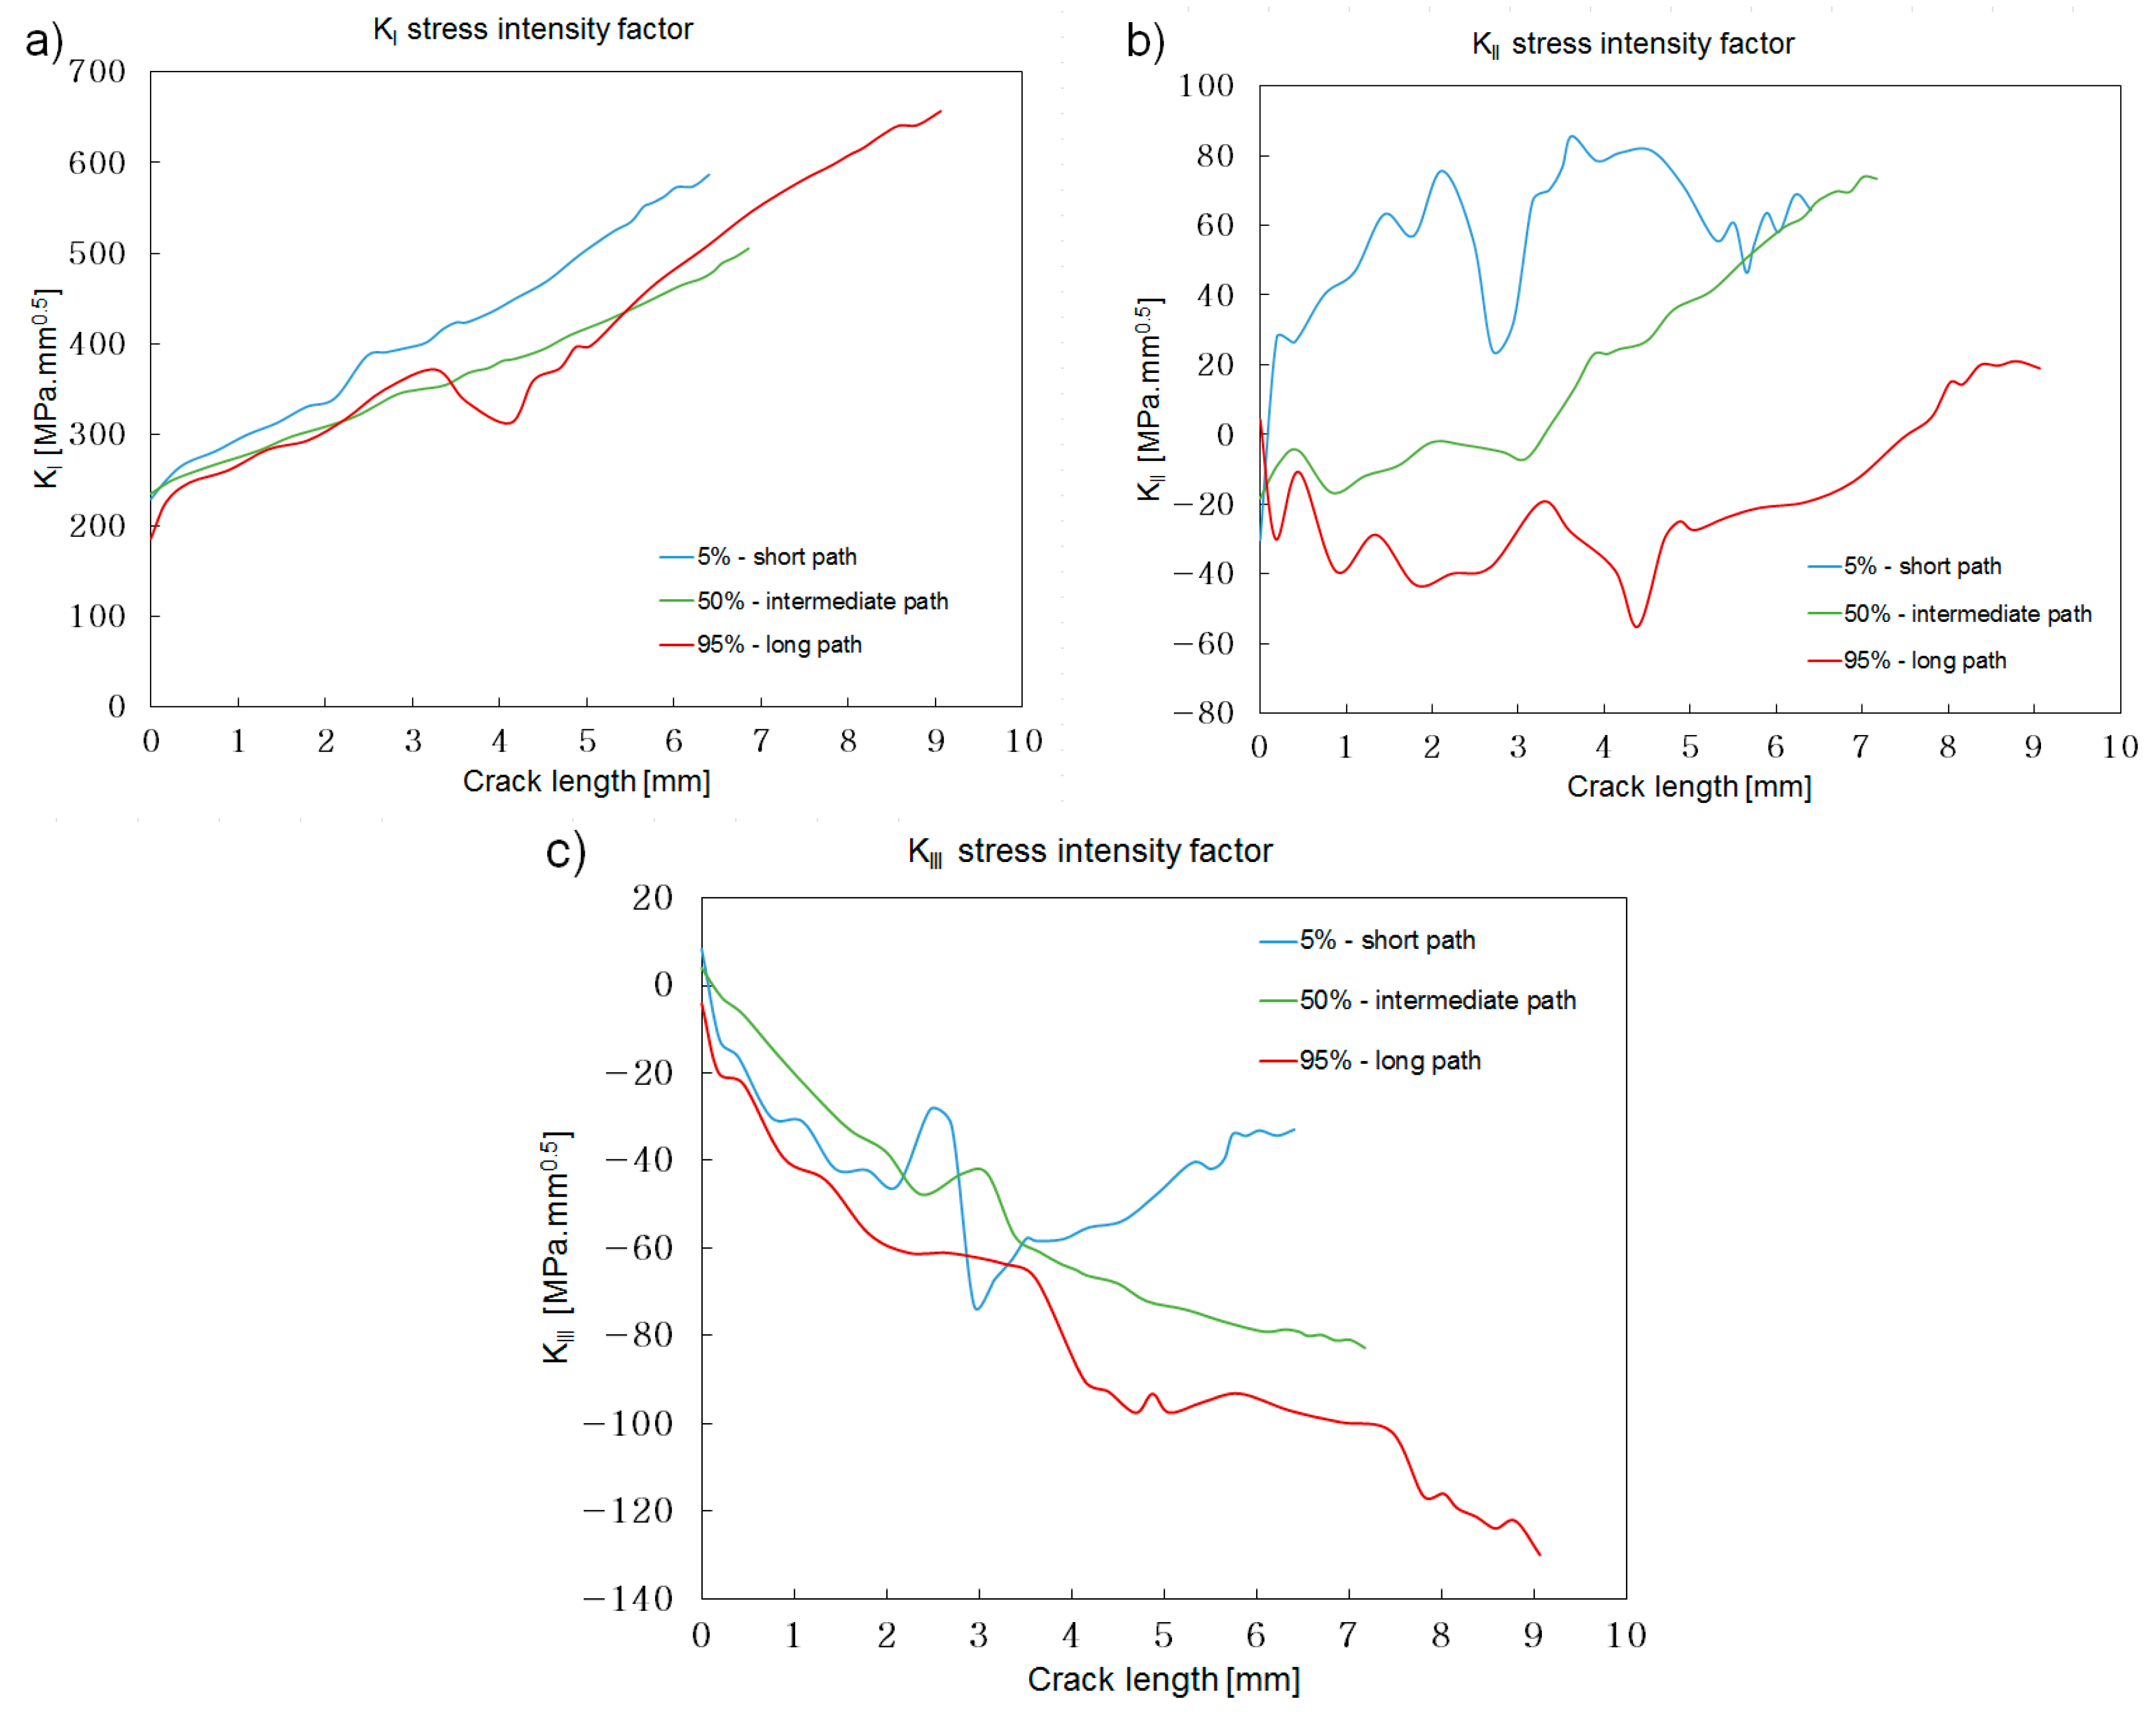
Figure 12.
The 30° angle, short flank stress intensity along the three crack paths selected: (a) KI; (b) KII; (c) KIII.
Figure 12.
The 30° angle, short flank stress intensity along the three crack paths selected: (a) KI; (b) KII; (c) KIII.
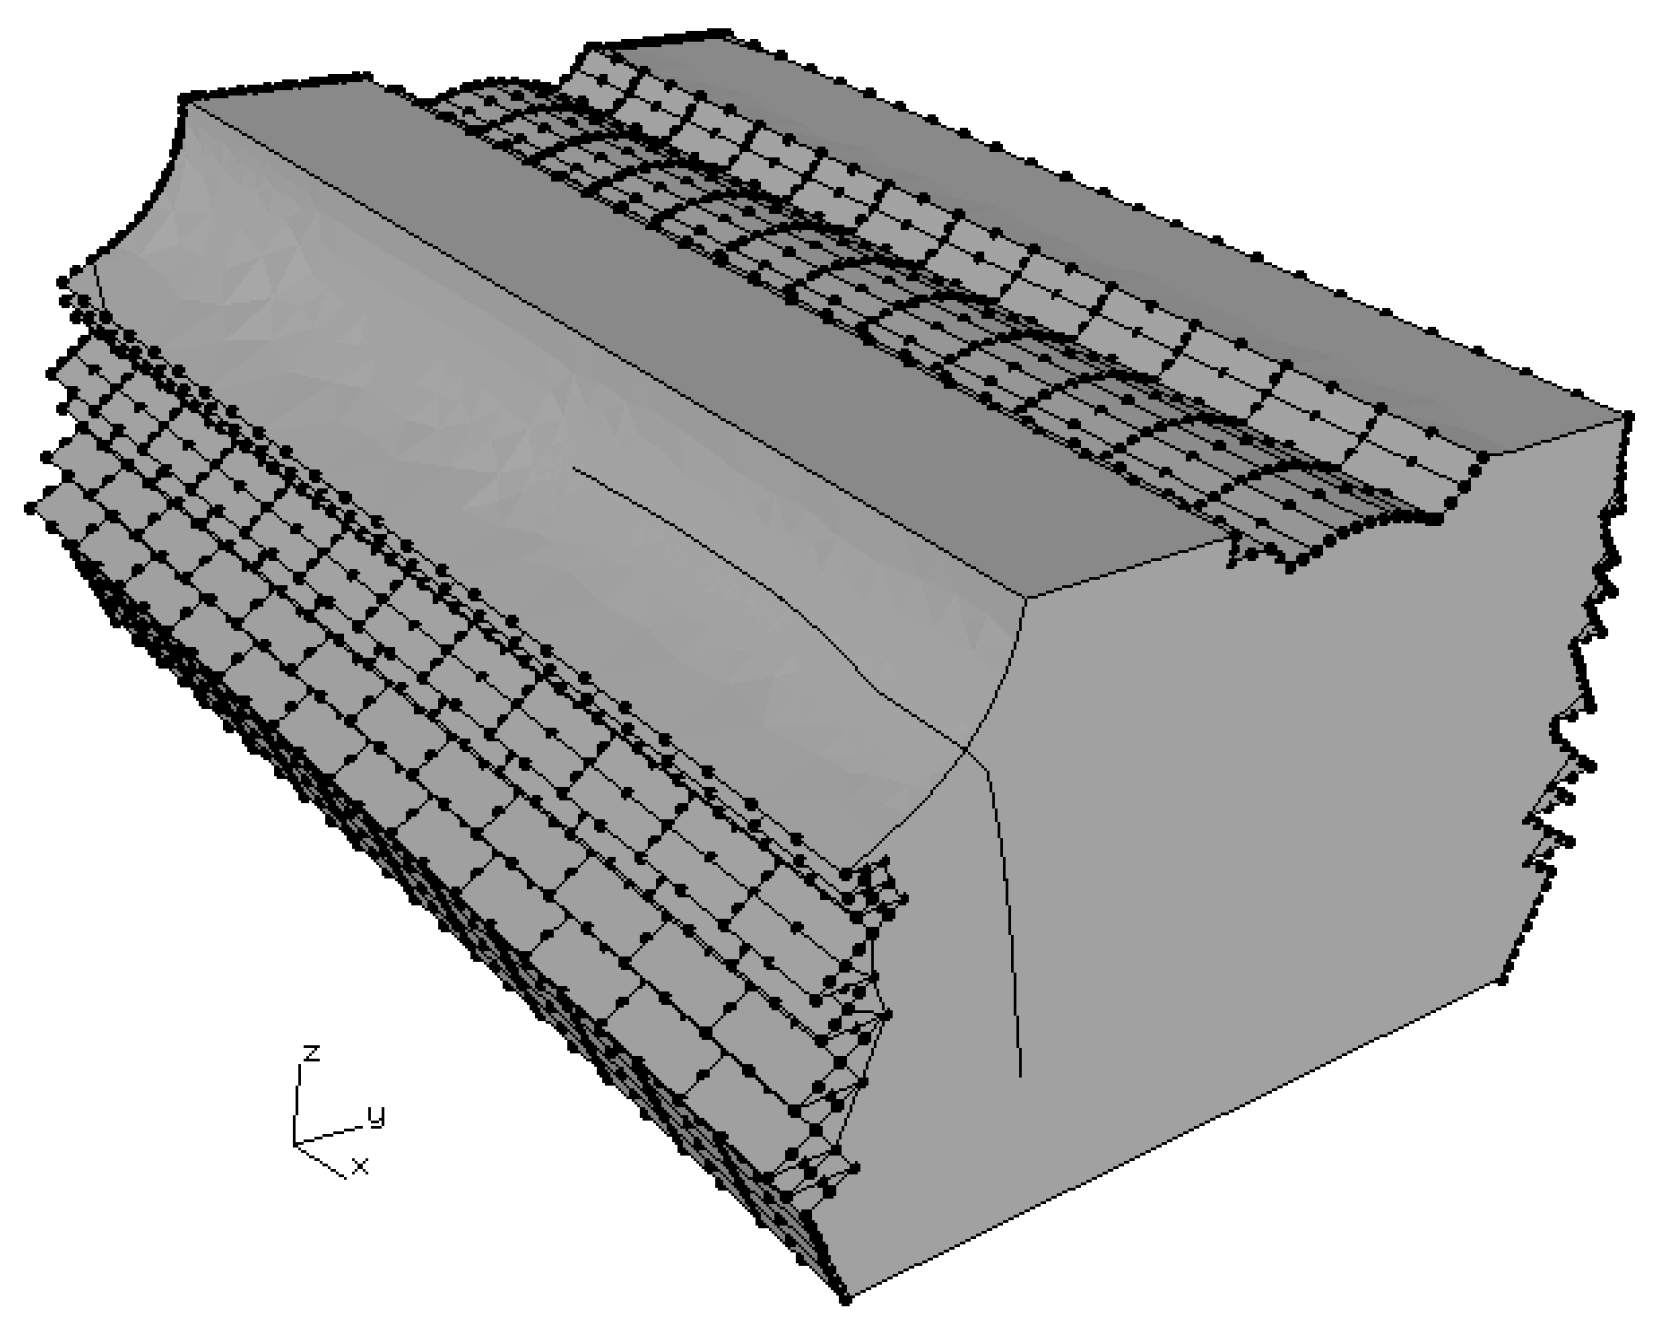
Figure 13.
The 30° angle, long flank crack shape.
Figure 13.
The 30° angle, long flank crack shape.
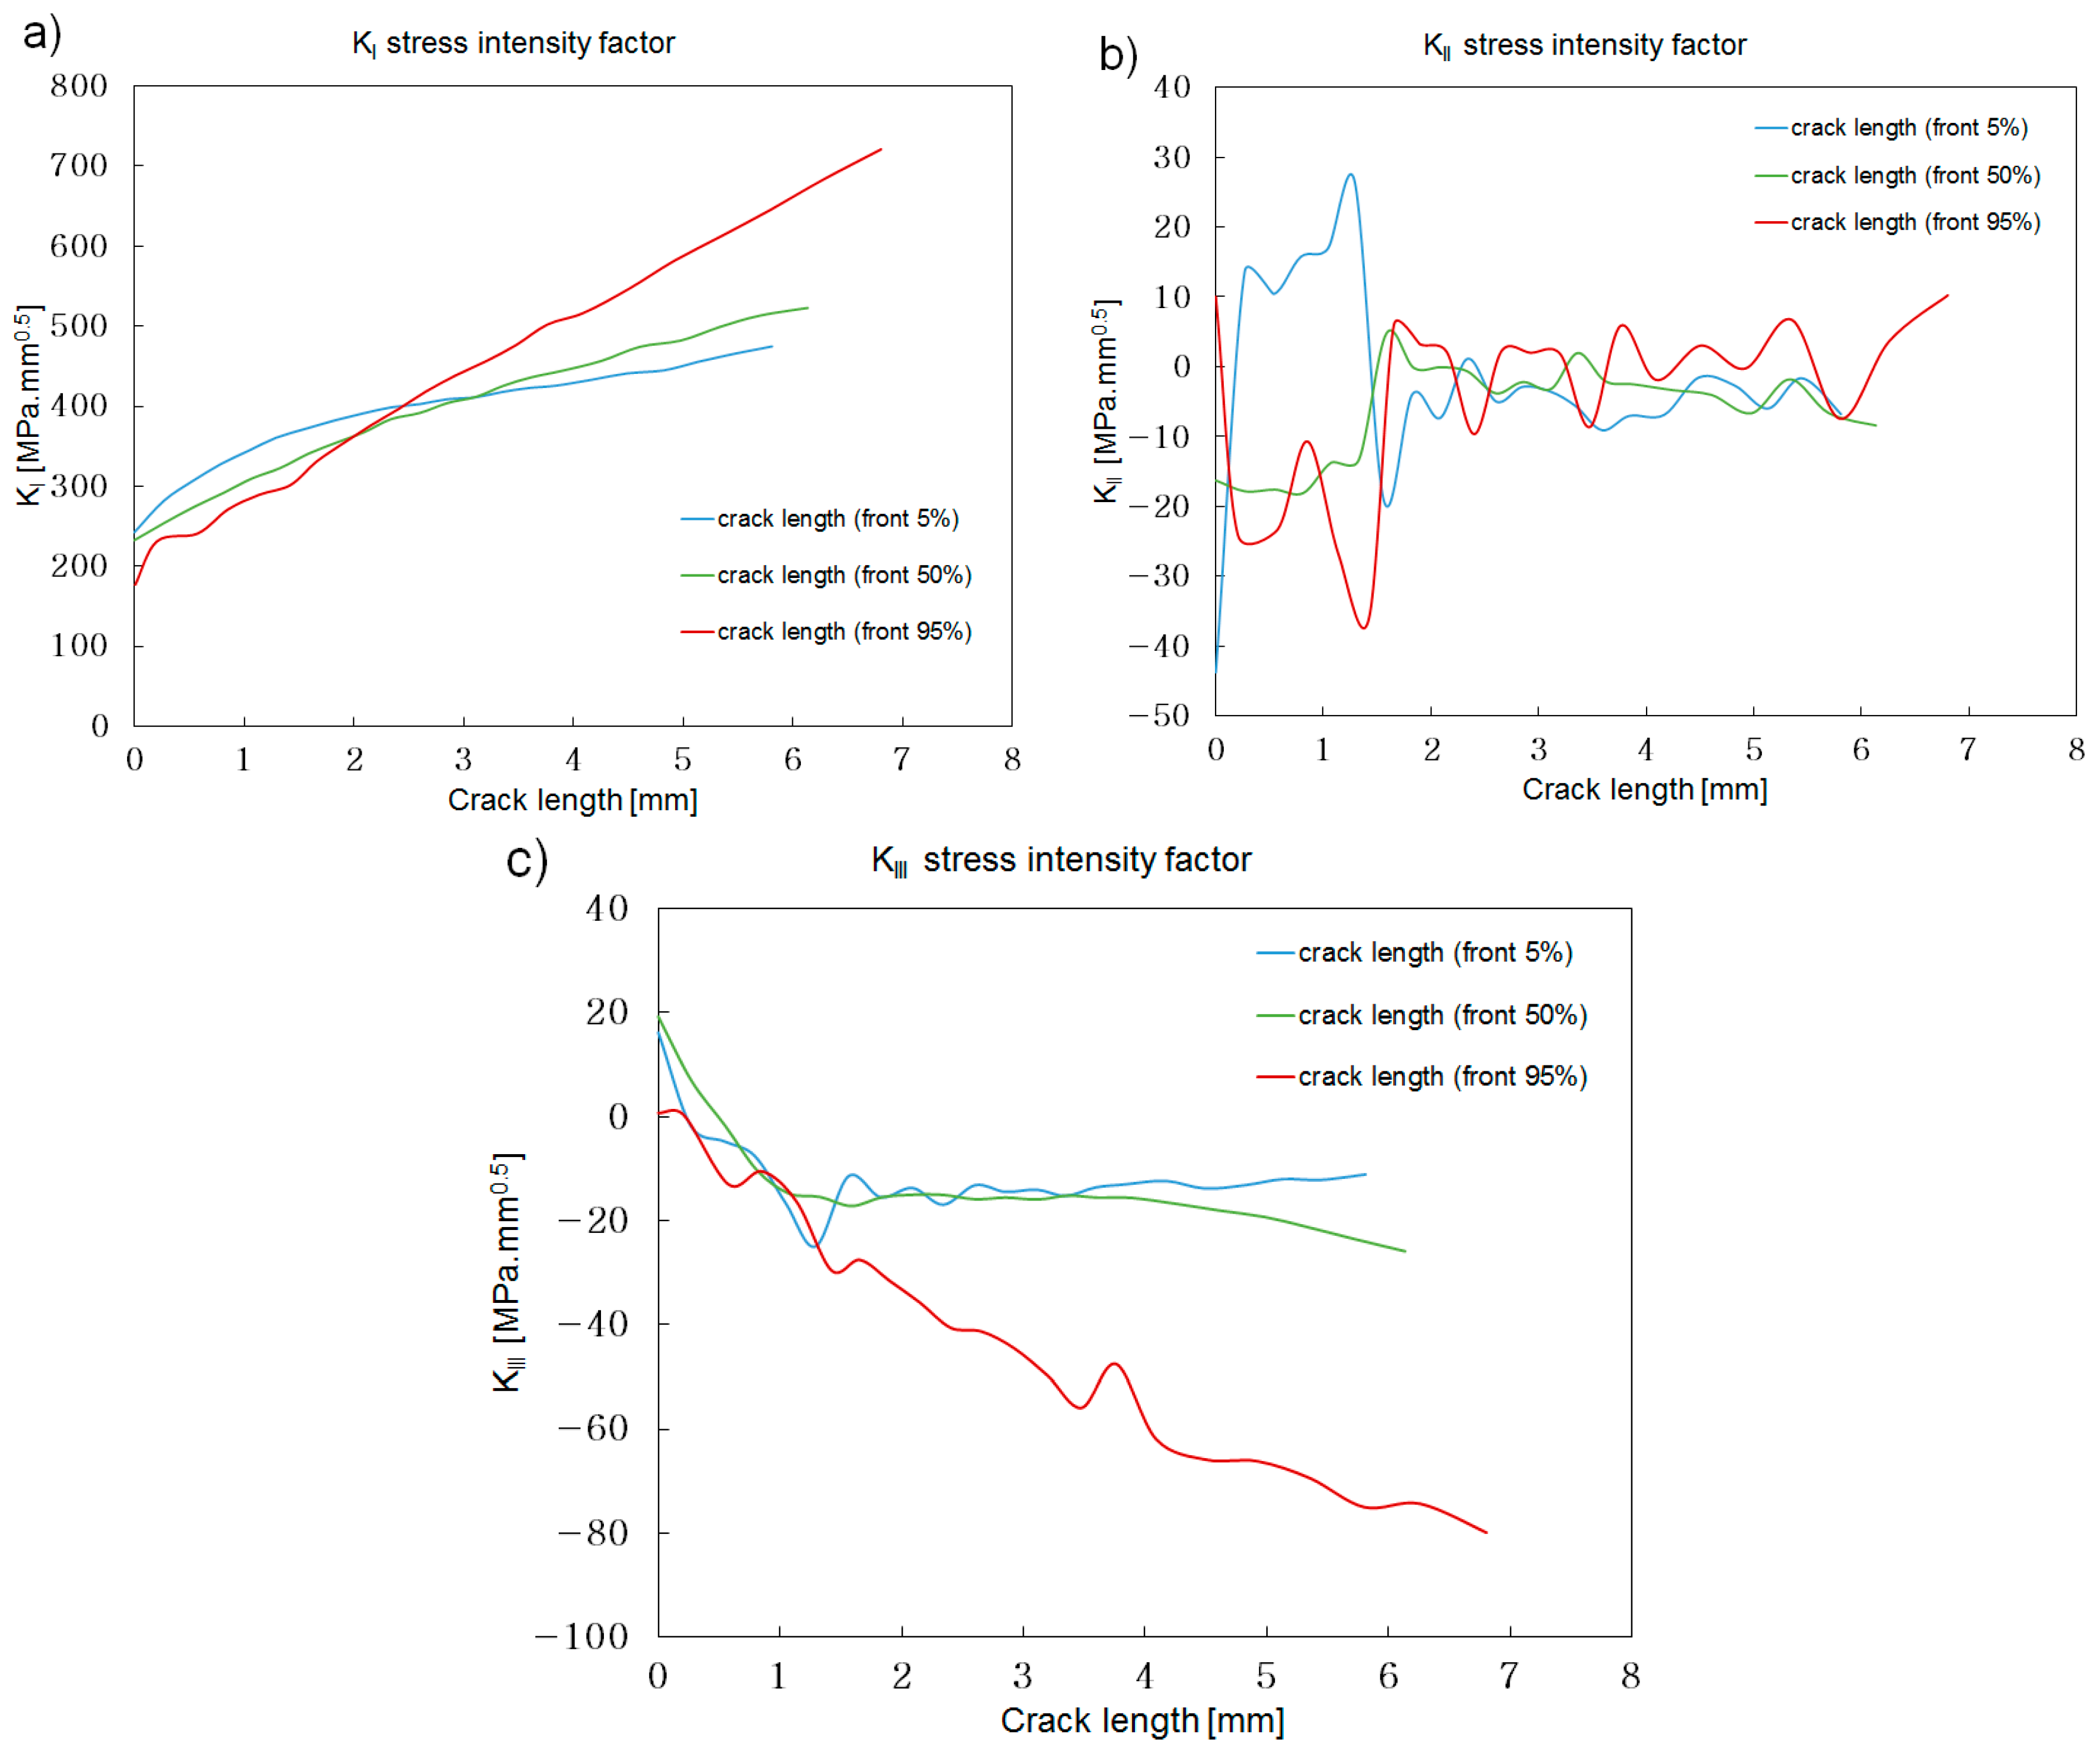
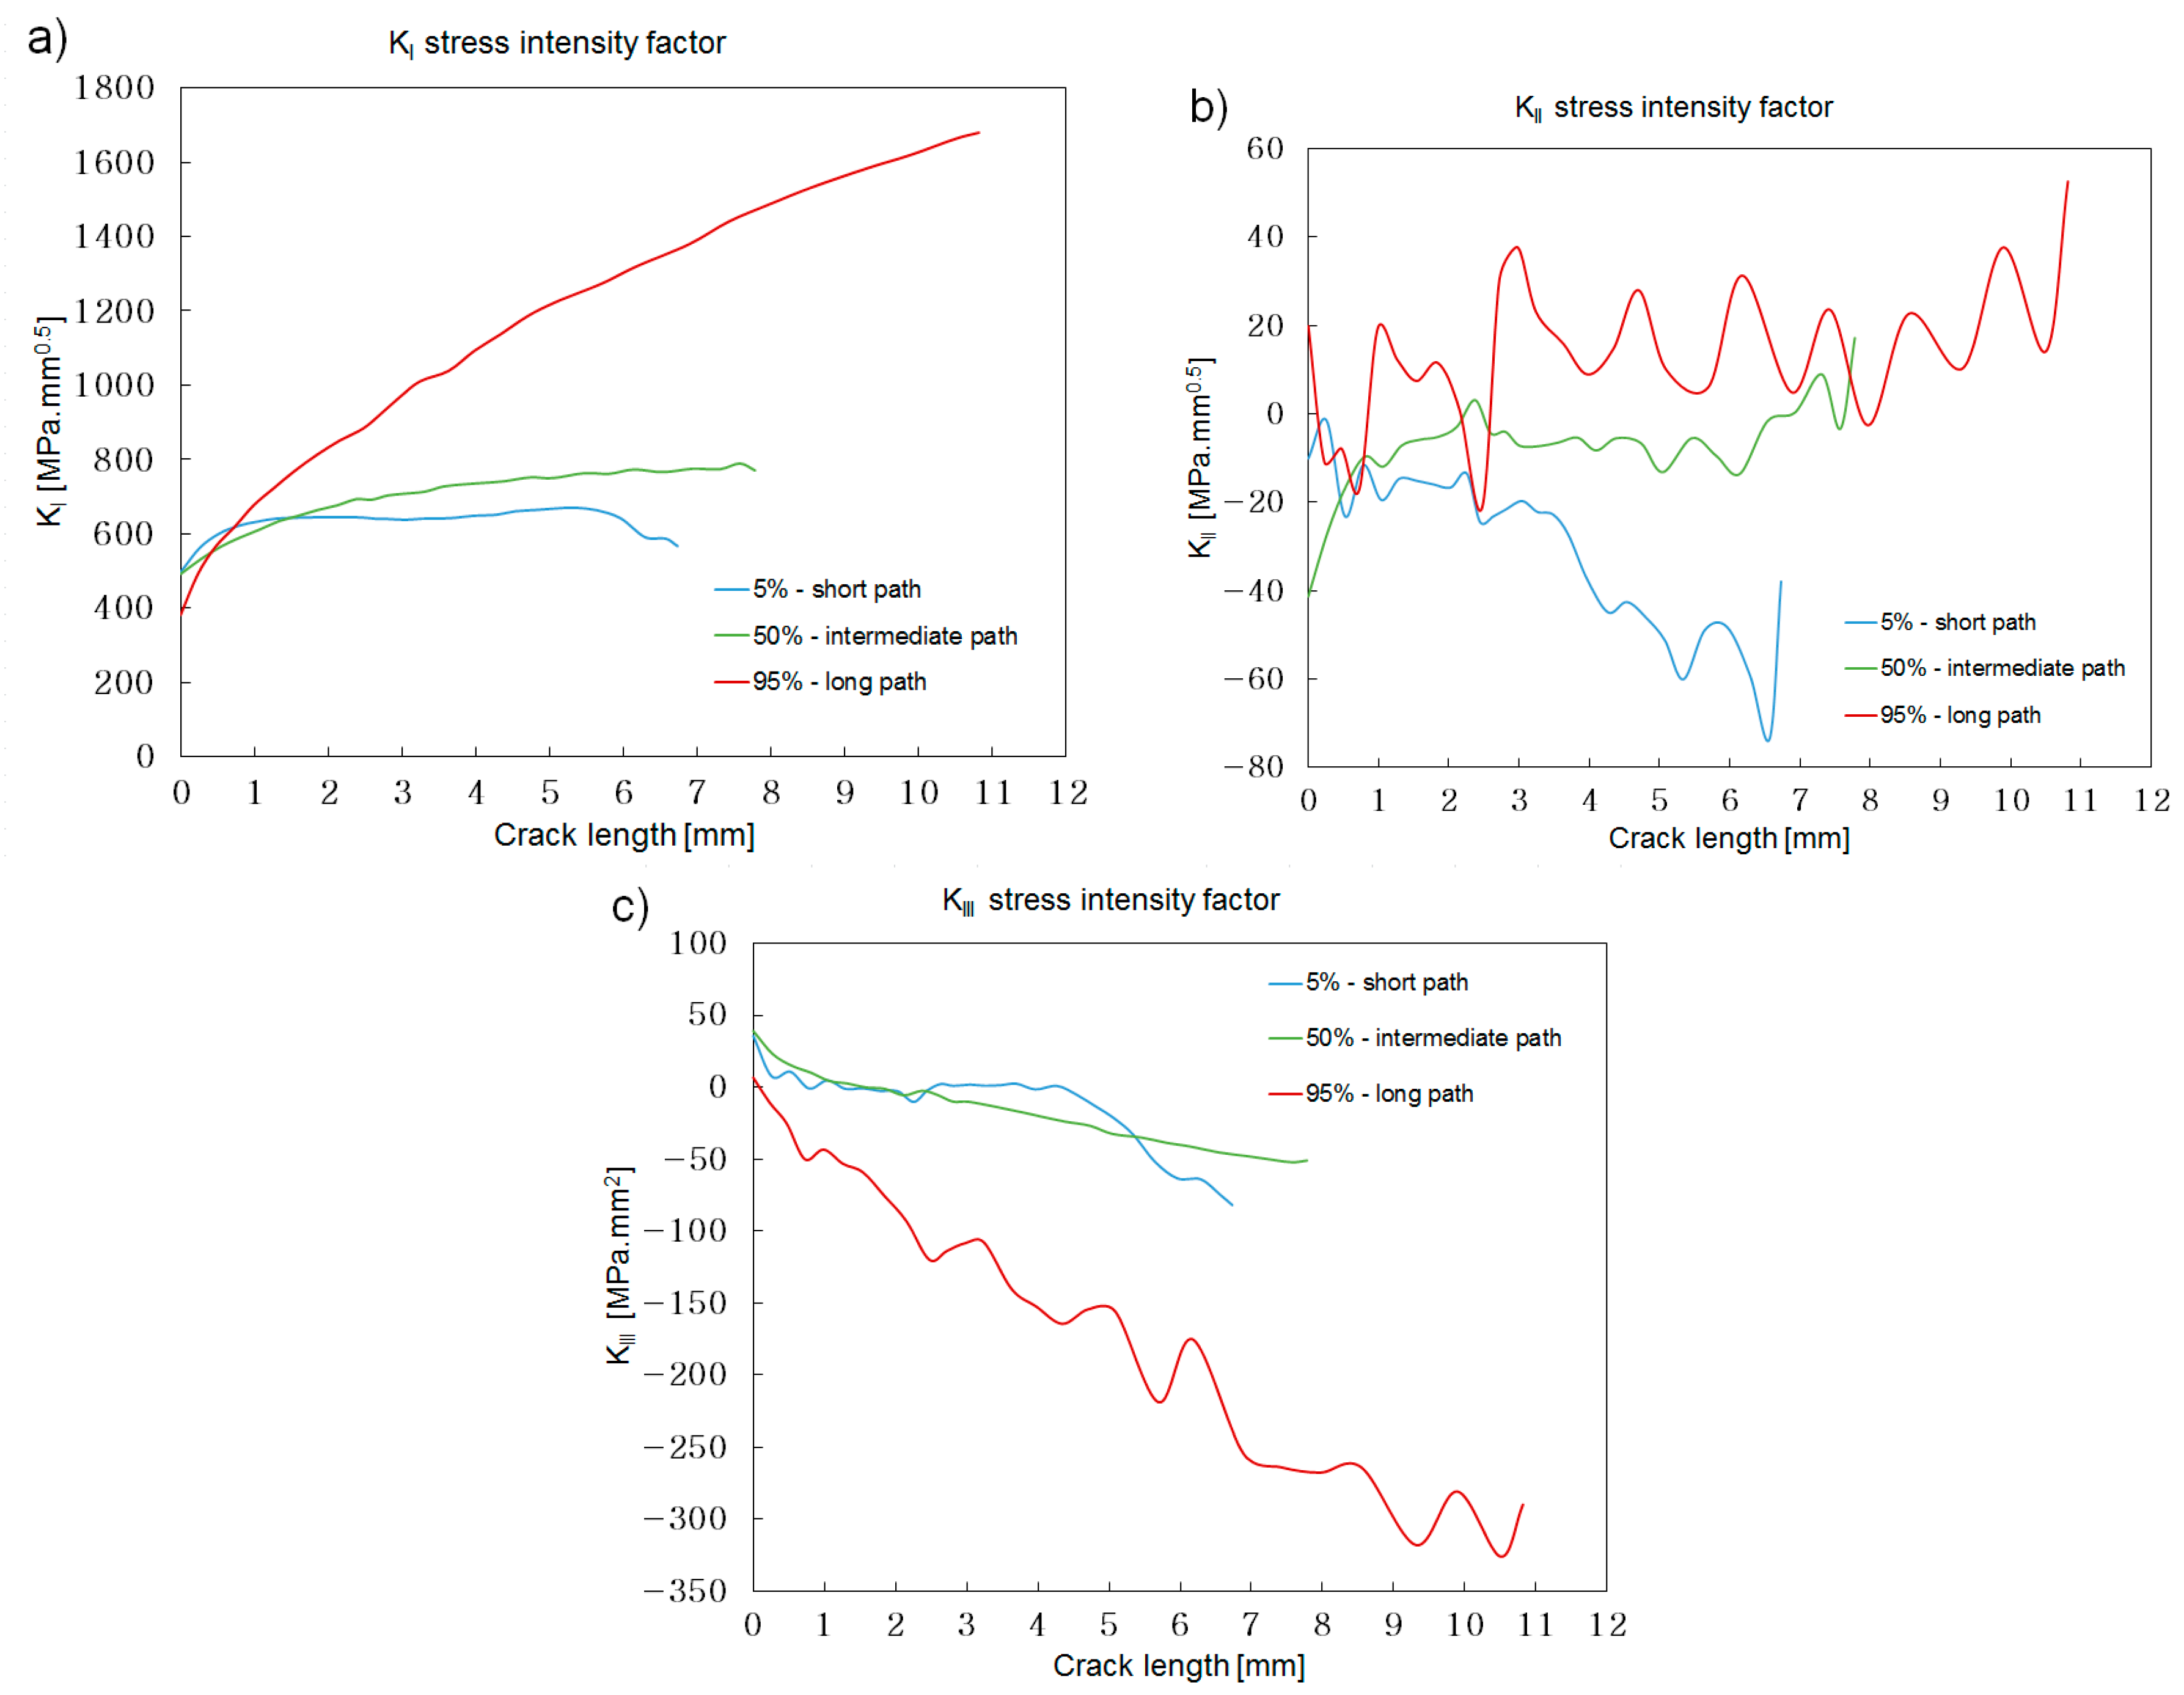
Figure 14.
The 30° angle, long flank. Stress intensity along the three crack paths selected: (a) KI; (b) KII; (c) KIII.
Figure 14.
The 30° angle, long flank. Stress intensity along the three crack paths selected: (a) KI; (b) KII; (c) KIII.
Figure 15.
The 60° angle, short flank crack shape.
Figure 15.
The 60° angle, short flank crack shape.
Figure 16.
The 60° angle short flank. Stress intensity along the three crack paths selected: (a) KI; (b) KII; (c) KIII.
Figure 16.
The 60° angle short flank. Stress intensity along the three crack paths selected: (a) KI; (b) KII; (c) KIII.
Figure 17.
The 60°, long flank crack shape.
Figure 17.
The 60°, long flank crack shape.
Figure 18.
The 60° long flank. Stress intensity along the three crack paths selected: (a) KI; (b) KII; (c) KIII.
Figure 18.
The 60° long flank. Stress intensity along the three crack paths selected: (a) KI; (b) KII; (c) KIII.
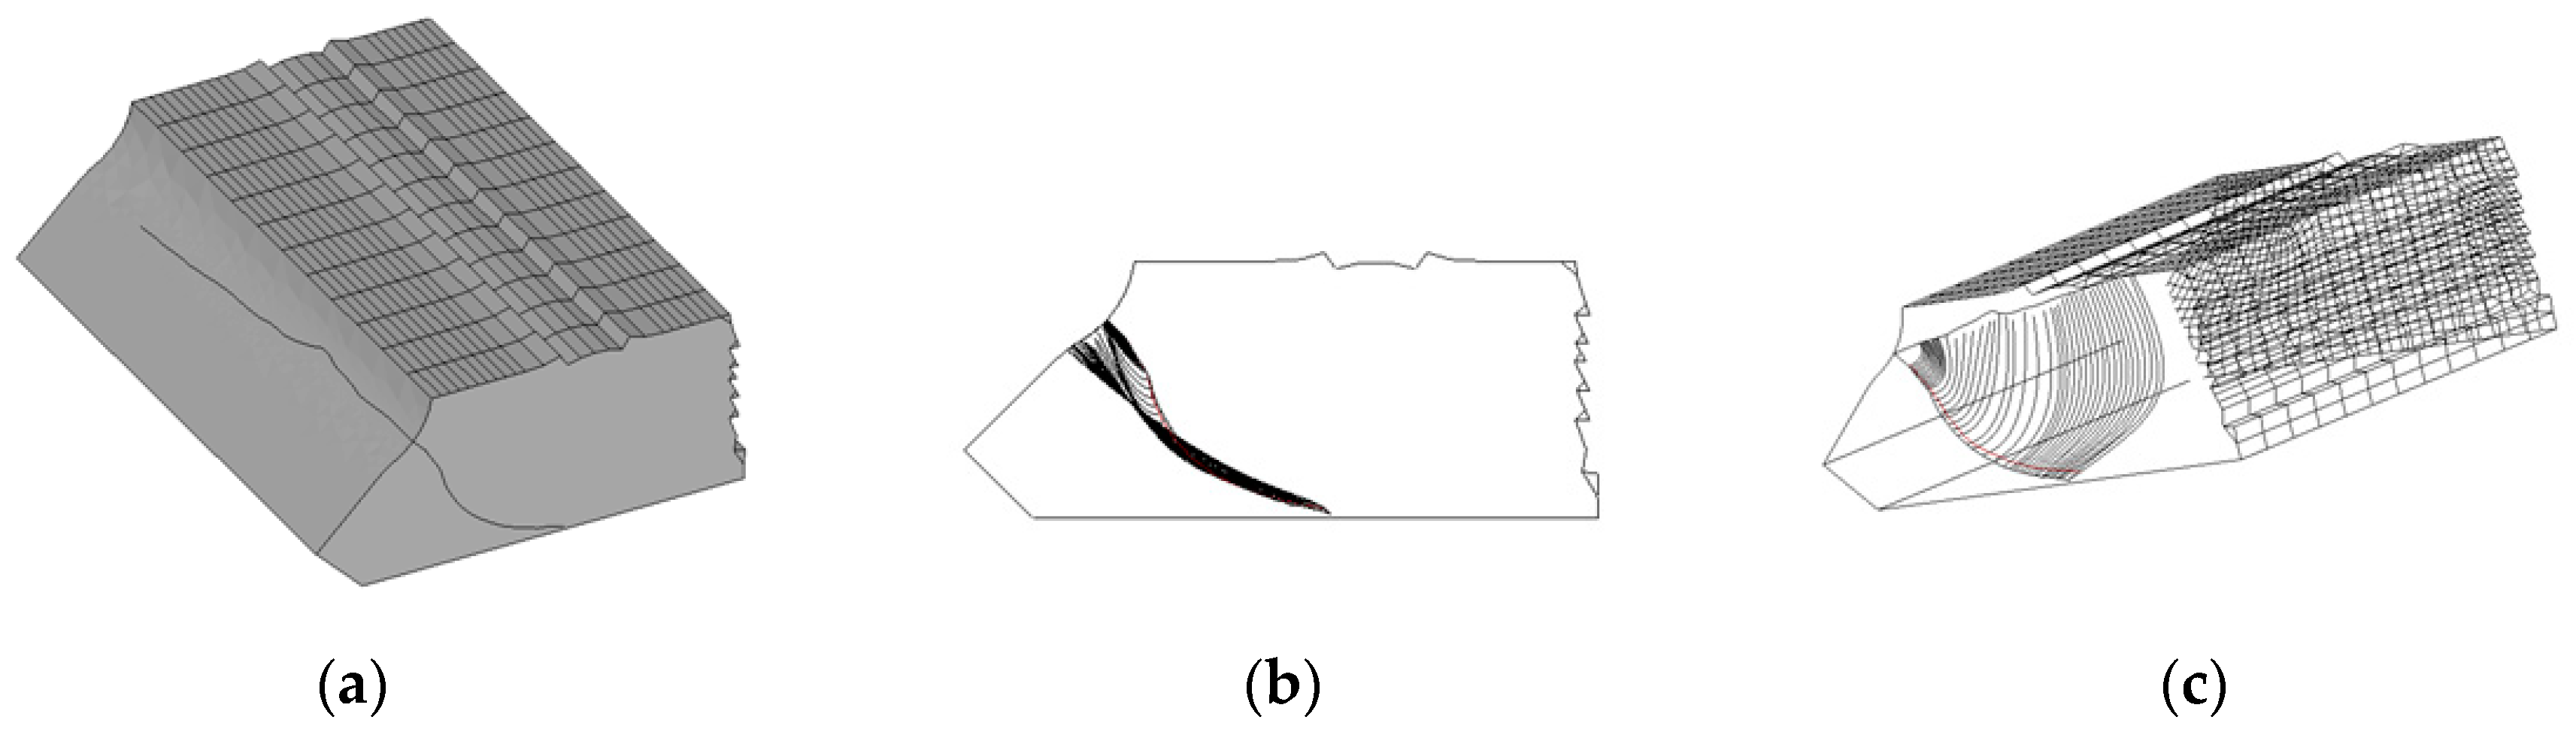
Figure 19.
The 45° angle, short flank crack shape. (a) External top view of the crack extension; (b) Front view of the crack extension; (c) isometric view.
Figure 19.
The 45° angle, short flank crack shape. (a) External top view of the crack extension; (b) Front view of the crack extension; (c) isometric view.
Figure 20.
The 45° angle, short flank. Stress intensity along the three crack paths selected: (a) KI; (b) KII; (c) KIII.
Figure 20.
The 45° angle, short flank. Stress intensity along the three crack paths selected: (a) KI; (b) KII; (c) KIII.
Figure 21.
The 45° angle, long flank. Stress intensity along the three crack paths selected: (a) KI; (b) KII; (c) KIII.
Figure 21.
The 45° angle, long flank. Stress intensity along the three crack paths selected: (a) KI; (b) KII; (c) KIII.
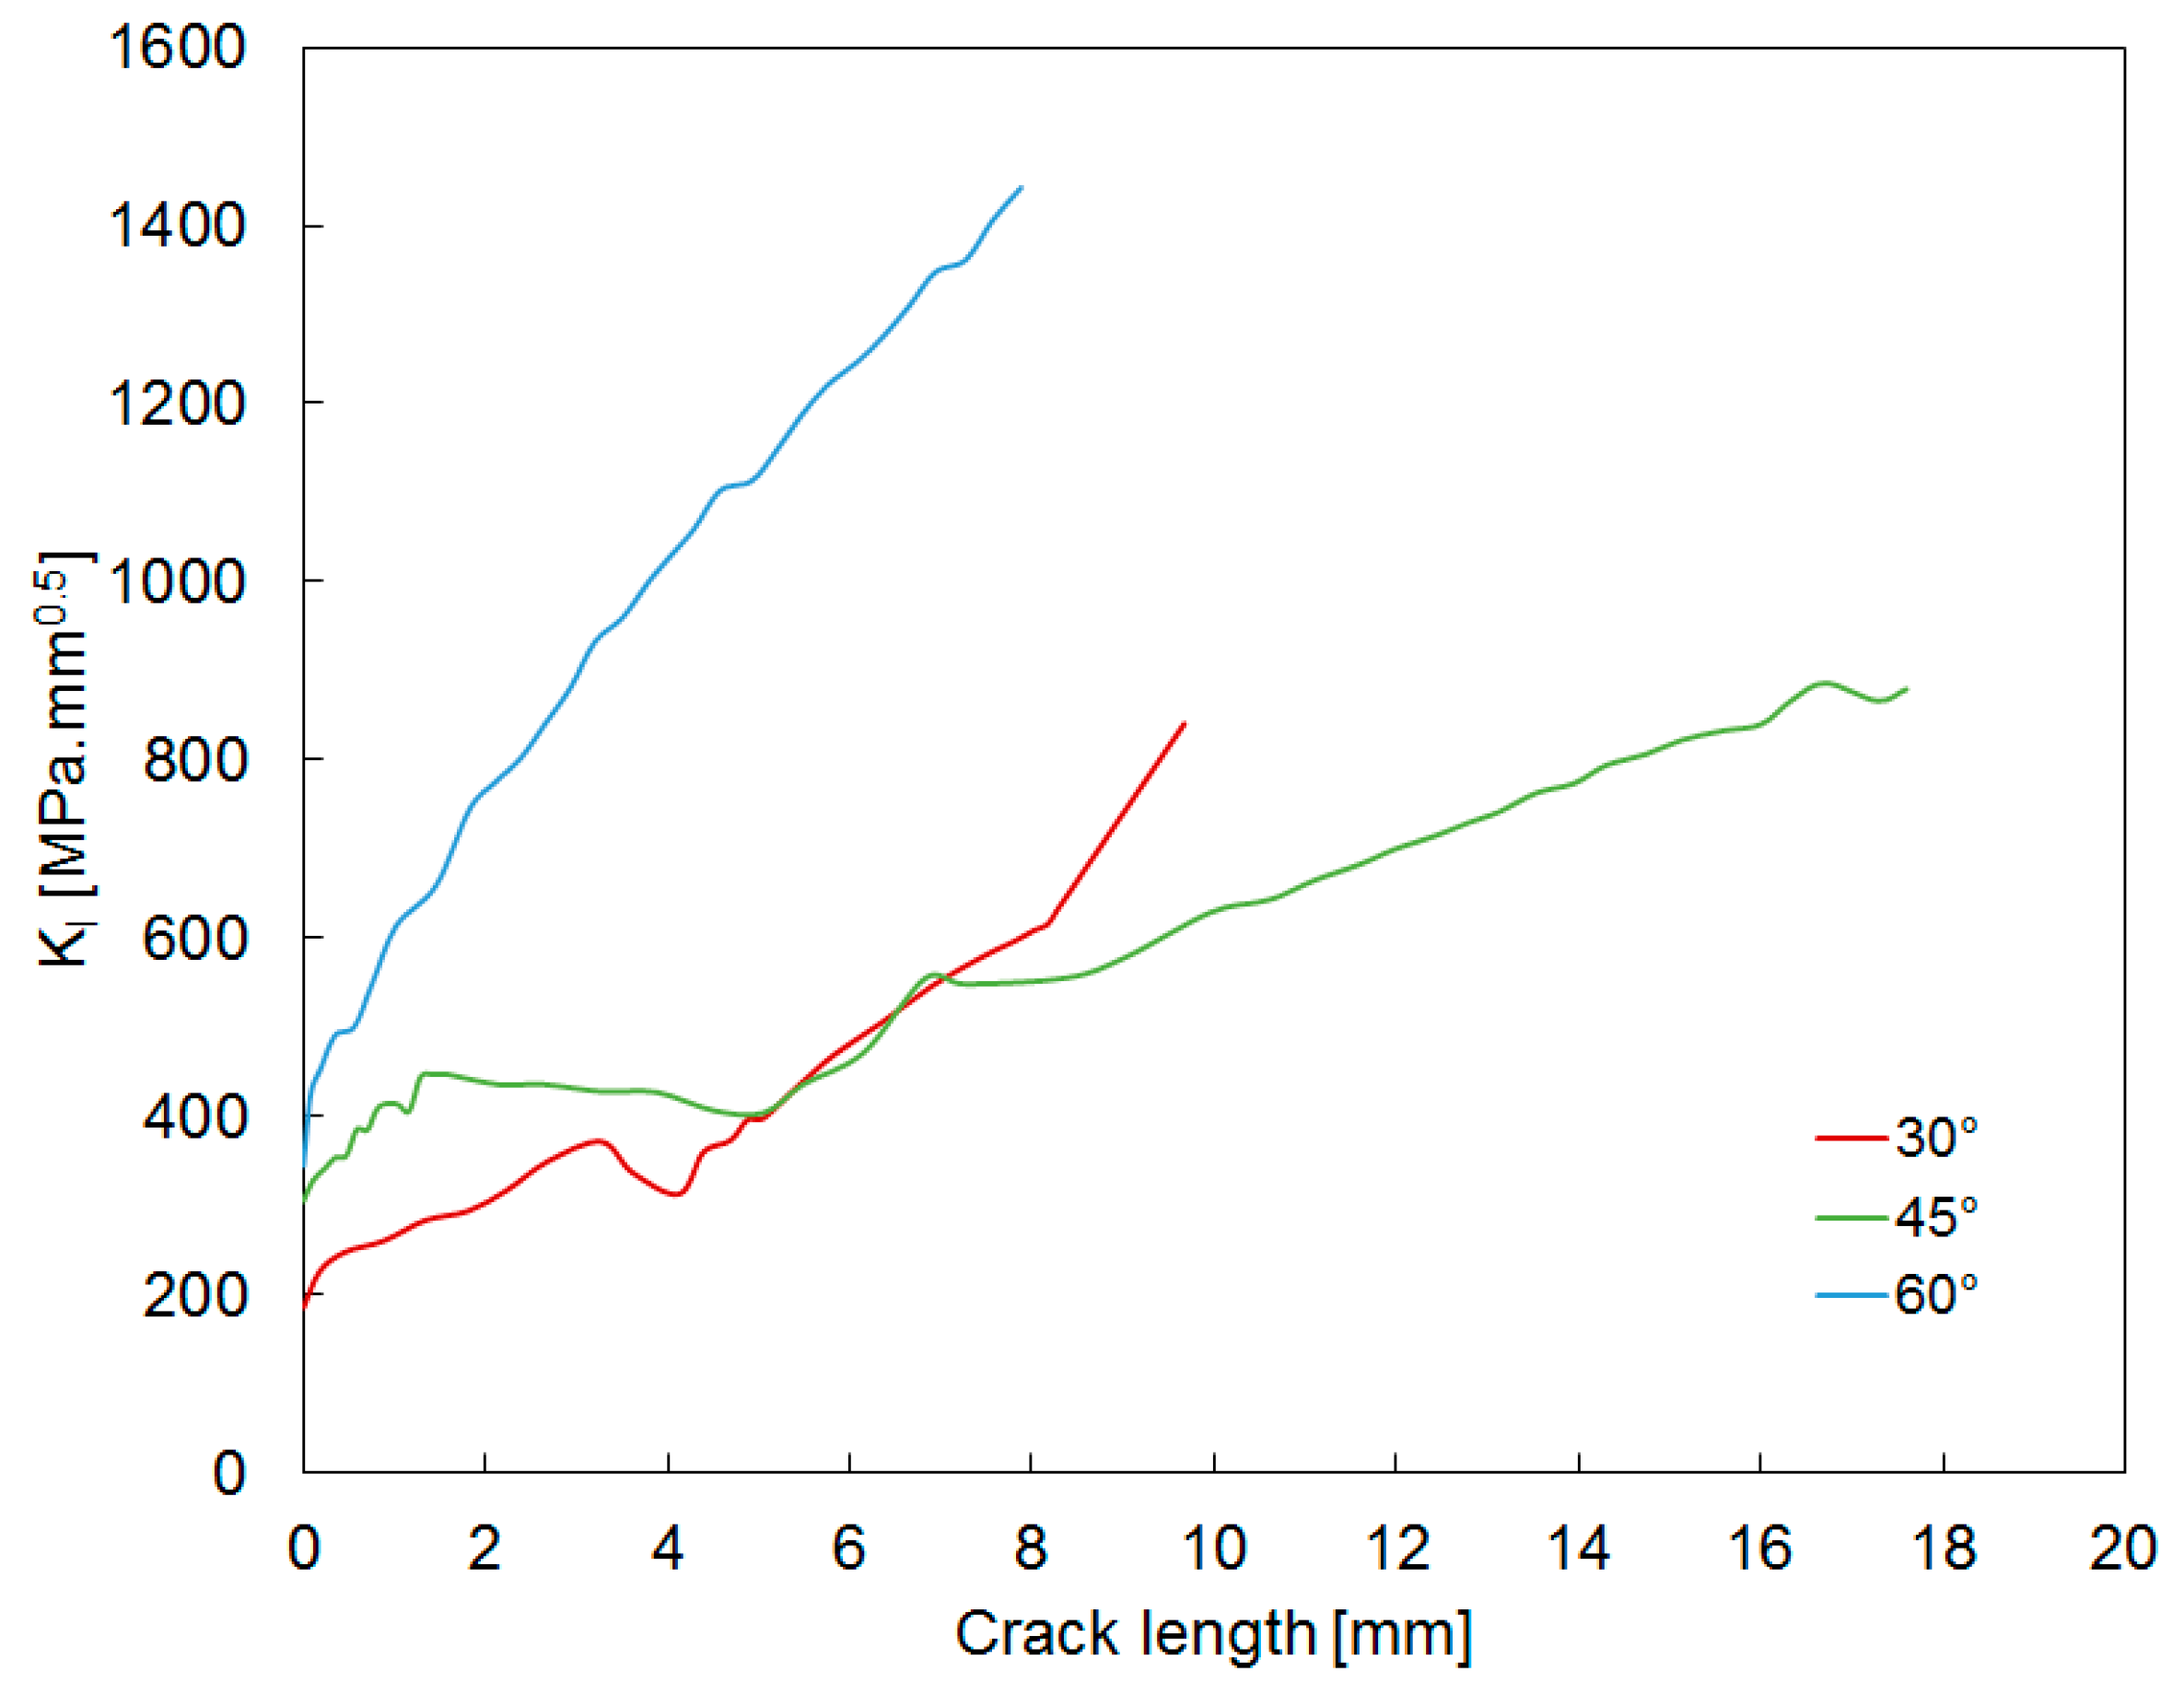
Figure 22.
Comparison of the different flank angles at 95% crack front for the short flank design option: KI stress intensity factor.
Figure 22.
Comparison of the different flank angles at 95% crack front for the short flank design option: KI stress intensity factor.
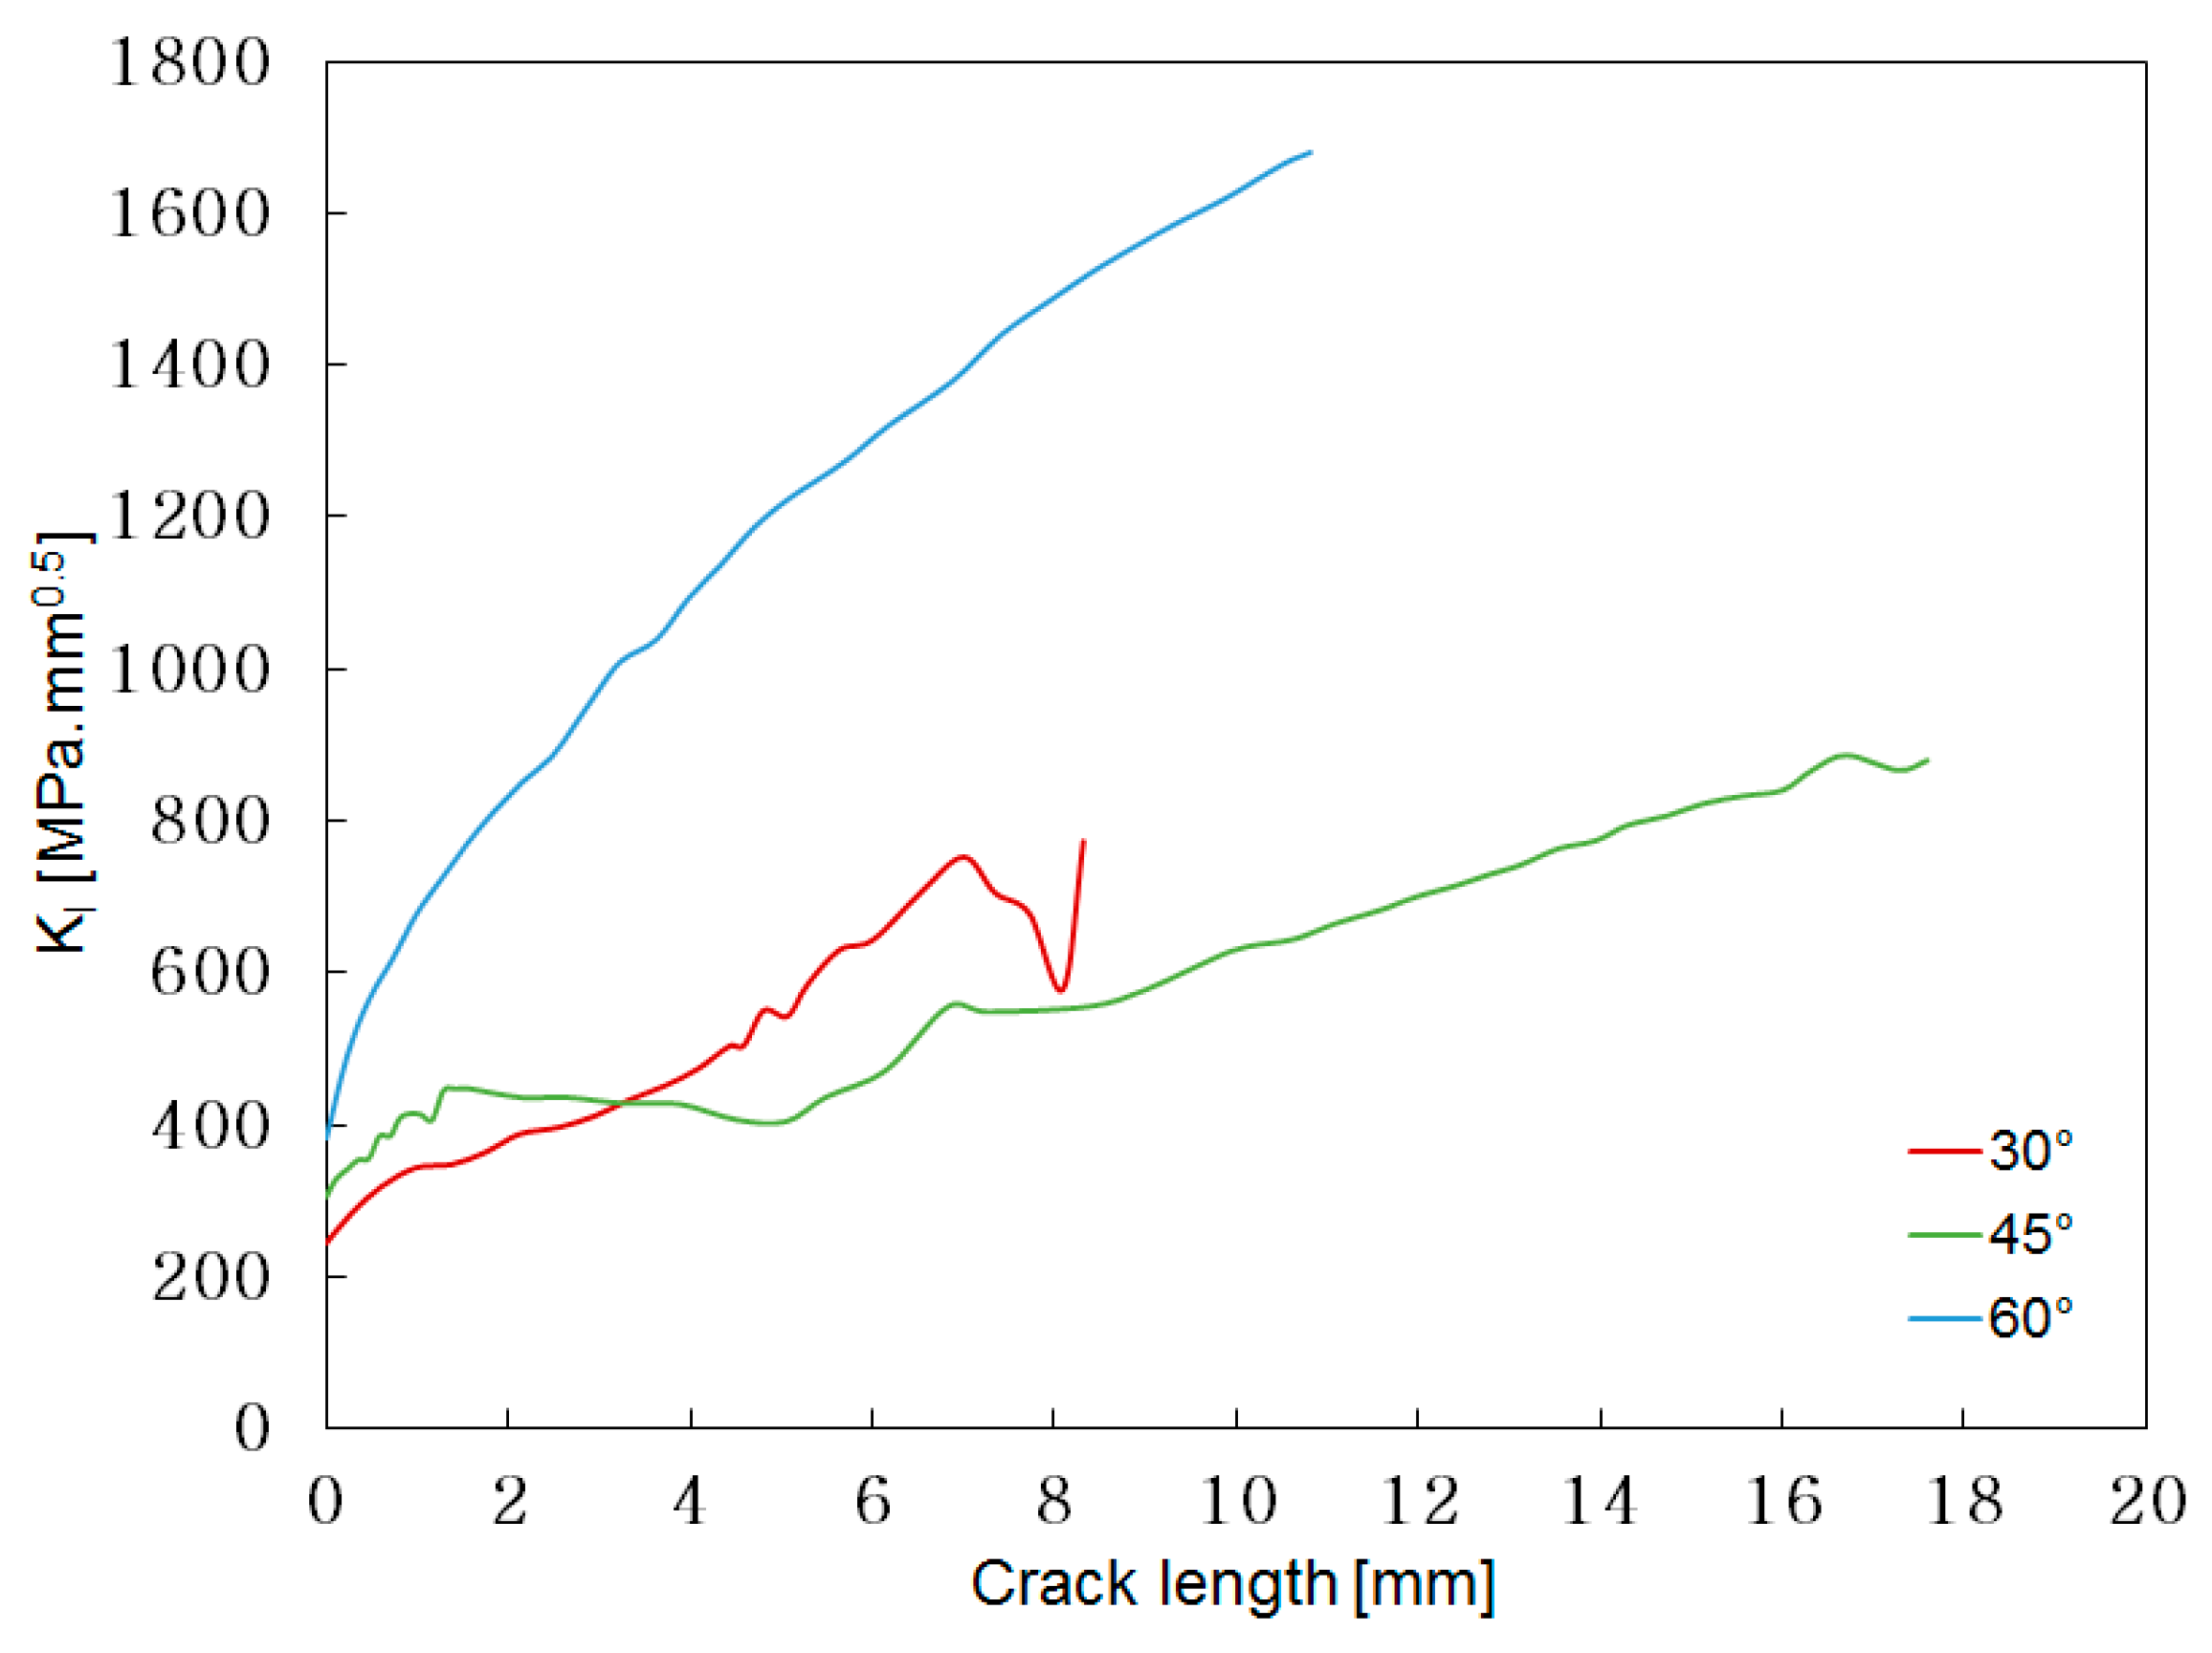
Figure 23.
Comparison of the different flank angles at 95% crack front for the long flank design option: KI stress intensity factor.
Figure 23.
Comparison of the different flank angles at 95% crack front for the long flank design option: KI stress intensity factor.
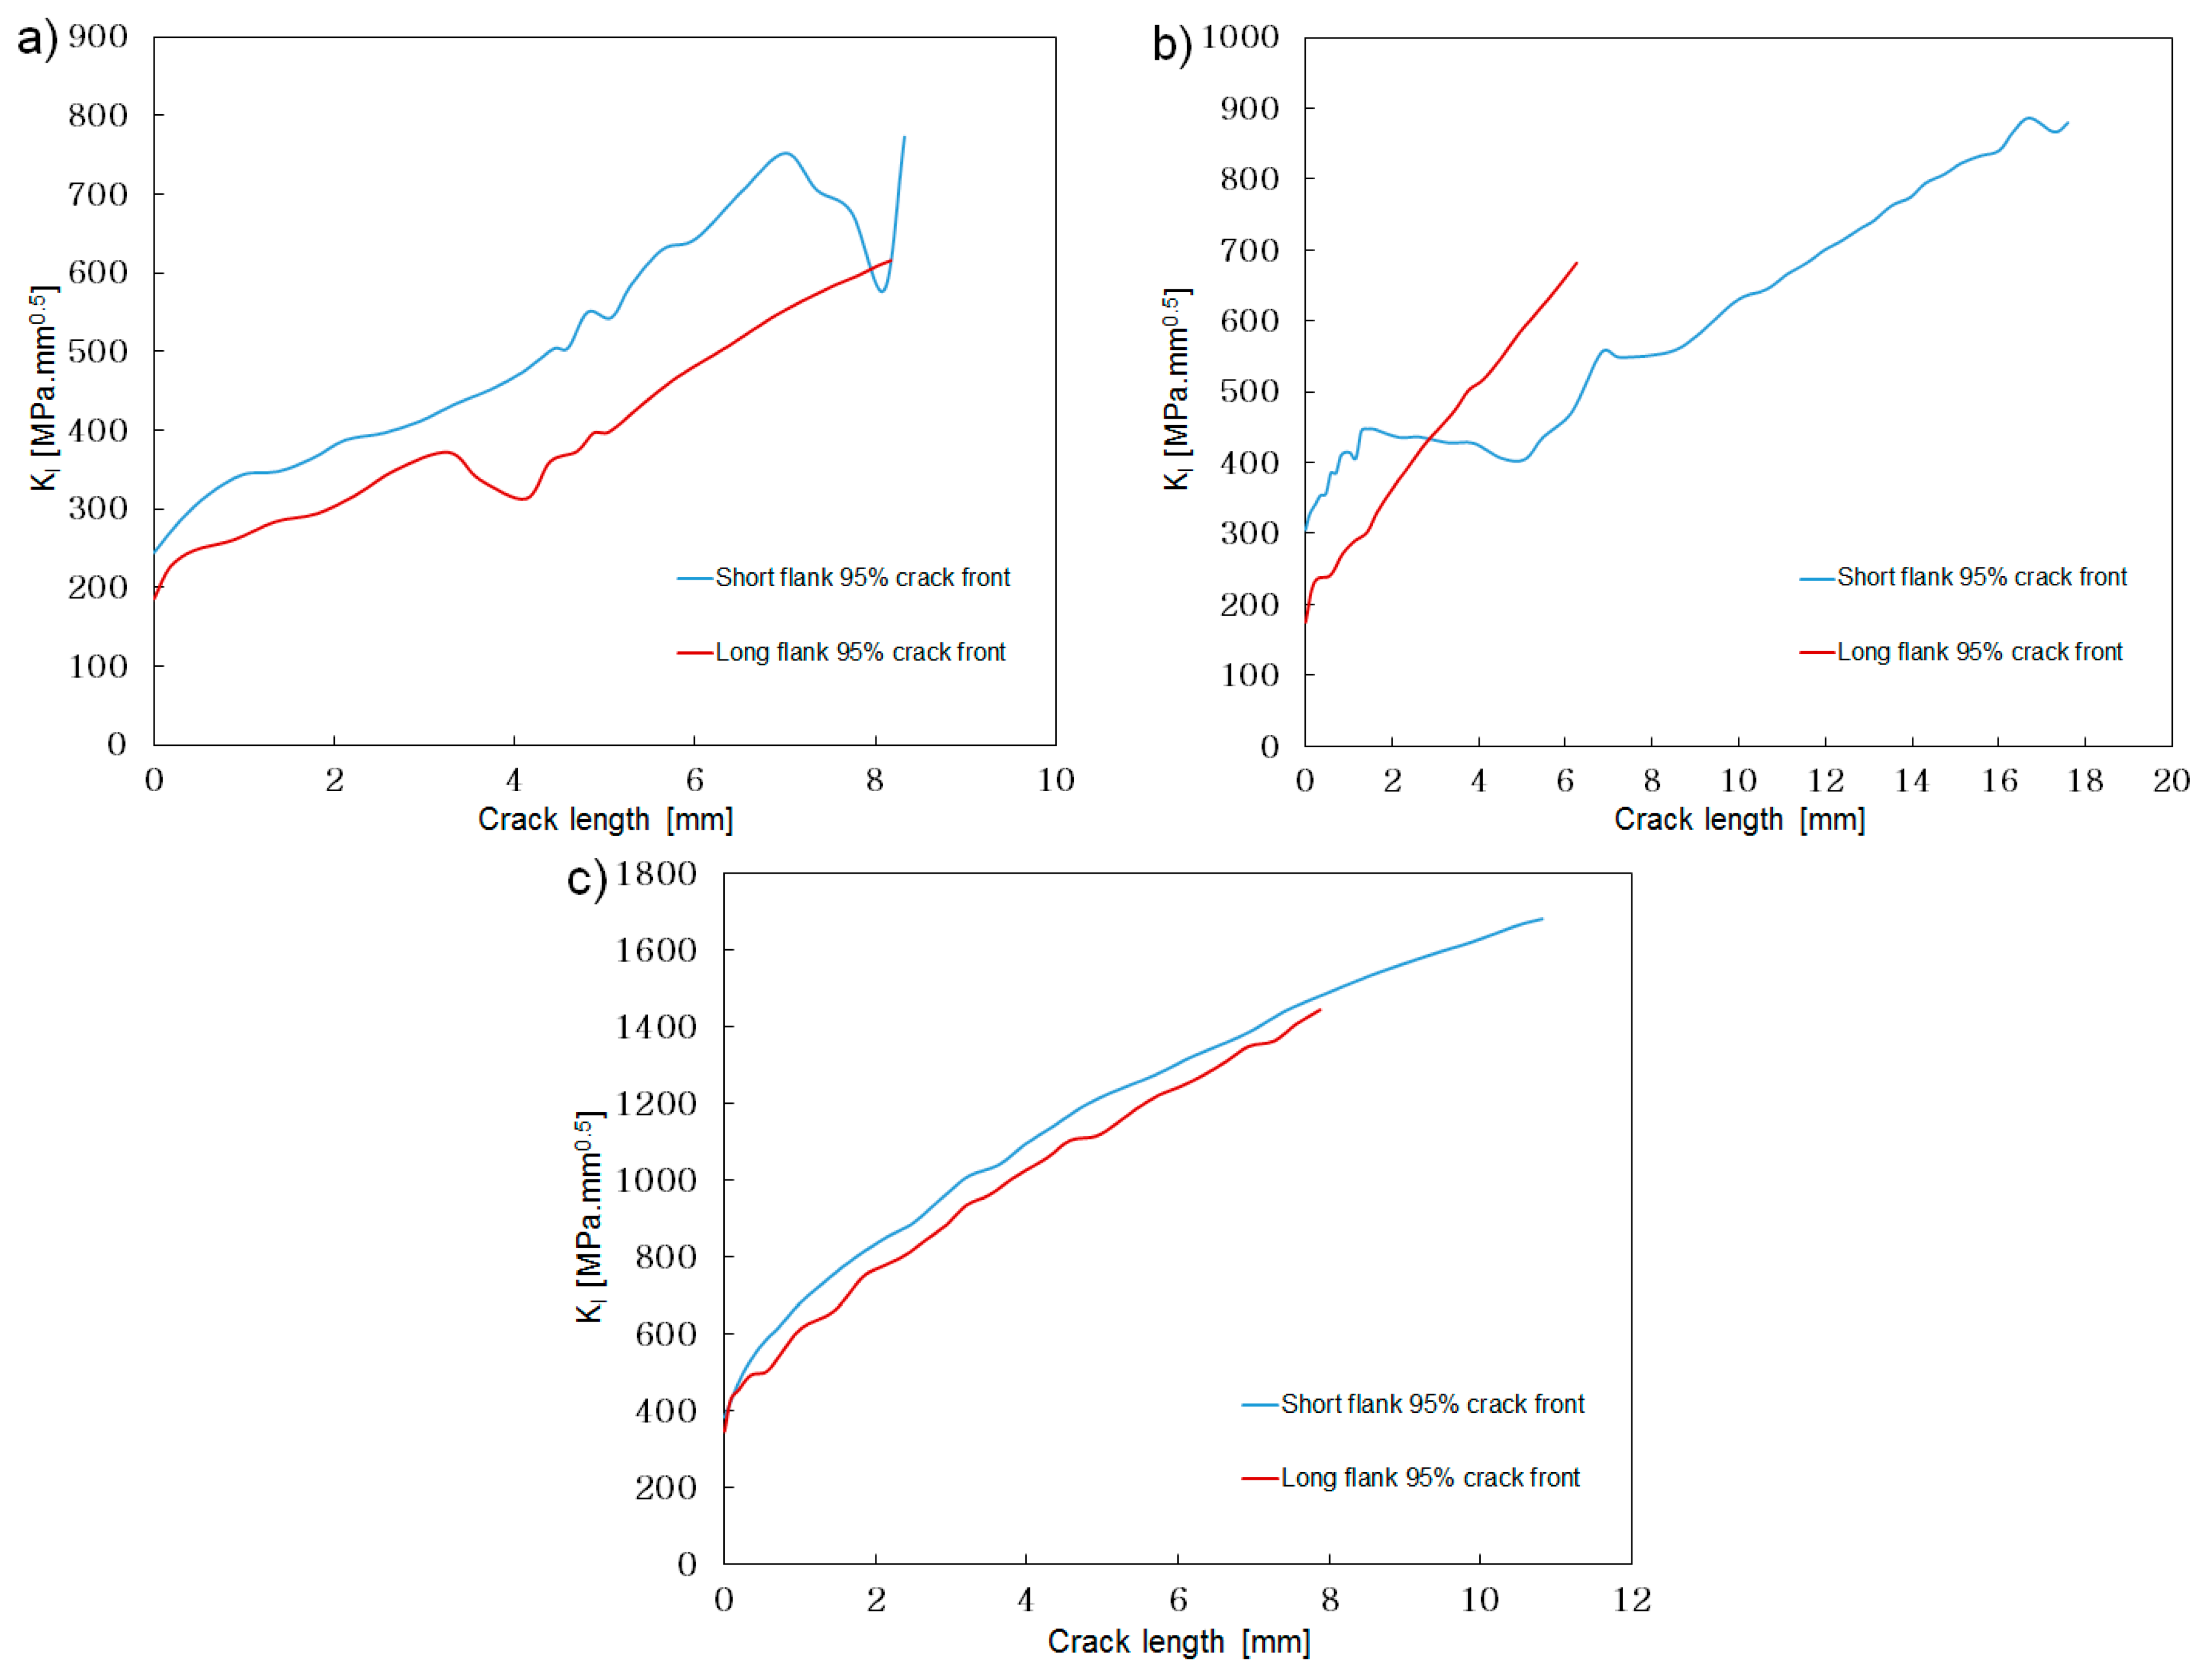
Figure 24.
Short vs. long flank for all the flank angle design options: (a) 30°; (b) 45°; (c) 60°.
Figure 24.
Short vs. long flank for all the flank angle design options: (a) 30°; (b) 45°; (c) 60°.
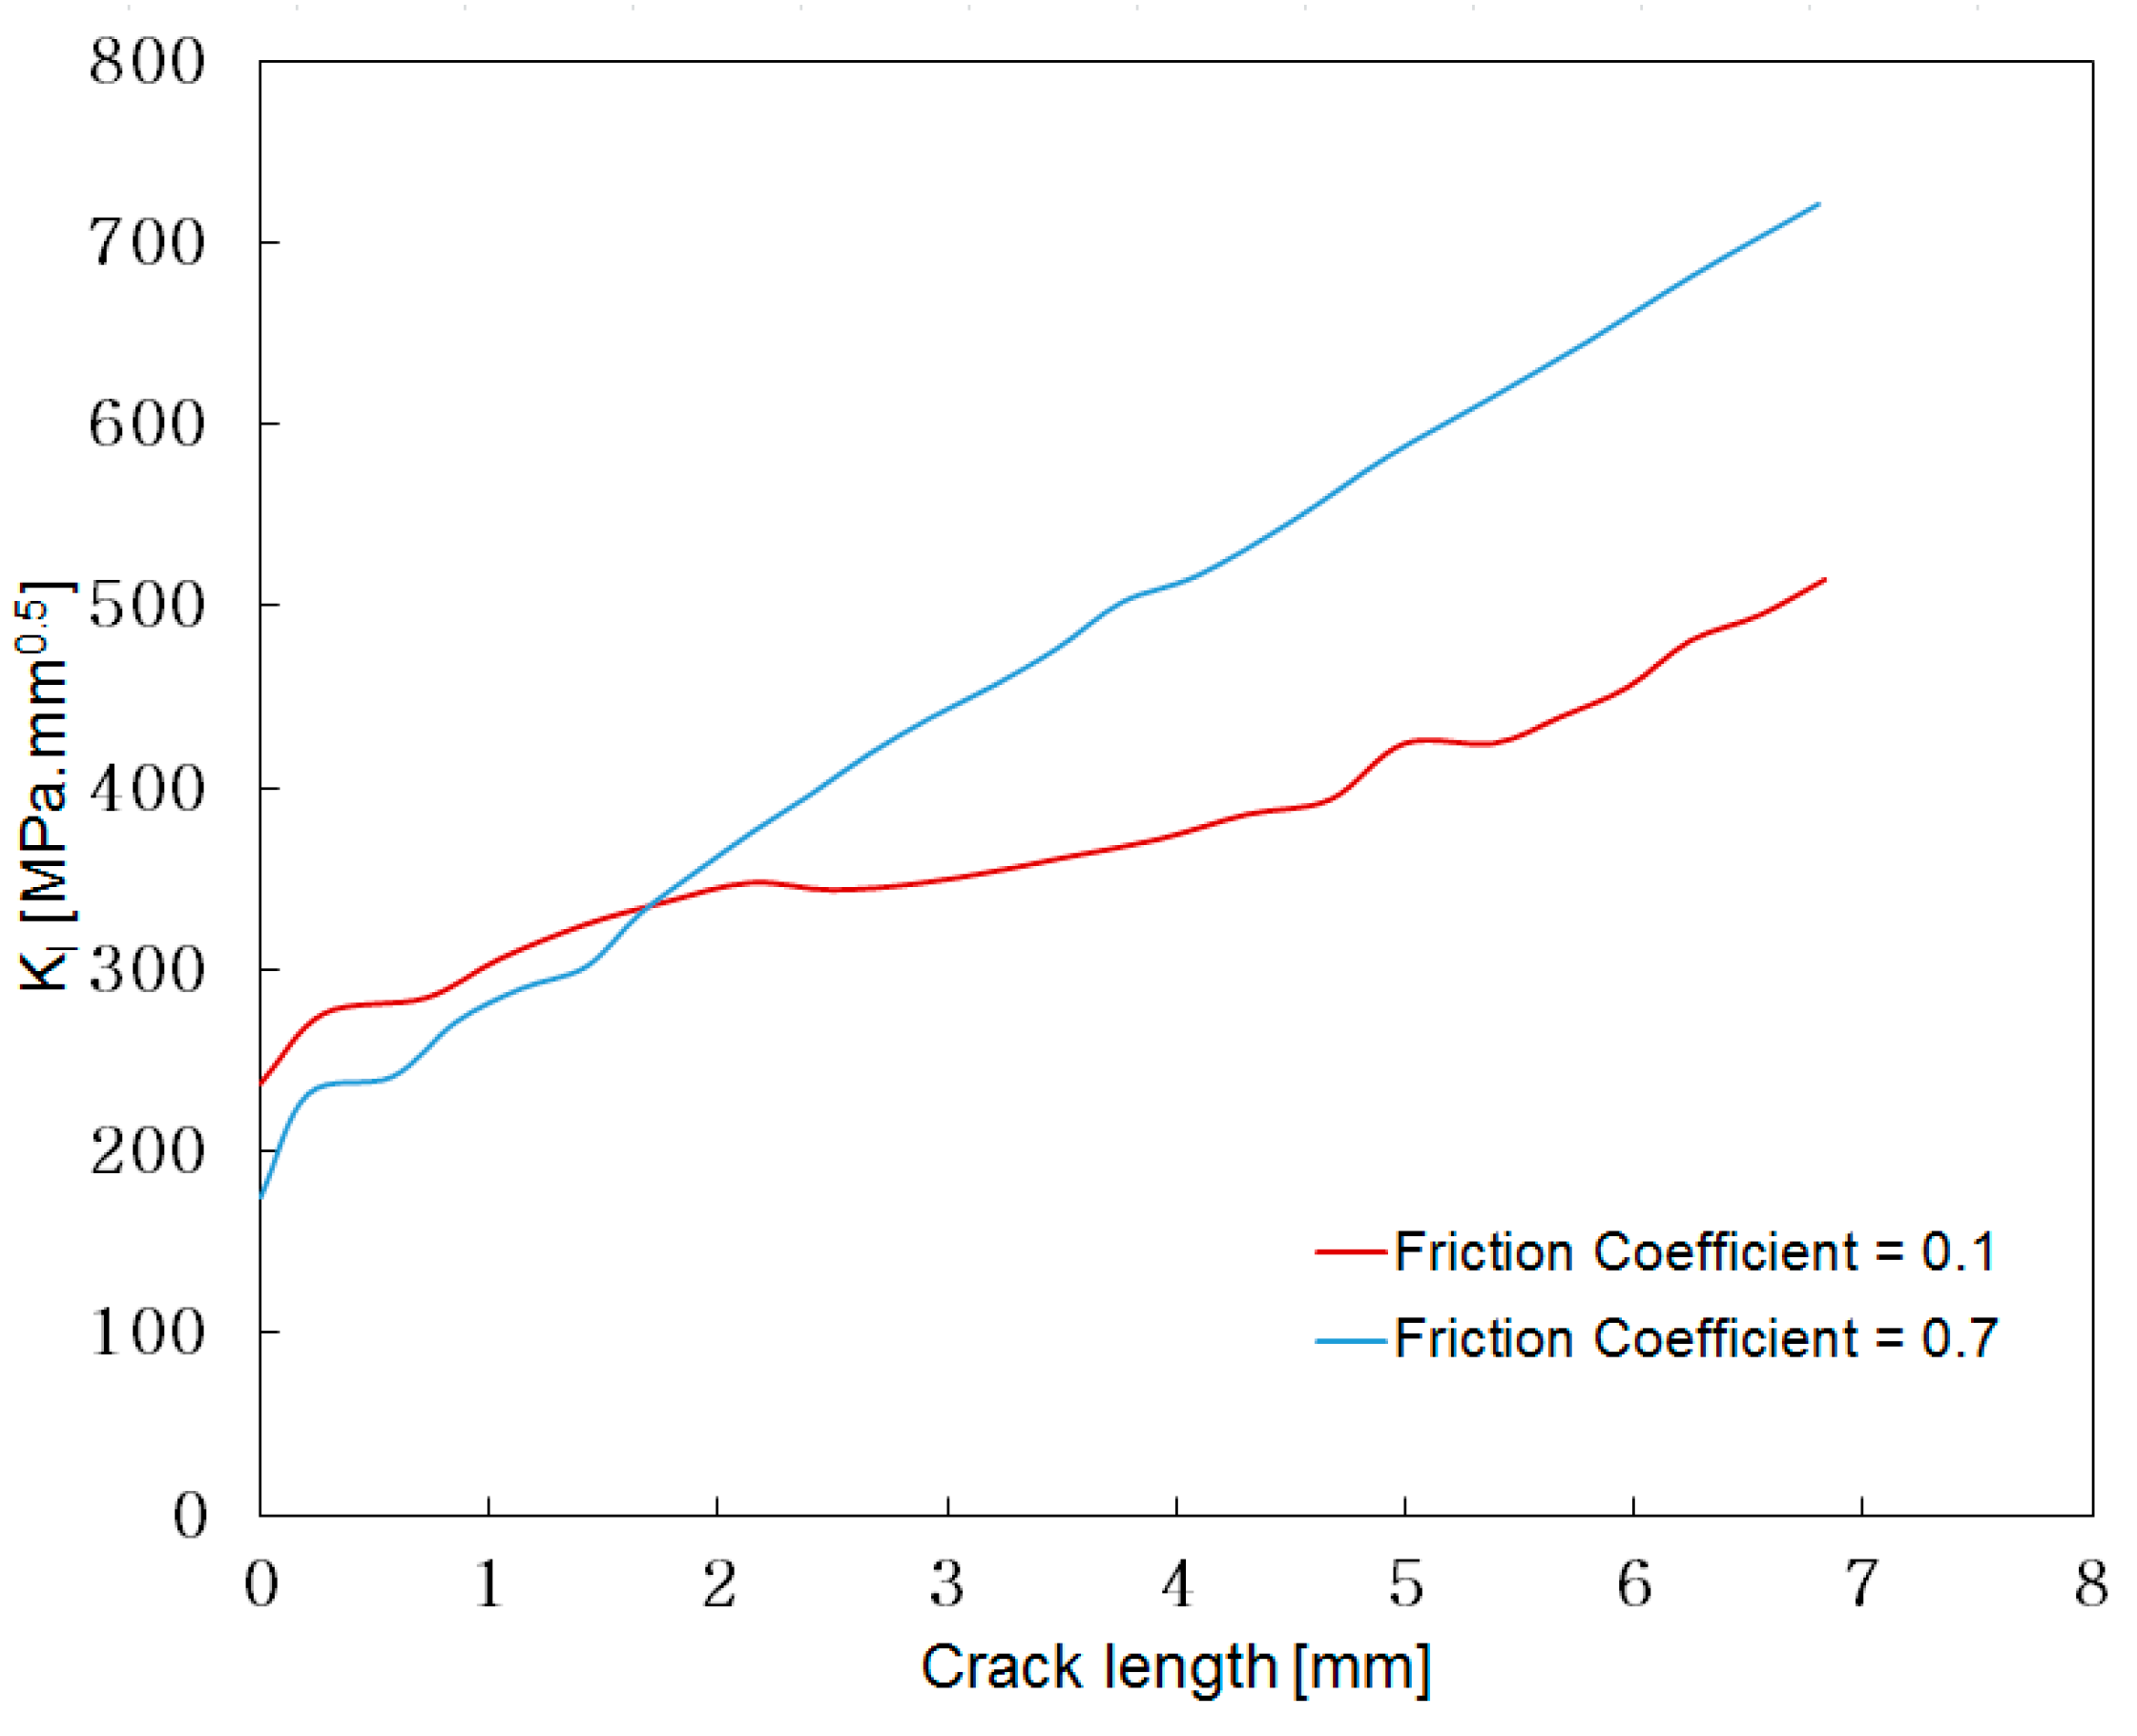
Figure 25.
Crack propagation behavior with low and high metal-to-metal friction coefficient. The geometry is a 45° short flank, 95% crack front.
Figure 25.
Crack propagation behavior with low and high metal-to-metal friction coefficient. The geometry is a 45° short flank, 95% crack front.
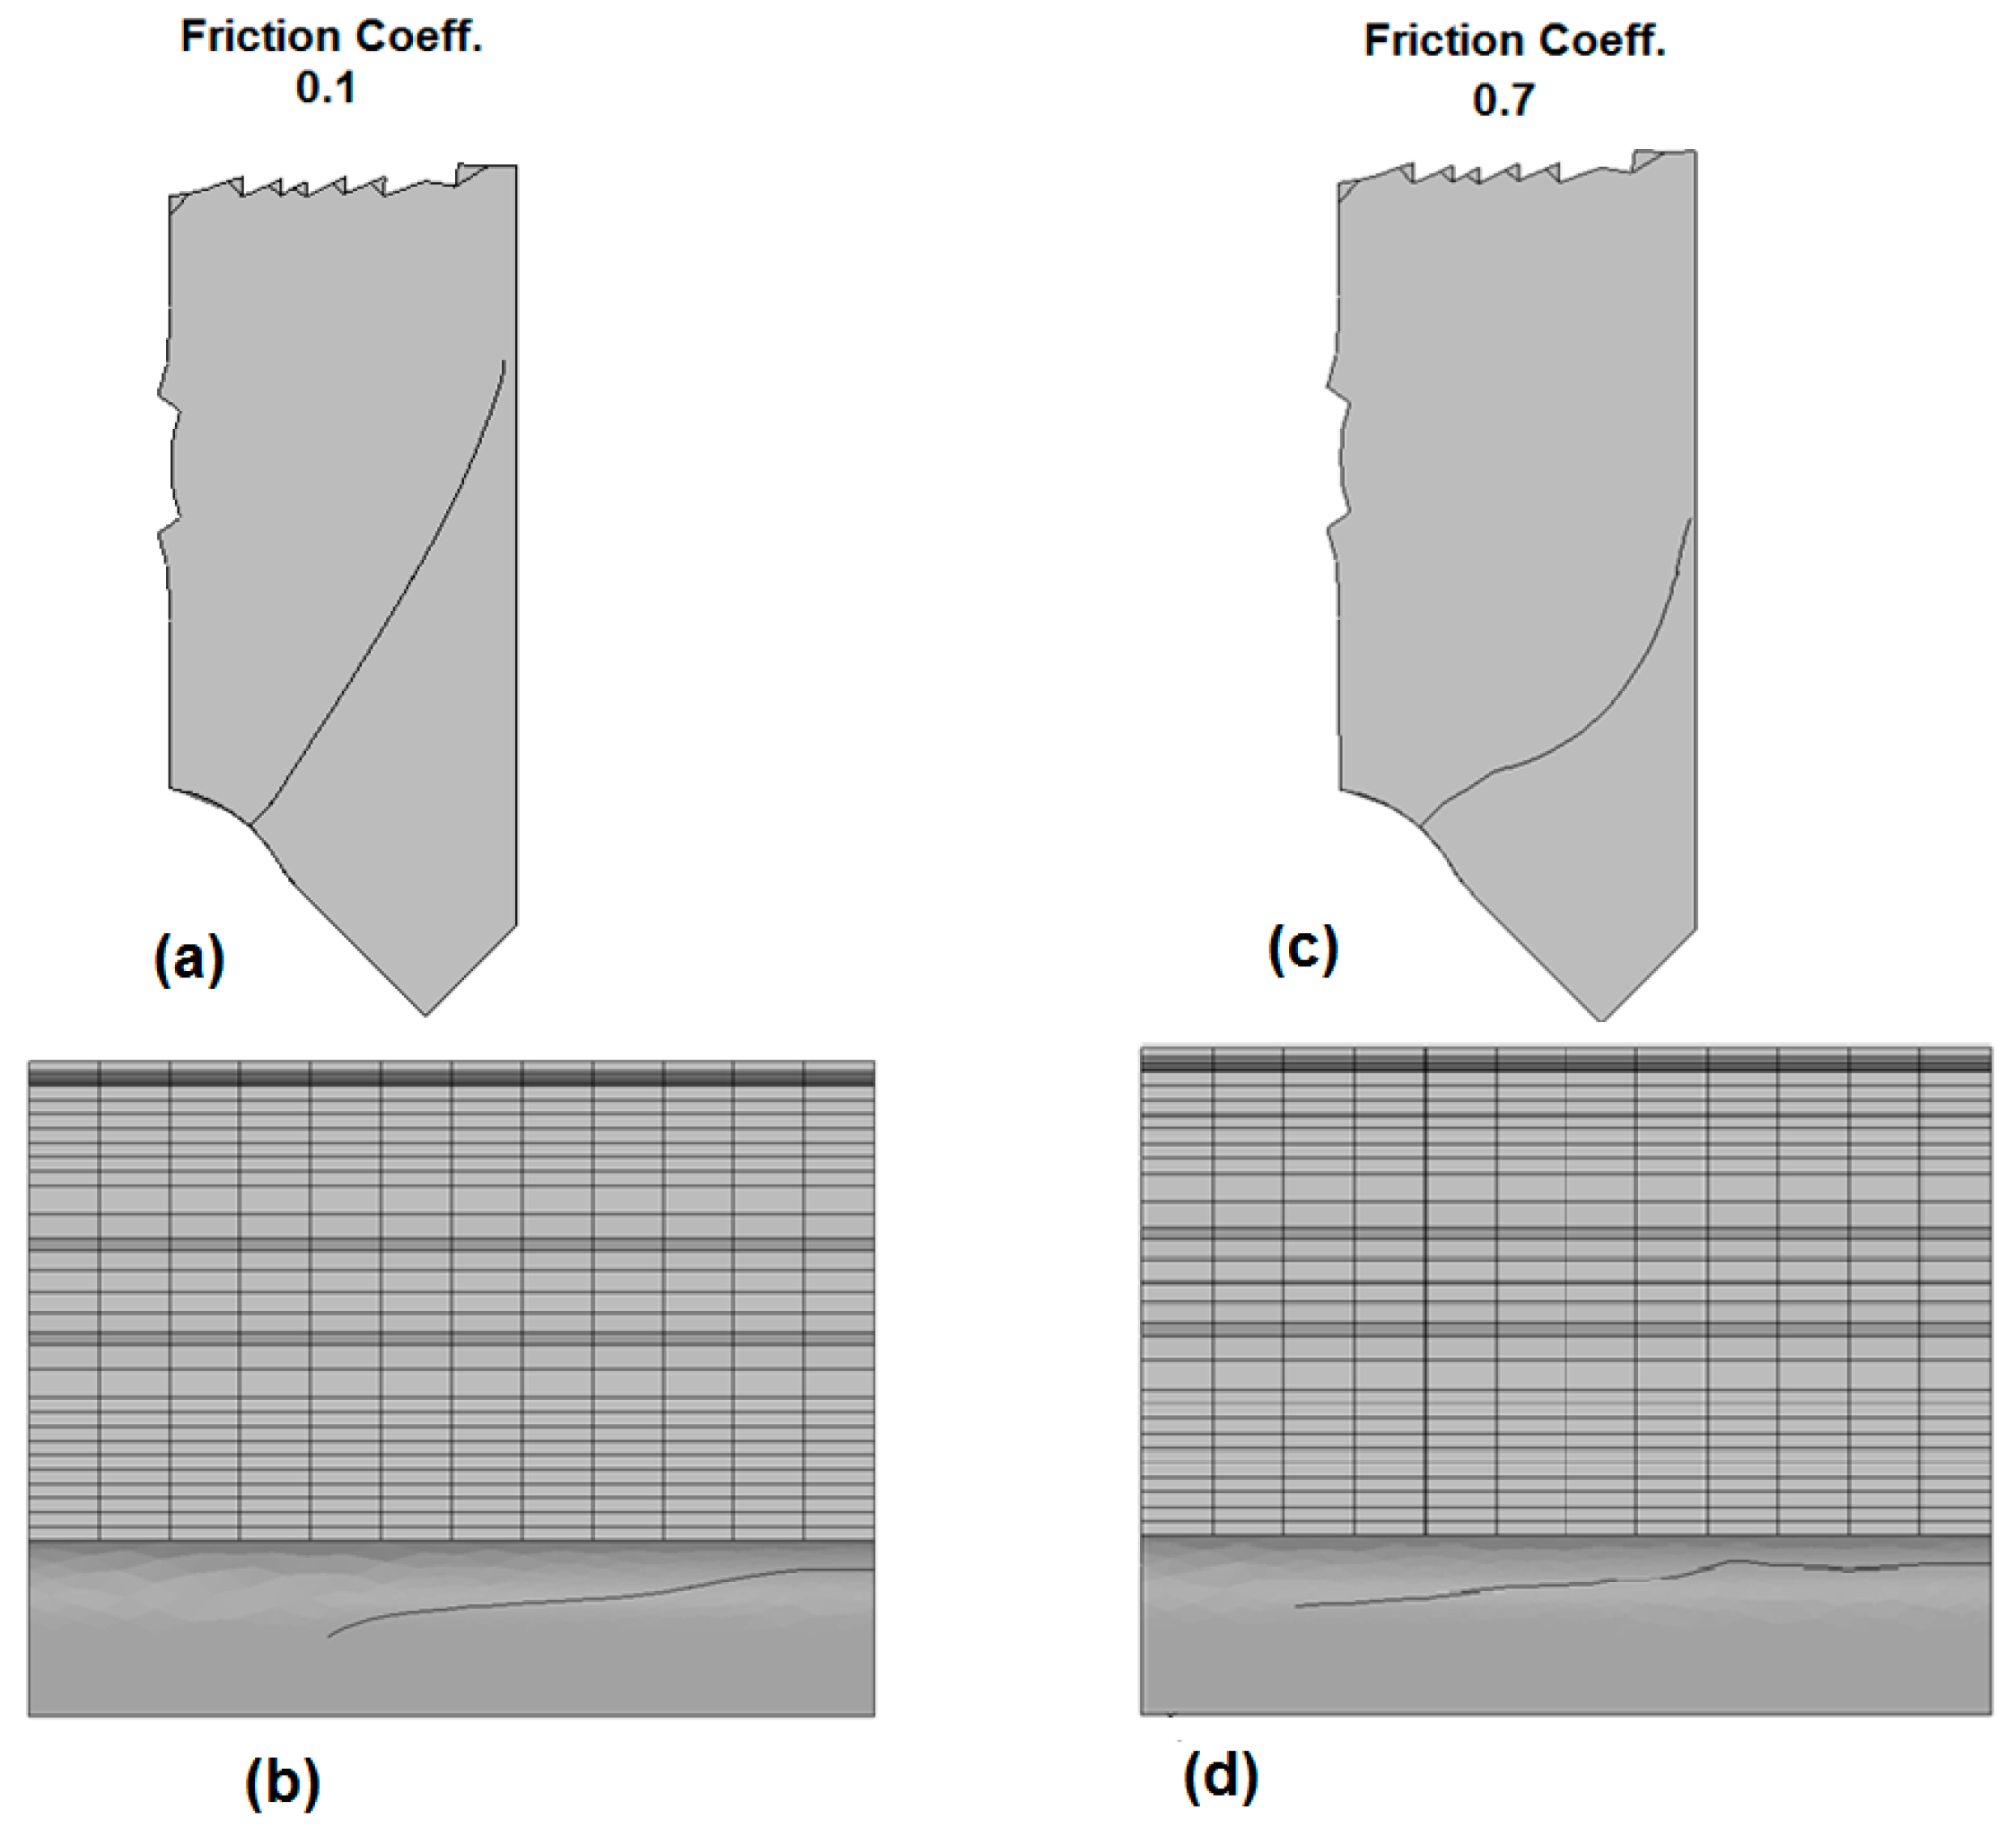
Figure 26.
Crack shape and direction. A direct comparison between low and high friction coefficients. The geometry is a 45° short flank. (a) Friction coefficient = 0.1 front view; (b) Friction coefficient = 0.1 top view; (c) Friction coefficient = 0.7 front view (d) Friction coefficient = 0.1 top view.
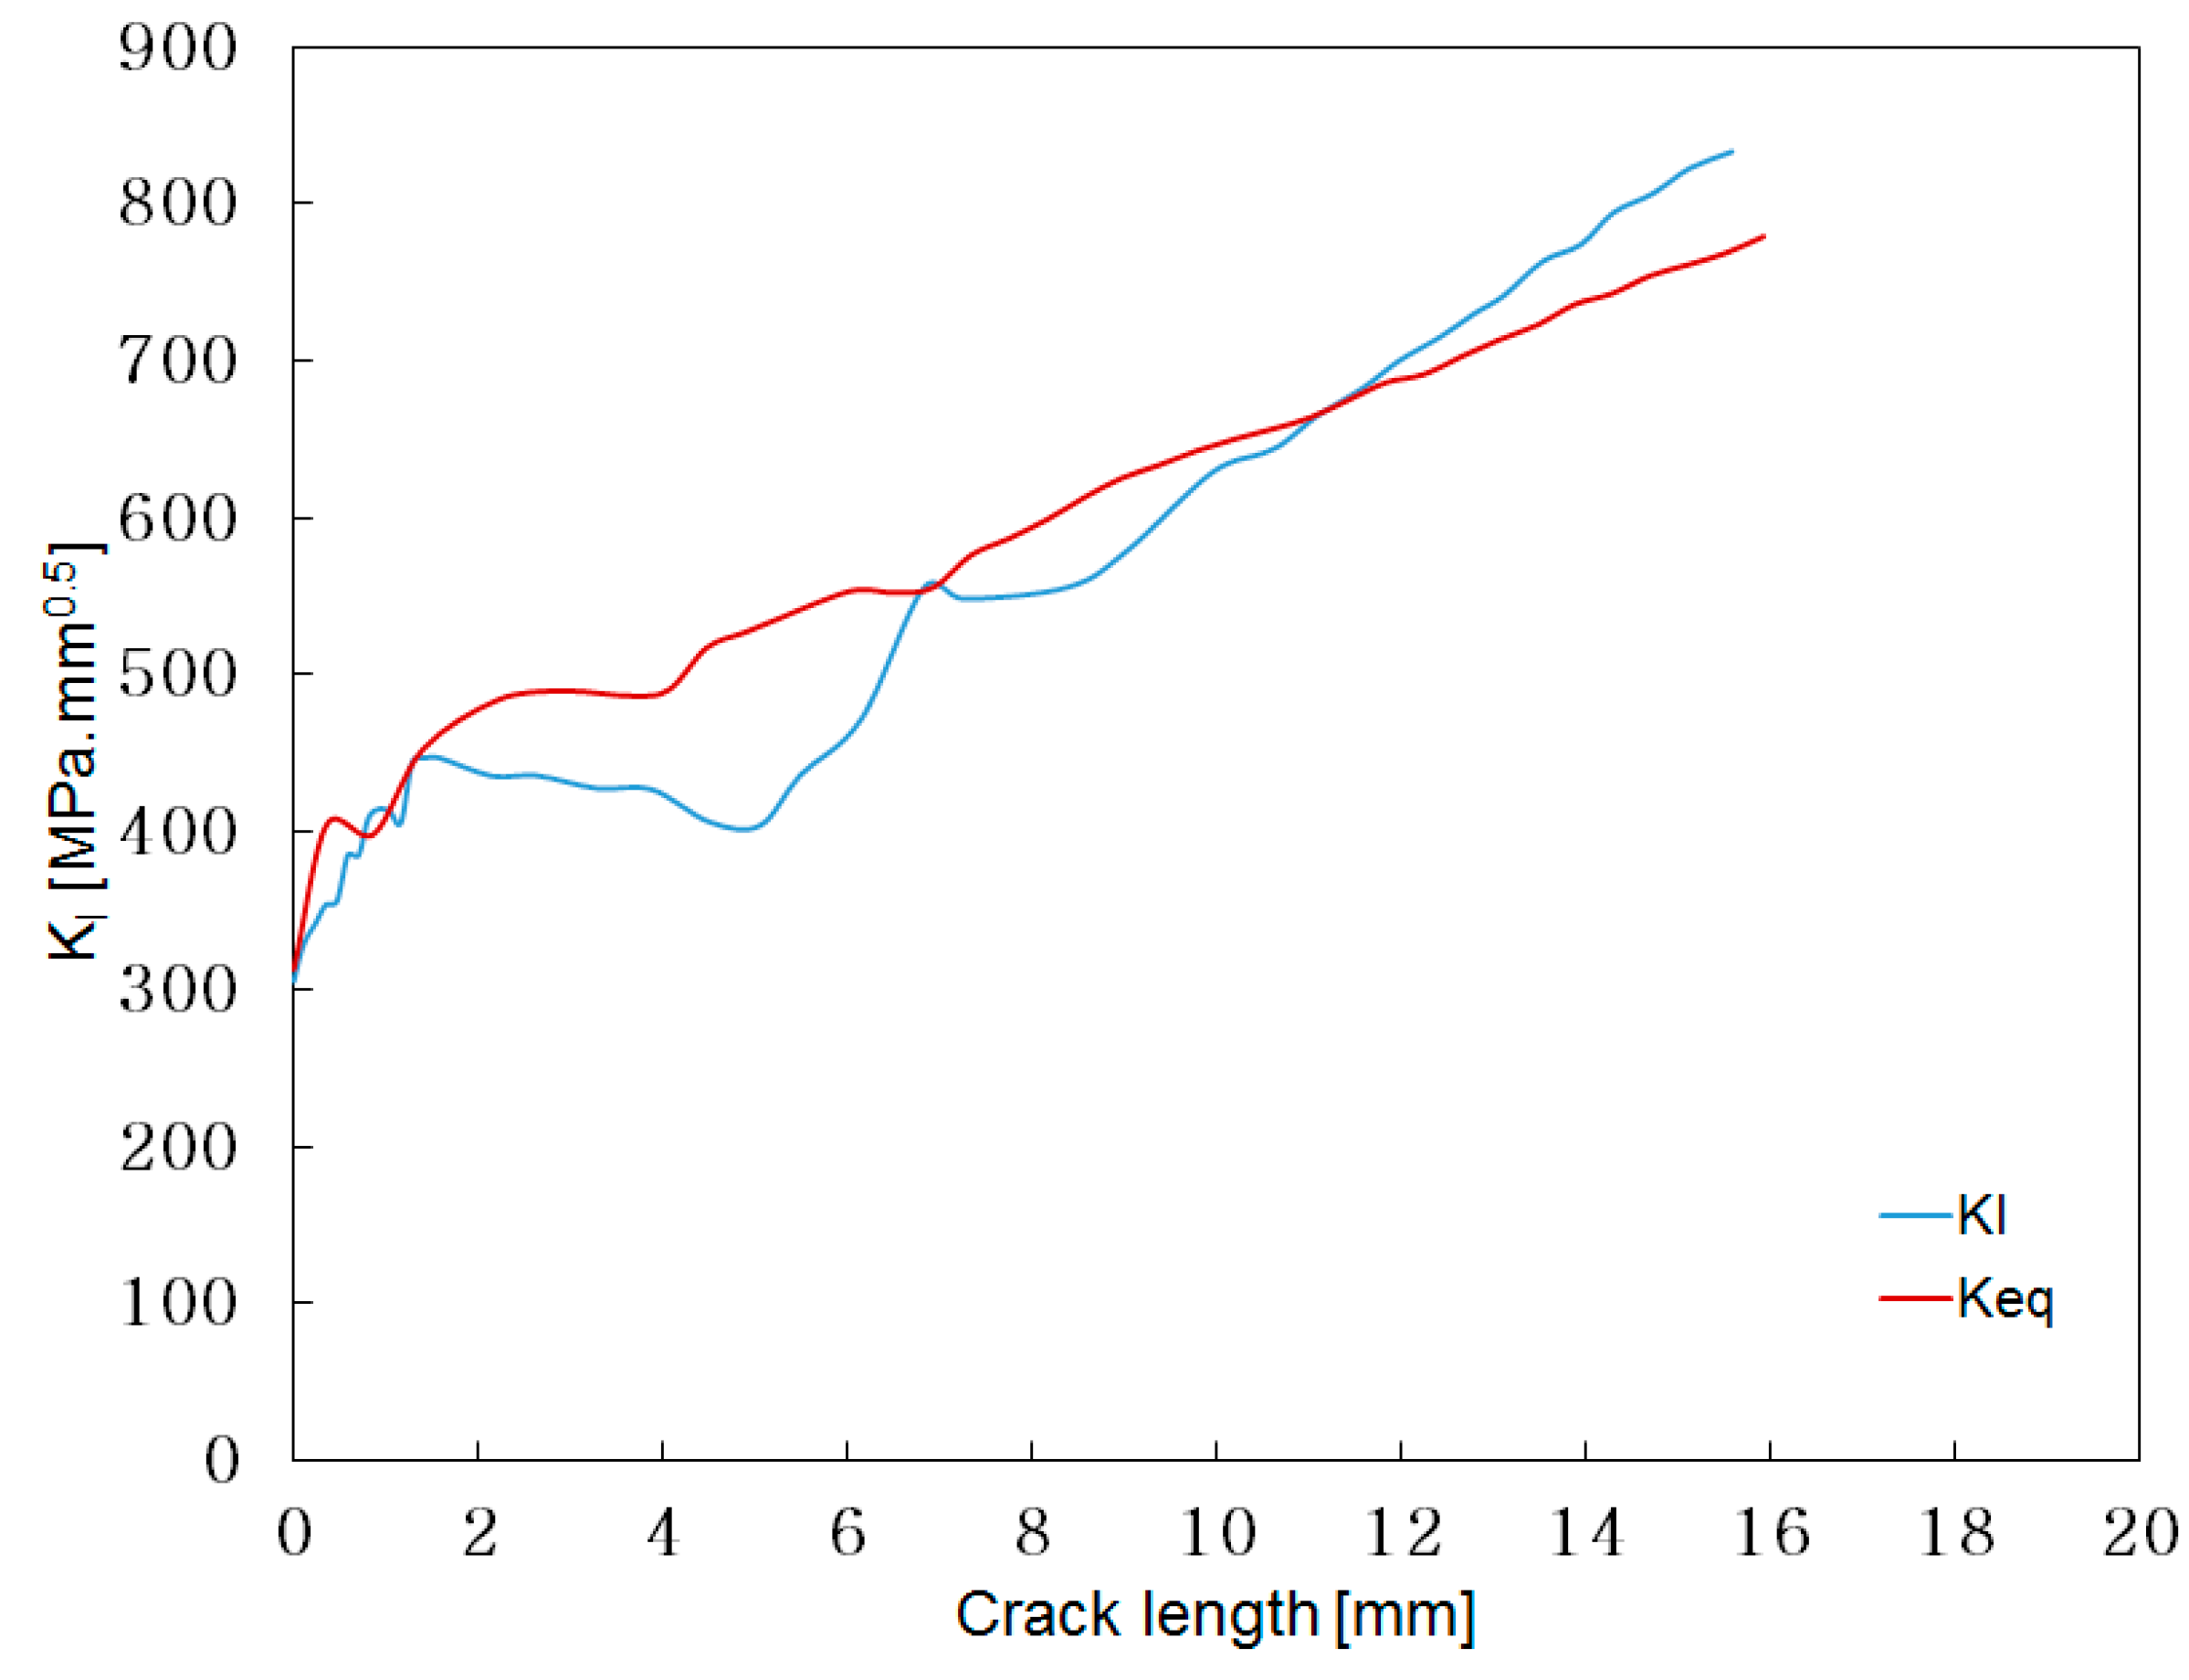
Figure 27.
Comparison between a KI and a Keq driven crack for a 45° short flange geometry, 95% crack front.
Figure 27.
Comparison between a KI and a Keq driven crack for a 45° short flange geometry, 95% crack front.
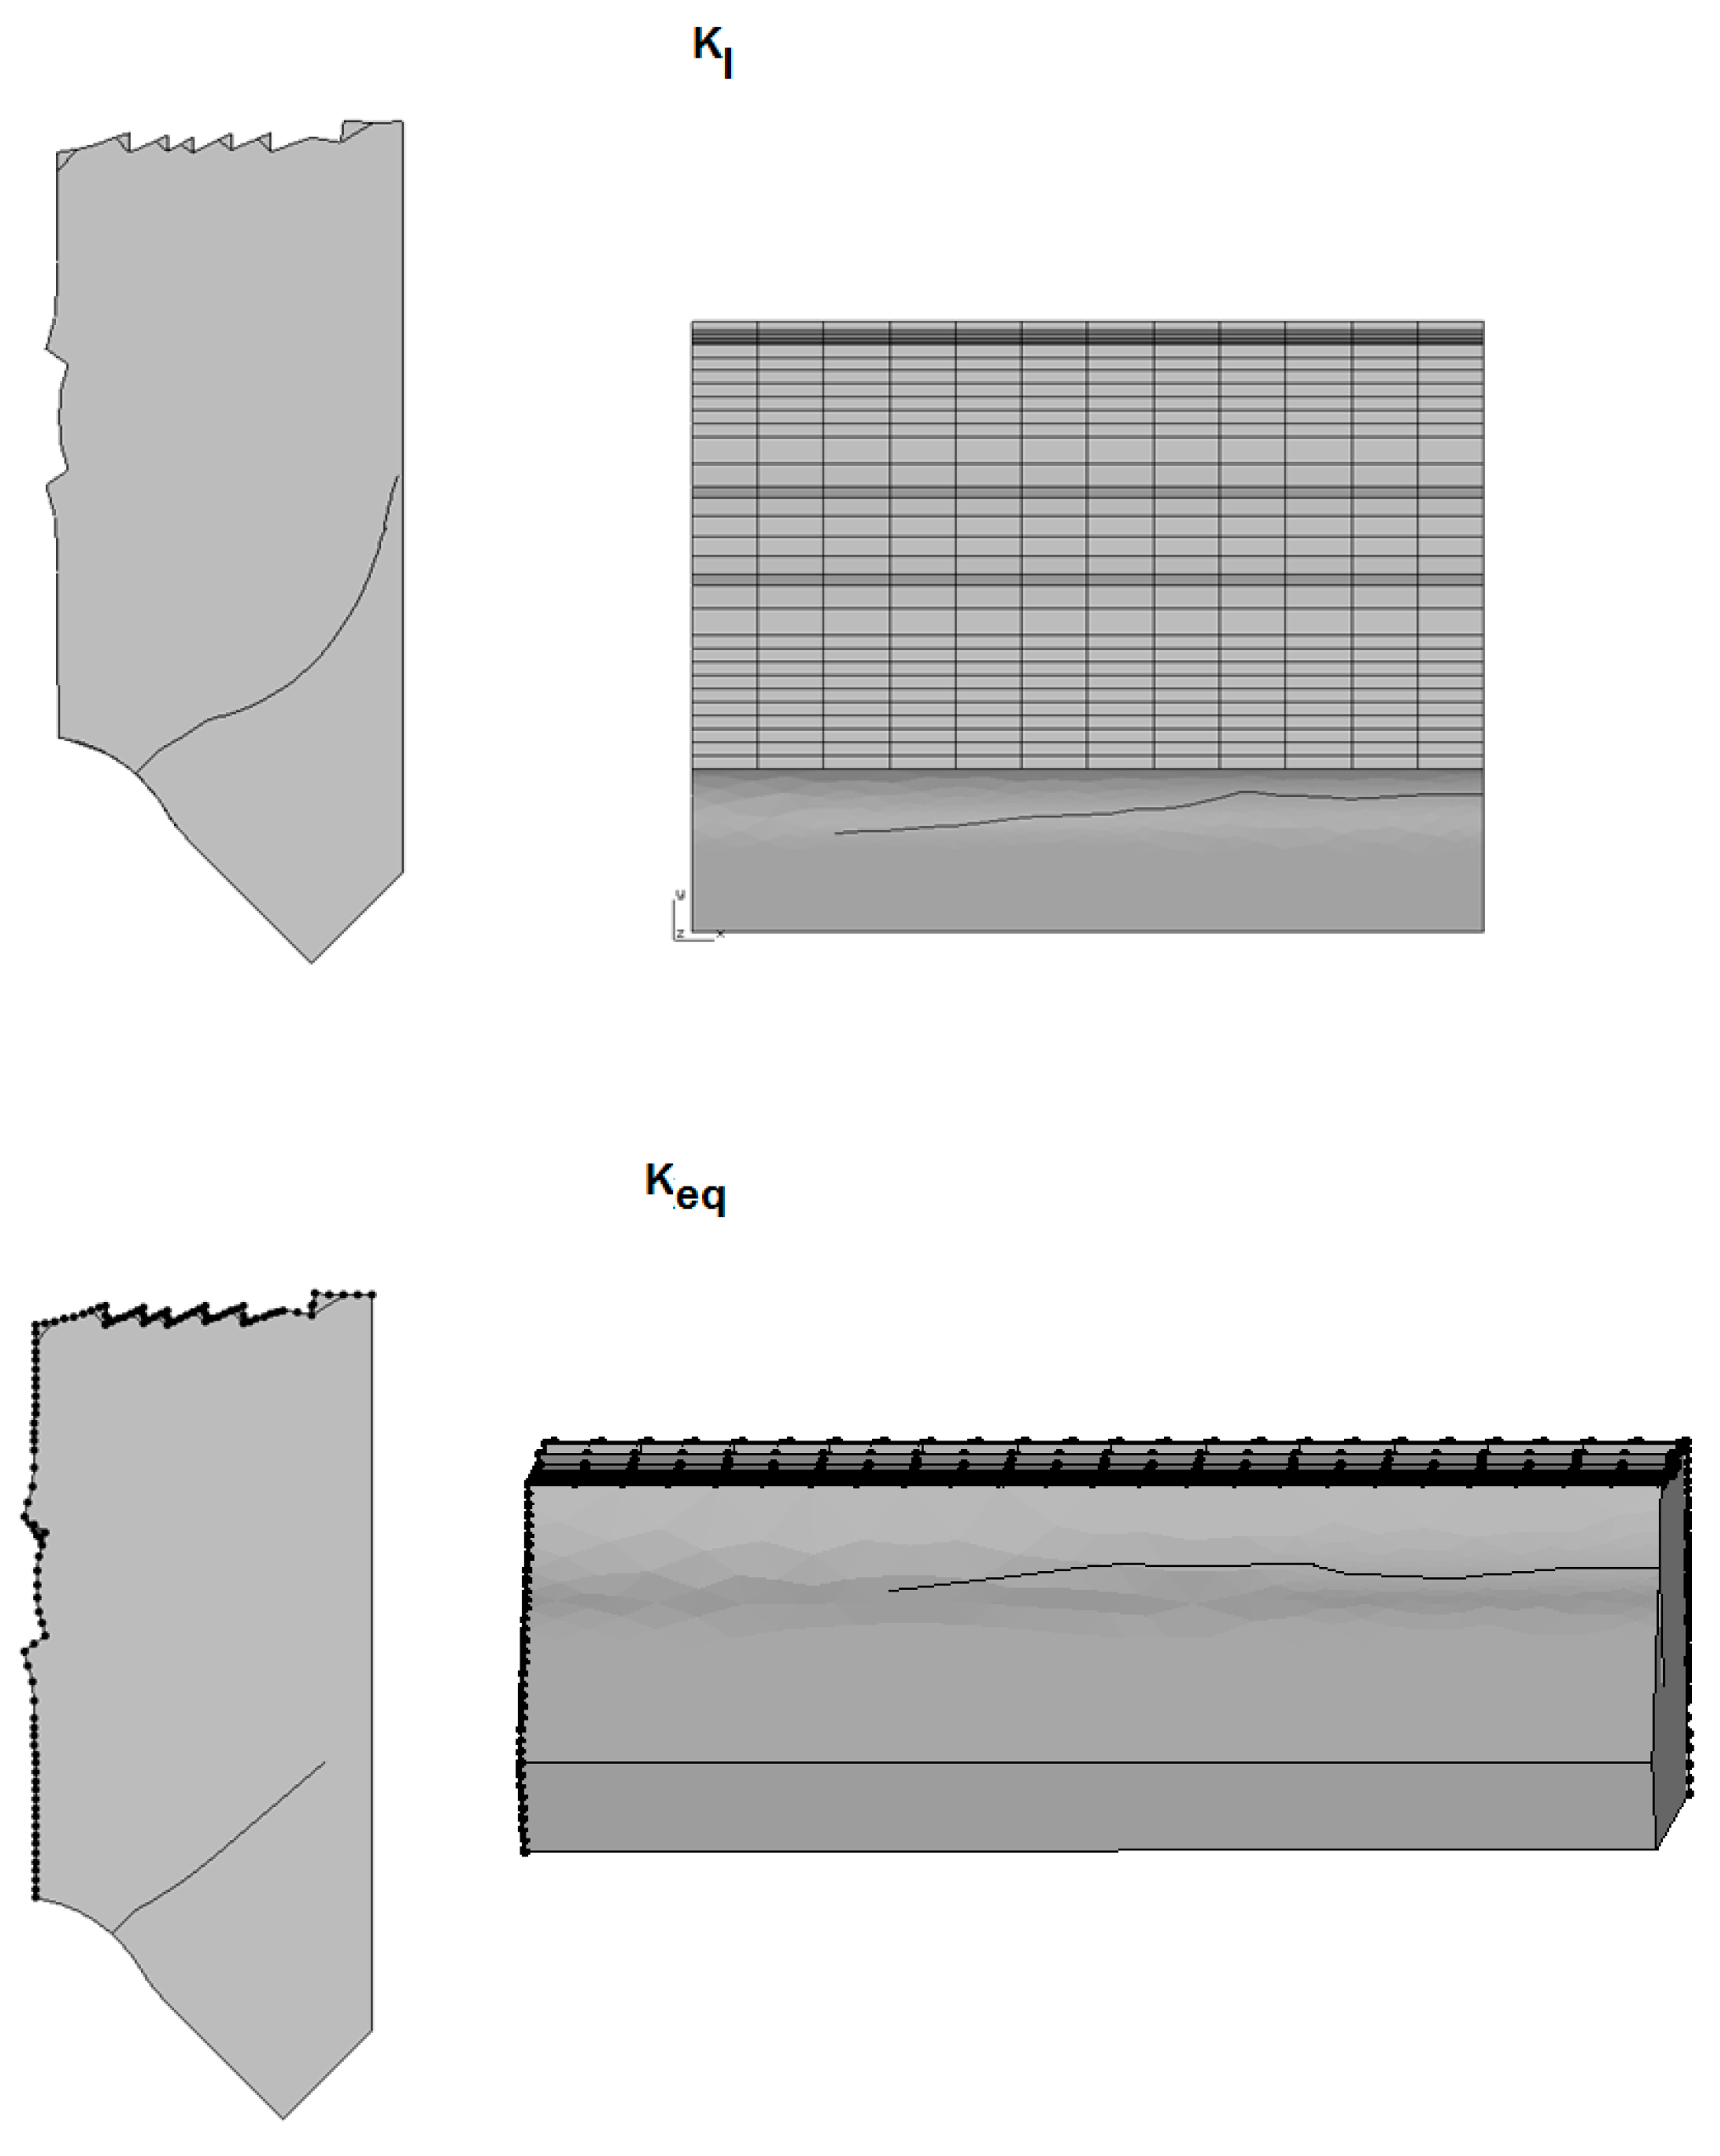
Figure 28.
Crack shape and direction, a direct comparison between KI and Keq. The geometry is a 45° short flank.
Figure 28.
Crack shape and direction, a direct comparison between KI and Keq. The geometry is a 45° short flank.
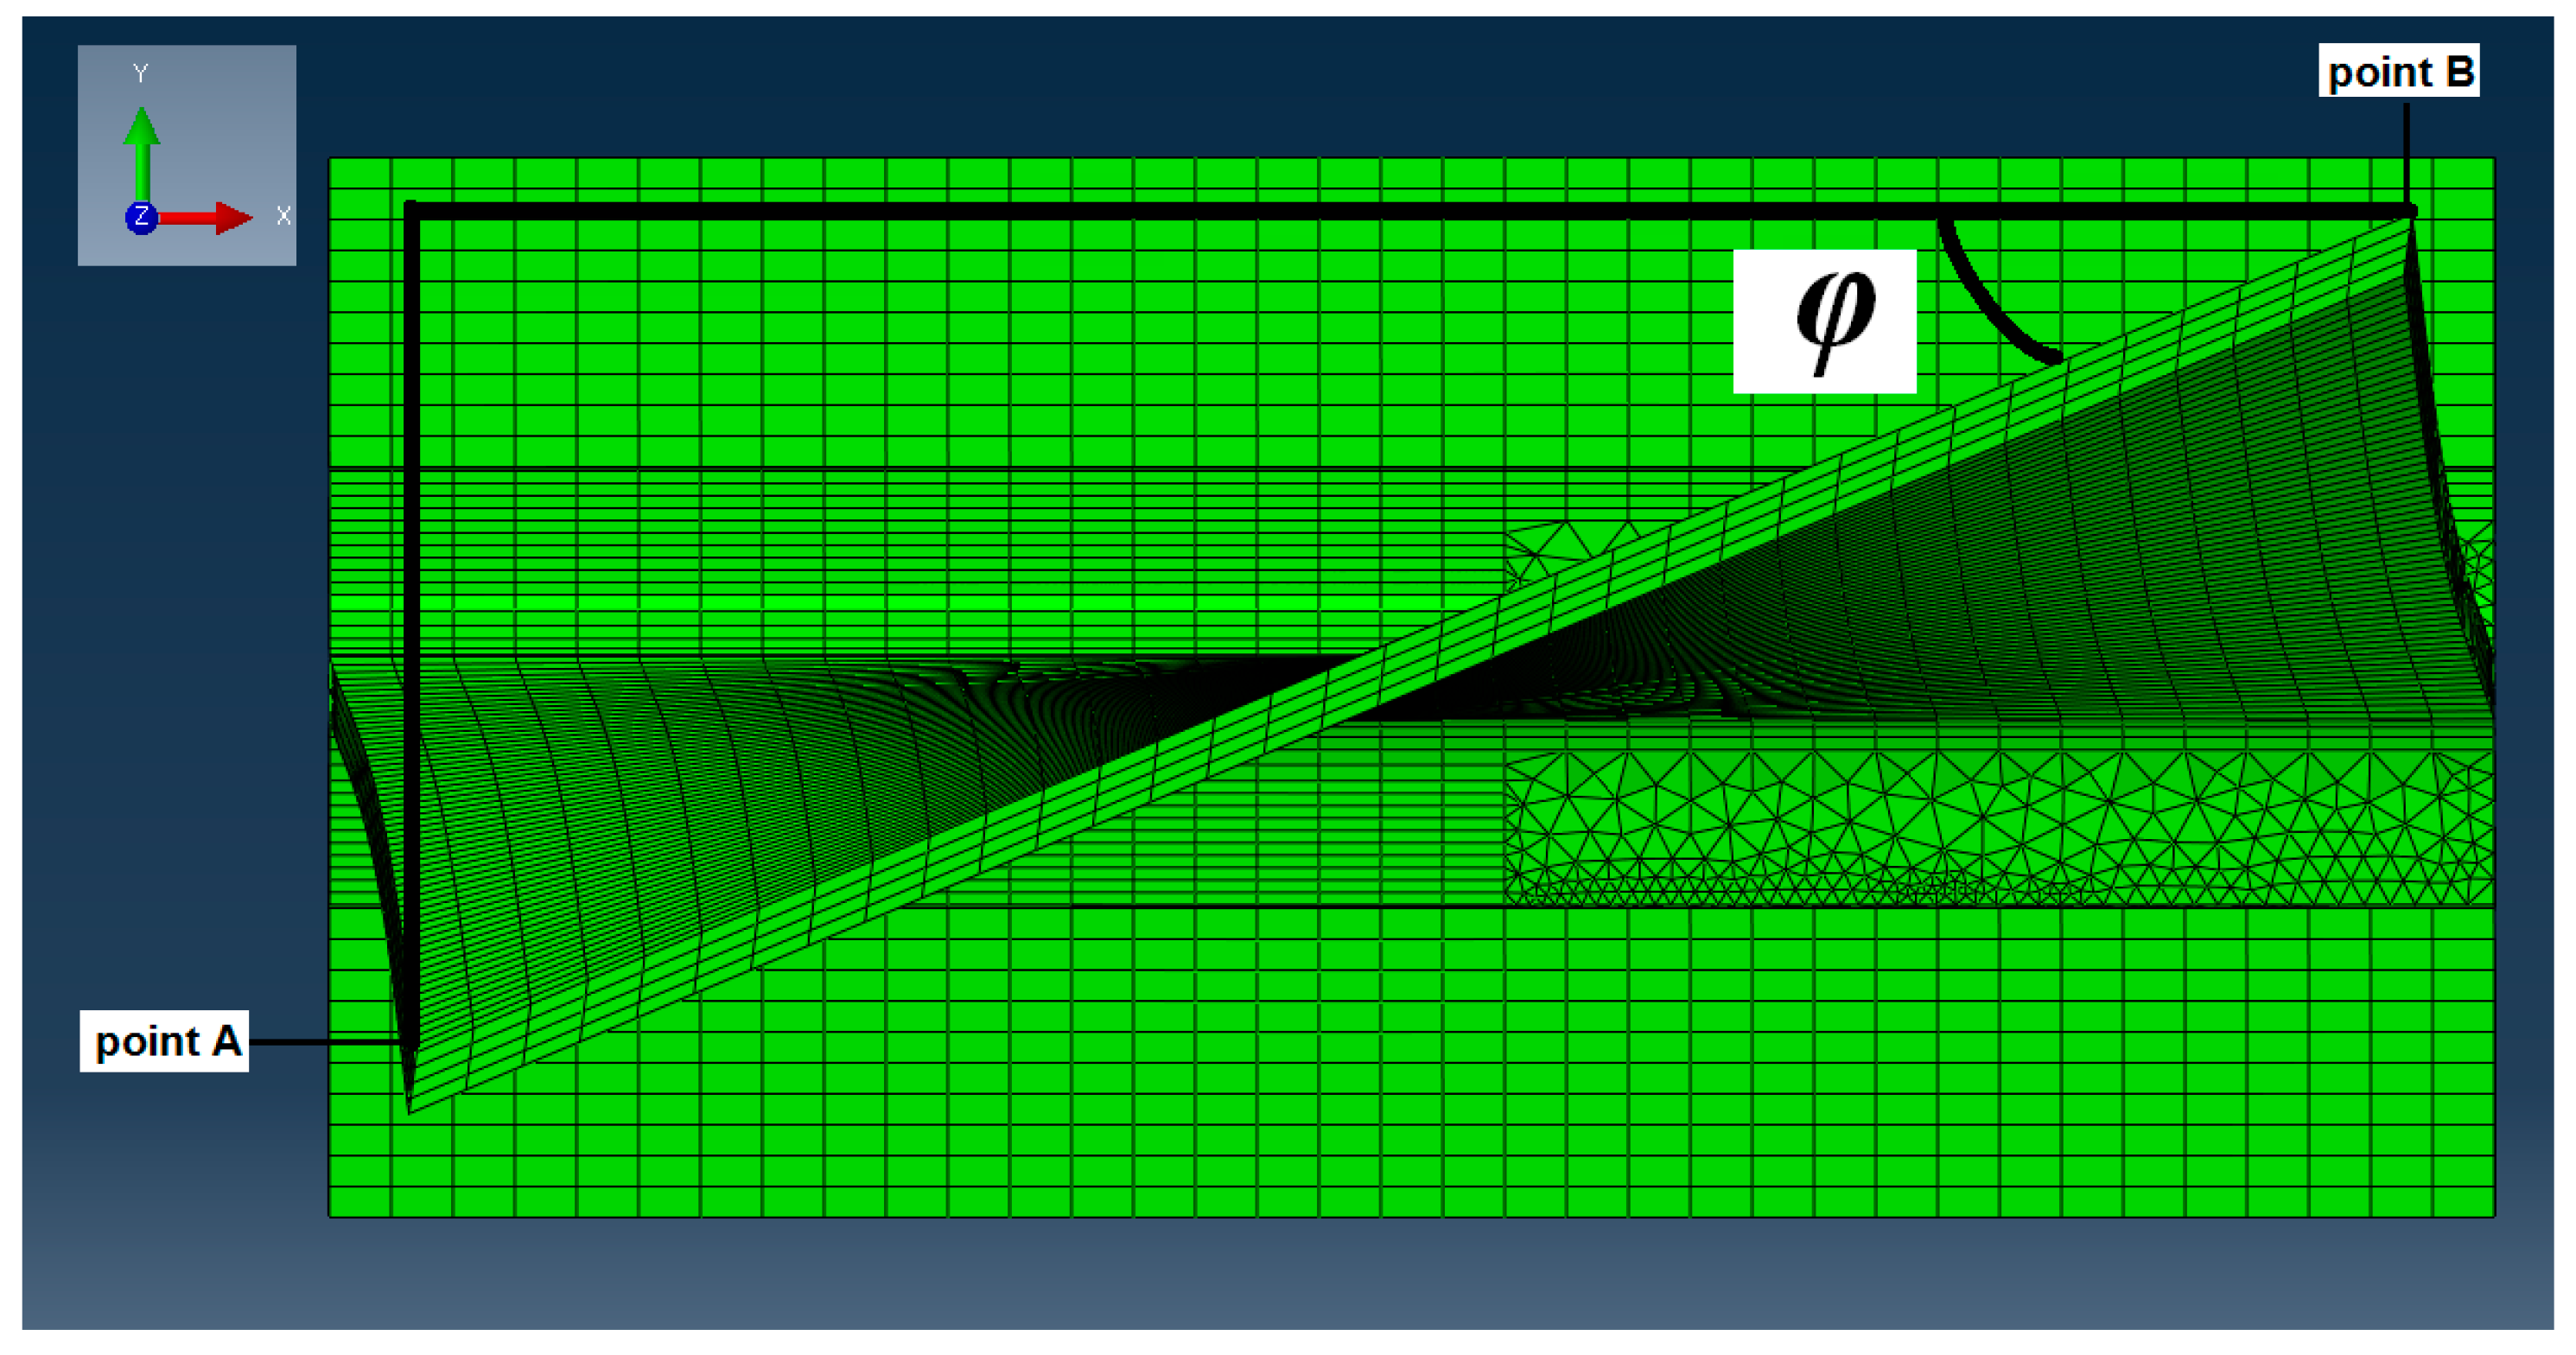
Figure 29.
Definition of angle of twist. Its reduction when a centrifugal load is applied is called “untwist”.
Figure 29.
Definition of angle of twist. Its reduction when a centrifugal load is applied is called “untwist”.
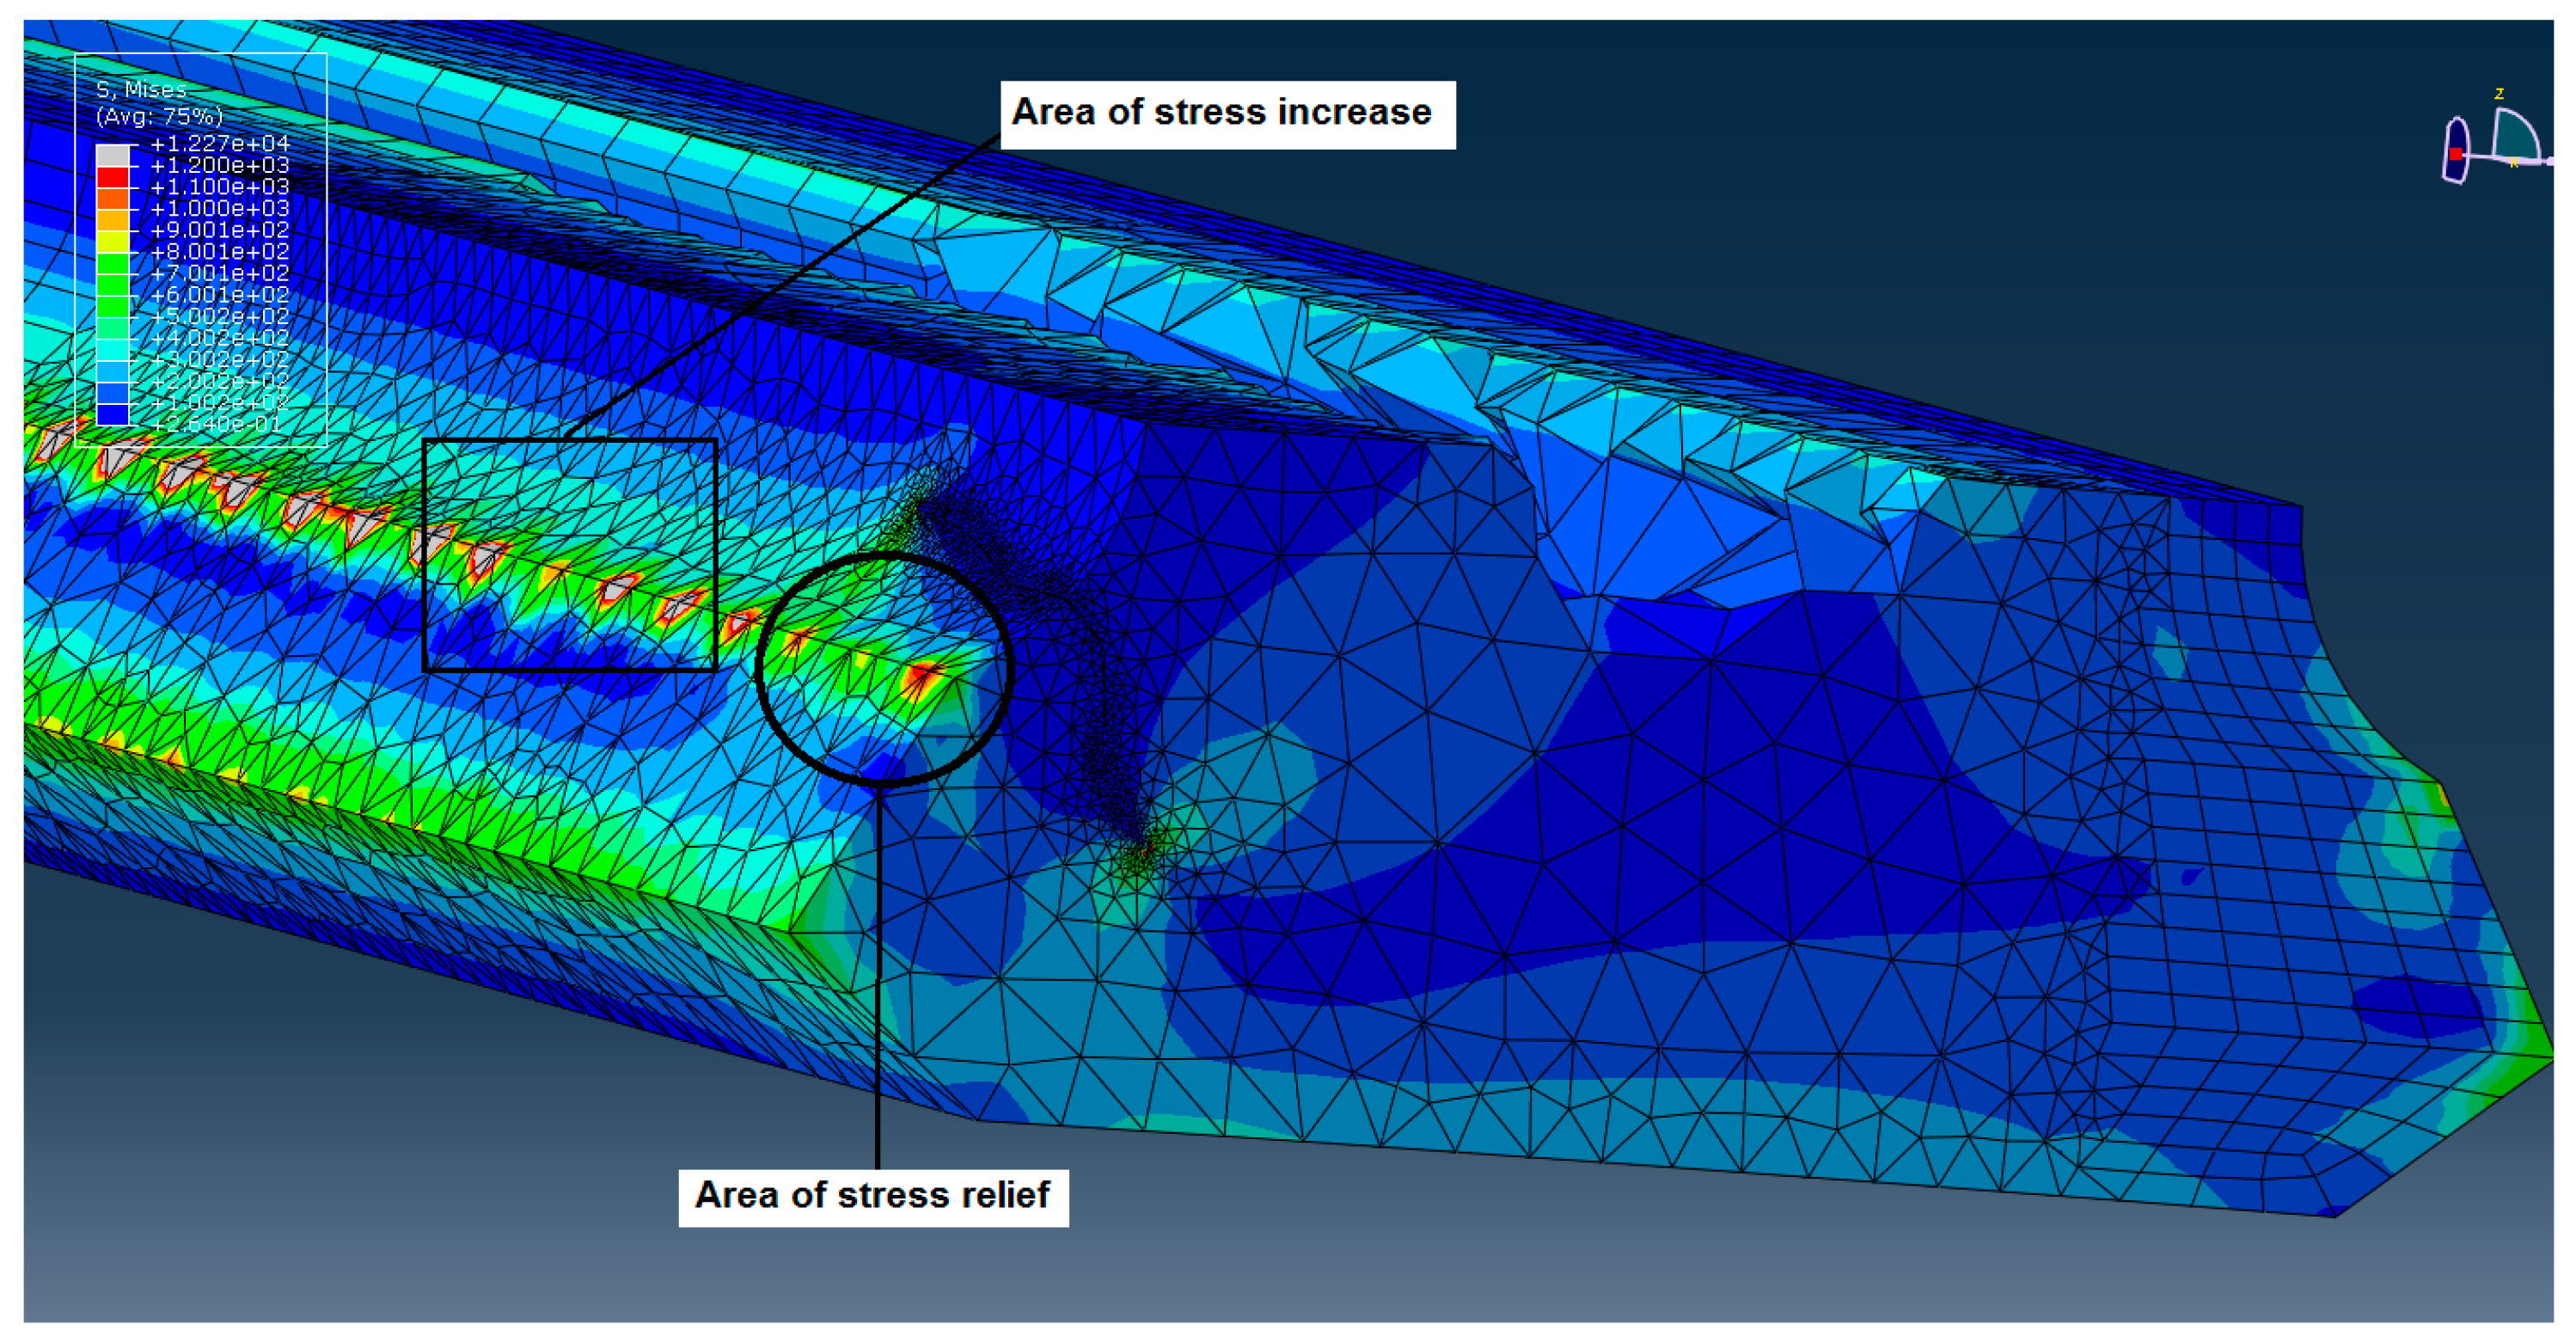
Figure 30.
Contact flank stress re-distribution as a function of the crack progression.
Figure 30.
Contact flank stress re-distribution as a function of the crack progression.
Table 1.
Models prepared for the study presented in this paper.
Table 1.
Models prepared for the study presented in this paper.
| Model Name | Flank Angle (ϑ) | Flank Length (a) mm |
|---|
| 45_short | 45° | 6 |
| 45_long | 45° | 11 |
| 30_short | 30° | 6 |
| 30_long | 30° | 11 |
| 60_short | 60° | 6 |
| 60_long | 60° | 11 |
Table 2.
Loads applied to all the models.
Table 2.
Loads applied to all the models.
| Shaft Rotation Speed (RPM) | Pressure Side (Pressure Value, MPa) | Suction Side (Pressure Value, MPa) |
|---|
| 9550 | 0.18 | 0.16 |
Table 3.
Elastic properties of Ti-6Al-4V used in this paper.
Table 3.
Elastic properties of Ti-6Al-4V used in this paper.
| E (MPa) | v | ρ (Mg/mm3) |
|---|
| 115,000 | 0.33 | 4.43 × 10⁻⁹ |
Table 4.
Crack propagation (Paris law) for the Ti-6Al-4Va used in this paper (data adapted from [
1]).
Table 4.
Crack propagation (Paris law) for the Ti-6Al-4Va used in this paper (data adapted from [
1]).
| KIC [MPa mm0.5] | da/dN Parameter C | da/dN Parameter n | ΔKth [MPa mm0.5] |
|---|
| 869.5 | 1.77 × 10⁻¹⁴ | 3.667 | 121.6 |
Table 5.
Crack propagation parameters data for Ti-6Al-4V reported in different literature. Paris Coefficient (C) units *are compatible with (da/dN) in mm/cycle.
Table 5.
Crack propagation parameters data for Ti-6Al-4V reported in different literature. Paris Coefficient (C) units *are compatible with (da/dN) in mm/cycle.
| Study | KIC [MPa mm0.5] | da/dN Parameter C | da/dN Parameter n | ΔKth [MPa mm0.5] |
|---|
| Barlow [1] | 1739 | 1.7700 × 10⁻¹⁴ | 3.667 | 121.6 |
| Zhu [18] | 1900 | 0.5085 × 10⁻¹⁴ | 3.14 | 163.8 |
| Ritchie [19] | 800 | 4.8340 × 10⁻¹⁴ | 2.5 | 145.46 |
Table 6.
Deformation results for the 30° short flank geometry.
Table 6.
Deformation results for the 30° short flank geometry.
| Crack Length [mm] | Untwist [Degrees] | LE Vertical Deflection [mm] | TE Vertical Deflection [mm] |
|---|
| 0 | −7.2218 | 0.8828 | 0.7257 |
| 1.3738 | −7.2202 | 0.8826 | 0.726 |
| 2.0152 | −7.2157 | 0.8821 | 0.7268 |
| 3.3353 | −7.2139 | 0.8819 | 0.7276 |
| 6.5189 | −7.2054 | 0.8806 | 0.7297 |
Table 7.
Deformation results for the 60° short flank geometry.
Table 7.
Deformation results for the 60° short flank geometry.
| Crack Length [mm] | Untwist [Degrees] | LE Vertical Deflection [mm] | TE Vertical Deflection [mm] |
|---|
| 0 | −7.1913 | 0.9823 | 0.8126 |
| 1.262 | −7.1874 | 0.9818 | 0.8137 |
| 2.722 | −7.1787 | 0.9807 | 0.8163 |
| 4.343 | −7.1639 | 0.9788 | 0.8207 |
| 6.886 | −7.132 | 0.9752 | 0.8299 |
| 9.894 | −7.0661 | 0.969 | 0.8468 |
| 10.816 | −7.0595 | 0.9671 | 0.8524 |
Table 8.
Damage tolerant life of the analysed geometries.
Table 8.
Damage tolerant life of the analysed geometries.
| Geometry | Flank Length | Friction Coefficient | Crack Length at 810 MPa mm0.5 | Number of Cycles at 810 MPa mm0.5 |
|---|
| 45° | Short | 0.7 | 14.73 | 17,842 |
| 45° | Long | 0.7 | 7.80 | 17,644 |
| 45° | Short | 0.1 | 11.16 | 17,805 |
| 60° | Short | 0.7 | 1.845 | 16,528 |
| 60° | Long | 0.7 | 2.38 | 16,836 |
| 30° | Short | 0.7 | 8.61 | 17,681 |
| 30° | Long | 0.7 | 9.98 | 17,734 |


