Featured Application
This study introduces a novel application of the latent class clustering approach for analyzing severe injuries in a high-hazard industrial environment, and has applications for safety practitioners who seek to reduce total cost of occupational incidents, and prioritize incident prevention investments.
Abstract
One of the principle objectives in occupational safety analysis is to identify the key factors that affect the severity of an incident. To identify risk groups of occupational incidents and the factors associated with them, statistical analysis of workers’ compensation claims data is performed using latent class clustering, for the segmentation of 1031 severe occupational incidents in agribusiness industries in the Midwest region of the United States between 2008–2016. In this study, severe incidents are those with workers’ compensation costs equal to or greater than $100,000 (USD). Based on the latent class clustering results, three risk groups are identified with injury nature as the most statistically distinctive classifier. The highest cost injuries include strain, tear, fracture, contusion, amputation, laceration, burn, concussion, and crushing. The most prevalent and statistically significant injury type is permanent partial disability. The study introduces a novel application of latent class clustering in the segmentation of high severity occupational incidents. The analytical approach and results of this study will aid safety practitioners in identifying occupational risk groups and analyzing injury patterns, and inform safety intervention plans to avoid the occurrence of similar incidents in agribusiness industries.
1. Introduction
Safety analysis focuses on identifying the most significant factors that affect the occurrence of an incident [1,2]. Analyzing occupational incidents based on industry and injury characteristics is important for finding causes of accidents, and managing prevention planning [3]. Occupational injury management is significant from organizational, engineering, and economic points of view in an industry [4]. Applying data analytics to identify risk groups in an organization results not only in optimizing workers’ productivity, but also in safety improvement through the targeted control of occupational injuries and illnesses [5]. Injury risk analysis allows investigating modifiable occupational injuries by focusing on intervention [6].
The prediction of occupational incidents is an important task for any industry [7]. Since occupational incidents affect workers’ lives, both in and out of work, and impose a considerable economic burden on employers, employees, medical care systems, insurance companies, and society, taking planned actions to reduce the frequency of occupational incidents is necessary [8]. With the purpose of reducing the frequency and severity of occupational incidents and improving occupational safety, researchers aim to identify causes and mechanisms of the occurrence of occupational incidents [9,10]. Introducing any preventive measure to reduce the risk of occupational injuries is based on a correct assessment of risk components using quantitative methods [11]. Data mining techniques contribute to deriving actionable conclusions from empirical data to improve workplace safety [4]. Understanding the factors influencing the occupational incidents is the first step in the process of preventing incidents and improving workplace safety [9]. In addition, analyzing trends and patterns of occupational incidents helps to develop effective and actionable incident prevention strategies and reduce or eliminate workplace injuries [2]. Incident severity prediction models are crucial for improving safety [12]. In incident and injury severity analysis, identifying subgroups of incidents with homogeneous categorical variables is significant in determining factors that contribute to incident severity [13]. Furthermore, one of the principle objectives in occupational safety analysis is to identify the key factors that affect the severity of an incident. Most datasets with information about incidents have the issue of heterogeneity in the data [14]. Thus, clustering is a beneficial method in analyzing incident factors, and gaining information about those variables that are statistically significant [15].
Latent class clustering for identifying injury/incident patterns has been used mostly in the field of traffic accidents or crash severity analysis. An analysis of cyclist-motorist crashes between 2007–2011 in Denmark revealed 13 distinguished latent classes, and contributed to investigating their prevalence and severity [14]. This analysis showed the features that distinguished the latent classes included incident factors such as speed limit, helmet wearing behavior, and road surface conditions. After determining latent classes of cyclists–motorists, the severity of injuries per latent class was analyzed. A similar study performed in Italy [13] on cyclist crashes between 2011–2013 applied latent class clustering to identify distinguished subgroups of crashes with categorical variables including road infrastructure, road user, vehicle, and environmental and time period variables. They segmented the cyclist crashes into 19 subgroups, each representing a different crash type. Another study used crash data on highway–railway crossings between 1997–2006 in the USA [16], and segmented the injury risk groups of such crashes using the latent class clustering approach. The results identified the most influencing factors on crash occurrence, separating the injury risk groups include the driver’s age, as well as the presence of rain or snow, time of the crash, and motorist’s actions prior to the incident [16]. Several other studies applied latent class clustering for incident pattern recognition, and yielded useful information regarding clusters/subgroups of such incidents and injuries [17,18,19,20,21,22,23]. Although the latent class clustering approach has been popular in crash severity analysis, its application in occupational safety and health analysis has been limited. Virtanen et al. [24] performed a study on 2,445 employees with diabetes to segment them into separated clusters based on potential risk factors for work disability in future. Another study used patients’ data and applied the latent class clustering method to identify factors associated with the risk of low back pain [15].
Despite ongoing improvement in coordinated prevention measures, improved technology, training, and higher education of the workforce [25], agriculturally-related industries are among the most hazardous work environments [26]. Understanding injury patterns and the underlying mechanisms of incidents with respect to a specific industry may produce effective insights for boosting policymaking, training, and incident/injury intervention and prevention efforts [27]. The aim of this study is to identify distinguished and meaningful subclasses of occupational injuries with inflated costs in agribusiness industries incidents based on workers’ compensation claims data. The inflated costs are indicative of the severity of the injury; the higher the claim-incurred amount in dollars, the more severe the injury. The novelty of this study is that it introduces a novel application of latent class clustering in the segmentation of high severity occupational incidents in agribusiness industries. The results will contribute to informed decision-making that could help either prevent the occurrence or reduce the frequency of severe injuries with inflated costs in agribusiness industries.
2. Materials and Methods
2.1. Data
The data were available from an agribusiness insurance provider in the Midwest of the United States. The dataset included over 35,000 workers’ compensation claims from 2008 to 2016. Severe claims were those with the total claim costs over $100,000. The data show that the most costly claims were the least frequent ones. Out of all the claims in the dataset, only 2.82% had a total cost equal or greater than $100,000. Despite being rare, almost $278 million has been incurred on those severe claims from 2008 to 2016. The amount was paid on both claims that are closed, and those open claims which are a continued cost for the parties involved.
The summation of expenses, medical costs, and indemnity costs of each claim, which is called the total incurred amount.is indicative of incident severity. Table 1 shows the summary statistics of the total incurred amount. Table 2 shows all the incident variables from the dataset. Since the study aimed at identifying subgroups of severe incidents, only categorical incident factors were used for segmentation of the incidents into various risk groups. All variables in Table 2 are categorical except for the Age of the injured worker (numerical variable).

Table 1.
Summary statistics for total incurred amount of claims.
Table 2.
Description of variables used in the study.
2.2. Latent Class Analysis
Latent class analysis (LCA) is performed to cluster the data into subgroups with similar injury characteristics. The occupational incidents with a total incurred cost equal to or more than $100,000 are extracted from a large workers’ compensation claims dataset. Over 278 million dollars of losses were incurred on those incidents that constitute 1031 claims, out of more than 35,000 reported injuries in the data. Considering human and financial losses of these workplace incidents, gaining information about the characteristics of high-cost incidents is significant in managing prevention planning [28].
One of the various methods to retrieve information from the data is clustering. Clustering is different from classification. Classification focuses on modeling the independent variables versus a defined categorical target variable. However, in clustering, subpopulations of the whole data are grouped together based on statistical similarity, where the data in each cluster are dissimilar to the data from other clusters [29,30]. Latent class models are used for the cluster analysis of categorical data [31]. LCA is a mathematical method for examining relationships among observed variables when there may be a set of unobserved categorical variables. The main purpose of LCA is to ascertain whether or not the population consists of distinct subgroups, each representing factors with significantly different properties [32].
The purpose of LCA is to cluster the variables into meaningful categories by identifying those variables that best distinguish them [33]. LCA is a model-based approach in which homogeneous groups within a heterogeneous population are identified where individuals with the same class members share a common joint probability distribution among the observed variables such as the same injury type probability profile [34]. Therefore, clustering is used for identifying statistically meaningful groups, and determining practically useful distinctive patterns in the current dataset. Among various clustering techniques to categorize the population into subgroups with similar risk profiles, latent class analysis (LCA) is selected for this study, as it is preferred for segmentation purposes compared to factor analysis or hierarchical cluster analysis [35].
2.3. Contributing Factors
According to [36], to determine the extent of effect of each input variable on distinguishing latent classes, a contingency table analysis of expected counts of class membership by levels or categories of all input variables are done. The expected counts are gained by multiplying the number of observations in each latent class by the conditional probabilities of each level or category of all the input variables. Then, the Pearson chi-square statistic () is calculated for the contingency table of the expected counts of levels by latent classes. Let n represent the number of observations (sample size); the effect size of each input is calculated using Equation (1).
In the next step, the likelihood ratio test p-value for the contingency table of expected counts at the α = 0.01 significance level is gained and shown as pLR. The −log10 (pLR) is calculated as the Likelihood Ratio (LR) Logworth statistic. A LR Logworth value above 2 corresponds to being statically significant in differentiating the latent classes at the α = 0.01 significant level (because −log10 (0.01) = 2).
2.4. Criteria for Selecting Optimal Number of Latent Classes
To select the optimal number of clusters, three performance evaluation metrics are used: Akaike information criterion (AIC), Bayesian information criterion (BIC), and log-likelihood (LL). Both AIC and BIC are calculated based on the value of the log-likelihood (LL). LL is the logarithm of the likelihood ratio, which is a test comparing the fit of two models by examining the predictive power of one model compared to the other [37]. According to Burnham and Anderson [3]. AIC and BIC are computed for each latent class model, and are defined as in Equations (2) and (3), where k is the number of estimated parameters in the model, and n is the number of observations used in the model. Comparing AIC and BIC values, the model with the smallest value is considered a better fit. The difference between AIC and BIC is that BIC chooses models with fewer parameters than AIC does.
3. Results
This section includes a discussion of the model fit statistics to determine the best number of latent classes, and an explanation of the characteristics of the selected latent classes as well as the most statistically significant classifiers of latent classes. An analysis of the relationship between the latent class members and injury outcomes and costs completes this section. The terms “class”, “cluster”, and “latent class” are interchangeably used.
3.1. Summary of Latent Class Analysis
The LCA is conducted to identify statistically distinctive and meaningful risk subgroups of occupational incidents in agribusiness industries based on injury type, class codes, injured body part(s), cause, and nature of the injury. In the first step, the latent class analysis is employed as an explorative method for pattern recognition in the data fitting eight models with 3 to 10 latent classes. AIC and BIC are used as the relative fit measures. Lower values for BIC and AIC show a better fit to the data. The fit statistics for models with different numbers of classes are shown in Table 3.
Table 3.
Model fit statistics.
The changes in BIC and AIC represent the model with three classes as the best fit. Based on values of BIC and AIC, three classes with different injury patterns are found: class one (44.32% of the population), class two (34.31% of the population), and class three (21.37% of the population).
In order to decide each row of the data, which includes various levels of input variables, belonging to each latent class (class 1, 2, or 3), the probability of the class membership is calculated for each latent class. By comparing the three probabilities, the one with the highest value determines the latent class to which that specific data row belongs. The statistical details for calculating per class formula is given based on [38].
Let j = 1, ..., J represent the observed columns (Y) of input variables. For this study, those Y columns are the input variables of injury type, class codes, injured body part(s), cause of injury, and nature of injury. Denote the number of levels for column j by Rj. A multidimensional contingency table of the J variables contains W = R1*...*RJ cells. Each of these cells is defined by its response pattern for the J variables. Therefore, each response pattern is a J-length vector of the form y = y1, ..., yj. Define Y to be the W by J array of all the response patterns considered as row vectors. Each element, yw, in Y has a probability Pr(yw). These probabilities sum to 1, as given in Equation (4):
Consider the following notation:
- C is the number of clusters in the latent class model.
- is the probability of membership in cluster c (the are the latent class prevalence). These parameters sum to 1.
- is the kth level of the jth response.
- is the probability of observing response rj, k in column j conditional on membership in class c (the are the item-response probabilities). For a given cluster and response variable j, the sum of the is 1.
- is an indicator function that equals 1 when the yj response is the kth level of the jth response, and 0 otherwise.
As presented in Equation (5), the probability of observing a specific vector of responses yw = y1, ..., yj is the sum of the conditional probabilities of observing that vector of responses for each of the C latent classes:
Thus, Equation (5) is the denominator of the probability formula that is saved to the dataset for each row. The final formula for probability per latent class gives Pr(Cluster = c|yw), which equals to Pr (yw, Cluster = c)/Pr (yw).
For example, for a data row that describes a permanent partial disability in chauffeurs and helpers class code, for knee as the injured body part, with cause of strain or injury by, and nature of strain or tear, the probability of belonging to latent classes 1, 2, and 3 is calculated as 0.9982, 0.0017, and almost zero, respectively. Thus, this row is labeled as latent class 1. Similarly, such process continues until all data rows are labeled as either latent class 1, 2, or 3. Then, the frequency of all the classes is calculated. Based on the results, class one includes 44.32%, class two has 34.31%, and class three counts includes 21.37% of the data rows.
Furthermore, the analysis of the 3-cluster model shows that medical injuries, major permanent partial disability, minor permanent partial disability, and permanent total disability are not present in any of the three classes. However, permanent partial disability and temporary total or partial disability injuries are the most prevalent in all three classes. The only class that includes fatality with some size (0.16) is class three. Chauffeurs or helpers, grain elevator operations, gas and oil dealers, hay grain or feed dealers, grain milling, and farm machinery operations are the class codes present in all three classes with various probabilities (only those class codes with a probability higher than 0.06 are shown in the class tables). The most statistically distinctive factor is the nature of the injury, which is different in each class with a sizable probability. Injured body parts and cause of injury are also different in each class with a less significant presentation probability. The mean total costs of claims are also different, with class one having the lowest mean of $205,583 and class three having the highest mean of $374,783. The mean total cost of claims for injuries in class two is $289,086.
3.2. Contributing Factors in Differentiating Classes
Based on the statistical details given in Section 2.3, the effect size per input variable and its corresponding Logworth values are calculated and shown in Table 4. Considering the values of LR Logworth, all the input variables are statically significant classifiers of latent classes for the selected three-class model, with nature of the injury as the most influential factor in segmenting occupational incidents.
Table 4.
Description of variables used in the study.
3.3. Characteristics of Latent Class Members
Class one is characterized by the very high probability of 0.78 of strain or tears as the nature of the injury. The significant type of injury is permanent partial disabilities (0.75) and temporary total or partial disability with a much lower probability of 0.24. Such injuries occurred in the lower back area (0.37), shoulders (0.29), and knees (0.11). The dominant causes of injuries in this class include lifting with the probability of 0.22 and strain with the probability of 0.16 followed by fall, slip, or trip (0.08), injury on ice or snow, twisting and repetitive motions (0.05). Class codes with the highest probability are chauffeurs and helpers (0.12), grain elevator operations (0.097), and gas and oil dealers (0.08). The specific probabilities of this class are shown in Table 5.
Table 5.
Characteristics of injury patterns in class 1.
Class two consists of injuries with 0.75 probability of permanent partial disability. This class is characterized by fracture and contusion as nature of injury with probabilities of 0.47 and 0.23, respectively. The most significant cause of injury is fall; fall from a different level (elevation) has the highest probability of 0.19, followed by slip or trip (0.10) and fall from ladder or scaffolding (0.09). Motor vehicle, falling or flying objects, and falling on snow or ice are less prevalent causes of injury in this class. Multiple body parts have the probability of 0.12, while the knees, ankles, and shoulders have an equal probability 0.08. Hips, soft tissues, and the skull have the lowest probabilities of 0.06, 0.05, and 0.05, respectively. Class codes with the highest probability are chauffeurs and helpers (0.12), grain elevator operations (0.098), and hay grain or feed dealers (0.08). The specific probabilities of this class are shown in Table 6.
Table 6.
Characteristics of injury patterns in class 2.
As shown in Table 7, class three is characterized by the nature of injury for all other specific injuries, amputation, laceration, fracture, burn, concussion, and crushing in multiple body parts, hand, lower leg, foot, fingers, and skull, which are caused mainly by machine or machinery, vehicle upset and being caught in, under, or between categories. Class three is different from the other two classes in that it is the only one including death with a big enough probability of 0.16. However, the probability of permanent partial disabilities (0.64) and temporary total or partial disabilities (0.16) are lower, compared to the earlier classes. Class codes with the highest probability are grain elevator operations (0.11), hay grain or feed dealers (0.08), grain milling (0.06), and farm machinery operations (0.06). Injuries in multiple body parts have a probability of 0.30 with specific injuries having the probability of 0.20.
Table 7.
Characteristics of injury patterns in class 3.
As discussed previously, all the same class codes are present in all classes with slightly different probabilities. However, looking at the mean total cost of claims for each class code within each class shows the noticeable differences depicted in Table 8.
Table 8.
Frequency and severity of claims based on latent class analysis (LCA) (2008–2016).
3.4. Association of Class Membership and Injury Outcomes
Based on the data in Table 7, the financial risk calculation is done for the expected losses of the workers’ compensation claims in the classes selected based on the LCA model in the previous section. The financial risk definition used here is the multiplication of the frequency of losses (number of incidents in each class) by the severity of losses (the mean of the total cost of claims incurred per class code in each class). Figure 1 shows the results of the financial risk calculation. This provides a simple frame for estimating future losses based on the historical data and the latent class analysis. As Figure 1 shows, the biggest claim costs were from chauffeurs or helpers, grain milling, and grain elevator operations in latent classes one, two, and three respectively, between 2008–2016. The occupational injuries (or fatalities) among grain elevator operations in class three and the grain-milling class codes have the highest mean total claim cost compared to classes one and two.
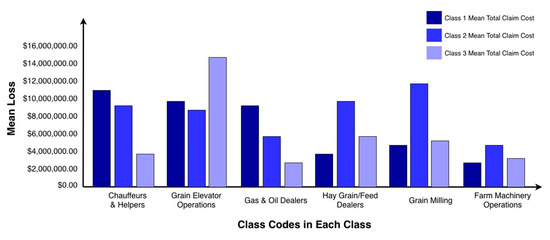
Figure 1.
Categorization of occupational injuries mean loss per latent class.
3.5. ANOVA Test for Mean Total Claim Costs Per LCA
In addition, analysis of variance (ANOVA) is used to test whether the differences in average claim monetary values among the three latent classes are statistically significant. This analysis helps in confirming the perception that the difference in the cost of the severity of incidents in each class does not occur totally at random, and is due to some existing variables in each class. As discussed above, the mean total costs of claims are also different. Latent class one has the lowest mean of $205,583 while latent class three the highest mean of $374,783. The mean total cost of claims for injuries in latent class two is $289,086. As shown in Table 9, an injury has a cost of $232,000 to $305,000 in class one, $225,000 to $312,000 in class two, and $233,000 to $335,000 in class three. According to Table 10, the p-value < 0.05 suggests that the difference in the average cost among pairwise classes is also statistically significant.
Table 9.
Analysis of means at 95% confidence interval.
Table 10.
Ordered differences report for latent classes.
4. Discussion
The results of the present study suggest that the occupational injuries in major agribusiness industries in the Midwest of the United States consists of segments characterized by a distinct nature of injury patterns and occupation classes. The insight gained through this study can be used to define a different categorization in the workers’ compensation field based on injury characteristics for severe injuries. This helps risk managers and safety professionals design and implicate preventive measures and strategies occupation-wise to achieve the goal of fewer and less severe injuries. This work provides a basis for analyzing severe injuries in a high-hazard industrial environment. The results of this study have significant applications for safety practitioners. Reducing the total cost of risk is a major goal for risk managers, and for claim and safety professionals in any organization. The results of the study have significant implications in determining which ergonomic investments will have the greatest impact on a company loss. LCA modeling showed that the driving factors of loss include strain, tear, fracture, contusion, amputation, laceration, burn, concussion, and crushing when leading to permanent partial disabilities in the lower back area, shoulders, knees, soft tissues, hip, lower leg, ankle, skull, finger, foot, hand, and multiple body parts. In addition, such injuries created excessive costs when the injured workers were working as grain elevator operators, grain millers, hay grain feeders or dealers, chauffeurs or helpers, and gas or oil dealers. Those injuries had causes of caught (in/under/between), vehicle upset, machine or machinery, falling or flying objects, motor vehicles, from ladder or scaffolding, fall, strip, trip, from different levels (elevation), and strain or injury by, pushing, pulling, or twisting, on ice and snow.
As shown in Table 11, the average age of injured workers is 45 to 50 years old for all three classes. Even though age was not as important a variable in the prediction of severe injuries, the analysis shows that a higher age of workers imposes higher medical and indemnity costs on the employers, employees, and insurance companies. This confirms prior research that hazards in the workplace may exacerbate age-related disorders. One limitation of the study is that the dataset does not provide any information of the medical history of the injured workers. Having access to prior records of injury per worker, which is entitled to specific ethical issues, would clarify more information about the high medical costs. This clarifies the importance of ergonomics and health data collection in agribusiness industries to reduce the total cost of risk.
Table 11.
Average cost by class.
The LCA models help obtain more information about the most important characteristics in each cluster and the interaction between various variables. Overall, the nature of injury, cause of injury, and occupation are the classifiers that most differentiate the clusters.
Cause of injury is a preventable factor, as it exists in the workplace prior to incident occurrence, while the nature of injury is defining after the incident occurs. Therefore, identifying causes of injuries is significant in reducing the likelihood and frequency of injuries, while identifying the nature of injuries can help in estimating health care cost planning and management.
The claims with the highest costs were incurred on the injuries in cluster 3 with an average total incurred value of $375,000. Considering the causes of injuries in cluster 3, the main predicted causes were motor vehicle, crash of rail vehicle, vehicle upset, animal or insect, temperature extremes, slip or trip, electric current, hand tools (not powered), absorption/inhalation/ingestion, moving parts of machines, caught in/under/between, and struck or injured by.
The next large claims were incurred on injuries in cluster 2, with an average of $289,000. It was predicted that injuries in cluster 2 were caused by cold objects/substances, explosion or flare back, fall from elevation, objects being lifted or handled, from liquid or grease spills, and striking against or stepping on. Freezing was the predicted cause in both cluster 1 and 2 with an equal probability of occurrence.
Deriving the specific causes of injuries can direct the focus of prevention measures to decrease the chance of future incident occurrence by removing the sources of risks. Using the injury information from this study, safety and health training and educational programs can focus on the identified causes for high-cost injuries to decrease hazard exposures and reduce the probability and costs of potential occupational incidents. Risk management control alternatives can be employed including risk avoidance, loss prevention and reduction, setting standards for defining acceptable performance, comparing the actual results with the standards, and modifying actual results to comply with standards.
Considering injury nature, the predicted prevalent nature of injury in cluster 3 includes vision loss, hearing loss or impairment, strain or tear, puncture, asphyxiation, amputation, laceration, carpal tunnel syndrome, concussion, rupture, electric shock, and respiratory disorders with probability over 80%. The nature of injuries that were predicted to occur with more than 80% probability include contusion, dislocation, and fracture in cluster 2, and sprain or tear, and inflammation in cluster 1.
Such insight informs technical and managerial decisions about the planning and executing risk management programs in agribusiness industries. Technical decisions answer the question of what action should be taken in which areas, while managerial decisions address the questions of who should take action, and how. A risk management program includes stages of identifying risk exposures, measuring and estimating risk exposures, risk mitigation strategies, and continuous performance evaluation of risk mitigation strategies.
5. Conclusions
Using workers’ compensation extensive claims, the aim of this paper was to identify distinctive and meaningful classes of occupational incidents based on workers’ compensation claims data on injuries. Based on latent class analysis, three main classes were identified that included the details of injuries per class. The results from analysis of variance confirmed that the difference in the average severity of incidents’ cost in each class does not occur totally at random and is due to some existing variables in each class. The occupational injury analysis carried out in this study can be repeated systematically per year to identify sources of safety risk, analyze the underlying causes of injuries, and decide on proper safety measurement plans to avoid the occurrence of similar incidents.
The study has several limitations arising from the nature of data. First, there is inconsistency in data collection or recording processes. Not all incident reports included accurate information on the age and tenure of the injured workers due to wrong or missing entries. This might be due to wrong entry, lack of data, or human error. Second, claims are recorded based on the injured workers’ information and general industries. Having access to detailed data about the injury history in specific industries can make the analysis more focused and useful. Finally, the data do not provide any information about the working hours and days away from work. Having access to detailed information, the probability of future injuries can be calculated using alternative clustering analyses that fit to numerical variables as well as categorical factors. Furthermore, the presence of added variables such as working hours and days away from work contributes to identify their potential association and trend within each cluster. In addition, the availability of days away from work data can help develop similar models to predict days away from work and indemnity costs in a new research.
Although the focus of this study was on analyzing severe injuries in agribusiness industries, a similar approach is useful in analyzing and determining patterns of severe injuries in other manufacturing industries. In addition, this study enlightens the value of ergonomic and health data collection and analyses. The results suggest that when specific medical and health information of the injured workers is available, quantitative analyses are reliable in estimating loss cost and addressing the bottlenecks in inflated claims. Future work can focus on studying the possibilities and tools for collecting ergonomic and health data for specific industries and occupations. The more detailed and reliable data are available, the more realistic, reliable, and applicable the quantitative analyses and the models will be for implication in injury prediction and reduction.
Author Contributions
Conceptualization, F.D.K., S.A.F. and G.A.M.; Formal analysis, F.D.K.; Methodology, F.D.K., S.A.F. and G.A.M.; Resources, S.A.F. and G.A.M.; Writing–original draft, F.D.K.; Writing–review & editing, F.D.K., S.A.F. and G.A.M.
Funding
This research received no external funding.
Conflicts of Interest
The authors declare no conflict of interest.
References
- Bevilacqua, M.; Ciarapica, F.E.; Giacchetta, G. Industrial and Occupational Ergonomics in the Petrochemical Process Industry: A Regression Trees Approach. Accid. Anal. Prev. 2008, 40, 1468–1479. [Google Scholar] [CrossRef] [PubMed]
- Shafique, M.; Rafiq, M. An Overview of Construction Occupational Accidents in Hong Kong: A Recent Trend and Future Perspectives. Appl. Sci. 2019, 9, 2069. [Google Scholar] [CrossRef]
- Burnham, K.P.; Anderson, D.R. Multimodel Inference: Understanding AIC and BIC in Model Selection. Sociol. Methods Res. 2004. [Google Scholar] [CrossRef]
- Drury, C.G. Human Factors/Ergonomics Implications of Big Data Analytics: Chartered Institute of Ergonomics and Human Factors Annual Lecture. Ergonomics 2015, 58, 659–673. [Google Scholar] [CrossRef] [PubMed]
- Emanuele, C.F. Big Data Analytics as a Tool for Reducing Ergonomics Risk. J. Ergon. 2017, 7, 1000. [Google Scholar] [CrossRef]
- Green-McKenzie, J.; Kiselica, D.; Watkins, M. Managing Workers’ Compensation Costs: Success of Initiatives to Change Outcomes. Clin. Occup. Environ. Med. 2004. [Google Scholar] [CrossRef]
- Ju Kim, I. Accidents and Accident Prevention in the Agricultural Industry: Ergonomic Engagement. J. Ergon. 2016. [Google Scholar] [CrossRef]
- Karwowski, W. Ergonomics and Human Factors: The Paradigms for Science, Engineering, Design, Technology and Management of Human-Compatible Systems. Ergonomics 2005, 48, 436–463. [Google Scholar] [CrossRef]
- Hoła, B.; Szóstak, M. Modeling of the Accidentality Phenomenon in the Construction Industry. Appl. Sci. 2019, 9, 1878. [Google Scholar] [CrossRef]
- Chi, S.; Han, S. Analyses of Systems Theory for Construction Accident Prevention with Specific Reference to OSHA Accident Reports. Int. J. Proj. Manag. 2013, 31, 1027–1041. [Google Scholar] [CrossRef]
- Khan, M.; Halim, Z.I.; Iqbal, M. Attributes of Occupational Injury among Workers in the Chemical Industry and Safety Issues. Int. J. Occup. Saf. Ergon. 2006, 12, 327–341. [Google Scholar] [CrossRef] [PubMed]
- Sameen, M.; Pradhan, B. Severity Prediction of Traffic Accidents with Recurrent Neural Networks. Appl. Sci. 2017, 7, 476. [Google Scholar] [CrossRef]
- Prati, G.; De Angelis, M.; Puchades, V.M.; Fraboni, F.; Pietrantoni, L. Characteristics of Cyclist Crashes in Italy Using Latent Class Analysis and Association Rule Mining. PLoS ONE 2017. [Google Scholar] [CrossRef] [PubMed]
- Kaplan, S.; Prato, C.G. Cyclist-Motorist Crash Patterns in Denmark: A Latent Class Clustering Approach. Traffic Inj. Prev. 2013, 14, 725–733. [Google Scholar] [CrossRef] [PubMed]
- Fop, M.; Smart, K.M.; Murphy, T.B. Variable Selection for Latent Class Analysis with Application to Low Back Pain Diagnosis. Ann. Appl. Stat. 2017. [Google Scholar] [CrossRef]
- Eluru, N.; Bagheri, M.; Miranda-Moreno, L.F.; Fu, L. A Latent Class Modeling Approach for Identifying Vehicle Driver Injury Severity Factors at Highway-Railway Crossings. Accid. Anal. Prev. 2012. [Google Scholar] [CrossRef]
- Yasmin, S.; Eluru, N. Latent Segmentation Based Count Models: Analysis of Bicycle Safety in Montreal and Toronto. Accid. Anal. Prev. 2016, 95, 157–171. [Google Scholar] [CrossRef]
- Yasmin, S.; Eluru, N.; Bhat, C.R.; Tay, R. A Latent Segmentation Based Generalized Ordered Logit Model to Examine Factors Influencing Driver Injury Severity. Anal. Methods Accid. Res. 2014, 1, 23–38. [Google Scholar] [CrossRef]
- De Oña, J.; López, G.; Mujalli, R.; Calvo, F.J. Analysis of Traffic Accidents on Rural Highways Using Latent Class Clustering and Bayesian Networks. Accid. Anal. Prev. 2013, 51, 1–10. [Google Scholar] [CrossRef]
- Sasidharan, L.; Wu, K.F.; Menendez, M. Exploring the Application of Latent Class Cluster Analysis for Investigating Pedestrian Crash Injury Severities in Switzerland. Accid. Anal. Prev. 2015, 85, 219–228. [Google Scholar] [CrossRef]
- Kang, Y.; Khattak, A. Cluster-Based Approach to Analyzing Crash Injury Severity at Highway–Rail Grade Crossings. Transp. Res. Rec. 2017. [Google Scholar] [CrossRef]
- Adanu, E.K.; Hainen, A.; Jones, S. Latent Class Analysis of Factors That Influence Weekday and Weekend Single-Vehicle Crash Severities. Accid. Anal. Prev. 2018, 113, 187–192. [Google Scholar] [CrossRef] [PubMed]
- Kumar, S.; Toshniwal, D. A Novel Framework to Analyze Road Accident Time Series Data. J. Big Data 2016. [Google Scholar] [CrossRef]
- Virtanen, M.; Vahtera, J.; Head, J.; Dray-Spira, R.; Okuloff, A.; Tabak, A.G.; Goldberg, M.; Ervasti, J.; Jokela, M.; Singh-Manoux, A.; et al. Work Disability among Employees with Diabetes: Latent Class Analysis of Risk Factors in Three Prospective Cohort Studies. PLoS ONE 2015. [Google Scholar] [CrossRef] [PubMed]
- Robert, K.; Elisabeth, Q.; Josef, B. Analysis of Occupational Accidents with Agricultural Machinery in the Period 2008–2010 in Austria. Saf. Sci. 2015. [Google Scholar] [CrossRef]
- Field, W.E.; Heber, D.J.; Riedel, S.M.; Wettschurack, S.W.; Roberts, M.J.; Grafft, L.M.J. Worker Hazards Associated with the Use of Grain Vacuum Systems. J. Agric. Saf. Health 2014. [Google Scholar] [CrossRef]
- Chang, D.S.; Tsai, Y.C. Investigating the Long-Term Change of Injury Pattern on Severity, Accident Types and Sources of Injury in Taiwan’s Manufacturing Sector between 1996 and 2012. Saf. Sci. 2014, 68, 231–242. [Google Scholar] [CrossRef]
- Occhionero, V.; Ghersi, R.; Prandini, L.; Korpinen, L.; Gobba, F. The Biomechanical Overload of the Upper Limb: A Neglected Occupational Hazard in Animal Facility Operators. Ergonomics 2017, 60, 366–374. [Google Scholar] [CrossRef]
- Sarkar, S.; Verma, A.; Maiti, J. Prediction of Occupational Incidents Using Proactive and Reactive Data: A Data Mining Approach. In Industrial Safety Management; Springer: Berlin/Heidelberg, Germany, 2017. [Google Scholar]
- Larsen, F.B.; Pedersen, M.H.; Friis, K.; Gluèmer, C.; Lasgaard, M. A Latent Class Analysis of Multimorbidity and the Relationship to Socio-Demographic Factors and Health-Related Quality of Life. A National Population-Based Study of 162,283 Danish Adults. PLoS ONE 2017. [Google Scholar] [CrossRef]
- Zhang, N.L. Hierarchical Latent Class Models for Cluster Analysis. J. Mach. Learn. Res. 2004, 5, 697–723. [Google Scholar]
- Schreiber, J.B. Latent Class Analysis: An Example for Reporting Results. Res. Soc. Adm. Pharm. 2017, 13, 1196–1201. [Google Scholar] [CrossRef] [PubMed]
- Shlomi Polachek, I.; Fung, K.; Putnam, K.; Meltzer-Brody, S.; Vigod, S.N. A Latent Class Analysis of Brief Postpartum Psychiatric Hospital Admissions. Psychiatry Res. 2018, 262, 452–458. [Google Scholar] [CrossRef] [PubMed]
- Sugama, A.; Ohnishi, A. Occupational Accidents Due to Stepladders in Japan: Analysis of Industry and Injured Characteristics. Procedia Manuf. 2015, 3, 6632–6638. [Google Scholar] [CrossRef]
- Hastie, T.; Tibshirani, R.; Friedman, J. The Elements of Statistics, 2nd ed.; Springer: Berlin/Heidelberg, Germany, 2009. [Google Scholar]
- The Latent Class Analysis Report. Available online: https://www.jmp.com/support/help/14-2/the-latent-class-analysis-report.shtml#310948 (accessed on 27 August 2019).
- Vermunt, J.K.; Magidson, J. Latent Class Cluster Analysis. In Applied Latent Class Analysis; Cambridge University Press: Cambridge, UK, 2009. [Google Scholar]
- Latent Class Model Fit. Available online: https://www.jmp.com/support/help/14-2/latent-class-model-fit.shtml#383604 (accessed on 25 August 2019).
© 2019 by the authors. Licensee MDPI, Basel, Switzerland. This article is an open access article distributed under the terms and conditions of the Creative Commons Attribution (CC BY) license (http://creativecommons.org/licenses/by/4.0/).