Abstract
With the advancement of active distribution network construction, to solve the shortcomings of the existing distribution network technology in distribution network perception and control, the relevant technologies of the Wide Area Measurement System (WAMS) in the transmission network have attracted more attention in terms of their usage in the distribution network. Micro Multifunction Phasor Measurement Unit (μMPMU), as an example, is being gradually utilized in the distribution network. However, the existing synchronous phasor transmission protocol is mainly designed for the transmission network, which requires an extension to meet the communication requirements to be directly used in the distribution network. In this work, the requirements of active distribution network communication are analyzed, and trade-offs between National Standard of the People’s Republic of China/Recommended (GB/T) 26865.2-2011 and International Electro technical Commission (IEC) 60870-5-101/104 protocol are compared. An extension method of the communication protocol is proposed, with the benefits of the prioritized transmission of important data, expanded remote control function of μMPMU, increased types of offline files, and reduced amount of network communication and data storage. The method is built upon the existing GB/T 26865.2-2011 protocol, and refers to the Application Service Data Unit (ASDU) of IEC 60870-5-101/104 to add an application extension frame. Application extension frames are used to transmit telemetry data, telesignalization, partial commands, and partial offline files. Finally, an experimental environment is set up, which includes a phasor measurement unit (PMU) Emulator, distribution network phasor data concentrator (PDC), and main station emulator to implement the standard GB/T 26865.2-2011 protocol and extension protocol. The feasibility and effectiveness of the method are confirmed by the superior performance of the extended protocol compared with the standard protocol.
1. Introduction
With the increasing penetration rate of distributed energy resources (DERs) in the power grid and the increase of controllable load (CL), microgrids, which typically have a form of a small-scale power distribution system that integrates DERs, energy storage devices, loads, converters, communication devices, control and automation systems [1], have become a research hotspot as a link between the distribution network and DER [2,3,4]. Some microgrids further include combined cooling heating and power (CCHP). Grid-connected control, island detection, and island stable operation analysis are three key aspects of a microgrid access distribution network. A previous study [5] briefly introduced the American Consortium for Electric Reliability Technology Solution (CERTS) American Electric Power (AEP) microgrid, General Electric Company (GE) microgrid, Japan’s Aichi, Kyoto, and Sendai microgrids, Taiwan’s Hsinchu microgrid, Spain’s Labein microgrid, the Dutch holiday park microgrid, and the microgrid project of the German MVV (Munich Transport and Tariff Association). DER with a capacity less than 300 KW can be connected to the low voltage 380 V power grid, while DER with a capacity higher than 300 KW must be connected to the medium voltage distribution network. The traditional distribution network can only passively limit the access point and capacity of DERs, at a cost of degraded system stability and deteriorated power quality [1,6]. Since it is difficult to solve the above problems using the technical methods of monitoring, control, and scheduling of the traditional distribution network, the concept of the active distribution network (ADN) has emerged [7].
The active distribution network, as part of the smart grid, should have functions such as controlling distributed energy, voltage management, controllable load management, demand side management, and protection and fault location of the distribution network [8,9]. However, the distribution network Supervisory Control And Data Acquisition (SCADA) has limitations, such as a low sampling density, unsynchronized data, and no measurement of phase angle. It cannot complete tasks that require a high data time accuracy, low time delay, or the analysis of phase angle data in the active distribution network, such as DER protection and control, feeder automation, and fault location, etc. WAMS based on synchronous phasor measurement technology is widely used in current transmission networks [10,11]. WAMS commonly includes phasor measurement unit (PMU), phasor data concentrator (PDC), analysis and application center (AAC), and high-speed communication networks and other components. The PMU is able to perform high-precision acquisition of the real-time operational signals of the power grid (in microseconds) based on the GPS synchronous clock. Synchronized phasors are calculated, which are based on Coordinated Universal Time (CUT) or World Standard Time (UTC). Thus, power signals from different locations can also be compared and analyzed at the same time coordinate system. The output frequency of the PMU is generally between 25–100 HZ (50 Hz grid) or 30–120 Hz (60 Hz grid); in other words, the voltage and current phasors are transmitted every other fundamental wave, every fundamental wave, or half of a fundamental wave. The PMU data is either directly sent to the main station, or collected by the PDC then forwarded to the main station via the communication network. By analyzing the synchronized phasor data measured by the PMU, the main station is able to perform state estimation of the grid, wide-area monitoring protection and control, as well as stability analysis. The PMU in the transmission network WAMS has the advantages of a high sampling rate, high time precision, high-frequency output synchronous phasor data, etc., which can compensate for the shortcomings of the traditional distribution network SCADA in respective aspects. For example, by placing a PMU device at the grid connection of the microgrid and monitoring both sides of the grid connection point, the problems of grid connection control and island detection can be solved more easily. Additionally, with the development of WAMS technology, the PMU is able to achieve a higher reliability, compact size, and lower cost. It is, thus, promising for PMU to be widely adopted in the distribution network in the future. Therefore, an increased number of scholars have begun to study the application of PMU to the distribution network.
Previous studies [12,13,14] have discussed the tasks that the PMU in the distribution network can accomplish, including stability analysis and monitoring of the distribution network, protection under the condition of DER introducing bidirectional power flow and phase angle deviation, distribution network status estimation, voltage control, fault location and detection, load rapid prediction, load modeling, harmonic estimation, parameter estimation, closed-loop operation of feeders, etc. Other studies [15,16] have analyzed the application of PMU in the industrial distribution network, including PMU optimal layout, PDC data collection, and PMU status monitoring of industrial parks. In addition to discussing the tasks of the PMU in the distribution network, for the main network and the distribution network PMU, they all have problems, such as massive data transmission, communication delay control, and network security in the communication process. A previous study [17] proposed a WAMS communication resource allocation method based on optimal dynamic time division multiple access (TDMA) resource allocation. Another study [18] proposed a real-time data compression and adapted protocol technology for WAMS, where the compression algorithm exception swing door compression (ESDC) is generated by the combination of exception compression (EC) and the swing door trending (SDT) algorithm. Adaptive protocol technology refers to the transmission of compressed data by improving the format of data frames defined by Institute of Electrical and Electronics Engineers (IEEE) C37.118.2. Another study [19] proposed a method for combating traffic analysis attacks in WAMS. In this study, based on the priority of PDC receiving data packets, the data packets are processed and transmitted to ensure the timely transmission of data.
Among the above references, one study [18] improved the data frame structure to compress transmission, reducing traffic, but did not add new frame types to transmit more kinds of information, which caused additional delay. The priority of the packets discussed in another study [19] were based on the remaining time of the packet, without considering the different data inside the packet, and the need for latency may also be different. In order to meet the application requirements of the active distribution network and solve the problems that the existing transmission grid synchronous phasor transmission protocol will encounter in the distribution network, such as an insufficient frame type and different data delay requirements, this paper proposes a priority-based protocol extension method. This method increases the type of frame, determines the priority of the data, and increases the file type, thereby distinguishing the data required for various applications with different delay requirements. The method can also reduce network traffic and storage, and ensure that phasor data is transmitted preferentially.
The organization of this work is as follows. Section 2 compares the distribution network SCADA and the transmission network WAMS, and explains the applicable scenarios, functions, and performance requirements of the micro multifunction phasor measurement unit (μMPMU). Section 3 compares National Standard of the People’s Republic of China/Recommended (GB/T) 26865.2-2011 and International Electro technical Commission (IEC) 60870-5-101/104 statutes, summarizing their content to meet the needs of active distribution network communication. Section 4 proposes a protocol extension method based on data prioritization. Section 5 implements and verifies the proposed method, and Section 6 summarizes the article.
2. Active Distribution Network Communication Demand Analysis
2.1. Active Distribution Network Business Traffic Demand
The communication system of the active distribution network is an important part of it. Firstly, the bandwidth required for each service of the active distribution network is discussed from the perspective of the communication system. According to a previous study [20], the communication services of the active distribution network can be classified as the following categories: vertical network protection (VNP), advanced distribution automation (ADA), DER access control (AC), load management (LM), and other services (e.g., video surveillance). Considering that the State Grid Corporation standardizes the importance of the power consumption area into six categories of A+~E, the terminal equipment configuration levels are different in different areas, and the bandwidth requirements are different. Combined with the traffic analysis methods of different business sections proposed in another study [21], the 110 kV substation and 35 kV substation are set to cover various numbers of nodes, and the bandwidth required for different substations to meet the corresponding node services is calculated. The results are shown in Table 1.

Table 1.
Business traffic analysis.
It can be seen from Table 1 that in the case of DER large-scale access to the grid, distribution systems require lower communication delays and a higher bandwidth. The communication network of the active distribution network should be able to meet the delay and bandwidth requirements of various services. In the process of building a communication network, it is not only possible to consider this from the perspective of the replacement of communication equipment, but also on the basis of the existing communication network, from communication scheduling, data priority transmission, data compression transmission, and mixing multiple communication methods. Based on this, ways to meet the needs of an active distribution network communication can be found.
2.2. Problems with SCADA and Its Protocols
The SCADA system has a wide range of applications, including data acquisition, monitoring control, as well as and process control in the fields of power, metallurgy, petroleum, chemical, gas, and railway. Most SCADA systems are based on fieldbus control technology. In this paper, SCADA refers to power SCADA, with TCP/IP used more often for communication. Its application is primarily on power system dispatch automation and distribution network automation systems.
For the traditional power grid, with the shortage of power supply, when the power system is operating at the edge of stability, it is difficult for existing SCADA and related systems to support the safe and stable operation of the power system. When a large number of DERs are connected to the distribution network, SCADA cannot effectively solve the DER access control problem. This is mainly because the SCADA has a low sampling density, remote terminal unit (RTU) data upload rate is low, often in the range of 0.5–2 frames/s [22], and the clocks of the stations are not uniform, resulting in inconsistent data time sections, an inaccurate system operation status [23], failures of the traditional radiation current protection scheme of the distribution network [24], a limited state estimation accuracy [25], and other issues. From the perspective of the protocol, since the IEC 60870-5-101/104 protocol does not include synchronization time and phasor data, the data time accuracy is not high, and the voltage phasor accuracy obtained by iteratively solving other measurement information is difficult to guarantee.
2.3. The μMPMU Application
Table 2 compares the existing distribution network SCADA with the transmission network WAMS.
Table 2.
System function comparison.
From the comparison of SCADA and WAMS, considering the application requirements of the active distribution network and the actual operation of the distribution network, the following conclusions can be drawn:
- (1)
- The multi-function of the μMPMU refers to the function of the phasor measurement function of the PMU of the transmission network and functions of some types of distribution network terminals. Here, the distribution network terminal mainly refers to the Feeder Terminal Unit (FTU), Distribution Terminal Unit (DTU), Distribution Transformer Supervisory Terminal Unit (TTU), etc. Its main application scenarios are distribution automation, distributed power access, electric vehicle charging stations (piles), etc. The monitoring targets are substations, power distribution rooms, transformers, feeders, electric vehicle charging stations (piles), etc. Therefore, there is no need to be equipped with a key phase measurement module, and the functions are reduced and increased, such as reducing the monitoring and control of low-frequency oscillations, increasing the fault location of the power distribution terminal, small current grounding, and control and protection functions for the feeder;
- (2)
- The μMPMU should be smaller than the main network PMU, and the size should be selected based on the installation location. For example, the μMPMU mounted on the pole (which refers to the FTU mounting position) should be smaller than the μMPMU installed in the sub-section post (which refers to the DTU mounting position). The choice of communication medium is more diversified, and communication media may include the optical fiber, wireless private network, power line carrier, etc., and the communication delay under various combinations should be less than 150 ms;
- (3)
- The μMPMU acquisition quantity should include a three-phase voltage, three-phase current, zero-sequence current, analog quantity, switching quantity, etc., and has the basic three-remote function of the distribution network terminal. The phasor data transmission rate is 25, 50, and 100, frames/s optional;
- (4)
- WAMS has always had the problem of a high communication delay and massive data processing. For the application of μMPMU to the distribution network, with a greater number of μMPMU, more data will be generated. It is, thus, necessary to solve the problem of high communication delay and massive data processing.
In conclusion, in addition to improving the processing capabilities of hardware devices, the communication protocol should also be re-optimized [26]. Figure 1 shows the distribution network WAMS organizational structure, which can share the communication network with the existing distribution terminal. Substations communicate with the power distribution main station via the backbone communication network, and the backbone network is based on Synchronous Digital Hierarchy/Multi-Service Transfer Platform (SDH/MSTP). The communications between the distribution line uMPMUs and substation PDCs are located at the access layer. There are a variety of communication methods, including Ethernet and passive optical networks based on fiber-optic communication, and wireless private networks based on 4G LTE 230MHz. Individual isolated points can also consider the use of Orthogonal Frequency Division Multiplexing (OFDM)-based broadband power line carrier communication.
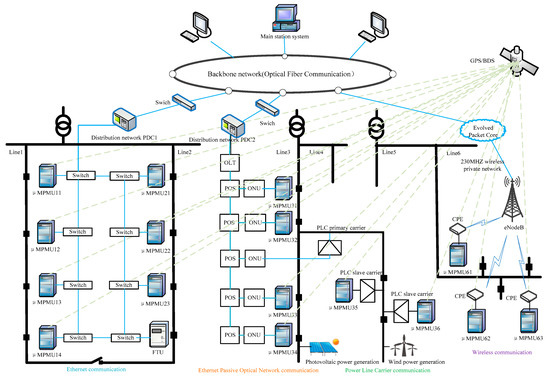
Figure 1.
Distribution network WAMS organizational structure.
Based on the description and method given in a previous study [27], conventional state estimation generally uses SCADA data for parameter identification of lines and transformers. However, the SCADA data failed to provide a uniform timestamp across the entire network. Thus, it is impossible to obtain a strictly time-synchronized data section. In addition, the parameter identification based on the SCADA data needs to use the global measurement value to determine the global parameters, while there is a defect of residual pollution. All those limitations can be resolved by deploying μMPMUs into the distribution network. The measurement of the μMPMU is based on the global synchronous clock, which is able to achieve a high time precision and data accuracy that’s required by online parameter identification of the power distribution system. Also, it can solve the problem of high-precision dynamic measurement that is difficult to achieve by the traditional power distribution terminal (FTU, DTU, fault indicator, etc.) in the distribution network. The following is an example of the transformation ratio and parameter calculation of the three-winding transformer to illustrate the benefits of introducing the μMPMU for parameter calculation.
Power transmission is performed by the high-voltage side and the medium-voltage side of the three-winding transformer, and reactive power compensation is done by the low-voltage side. Its equivalent circuit and phasor relationship are shown in Figure 2. Z1, Z2, and Z3 represent the impedances of the high-voltage, medium-voltage, and low-voltage side windings, respectively, Zm is the excitation impedance, represents the angle between and , represents the angle between and . Approximately, the angle between the excitation current and the low-voltage side winding current and is 90°, so that the calculation formula of the three-winding transformation ratio can be obtained:
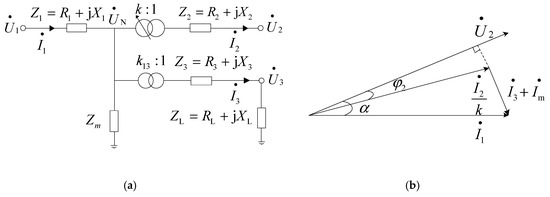
Figure 2.
(a) Equivalent circuit for three-winding transformer with tap changer; (b) phasor relationship of three-winding transformer.
According to the calculated actual ratio, the medium voltage side electrical quantity and parameters are reduced to the high voltage side, then
Ignoring the influence of the branch resistance, let the angles of and between be and , respectively, and solve the above equation.
By using the phasors of voltage and current with synchronous time stamping of μMPMU to solve the above formula, parameters such as transformer ratio and winding reactance can be computed.
3. Protocols Analysis
It can be seen from the contents of Table 2 that SCADA and WAMS adopt different protocols. The following sections analyze protocols and find their parts that meet the application needs, thus providing a basis for the expansion of the statute.
3.1. Protocols Introduction
IEC 60870-5-101/104 [28,29]: The International Electrotechnical Commission has developed IEC 60870-5-101 based on Enhanced performance architecture (EPA) from the IEC 60870-5 series communication standard, and network communication version 104 is proposed on the basis of 101.
GB/T26865.2-2011 [30]: 2011 version of real-time dynamic monitoring systems of power system-Part 2: Protocols for data transferring. This specifies the data transmission protocol of the real-time dynamic monitoring system of the power system, including real-time data transmission and offline data transmission. Suitable for real-time data transmission and historical file transfer between the main station and sub-station. A previous study [31] introduced the development of the version of the Synchronous Phasor Transmission Protocol, and another compared GB/T 26865.2-2011 with IEEE C37.118.2-2011 [32]. Their definitions in real-time data transmission are basically the same. The analysis and extension of GB/T 26865.2-2011 can be easily used by IEEE C37.118.2-2011.
3.2. Protocols Comparison
Table 3 compares the two standards from the main application scenarios, functions, communication methods, communication modes, frame types, timing modes, and frame rates.
Table 3.
Comparison of protocols.
From the comparison in Table 3, it can be found that the functions described in IEC 60870-5-101/104 are more abundant than GB/T 26865.2-2011, and are more suitable for practical applications in the distribution network. The communication modes of IEC 60870-5-101/104 are Polling and Cycle Distance Transmission (CDT), but in practice polling communication mode is used more often, and adopts the method of actively sending changed data. The advantages of this are that the reliability of each round of transmission service is ensured and the amount of information transmitted is reduced, but the system response time increases. According to the description of GB/T 26865.2-2011, the primary station controls the sub-station by issuing a command frame. The sub-station performs transmission configuration according to the CFG-2 delivered by the primary station, so that the data upload function can be automatically completed, but the remote control is not provided. In communication mode, the command pipeline and file pipeline adopt polling, and the data pipeline adopts CDT.
In the communication method, IEC 60870-5-101 uses serial communication, and IEC 60870-5-104 and GB/T 26865.2-2011 use network communication based on transmission control protocol/internet protocol (TCP/IP). For the international protocol IEEE C37.118.2-2011 similar to GB/T 26865.2-2011, it can adopt the same serial communication method as IEC 60870-5-101, and can also choose IP-based network communication, including TCP, user datagram protocol (UDP), and a combination of TCP and UDP. Therefore, in the choice of the communication method of the extended protocol, it is not necessarily limited to the use of TCP, and the communication method based on TCP/UDP can be flexibly combined, so that the advantages of TCP and UDP can be fully utilized.
It can be seen from the frame rate and the timing mode that GB/T 26865.2-2011 has higher requirements in terms of the time precision and communication rate. The advantage of this is that the data has a high real-time performance and precision, and the disadvantage is the waste of communication resources. Combining the frame type for analysis, taking the data frame as an example, the frame structure is fixed, and the data type of each data frame is the same, including phasor data, analog quantity, and digital quantity. From the perspective of data change frequency, many analog quantities are based on DC sampling, and the sampling rate is low and the change is slow. Generally, they change once in one second or several seconds, and digital quantities change more slowly. If such analog and digital quantities are transmitted at a high speed, like the transmission speed of phasor data, there will be a large amount of data duplication and redundancy, wasting communication bandwidth resources. From the perspective of application, whether all the information is needed in different application scenarios needs to be considered. For example, the master station needs all data to improve the accuracy of SCADA data [22,33]. However, for the hierarchical-distributed protection and control of the active distribution network, control units of each area or layer only need to acquire the synchronized phasor data to start the corresponding protection, and do not need to obtain all the information [8,34]. Excessive data can also cause problems, such as communication blocking and an increased data processing time.
In terms of offline files, GB/T 26865.2-2011 only contains dynamic data files and transient recording files. In actual applications, continuous recording files will be added. IEC 60870-5-101/104 contains a wide variety of documents to meet the data recording needs of various distribution terminals.
Based on the above analysis, GB/T 26865.2-2011 lacks definitions of remote control, files, data types, etc., required for power distribution terminals. Part of the data has a high redundancy, and frame types are fixed. The frame type, communication flow, and file type should be increased, so that the μMPMU can perform data classification and transmission, add more power distribution terminal functions, increase file storage types, and reduce communication traffic and storage usage.
4. Priority-Based Protocol Extension Method
This section will detail the protocol expansion method. The goals of this method are to ensure the prioritized transmission of important data, expand the μMPMU remote control function, increase the types of offline files, and reduce the amount of network communication and data storage.
4.1. Frame Type Extension
The data frame structure and the command frame structure of GB/T 26865.2-2011 are shown in Figure 3. The data frame sent by the PMU contains only one data section DATA, which stores its own measured data, and the data frame sent by the PDC contains the number of DATA segments equal to the number of PMUs connected to it. The DATA segment contains bit-mapped flags STAT, phasor estimates PHASORS, frequency offset FREQ, frequency change rate DFREQ, ANALOG, and DIGITAL. It does not state whether there is a change in digital quantities or whether the analog quantity requires time synchronization. All data are sent together. The command frame is sent by the main station, PDC, and PMU. It only contains one DATA segment and stores the command word CMD. CMD is 2 bytes in length, where Bits 12~4 are reserved. It refers to DLT 1402-2015 “Technical specification for application of synchronous phasor in power plant and substation” to supplement the reserved 9 bits; define Bits 05~04 as 01 points and 10 points; define Bits 07~06 as 01 selection, 10 Execute, and 11 cancel; and define the last remaining Bits 12~08 as the information object address. The 5-bit binary number represents up to 31 digital quantities. For a single μMPMU, 31 digital quantities are sufficient, but one distribution network PDC can connect up to more than 20 μMPMUs. In remote control, the PDC should match each remote control number of each μMPMU to the corresponding unique remote control number of the main station, and 31 is far from meeting the mapping requirements, so this extension is not applicable on the μMPMU.
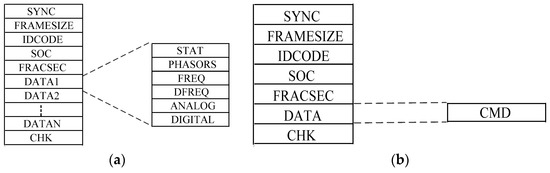
Figure 3.
(a) GB/T-26865.2-2011 data frame structure; (b) GB/T-26865.2-2011 command frame structure.
The newly added frame type is named the application extension frame, and the frame structure is shown in Figure 4. The application extension frame is transmitted through the command pipeline; the frame synchronization word SYNC value is 0xAA53; and the DATA segment content includes the type identifier TYPE, the variable structure qualifier VSQ, transmission reason RTNR, the public address (PMU address), and the information object address INF. TYPE defines the structure, type, and format of INF. VSQ defines the number of information objects contained in the INF, as well as the addressing method. INF contains the information object address, the information element, and the CP56Time2a time stamp. After the application extension frame is used, the μMPMU can choose to transmit different types of data through the data frame or application extension frame, and also solve the mapping problem between the μMPMU remote control number and the remote control number of the main station, and the remote control function can be added to the μMPMU.
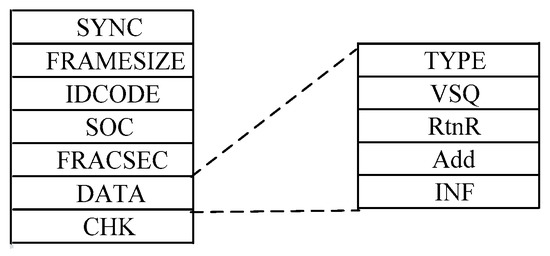
Figure 4.
Application extension frame structure.
4.2. Types of Files
IEC 60870-5-101/104 is combined with the types of files included in GB/T 26865.2-2011, see Table 4. Then, the file type is selected according to the actual application scenario.
Table 4.
Types of files.
4.3. Data Priority Delineation
After the frame type is extended, different data can be transmitted through different kinds of frames and pipes, and the priority of the data is determined according to the timeliness of the data. The priority of different data is shown in Table 5. The output delay in the table represents the time difference between the data time stamp and the data output time.
Table 5.
Data priority.
The priority 1 (P1) data includes PHASORS, FREQ, DFREQ, and analog quantities requiring time synchronization. Based on the national grid enterprise standard Q/GDW 11202.6-2014 ‘‘The test specifications for automation equipment in smart substation Part 6: Phasor measurement unit”, the output delay should be within 50 ms. The priority 2 (P2) data includes the remote control command. As can be seen from Table 1, the one-way communication delay of vertical network protection as the protection application is less than 100 ms, and the one-way communication delay of advanced distribution automation as the control application is less than 500 ms. The communication medium for protection and control applications should use Ethernet Passive Optical Network (EPON) (delay value 1.5 ms) or an industrial Ethernet (delay value 10 ms) with a low network delay, and the output delay should be within 90 ms. However, if there is only a control application and the communication mode is a wireless private network (delay value 30~300 ms), the output delay should be within 200 ms, and the table is set to 90 ms. The priority 3 (P3) data includes telemetry and telesignalization summoned by the main station, changed data, and Sequence Of Event (SOE). Generally, when the voltage changes by 1%, the current changes by 1% or 5%, it will be actively sent, and the output delay is within 200 ms. The priority 4 (P4) data includes periodic upload digital quantities and analog quantities that do not require time synchronization, the frame rate is 0.1~1 frames/s, and the output delay is within 400 ms. The priority 5 (P5) data includes various historical data files, configuration files, and header files, and the output delay is within 800 ms. Application extension frame-2, frame-3, frame-4, and frame-5 simply indicates that the application extension frame carries different data, and their frame structure is not different. In fact, the data priority and output delay should also be set according to the actual application. The level of data priority can be increased or decreased, and the output delay can also be adjusted. Table data are used as reference values. In order to guarantee the data output delay is within the specified milliseconds, this paper uses the timer and the priority queue method to ensure the data will be sent out before the set time expires, so that the data output does not time out.
4.4. Communication Flow Extension
After the application extension frame is added, the startup process of the communication between the sub-station and the primary station needs to increase the total summoning session. All telesignalization and telemetry data of the sub-station are uploaded by the total summoning, and the real-time data transmission is started after the total summoning is completed, and the startup process ends. The communication startup process is shown in Figure 5. It should be noted that the main station and PDC/μMPMU, PDC, and μMPMU can all form the relationship between the main station and sub-station.
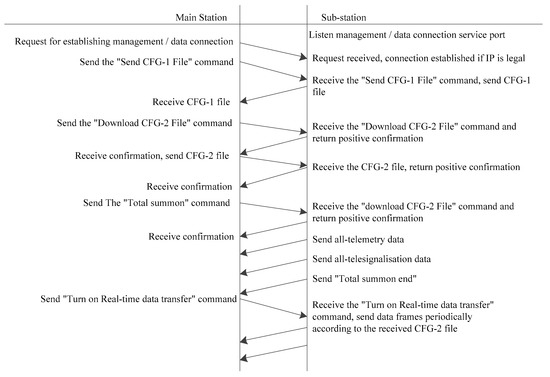
Figure 5.
Communication startup process.
After the startup process is over, if the main station needs to remotely control the sub-station, it needs to follow a certain sequence of steps. The remote control process includes remote control selection, remote control confirmation, and remote control execution. The main process is shown in Figure 6.
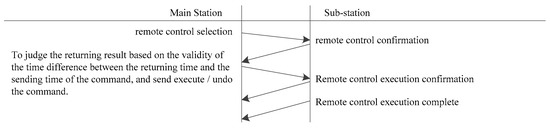
Figure 6.
Remote control process.
In addition to the aforementioned total summoning and remote control process, after the startup process, sub-station transmission-changed data includes digital quantities and analog quantities that do not require time synchronization. At the same time, the communication mechanisms, such as packet summons and periodic transmission, can be added. The main station can communicate directly with μMPMU, and the main station also communicates with μMPMU through PDC. The above communication process is actually an interaction process of the three. When the method is implemented, attention needs to be paid to the mapping of each device. The PDC as the intermediate between the main station and μMPMU should save the upper and lower point tables. After receiving the remote data of μMPMU, the data point number is mapped to the point number saved by the main station, and the remote data is then uploaded. After receiving the remote command of the main station, the remote control point number is mapped to the μMPMU point number, and the remote control command is then sent.
4.5. Data Flow Calculation Method
Without the method of this paper, the data frame length calculation equation is as follows:
In Equation (4), Ldata is the total length of the data frame, and F1 is the base length of the data frame and its value is the total bytes of the SYNC, FRAMESIZE, IDCODE, SOC, FRACSEC, and CHK fields in the data frame. P is the length of real-time data, whose value is the total bytes of STAT, PHASORS, FREQ, and DFREQ fields in the data frame. A is the length of analog quantity and its value is the length of the ANALOG field in the data frame, and D is the length of digital quantity, whose value is the length of the DIGITAL field in the data frame.
In order to ensure the uniform transmission of data, the method of sending each data frame separately to avoid frames is adopted. Considering that the maximum segment length LMSS of TCP without options is 1460 bytes, when Ldata exceeds LMSS, the data frame requires multi-TCP frame transmission. The calculation equations of the amount of data transmitted per unit time are as follows:
In Equations (5) and (6), n and Lx are the quotient and remainder of Ldata, respectively, divided by LMSS; Mdata is the total amount of real-time data transmitted per unit time; Lnet is the network transmission base length, and its value is the length sum of the Ethernet frame preamble, Start of Frame Delimiter (SFD), Ethernet header, 4-byte Cyclic Redundancy Check (CRC), IP header (IPv4, without TCP option), and TCP header length; and Rdata is the data frame transmission rate, indicating the number of frames sent per unit time.
After adopting the method of this paper, if all the analog quantities and digital quantities are separated into the application extension frame transmission, the frame length calculation equation is separated into the following three equations:
In Equations (7)–(9), Lnew-D is the total length of the data frame after the method is used; LYC is the total length of the application extension frame for transmitting telemetry information; F2 is the base length of the extended frame of the application, and its value is the length sum of the F1, TYPE, VSQ, RtnR, and Add fields in the extended frame; AINF is the length of the INF field containing the full analog; DINF is the length of the INF field containing the full digital; and LYX is the total length of the application extension frame for transmitting telesignalization information.
The method in this paper also needs to ensure the uniform transmission of phasor data. The calculation equations of the average transmission amount of data per unit time are as follows:
The meanings of n1 and Lx1 in Equations (10)–(12) and the calculation are the same as for formula (5); Mnew is the total amount of real-time data transmitted per unit time after adopting the method; RYC is a fixed transmission rate for the application extension frame for transmitting telemetry information; and VYC is the frame rate average change value of the application extension frame for transmitting changed telemetry information. The value is affected by the ratio of the amount of changed analog quantities to the total analog quantities and the proportion of the change time to the full running time. RYX is a fixed transmission rate for the application extension frame for transmitting telesignalization information and VYC is the frame rate average change value of the application extension frame for transmitting changed telesignalization information. The value is affected by the ratio of the amount of changed digital quantities to the total digital quantities
It should be noted that the calculations of Mdata and Mnew do not take into account the traffic generated by the file transfer that the μMPMU and PDC may perform during the real-time data transmission process, as well as the traffic generated by the acknowledgment packets of TCP replies.
5. Experimental Verification
This section describes the μMPMU multi-priority data processing model, including how to generate and process all kinds of priority data. It then illustrates the test environment, which is made up of the PMU Emulator, real distribution network PDC, Main station Emulator, and some technical details of them. Finally, the feasibility and effectiveness of the extended method are verified by experimental data and computational data.
5.1. μMPMU Multi-Priority Data Processing Model
Figure 7 shows the μMPMU model with the multi-priority data processing model designed according to the proposed method. The real μMPMU internal modules and other communication networks and devices are abstracted, focusing only on the method implementation. The blue line is the data pipeline and is responsible for transmitting P1 data. The red line is the command pipeline, which is responsible for transmitting the downlink management and control commands, configuration files, and uplink P2, P3, P4, and partial P5 data. The orange line is the file pipeline, which is responsible for transmitting the downstream file command and the upstream part of the P5 data. Path ① indicates that the μMPMU and the PDC are directly connected through the network cable. Path ② indicates that the μMPMU is connected to the PDC through the switch. Path ③ indicates that the μMPMU communicates directly with the primary station over the communication network.
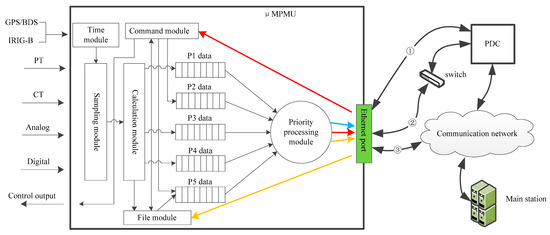
Figure 7.
The micro multifunction phasor measurement unit (μMPMU) multi-priority data processing model.
The μMPMU receives the GPS/BDS or InterRange Instrumentation Group Time Code Format B (IRIG-B) timing signal, and the Time module performs high-precision timing and punctual functions of the device. The Time module outputs high-precision sampling pulses to the Sampling module. The Potential Transformer (PT) and Current Transformer (CT) signals are filtered and passed to the Sampling module to form time-stamped sample data. After the calculation is done by the Calculation module, phasor data and recorded data are generated, and phasor data is transmitted as P1 data. The recorded data is divided into transient recording and continuous recording data, and is stored in the File module. When the main station/PDC summons the recording file through the file pipeline, it is transmitted as P5 data. The digital quantities and part of the analog quantities change slowly, so the sampling rate is also low. After calculation, they are uploaded as P4 data. When the sampling value exceeds the limit, there is SOE data, or if the main station actively calls, they are uploaded as P3 data. The command module processes the management and control commands and configuration files issued by the main station/PDC received through the command pipeline. The remote control response is transmitted as P2 data, and the configuration file and header file obtained from the File module are transmitted as P5 data. The command module is also responsible for the output of control signals. All data is sent to the priority processing module for processing. See Figure 8 for processing logic.
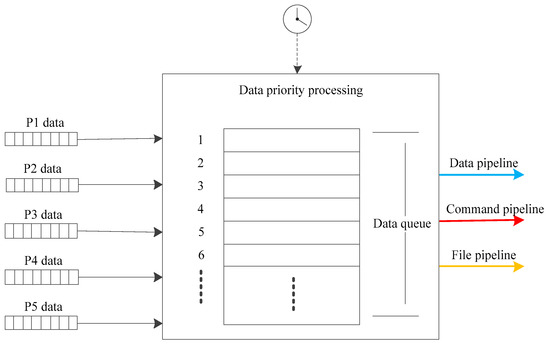
Figure 8.
Data priority processing.
The P1~P5 data has an output delay requirement, and the priority processing module distinguishes the level of the input data to determine the remaining time of each piece of data, and queries the remaining time of the data in the queue through a timer period. The data with the remaining time of 0 is sent. If there is no data with the remaining time of 0, the data with the smallest remaining time or the data with the remaining time less than the timer period is sent. If there are other data waiting to be sent, the remaining time of each data is reduced by one timer cycle time. The advantage of this method is that the high-priority data can be sent first when the multi-class data is generated at the same time and the low-priority data will also get the transmission opportunity after waiting for a certain amount of time, and each set of data will not miss its effective time.
5.2. Experimental Environment
The experimental environment consists of the PMU Emulator, the distribution network PDC, and the Main station Emulator. The above software and hardware have been developed by the authors of this paper. This type of PDC has been piloted and operated in 220 KV and 35 KV substations in Pudong New Area, Shanghai, China.
- PMU Emulator: PMU Emulator is developed on Visual C++ and supports the standard GB/T 26865.2-2011 protocol and the extension method, using Socket multi-channel and multi-thread programming. The software is based on the dialog framework, which can simulate PMUs within 30 units at the same time, and the number of phasors, the number of analog quantities, and the number of digital quantities of each PMU can be modified by the initial configuration file. It can support multiple communication rates, such as 200, 100, 50, 25, 10, 5, and 1 frames/s. Data transmission is based on multimedia timer scheduling, improving uniformity between data frames. Real-time data can vary according to time, or it may change randomly, and can also use dynamic data files from DIgSILENT simulation software output or on-the-spot. The data time of each PMU starts to be generated from the computer time, and the time stamps can be the same, or the time difference between them can be fixed (10~500 ms), to simulate the time difference between different PMU data passing through different channels to PDC. This is run on PC1 in Figure 9. PC1 configuration: Intel (R) Core (TM) i5-3230M processor, 2.6 GHz, 8 G memory.
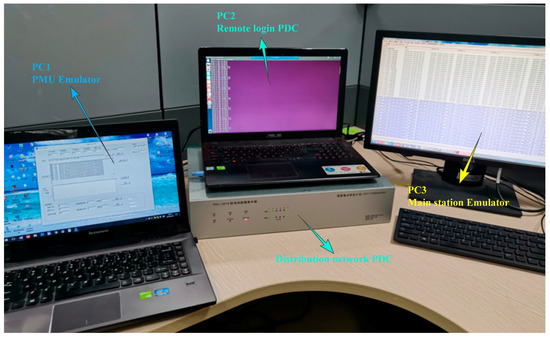 Figure 9. Experimental environment.
 - Distribution network PDC: PDC device hardware adopts platform hardware architecture design, a dual-core dual-thread CPU, Intel (R) Celeron (R) 2980 U, 2 M cache, clocked at 1.60 GHz; the hard disk adopts a Solid State Disk, with a capacity of 480 GB; the memory type is DDR3L, with a memory size of 4 GB; the time interface is RS-485, using IRIG-B timing; and it supports a dual power supply, which can be remotely logged in to through the network port or directly connected to the monitor. The system uses a Linux real-time multitasking operating system that is autonomously tailored. Software support standard GB/T 26865.2-2011 protocol and the extension method, using Socket multi-channel and multi-thread programming, through the select procedure, are employed to complete non-blocking mode communication. The data transfer rate is adjustable and the file is cyclically stored. It can connect no less than 20 μMPMUs, and is able to communicate with multiple primary stations, supporting high-latency PMU data aggregation and forwarding; that is, stable communication functions in a hybrid networking environment. The PC2 in Figure 9 is used to remotely log in to the PDC.
- Main station Emulator: Main station Emulator is also based on Visual C++ development, based on a single document view structure. It is multi-threaded and can be connected to multiple PMUs or PDCs. Each connection to a PMU or PDC will create a command pipeline, data pipeline, and file pipeline, occupying three sockets. If each socket creates a thread, three threads are created for each sub-station. At the same time, since the data channel transmission rate can reach more than 100 frames/s, for the PC, it is easy to have problems such as insufficient system memory resources. For this reason, a network communication non-blocking mechanism is adopted, and each PMU command, data, and file pipeline shares one thread. The CAsyncSocket class is used to determine which ports receive the data and then process them accordingly. The Main station Emulator uses tables to display received PDC messages, time, transmission rate, configuration information, binary values of data, the voltage and current values after the coefficient conversion, and so on. When testing PDC data aggregation and forwarding, the Main station Emulator can parse and display the PDC configuration information and the processed synchronized phasor data, which is helpful for analyzing the PDC function and performance test results. This is run on PC3 in Figure 9. PC3 configuration: Intel (R) Core (TM) i7-4790M processor, 3.6 GHz, 8 G memory.
The IP of PC1 is 192.168.3.206. The IP of PC3 is 192.168.8.196. The PDC connects to the PC1 through the network port with the IP address of 192.168.3.207, and connects to the PC3 through the network port with the IP address of 192.168.8.207. The command pipeline port number is 9001, and the data pipeline port number is 9000. Network data is crawled by running Wireshark software on PC3 to help analyze communication processes, data, and traffic. Wireshark (formerly known as Ethereal) is a network packet analysis software. It is developed to provide the most detailed measurements of network packets and data. Wireshark uses Windows packet capture (WinPCAP) as an interface to send and receive data packets directly on the network card.
5.3. Experimental Results and Analysis
Five PMUs are run on the PMU Emulator. Each PMU is configured with 8 phasors, 42 analog quantities, and 16 digital quantities. First, the standard GB/T 26865.2-2011 protocol is run. The PDC establishes a communication connection with each PMU in the PMU Emulator. The data frame rate is 100 frames/s, and the Main station Emulator is then connected to the PDC. The running result on the main station side is shown in Figure 10.
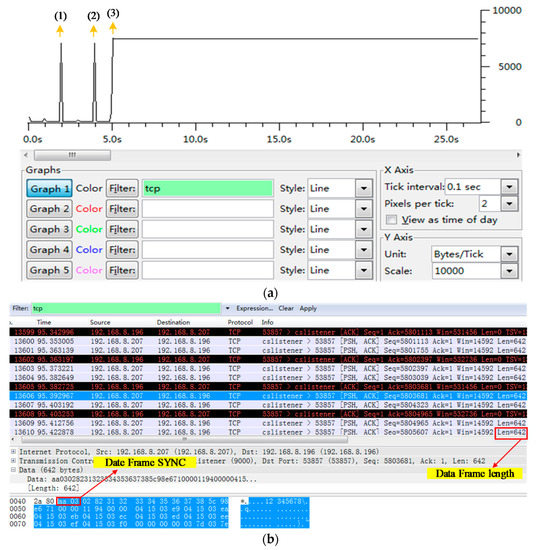
Figure 10.
Standard GB/T 26865.2-2011 protocol operation results. (a) Communication data traffic; (b) data frame.
In Figure 10a, the traffic statistics are shown, and the change in traffic can also reflect the communication process. Because all pipelines are based on TCP, the filter condition selects TCP. The data traffic from both the data pipeline and the management pipeline are counted. The horizontal axis is the X-axis, which indicates the time, with a scale unit of 0.1 s. The vertical axis is the Y-axis, with a unit of bytes/Tick, and a scale of 10,000. Peak (1) shows the traffic generated by the CFG1 of the PDC actively summoned by the main station. The PDC aggregates CFG1 of each PMU to generate its own CFG1. Peak (2) depicts that the main station delivers the traffic generated by CFG2. Peak (3) indicates the traffic generated by the PDC uploading the data frame after the PDC starts the real-time data transmission. Figure 10b illustrates more details of data frames. The first column “No.” indicates the serial number of the frame. The second column “Time” indicates the time of the frame’s issuance or arrival, the unit is in seconds, and the time when the packet capturing starts is set to 0. The third column “Source” indicates the source address. The fourth column “Destination” indicates the destination address. The fifth column “Protocol” indicates the selected transport layer protocol. The sixth column “Info” shows more information about the packet. User can view the details of the packet from below. It can be seen that the time interval of data frames is uniform, at 10 ms, and the length of each data frame is 642 bytes, which contains data of five PMUs. Data frame SYNC is 0xaa03. In both Figure 10a,b, filter conditions are tcp, statistics data frames, and TCP acknowledgement packets data traffic to more accurately reflect the traffic generated by running the protocol.
In the next run for the extended specification, the number of PMUs is unchanged, but each PMU retains all phasors and two analog quantities in data frames for transmission, and the remaining 40 analog quantities and all digital quantities are transmitted in application extension frames. These analog and digital quantities are configured in the device’s initialization point table and are not transmitted in CFG1 and CFG2. The transmission period of application extension frames, which contain analog and digital quantities, can be modified. Here, we choose 2 s and 5 s as the transmission cycle in turn. After starting the communication, the running result on the main station side is shown in Figure 11.
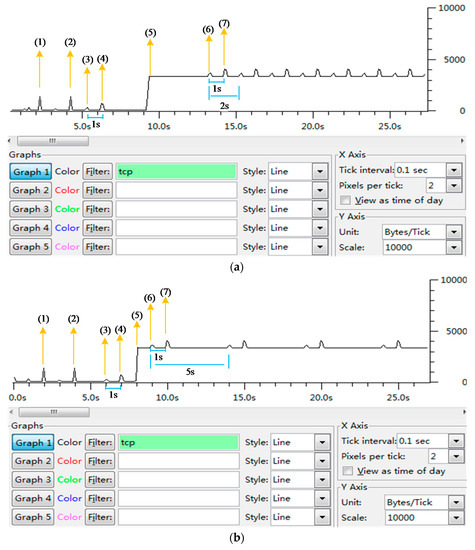
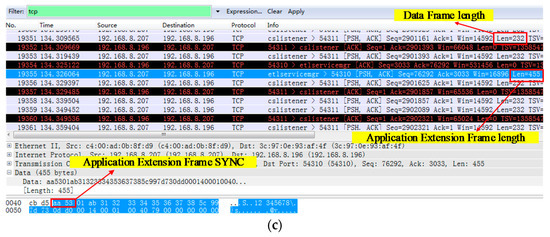
Figure 11.
Extended protocol running result. (a) Communication data traffic when application extension frames delivery period is 2 s; (b) communication data traffic when application extension frames delivery period is 5 s; (c) application extension frames and data frames in extended protocol.
Figure 11a,b shows data traffic statistics, and the parameters of the coordinate system are the same as those of Figure 10a. Peak (1) shows the traffic generated by the CFG1 of the PDC actively summoned by the main station. Peak (2) depicts that the main station delivers the traffic generated by CFG2. In response to the total summon, Peak (3) indicates the traffic generated by the PDC uploading application extension frames with digital quantities. Peak (4) illustrates the traffic generated by the PDC uploading application extension frames with analog quantities. The interval between the two types of data is 1 s. Peak (5) indicates the traffic generated by the PDC uploading the data frame after the PDC starts the real-time data transmission. After the real-time data transmission is enabled, a command is issued to start the periodic transmission of application extension frames. The meanings of Peaks (6) and (7) are the same as Peak (3) and (4). As can be seen from (c), the data frame length is significantly lower than the standard protocol data frame length. The length of a single application extension frame is long, but the transmission period is long and has little effect on traffic. Application extension frame SYNC is 0xaa53. As can be seen in conjunction with Figure 10 and Figure 11, data traffic has been significantly reduced after the implementation of the extended protocol.
In order to show more the effectiveness of this method in reducing data traffic, assuming one distribution network PDC communicates with 20 μMPMUs and one master station and sets 12 phasors (which compose of three-phase voltage, three-phase current, voltage, and current symmetrical components of phase a), 20 analog quantities (including active power P, reactive power Q, voltage, and current of 3, 5, 7 harmonics of each phase), and 4 digital quantities (such as external signal light, relay) to form one data unit. The setting of the data unit is same as the configuration of the μMPMU in the actual project. Two cases are explored here: Case 1 shows the calculation results according to the standard protocol; Case 2 corresponds to the calculation result using the method from this work. Rdata selects the maximum value of 100 frames/s, and both and select 0.2 frames/s, and the unit length is set to 1 min. Considering the diverse application scenarios of μMPMU and PDC, the number of data units is between 1 and 4. The Mdata of the two examples is calculated by using Equations (6) and (13). The result is shown in Figure 12. The abscissa is the data unit quantity, and the ordinate is the 1 min network communication data amount, and the unit is megabyte (MB).
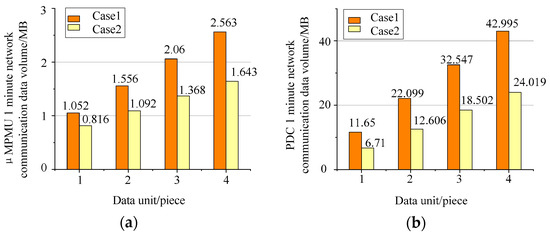
Figure 12.
(a) Single μMPMU 1 min network communication data amount; (b) single PDC 1 min network communication data amount.
It can be seen from the calculation results shown in Figure 12 that the numerical value of Case 2 is smaller than the numerical value of Case 1 for a single μMPMU or PDC. As the amount of data units increases, the ratio between the value of Case 2 to the value of Case 1 decreases. The percentage in Figure 12a decreased from 77.57 to 64.1%, and the percentage in Figure 12b dropped from 57.6 to 55.86%, which further indicates the effectiveness of the proposed method in reducing the amount of network communication traffic.
With the time scale selected as 0.001 s, which is 1ms, more details can be observed. In order to avoid interference of the rest of the data with the result, the filter is set to display only data from the PDC’s data pipeline and command pipeline. Whether it is an application extension frame containing analog or digital quantities, its single frame length is limited, so when the data that is to be transmitted is too large, it is divided into multiple frames. Figure 13 shows this situation. At the same time, due to the data priority processing, two application extended frames containing the same type of information are not sent together, but the second frame is sent after multiple data frames are sent. The uniform transmission of the data frames is not affected.
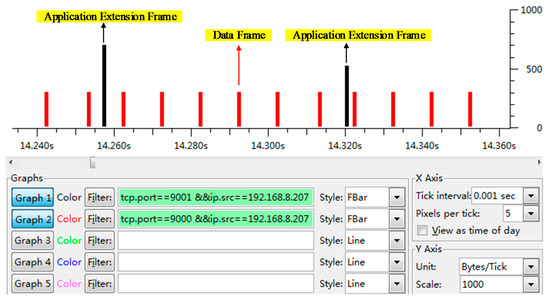
Figure 13.
Data frames and application extension frames at a 1 ms time scale level.
The test result for the remote control function is shown in Figure 14. The filter condition is the port number of the PDC command pipeline. Here, ① is a remote control selection message sent by the main station, ② is a remote control confirmation message of the PDC reply, ③ is a remote control execution message sent by the main station, and ④ is a remote control execution confirmation message of the PDC reply. The remote control process of the PDC and the PMU is the same as the above process, in which the PDC plays the role of forwarding information and mapping remote control points.
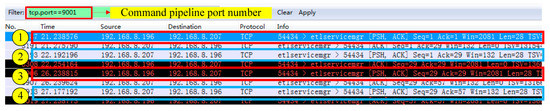
Figure 14.
Remote control process message.
According to GB/T 26865.2-2011, a dynamic data record file is generated every minute, including the CFG-1 frame and 100 data frames per second. The data unit configuration is the same as when the above traffic calculation. Consider two cases here: Case 3 shows the calculation results according to the standard protocol; Case 4 shows the calculation result using the method from this work. The analog and digital quantities are all placed in application extension frames, the period is set to 5 s, and an application extension file is generated every minute to store the application extension frames. The space occupied by the 14-day data storage in the PDC is then calculated. The result is shown in Figure 15. The abscissa is the data unit quantity, the ordinate is the 14-day storage occupation, and the unit is gigabyte (GB).
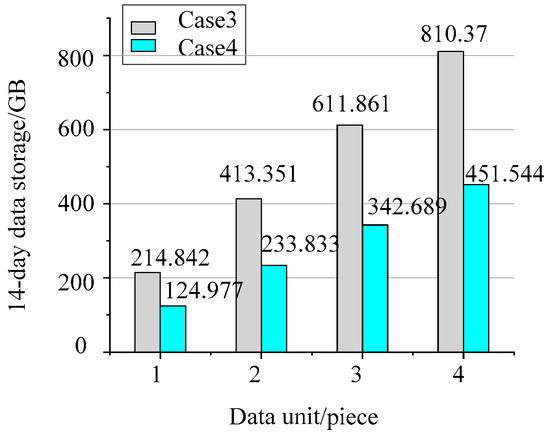
Figure 15.
Fourteen days of data storage for two cases.
It can be seen from the calculated results shown in Figure 15 that the data generated from Case 2 are always smaller than Case 1 among different data unit ranges. As the number of data units increased from 1 to 4, Case 2 decreased from 58.17% of Case 1 to 55.72%, indicating the effectiveness of the method in reducing the amount of data stored.
5.4. In Field Application
A distribution network PDC and two μMPMUs were deployed at a 35 KV substation in Pudong New Area, Shanghai. Figure 16 shows their installation and wiring. Two μMPMUs monitor different feeders respectively. The data configuration is same as the data unit above, and data such as phasor, analog quantity, switch quantity, and file are transmitted with different priorities. The effect of the on-site operation is positive, and the transmission of phasor data will not be disturbed during the progress of other tasks. The project is still ongoing and will be configured with increasing number of μMPMUs in the future.
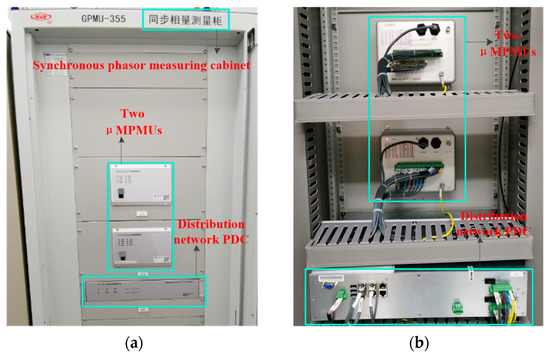
Figure 16.
Field installation diagram. (a) Front side; (b) back side wiring.
6. Conclusions
As intermittent distributed energy resources such as photovoltaic power generation are widely connected to the distribution network, the power quality, as well as the safe and reliable operation of the distribution network, face new challenges. Wide area measurement control and protection technology based on a synchronous clock is an important and effective means to solve related problems. In the distribution network, WAMS technologies are mainly used for protection and active control. The WAMS shares the communication channel with the distribution automation system. The IEC 60870-5-101/104 protocol of the distribution network SCADA is integrated into the WAMS communication protocol, thereby increasing the functionality and efficiency of the WAMS communication protocol and distribution automation systems, enhancing the ability of the traditional distribution network to absorb intermittent distributed energy resources, improving the reliability and power quality of the distribution network. The main conclusions of this paper are as follows:
- Based on the analysis of the communication requirements of the active distribution network, this paper compares the distribution network SCADA and the transmission network WAMS, and obtains the application scenarios, functions, and performance requirements of the μMPMU;
- The GB/T 26865.2-2011 and IEC 60870-5-101/104 protocols are compared. By analyzing the applicable parts of each protocol on the μMPMU, a priority-based synchronization phasor transmission protocol expansion method for active distribution networks is proposed;
- The method is based on the existing GB/T 26865.2-2011 protocol, and refers to the Application Service Data Unit (ASDU) of IEC 60870-5-101/104 to add an application extension frame, which increases file types, divides the data priority, increases communication processes, such as total summoning and remote control, and gives data flow calculation methods;
- The μMPMU multi-priority data processing model was proposed;
- The experimental environment is built using the self-developed PMU Emulator, distribution network PDC, and Main station Emulator. Some technical details of them are introduced;
- By running the standard GB/T 26865.2-2011 protocol and extended protocol, the effectiveness of the method in reducing the amount of communication data, the effectiveness of the data prioritization model and the implementation of the remote control function are verified;
- The calculation results of the file storage also indicate the effectiveness of the method in reducing the amount of stored data.
The phasor transmission protocol GB/T 26865.2-2011 and IEEE C37.118.2-2011 are Chinese standards and international standards, respectively, which have basically the same message structure and communication process. The method in this paper is easy to use for the integration of IEEE C37.118.2-2011 and IEC 60870-5-101/104 protocols, so that they can both be used in distribution network WAMS in other countries and regions. Further work of the author’s team will use compression techniques for phasor transmission and waveform file transmission, so that the distribution network WAMS can communicate more efficiently using the LTE 230MHz wireless power private network and the broadband power line carrier.
Author Contributions
The contribution of W.T. was reviewing and editing; the contribution of M.M. was writing the original draft, reviewing, and editing; the contribution of M.D. was reviewing and editing; and W.X. and C.F. contributed to finalizing this paper.
Funding
This work was funded by The National Key R&D Plan of China, grant number 2017YFB0902800.
Conflicts of Interest
The authors declare no conflict of interest.
References
- Parhizi, S.; Lotfi, H.; Khodaei, A. State of the art in research on microgrids: A review. IEEE Access 2015, 3, 890–925. [Google Scholar] [CrossRef]
- Hatziargyriou, N.; Asand, H.; Iravani, R.; Marnay, C. Microgrids. IEEE Power Energy Mag. 2007, 5, 78–94. [Google Scholar] [CrossRef]
- Morozumi, S. Microgrid demonstration projects in Japan. In Proceedings of the 2007 Power Conversion Conference—Nagoya, Nagoya, Japan, 2–5 April 2007; pp. 635–642. [Google Scholar]
- Lasseter, R.H. MicroGrids. In Proceedings of the 2002 IEEE Power Engineering Society Winter Meeting, New York, NY, USA, 27–31 January 2002; pp. 305–308. [Google Scholar]
- Barnes, M.; Kondoh, J.; Asano, H.; Oyarzabal, J. Real-world microgrids-An overview. In Proceedings of the 2007 IEEE International Conference on System of Systems Engineering, San Antonio, TX, USA, 16–18 April 2007; pp. 1–8. [Google Scholar]
- Tang, X.S.; Qi, Z.P. Energy storage technologies and control methods of microgrid: A survey. Acta Energ. Sol. Sin. 2012, 33, 517–524. [Google Scholar]
- Samuelsson, O.; Repo, S.; Jessler, R. Active distribution network-Demonstration project ADINE. In Proceedings of the 2010 IEEE PES Innovative Smart Grid Technologies Conference Europe, Gothenberg, Sweden, 11–13 October 2010; pp. 1–8. [Google Scholar]
- Zhao, B.; Wang, C.S.; Zhou, J.H. Present and future development trend of active distribution network. Autom. Electr. Power Syst. 2014, 38, 125–135. [Google Scholar]
- Trebolle, D.; Hallberg, P.; Lorenz, G. Active distribution system management. In Proceedings of the 22nd International Conference and Exhibition on Electricity Distribution, Stockholm, Sweden, 10–13 June 2013; pp. 1–4. [Google Scholar]
- De La Ree, J.; Centeno, V.; Thorp, J.S.; Phadke, A.G. Synchronized phasor measurement applications in power systems. IEEE Trans. Smart Grid 2010, 1, 20–27. [Google Scholar] [CrossRef]
- Aminifar, F.; Fotuhi-Firuzabad, M.; Safdarian, A.; Davoudi, A. Synchrophasor measurement technology in power systems: Panorama and state-of-the-art. IEEE Access 2014, 2, 1607–1628. [Google Scholar] [CrossRef]
- Sexauer, J.; Javanbakht, P.; Mohagheghi, S. Phasor measurement units for the distribution grid: Necessity and benefits. In Proceedings of the 2013 IEEE PES Innovative Smart Grid Technologies Conference, Washington, DC, USA, 24–27 February 2013; pp. 1–6. [Google Scholar]
- Sánchez-Ayala, G.; Agüerc, J.R.; Elizondo, D. Current trends on applications of PMUs in distribution systems. In Proceedings of the 2013 IEEE PES Innovative Smart Grid Technologies Conference, Washington, DC, USA, 24–27 February 2013; pp. 1–6. [Google Scholar]
- Wache, M.; Murray, D.C. Application of synchrophasor measurements for distribution networks. In Proceedings of the 2011 IEEE Power and Energy Society General Meeting, Detroit, San Diego, CA, USA, 24–29 July 2011; pp. 1–4. [Google Scholar]
- Naumann, A.; Komarnicki, P.; Powalko, M.; Styczynski, Z.A.; Blumschein, J.; Kereit, M. Experience with PMUs in industrial distribution networks. In Proceedings of the 2010 IEEE Power and Energy Society General Meeting, Providence, RI, USA, 25–29 July 2010; pp. 1–6. [Google Scholar]
- Gurbiel, M.; Komarnicki, P.; Styczynski, Z.A.; Kereit, M.; Blumschein, J.; Buchholz, B.M. Usage of phasor measurement units for industrial applications. In Proceedings of the 2011 IEEE Power and Energy Society General Meeting, Detroit, San Diego, CA, USA, 24–29 July 2011; pp. 1–5. [Google Scholar]
- Xu, L.; Zhao, J.; Chen, Z. Adaptive communication resource allocation for wide area measurement system. In Proceedings of the 5th International Conference on Electric Utility Deregulation and Restructuring and Power Technologies, Changsha, China, 26–29 November 2015; pp. 1554–1558. [Google Scholar]
- Zhang, F.; Cheng, L.; Li, X. Application of a real-time data compression and adapted protocol technique for WAMS. IEEE Trans. Power Syst. 2015, 30, 653–662. [Google Scholar] [CrossRef]
- Shafiei, H.; Khonsari, A.; Ould-Khaoua, M. An effective countermeasure against traffic analysis attacks in wide area measurement systems. Inform. Syst. 2015, 53, 182–189. [Google Scholar] [CrossRef]
- Huang, S. Analysis on the demand for communication services in smart distribution network and communication technical scheme. Telecommun. Electr. Power Syst. 2010, 31, 10–12. [Google Scholar]
- He, Q.S.; Zeng, L.K.; Ou, Q.H. An analysis method for business sectional flow of distribution communication network. Autom. Electr. Power Syst. 2014, 38, 91–95. [Google Scholar]
- Ghosal, M.; Rao, V. Fusion of multirate measurements for nonlinear dynamic state estimation of the power systems. IEEE Trans. Smart Grid 2017, 10, 216–226. [Google Scholar] [CrossRef]
- Mao, A.J.; Guo, Z.Z. A practical placement of PMU in WAMS complemental to SCADA and data processing method. Power Syst. Technol. 2005, 29, 71–74. [Google Scholar]
- Liu, K.; Li, Y.Y. Study on solutions for active distribution grid protection. Proc. Chin. Soc. Electr. Eng. (CSEE) 2014, 34, 2584–2590. [Google Scholar]
- Wu, Z.J.; Xu, J.J.; Yu, X.H. Review on state estimation technique of active distribution network. Autom. Electr. Power Syst. 2017, 41, 182–191. [Google Scholar]
- Ma, M.Y.; Fang, C.; Ling, P.; Ling, P.; Liu, J.S.; Tao, W.Q. Discussion and reflection on the application of IEEE C37.118.2-2011 standard in distribution grids. In Proceedings of the 2nd IEEE Advanced Information Management, Communicates, Electronic and Automation Control Conference, Xi’an, China, 25–27 May 2018; pp. 1072–1076. [Google Scholar]
- Wang, M.H.; Qi, X.; Niu, S.Q.; Han, F.K. Online Estimation of Transformer Parameters Based on PMU Measurements. Autom. Electr. Power Syst. 2011, 35, 61–65. [Google Scholar]
- International Electrotechnical Commission. Telecontrol Equipment and Systems Part 5-101—Transmission Protocolsl—Companion Standard for Basic telecontrol Task; International Electrotechnical Commission: Geneve, Switzerland, 2003. [Google Scholar]
- International Electrotechnical Commission. Telecontrol Equipment and Systems Part 5-104—Transmission Protocols—Network Access for IEC 60870-5-101 Using Standard Transport Profiles; International Electrotechnical Commission: Geneve, Switzerland, 2006. [Google Scholar]
- Field Test Asia Pte Ltd. GB/T26865.2-2011 Real-Time Dynamic Monitoring Systems of Power System-Part 2: Protocols for Data Transferring; Field Test Asia Pte Ltd.: Singapore, 2011. [Google Scholar]
- Tao, W.Q.; Dou, K.M.; Liu, J.S.; Ling, P. Comparison of IEEE C37.118.2-2011 Standard and GB/T 26865.2-2011 Standard Based on Synchrophasor Data Transfer. In Proceedings of the 2017 IEEE Conference on Energy Internet and Energy System Integration, Beijing, China, 26–28 November 2017; pp. 2399–2403. [Google Scholar]
- IEEE Standard C37.118-2011.2. IEEE Standard for Synchrophasors Data Transfer for Power System; IEEE: Piscataway, NJ, USA, 2011. [Google Scholar]
- Li, D.L.; Li, R.; Sun, Y.Z. Data compatibility analysis of WAMS/SCADA hybrid measurements state estimation. Proc. CSEE 2010, 30, 60–66. [Google Scholar]
- Zhong, Q.; Zhang, W.F.; Zhou, J.W. Hierarchical and distributed control strategy for active distribution network & its implementation. Power Syst. Technol. 2015, 39, 1511–1517. [Google Scholar]
© 2019 by the authors. Licensee MDPI, Basel, Switzerland. This article is an open access article distributed under the terms and conditions of the Creative Commons Attribution (CC BY) license (http://creativecommons.org/licenses/by/4.0/).