Abstract
Maritime accidents remain a significant concern for the shipping industry, despite recent technological developments. In the Republic of Korea, the leading cause of maritime accidents is navigator error, particularly in collisions and groundings; this cause has led to 79% of maritime accidents, according to a recent assessment. The reduction of navigator error is crucial for accident prevention; however, the lack of objective measures to monitor navigator error remains a challenge. The purpose of this study was to develop an objective classification of navigation behaviors in a simulated environment. The statistical model of classification of lookout activity was developed by collecting participants’ lookout behavior using a Kinect sensor within a given scenario. This classification model was validated in non-scenario experiments. The results showed that seven standard lookout activities during a lookout routine were accurately classified in both the model development and validation phases. The proposed model classification of lookout activity using an optical sensor is expected to provide a better understanding of how navigators behave to help prevent maritime accidents in practice.
1. Introduction
As global trade has grown in recent decades, the shipping industry has grown dramatically in response. Safety requirements have become increasingly important [1]. To ensure the safety of maritime transportation, scientific measures should be taken to respond to and prevent the various types of maritime accidents instead of putting ambiguous anticipations of possible human errors into place [2,3,4]. Navigator error was involved in 79% of accidents in the Republic of Korea over the past five years, based on a recent assessment [5]. Moreover, inappropriate behaviors accounted for 49% of all maritime accidents [6]. Although the majority of maritime accidents were directly related to navigator error, evidence of the navigator error has not yet been explored objectively [7]. Most existing assessments of navigators’ lookout behaviors have depended on indirect data-collection methods such as diaries, surveys, and questionnaires [8,9,10]. Harma et al. used self-reported diaries and questionnaires to investigate the situational awareness of navigators related to lookout activity patterns [11]. The use of such indirect approaches remains a subjective limitation for the accurate monitoring of the lookout behavior of navigators during navigation. This limitation could be addressed using more objective data-collection measures for navigator behavior, such as eye trackers and optical sensors. Lutzhoft and Dukic conducted eye tracker-based research to investigate the association between the allocation of navigational equipment and navigation safety in the simulated environment [12]. Moreover, the eye tracker was also utilized to evaluate the navigational workload and concentration in the given navigational environment [13,14]. However, there is still a lack of investigation into navigators’ physical behavior to measure lookout activity patterns. The purpose of this study was to establish a classification model for lookout behaviors using the Kinect sensor in a simulated navigation environment.
The proposed sensor-based lookout activity classification model was employed with 27 senior cadets at a maritime university in the Republic of Korea. In the standard navigation scenario, participants performed seven standard lookout activities in navigation simulation. The infra-red images collected by the Kinect system were then utilized to develop a machine-learning activity classification model, which was validated in a non-scenario navigation experiment that used direct observation as ground truth. The two main contributions of this study are a scientific research framework for the investigation of the navigator error and objective evidence of how navigators physically performed navigational lookout.
2. Materials and Methods
The research framework of this study is presented in Figure 1. In the model development phase (the left part of Figure 1), Kinect image data were obtained during scenario-based navigation experiment; then, feature extraction and selection were performed to obtain statistically significant feature subsets of human movement. In the model-validation phase (the right part of Figure 1), additional non-scenario navigation experiments were performed with direct observation to record true activity. A directly observed lookout activity record was used to validate the activity classification model that was developed in the previous step.
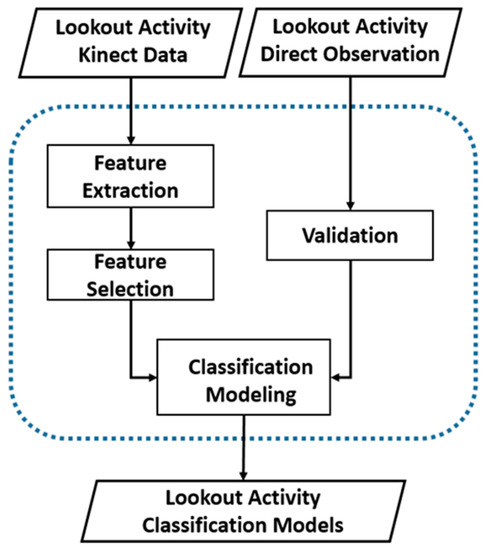
Figure 1.
Research framework for the development of lookout-activity classification models.
2.1. Data Collection
2.1.1. Experiment Configuration
Data were collected in the full-mission-ship-handling simulator at Mokpo National Maritime University. The Microsoft Kinect sensor is a promising human-movement registration system (Xbox On, Microsoft); it uses a wide-angle time-of-flight camera to read the environment. The Kinect system was launched in combination with a software development kit for use with 3D human-posture recognition. The Kinect sensor has been validated with the use of an impressively large training dataset of compared-depth data for accurate recognition of movement [15,16]. Kinect has an increased field of view that can detect movement up to 4 meters away. In skeletal tracking, a human body is represented in the system by a number of joints corresponding to body parts, including the head, trunk, and limbs. As illustrated in Figure 2, each joint is represented by its 3D coordinates [17,18,19,20]. The sampling frequency of kinematic images was 30 Hz. Figure 3 exhibits the experimental setting of the Kinect sensor in the full-mission ship-handing simulator room. The Kinect sensor was located in the left corner of the simulation room to record the full body kinematics of each navigator during experiments. The sensor for Windows Software Development Kit 2.0 was provided by Microsoft, and the list and locations of 25 body points are indicated in Table 1 and Figure 4. Lookout behavior features using body-joint kinematic data were computed with custom software developed using MATLAB 9.0 (Mathworks, Natick, MA, USA).
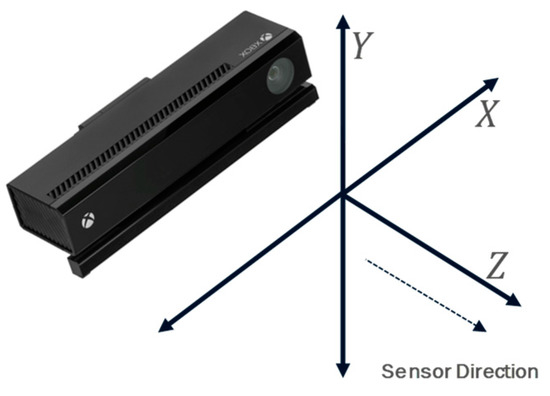
Figure 2.
Experimental configuration with the Kinect infra-red (IR) camera system in the full mission-ship-handling simulation environment.
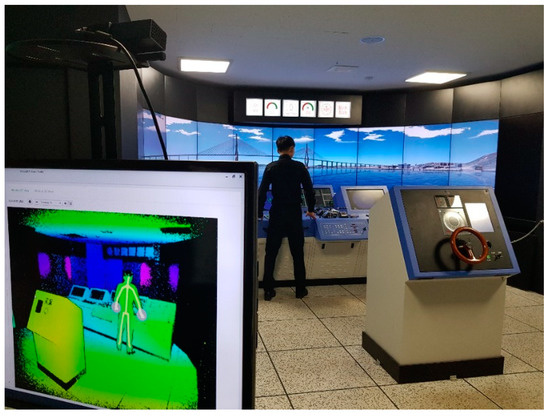
Figure 3.
Experimental configuration with the Kinect IR camera system in the full mission-ship-handling simulation environment.

Table 1.
List of lookout movement features.
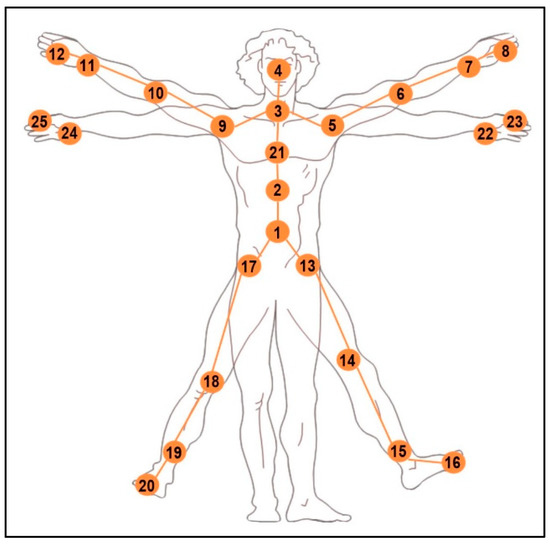
Figure 4.
Anatomical locations of the 25 tracked joints.
2.1.2. Experiment Protocol
During the model development phase, 24 senior cadets (174.3 ± 8.4 cm, 67.3 ± 11.7 kg, 23.2 ± 1.8 years) at Mokpo National Maritime University participated in the study (Table 2). All participants completed a year-long onboard navigation training and performed scenario-based lookout activities, including the seven standard lookout activities in Table 3 and four sample lookout activities in Figure 5.
Table 2.
Participant characteristics.
Table 3.
Standard lookout activities scenario.
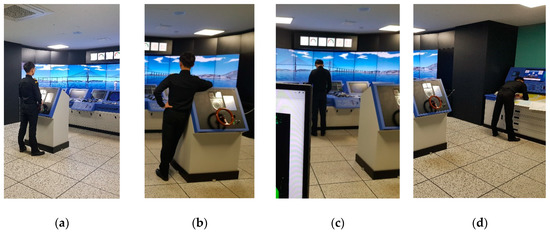
Figure 5.
Examples of lookout activities: (a) standing lookout, (b) leaning lookout, (c) radar lookout, and (d) writing.
During the model-validation phase, the classification models developed in the previous phase were validated through a comparison of predicted outcomes of lookout activity with records of directly observed lookout activity. The non-scenario navigation experiments of the additional two participants were directly observed by trained observers and recorded with a video camera for cross-validation. Every five seconds, the direct observer recorded a representative lookout activity for the interval; the record of direct observation was also double-checked through a comparison of the video record to avoid observers’ mistakes.
2.2. Data Analysis
2.2.1. Feature Extraction
The extraction of the features of the movement of the navigators is presented here. Although a non-feature extraction learning method, such as deep learning, might perform better for classifying lookout behavior, the features of the lookout movements were extracted and prioritized to allow a closer understanding of how a navigator physically performs navigational lookout. The features of lookout movement were organized using 25 kinematic parameters of joints obtained from the Kinect, and the raw kinematic data were included in five-second intervals. In this study, we focused on the joint kinematic features that could be used to recognize different lookout activities. The identification of features of lookout movements is important because the identified features should be closely considered to determine whether the quality of a lookout is positive. To determine the efficient movements, all 25 joint kinematic parameters were extracted as shown in Table 4.
Table 4.
Navigator movement feature properties.
2.2.2. Classification Model Development
To more easily interpret the classification model, linear machine-learning algorithms were used, including the decision-tree, support-vector machine, and K-nearest-neighbor (KNN) algorithms. After the three machine-learning algorithms were compared, the KNN was finally selected to create classification statistics because KNN provides better interpretability while yielding a similar degree of accuracy of lookout classification.
Moreover, to create a better understanding of efficient classifiers of lookout movements, the 25 movement features were categorized into three groups (trunk, upper limbs, and lower limbs). This provided information on the duplication and irrelevance of the selected kinematic features of the joints. The process allowed us to reduce the various information among the twenty-five kinematic features of joints. Additionally, no method of parameter tuning, such as principal component analysis, was used, although these could have increased the classificatory power. This is because the tuned kinematic features of joints provide less information on precisely which specific joint kinematic features are important.
2.2.3. Validation
In feature selection, the subsets of the 25 joint kinematic features were carefully selected to avoid any overfitting of the proposed classification model. Preprocessing of the statistical data helped us to avoid overfitting the classification model, using non-overlapping features with multiple input features. Additionally, we applied 10-fold cross-validation [21] to improve the validity of the proposed model. In the cross-validation, 24 subjects were allocated to ten subfolders; one of these ten was used to test the model. The remaining subfolders were used to train the model. The procedure was intended to develop a robust model for lookout activity classification that could describe an unseen navigator’s lookout behavior. Finally, the validated model for lookout activity classification was validated using directly observed record of lookout activity. The non-scenario navigation experiments of the three additional participants were directly observed by trained observers and recorded with a video camera for cross-validation. Every five seconds, the direct observer recorded a representative lookout activity that took place in that interval; the record of direct observation was also double-checked with a comparison of a video recording to check for observation error.
3. Results
3.1. Lookout Classifications
In total, 94.9% classification accuracy was achieved for the seven standard lookout activities described with the 25 lookout movement features. Writing, walking, and sitting lookout activity classifications were promising, whereas standing and leaning resulted in relatively higher confusion. Moreover, standing and sitting were also confused because the Kinect sensor tracked the lower-limb joint features unreliably during sitting. This is because the trunk and upper limbs during the two activities are similar. Additionally, writing featured a distinctive pattern, particularly in the trunk and upper limbs, so the activity was correctly classified from other behaviors. The overall classification results using all 25 movement features are shown in Table 5.
Table 5.
Confusion matrix for seven standard lookout classification model using the K-nearest-neighbor (KNN) algorithm.
3.2. Categorical Lookout Classification Sensitivity
To determine the efficiency of the classification of lookout activities based on the movement feature categories, the 25 movement features were grouped into the following groups: trunk, upper limbs, and lower limbs. When the selected lookout movement features for each group were given to classify the same training data, the results of classification provided a rationale determining the efficiency for each group of movement features. As shown in Figure 6, there was an 87.1% accuracy in the classification of lookout activities using the trunk features, including base of the spine, mid-spine, neck, head, left hip, right hip, and shoulder-height spine; the determination of the 12 upper-limb features had a 77.1% accuracy. The six lower-limb features (i.e., left knee, left ankle, left foot, right knee, right ankle, and right foot) had the lowest classification accuracy, at 56.9%.
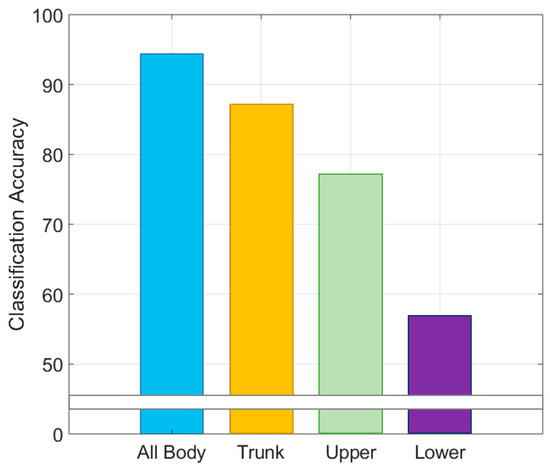
Figure 6.
Comparison of classification accuracies based using categorical lookout-activity classification accuracy.
3.3. Non-Scenario Validation
In non-scenario-based lookout experiments, two additionally recruited participants acted as a free lookout, in the sense that they were not told what specific lookout activities they were intended to accomplish, apart from maintaining safe navigation. The patterns of lookout activity of the participant were directly observed and recorded every five seconds. This pattern allowed the seven standard lookout activities to be recognized in the non-scenario-based experiment. As a result, the results of the classification of lookout activities were promising. As shown in Figure 7, there was a 95.2% accuracy in the classification of lookout activities using the proposed lookout activity classification model, including 6 misclassified activities in validation experiment 1 and 4 misclassified activities in experiment 2.
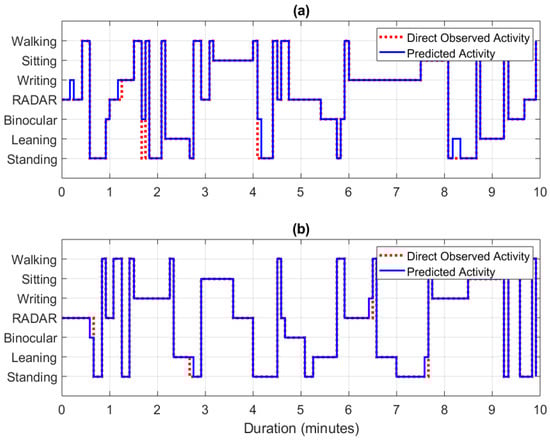
Figure 7.
Validation of results of lookout activity classification using direct observation: (a) validation experiment 1, (b) validation experiment 2.
4. Discussion
This study was undertaken to develop a classification model for standard lookout activities using data from the Kinect sensor in a simulated navigation environment. The approach was intended to address the limitations of the common indirect approaches to the issue of navigator assessment. This study demonstrated the efficacy of a proposed novel method using an optical sensor system to address the limitations of other methods. Distinct from previous studies, which used aggregated patterns of lookout behaviors, this model precisely measured specific lookout activities performed for navigation practice. Moreover, the study compared the efficiency of different features of movement by categorizing the locations of the features of the body. The categories of lookout movements, trunk motions, and movements of the upper limbs should be used to monitor navigators’ lookout patterns. Finally, validating the prediction model in non-scenario-based navigation indicated that it can be expected to be feasible for a real navigation environment. Nevertheless, the conditions of a real navigation environment should be considered in future research. For example, multiple navigators, such as a duty officer and a quartermaster acting as a navigation team, could perform navigation, meaning that a future study undertaken to track multiple objects at once should be implemented.
5. Conclusions
The results of the proposed classification of lookout activity showed that the optical sensor-based classification of navigator behavior can be used to accurately indicate the precise nature of such behavior during ship navigation. The proposed model can be expected to produce a better understanding of how a navigator behaves during ship navigation and to apply research into human error patterns that can prevent navigational accidents by showing harmful navigation routines or patterns of a navigator. Future work will examine the association between navigators’ patterns and maritime accidents to prevent maritime accidents by precisely anticipating possible navigator error.
Author Contributions
Conceptualization, I.Y.; methodology, D.P.; software, I.Y.; validation, D.P. and J.Y.; data curation, D.P.; writing—original draft preparation, I.Y.; writing—review and editing, D.P. and J.Y.; supervision and funding acquisition, J.Y.
Funding
The contents of this paper are the results of the research project of the Ministry of Oceans and Fisheries of Korea (A fundamental research on maritime accident prevention—phase 2).
Conflicts of Interest
The authors declare no conflict of interest.
References
- Akhtar, M.J.; Utne, I.B. Human fatigue’s effect on the risk of maritime groundings—A Bayesian Network modeling approach. Saf. Sci. 2014, 62, 427–440. [Google Scholar] [CrossRef]
- Reason, J. Human error: Models and management. BMJ 2000, 320, 768–770. [Google Scholar] [CrossRef] [PubMed]
- Cacciabue, P.C. Human error risk management for engineering systems: A methodology for design, safety assessment, accident investigation and training. Reliab. Eng. Syst. Saf. 2004, 83, 229–240. [Google Scholar] [CrossRef]
- Lin, B. Behavior of ship officers in maneuvering to prevent a collision. J. Mar. Sci. Technol. 2006, 14, 225–230. [Google Scholar]
- Rip, A. Constructive technology assessment. In Futures of Science and Technology in Society; Springer VS: Wiesbaden, Germany, 2018; pp. 97–114. ISBN 978-3-658-21754-9. [Google Scholar]
- Branch, M.A.I.; House, C.; Place, C. Bridge Watchkeeping Safety Study; Department for Transportation, Marine Accident Investigation Branch: Southampton, UK, 2004; Volume 28.
- Corporate, A.G. Safety and Shipping Review; Allianz Global Corporate and Specialty: Hong Kong, China, 2017. [Google Scholar]
- Chauvin, C.; Lardjane, S.; Morel, G.; Clostermann, J.P.; Langard, B. Human and organisational factors in maritime accidents: Analysis of collisions at sea using the HFACS. Accid. Anal. Prev. 2013, 59, 26–37. [Google Scholar] [CrossRef] [PubMed]
- Murai, K.; Hayashi, Y.; Stone, L.C.; Inokuchi, S. Basic evaluation of performance of bridge resource teams involved in on-board smart education: Lookout pattern. In Review of the Faculty of Maritime Sciences; Kobe University: Kobe, Japan, 2006; Volume 3, pp. 77–83. [Google Scholar]
- Mohovic, D.; Mohovic, R.; Baric, M. Deficiencies in Learning COLREGs and New Teaching Methodology for Nautical Engineering Students and Seafarers in Lifelong Learning Programs. J. Navig. 2016, 69, 765–776. [Google Scholar] [CrossRef]
- Härmä, M.; Partinen, M.; Repo, R.; Sorsa, M.; Siivonen, P. Effects of 6/6 and 4/8 watch systems on sleepiness among bridge officers. Chronobiol. Int. 2008, 25, 413–423. [Google Scholar] [CrossRef] [PubMed]
- Lützhöft, M.; Dukic, T. Show me where you look and I’ll tell you if you’re safe: Eye tracking of maritime watchkeepers. In Proceedings of the 39th Nordic Ergonomics Society Conference, Lysekil, Sweden, 1–3 October 2007; pp. 75–78. [Google Scholar]
- Bjørneseth, F.B.; Renganayagalu, S.K.; Dunlop, M.D.; Homecker, E.; Komandur, S. Towards an experimental design framework for evaluation of dynamic workload and situational awareness in safety critical maritime settings. In Proceedings of the 26th Annual BCS Interaction Specialist Group Conference on People and Computers, Birmingham, UK, 12–14 September 2012; pp. 309–314. [Google Scholar]
- Di Nocera, F.; Mastrangelo, S.; Colonna, S.P.; Steinhage, A.; Baldauf, M.; Kataria, A. Mental workload assessment using eye-tracking glasses in a simulated maritime scenario. In Proceedings of the Human Factors and Ergonomics Society Europe, Groningen, The Netherlands, 14–16 October 2015. [Google Scholar]
- Pagliari, D.; Pinto, L. Calibration of kinect for xbox one and comparison between the two generations of microsoft sensors. Sensors 2015, 15, 27569–27589. [Google Scholar] [CrossRef] [PubMed]
- Mentiplay, B.F.; Perraton, L.G.; Bower, K.J.; Pua, Y.H.; McGaw, R.; Heywood, S.; Clark, R.A. Gait assessment using the Microsoft Xbox One Kinect: Concurrent validity and inter-day reliability of spatiotemporal and kinematic variables. J. Biomech. 2015, 48, 2166–2170. [Google Scholar] [CrossRef] [PubMed]
- Clark, R.A.; Bower, K.J.; Mentiplay, B.F.; Paterson, K.; Pua, Y.H. Concurrent validity of the Microsoft Kinect for assessment of spatiotemporal gait variables. J. Biomech. 2013, 46, 2722–2725. [Google Scholar] [CrossRef] [PubMed]
- Shotton, J.; Fitzgibbon, A.; Cook, M.; Sharp, T.; Finocchio, M.; Moore, R.; Kipman, A.; Blake, A. Real-time human pose recognition in parts from single depth images. In Proceedings of the 24th IEEE Conference on Computer Vision and Pattern Recognition (CVPR 2011), Springs, CO, USA, 20–25 June 2011. [Google Scholar]
- Jalal, A.; Sarif, N.; Kim, J.T.; Kim, T.S. Human activity recognition via recognized body parts of human depth silhouettes for residents monitoring services at smart home. Indoor Built Environ. 2013, 22, 271–279. [Google Scholar] [CrossRef]
- Zhang, Z. Microsoft kinect sensor and its effect. IEEE Trans. Multimedia 2012, 19, 4–10. [Google Scholar] [CrossRef]
- Gaglio, S.; Re, G.L.; Morana, M. Human Activity Recognition Process Using 3-D Posture Data. IEEE Trans. Hum. Mach. Syst. 2015, 45, 586–597. [Google Scholar] [CrossRef]
© 2018 by the authors. Licensee MDPI, Basel, Switzerland. This article is an open access article distributed under the terms and conditions of the Creative Commons Attribution (CC BY) license (http://creativecommons.org/licenses/by/4.0/).